 Caroline Martel
 Michel Pichavant
 Hélène Balcone-Boissard
 Georges Boudon
94% of researchers rate our articles as excellent or good
Learn more about the work of our research integrity team to safeguard the quality of each article we publish.
Find out more
ORIGINAL RESEARCH article
Front. Earth Sci., 19 November 2021
Sec. Volcanology
Volume 9 - 2021 | https://doi.org/10.3389/feart.2021.686342
This article is part of the Research TopicPre- and Syn-Eruptive Conditions in Volcanic SystemsView all 9 articles
A prerequisite in refining volcanic hazard at explosive volcanoes is a better quantification of the timescales of the syn-eruptive processes, such as magma degassing and crystallization prior to eruption. To this aim, new data on the matrices (microlites, residual glasses, and bubbles) of pumice, scoria, and dense clasts erupted during the AD 1530 andesitic eruption of La Soufrière of Guadeloupe are combined with published data from phase-equilibrium and kinetic experiments, in order to estimate pressures of microlite crystallization and magma ascent rates. From the timescale data, we infer that the AD 1530 eruption started with phreatomagmatic explosions tapping magmas that ascended during about 1 month (decompression rate of ∼50 Pa/s) from the coldest parts of the reservoir (∼825°C and a 74 wt% SiO2 melt). These magmas continuously crystallized microlites (∼25 vol% plagioclase, orthopyroxene, clinopyroxene, magnetite, quartz, and apatite), but did not outgas likely due to sealed conduit margins. The flank collapse (preexisting “cold” edifice) that followed the phreatomagmatic phase triggered a sub-Plinian eruption that progressively tapped the hotter main reservoir (∼875°C and 71 wt% SiO2 interstitial melt), emitting banded and homogeneous pumice. The banded pumice did not significantly outgas and mostly lack decompression-induced microlites, suggesting short ascent durations of the order of 0.5–1 day (decompression rates of 1,400–4,000 Pa/s). The following Strombolian phase emitted dark scoria that did not significantly outgas and only crystallized rare microlites, suggesting ascent duration of the order of 2 days (decompression rates of ∼550 Pa/s). The terminal lava dome growth involved fully outgassed magmas ascended during more than 1 month, giving time for microlite crystallization (∼40 vol% plagioclase, orthopyroxene, clinopyroxene, magnetite, and cristobalite). The detection of any shallow new magmatic intrusion is crucial, since it can trigger a sequence of conduit processes leading to an eruption marked by a succession of different and disastrous eruptive styles, following a scenario similar to the AD 1530 eruption. Overall, we provide a combined approach of petrological, geochemical, and experimental data that may be used to infer ascent conditions and rates at other volcanic systems.
Subduction-arc volcanoes are highly hazardous because they commonly alternate effusive with explosive eruptions, and magmatic with non-magmatic (phreatic) activity. In the Lesser Antilles arc, the historical volcanic crises had major societal and economic impacts: the sadly notorious 1902 dome-forming eruption of Montagne Pelée (Martinique) killed 30,000 persons and devastated the town of Saint Pierre (Lacroix, 1904), the 1976 explosive phreatic event of La Soufrière (Guadeloupe) led to a controversial evacuation of 73,000 inhabitants from the surrounding areas (Hincks et al., 2014), and the 1995 on-going eruption of Soufrière Hills (Montserrat) has been responsible for the relocation of nine-tenths of the island inhabitants and brought a severe socio-economic crisis (Hicks and Few, 2015). These crisis situations are partly ascribable to our failure to forecast the date and the type of the eruption, mainly coming from the difficulty to unequivocally identify precursory signals of impending eruption in slow-moving viscous magmas. Recent studies on felsic magmas have proposed timescales between the last magmatic recharge/mixing in the reservoir and the eruption (e.g., Metcalfe et al., 2021; Ostorero et al., 2021), which could be a step forward in hazard assessment, should this last deep magmatic injection be detected. However, from the study of four magmatic eruptions of La Soufrière (but not the AD 1530 eruption), including Plinian, Vulcanian, and Strombolian eruptive styles, Metcalfe et al. (2021) deduced that the recharge-to-eruption timescales were not related to the eruption style. This highlights the need to decouple the timescales of the magmatic processes in the reservoir from the timescales of the ascent processes in the volcanic conduit, when aiming at investigating the relationships between the syn-eruptive processes and the eruption style.
The processes controlling eruptive dynamics mostly take place in the volcanic conduit during magma ascent. It has been demonstrated that the eruption dynamic directly depends on the syn-eruptive degassing process: overpressurized gas bubbles trapped in the magma favor explosive eruptions, whereas gas permeability development and outgassing (through permeable or fractured conduits) allow effusive eruptions (Eichelberger et al., 1986; Jaupart and Allègre, 1991; Gonnermann and Manga, 2013). The key parameter controlling the degassing kinetics is magma ascent rate, with slow ascent rates giving time for outgassing whereas rapid ascent rates prevent gas escape (e.g., Woods and Koyaguchi, 1994). As a result, andesitic to rhyolitic magmas ascending at rates of the order of m/s may lead to highly explosive eruptions whereas those ascending at rates of the order of mm to cm/s may lead to lava dome growths (Rutherford and Gardner, 2000).
The decompression of a volatile-saturated magma forces the volatiles to exsolve (following the gas solubility laws), forming gas bubbles. Because the liquidus T of a hydrous magma generally increases with decreasing melt volatile content, ascending magmas are expected to crystallize. The strong disequilibrium that comes along with rapid changes in volatile content generates nucleation-driven crystallization, i.e., lot of small crystals designated as microlites (crystals <50–100 µm in length, as opposed to the larger crystals that grew at near-equilibrium in the reservoir and referred as phenocrysts). Based on experimental studies, microlite textures (number density, size, shape) in silicic melts have been used to back-track crystallization kinetics in natural samples (e.g., Hammer and Rutherford, 2002; Martel and Schmidt, 2003) and decompression rate-meters have been proposed from number densities of bubbles and microlites (Toramaru, 2006; Toramaru et al., 2008). This highlights that combining experimental data (from equilibrium and kinetic experiments) and natural data on sample matrices, provides valuable information on the degassing and crystallization kinetics that decipher eruptive dynamics, as demonstrated for instance for Montagne Pelée, Martinique, recent eruptions (Martel, 2012), Mount Saint Helens, United States, 1980-1986 eruption (Geschwind and Rutherford, 1995; Riker et al., 2015), Mount Unzen, Japan, 1991-1995 eruption (Cichy et al., 2011), and Rabaul, Papua New Guinea, recent eruptions (Bernard and Bouvet de Maisonneuve, 2020). Therefore, our ability to forecast future eruptions and assess hazards also relies on our ability to measure in-situ magma ascent rates (e.g., via geophysical methods) and to relate them to eruptive scenarios (established via volcanological, petrological, and numerical models).
La Soufrière of Guadeloupe is a well-monitored active volcano of the Lesser Antilles subduction arc (Figure 1A). Since its construction 0.25 Ma ago, La Soufrière has shown a large diversity of eruptive activity, alternating magmatic to non-magmatic events (Komorowski et al., 2005), which generates a multitude of eruptive scenarios making hazard assessment highly complex (Komorowski et al., 2008). The present lava dome (Figure 1B) was formed during the magmatic eruption of AD 1530. Since this eruption, a small Vulcanian eruption (Legendre, 2012) and six phreatic eruptions have occurred. Since the last phreatic eruption in 1976–1977, La Soufrière volcano has become intensively monitored with a network of pluridisciplinary methods that are implemented by the Guadeloupe Volcanological and Seismological Observatory (OVSG-IPGP). Since 1992, the OVSG has recorded a systematic and progressive increase in shallow depth low-energy seismicity and slow temperature rise of the thermal springs close to the lava dome (OVSG-IPGP website). This unrest situation has boosted studies aiming at understanding and forecasting future eruptions at La Soufrière. For instance, recent geophysical studies of the internal structure of the lava dome have warned about its instability due to the volume of hydrothermally-altered rocks and the likelihood of a future major flank collapse (Rosas-Carbajal et al., 2016). Because the last 400 years of La Soufrière activity have not involved juvenile magma, little attention has been given to magmatic eruptions. Yet, during the 1976-77 crisis, geophysical and geochemical evidence supported the emplacement of a small-volume intrusion of a viscous magma body that stopped within a few kilometers below the surface (Feuillard et al., 1983; Villemant et al., 2005, 2014; Boichu et al., 2011). This underscores the importance of integrating magmatic eruptions in future eruptive scenarios of La Soufrière. The AD 1530 eruption is currently viewed as a model for a future magmatic reactivation of the volcano (Boudon et al., 2008). Because it involved a partial flank collapse, a sub-Plinian phase (characterized by a Volcano Explosivity Index VEI of 2–3 and an unsteady sustained convective column of 9–12 km high) with pumice-and-scoria fallout and flows, lava fountaining, and a terminal lava dome growth (Boudon et al., 2008), this eruption is one of the most complex and dreaded in terms of hazard assessment (Komorowski et al., 2008; Spence et al., 2008). In the light of the present volcanic unrest, for which a magmatic origin cannot be clearly excluded, there is an urgent need of knowledge of the eruptive mechanisms that may lead to an explosive magmatic event at La Soufrière.
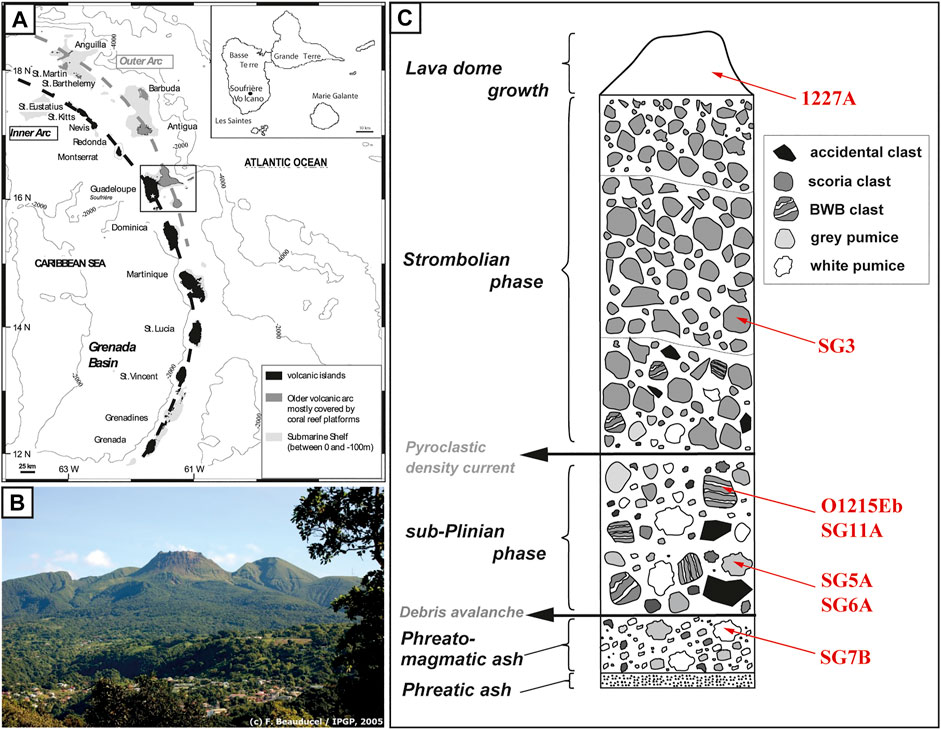
FIGURE 1. (A) Location map of the Lesser Antilles, Guadeloupe archipelago, and La Soufrière volcanic complex, after Boudon et al. (2008), (B) Photo of La Soufrière present dome and (C) Typical stratigraphy section of the AD 1530 eruption, combining the sequence deposits at the sites of the Carbet Springs and Galion River (Boudon et al., 2008), showing the origin of the studied samples (from Boudon et al., 2008; Pichavant et al., 2018).
To this aim, the present study constrains the magma ascent conditions and timescales that lead to the AD 1530 eruption of La Soufrière, by characterizing the textures and compositions of the matrix of the erupted products, and relate them to published experimental and numerical data, in order to assess the pressures (depths) of magma degassing, crystallization, and fragmentation, and the ascent durations of the magma.
The composite “Grande Découverte–La Soufrière” volcanic complex, hereafter referred as “La Soufrière” was built during three main phases: Grande Découverte (0.25 Ma–42 ka), Carmichaël (42–11.5 ka), and La Soufrière phase that started 11.5 ka ago (Boudon et al., 1988, 1989). During the ongoing La Soufrière phase, the volcanic activity was roughly centered on the area where the current Soufrière lava dome is located. A series of ten flank collapses of low volume occurred during this phase, generating debris avalanches that flowed on the southwestern flank of the volcano, where the towns of Basse Terre and Saint Claude are now settled. Most of these debris avalanche reached the sea, 10 km away from the summit (Komorowski et al., 2005; Boudon et al., 2007; Legendre, 2012). Several dome-forming and small sub-Plinian eruptions occurred during this period (Legendre, 2012), including the last magmatic AD 1530 eruption at the origin of the Soufrière lava dome (see description below). Some deposits dated to AD 1657 have been interpreted as a small explosive Vulcanian eruption (Legendre, 2012), which would be the last magmatic event of La Soufrière. The historical period is characterized by six phreatic eruptions (AD 1690, 1797–98, 1812, 1836–37, 1956, and 1976–77) taking place from fractures and vents on La Soufrière lava dome (Barabé and Jolivet, 1958; Feuillard et al., 1983; Komorowski et al., 2005). The last phreatic eruption in 1976–1977 generated an important seismic crisis, 26 phreatic explosions, and forced the evacuation of about 73,000 persons for up to 6 months (Feuillard et al., 1983; Komorowski et al., 2005).
The AD 1530 eruption represents the last major magmatic event of La Soufrière and likely the only magmatic eruption during the last 1,400 years. It was first described by Vincent et al. (1979) and Semet et al. (1981), and revised by Boudon et al. (2008). Following a small phreatic phase, the magma reached the surface and generated a phreatomagmatic explosion followed by a flank collapse of the summit part of the volcano, the debris avalanche of which flowed on the southwestern flank of the volcano and reached the sea. Subsequently to the flank collapse, the volcanic conduit was decompressed down to the magmatic chamber, leading to an explosive sub-Plinian phase emitting pumice fallout and column-collapse pyroclastic density currents channeled into valleys. The column reached a height between 9 and 12 km, producing about 3.9 × 10⁶ m3 DRE of juvenile products (Komorowski et al., 2008). The emitted products were first grey-white followed by white and black-and-white banded pumices. This event was followed by near-vent pyroclastic scoria fountains and ended with the growth of the present-day lava dome (Boudon et al., 2008).
The evolution of the magma reservoir prior to eruption was investigated by Pichavant et al. (2018), through a petrological and experimental study aiming at constraining both, the storage conditions of the resident magma and the characteristics of the intruding magma. These authors concluded that the main andesitic magma contained ∼46–60 vol% phenocrysts in equilibrium with a rhyolitic melt bearing 5.0 to 5.5 wt% H2O, and was stored at a temperature (T) of 875 ± 25°C and pressure (P) of 175 ± 20 MPa (about 7 km deep, considering a rock density of 2.4 g/cm3). These pre-eruptive H2O contents agree with the highest H2O contents of ∼5.5 wt% measured in glass inclusions trapped in plagioclase and orthopyroxene phenocrysts. There is evidence from melt inclusions and residual glasses that T was locally as cold as 825 ± 25°C. The residual glasses are indicators of mixing between the resident and intruding melts, showing strong compositional heterogeneities from 64 to >76 wt% SiO2.
Based on the wide compositional range of whole rocks and textural plus mineralogical evidence, Semet et al. (1981) first proposed that La Soufrière andesitic reservoir was remobilized by the intrusion of a deep mafic magma, with an about 40–60% proportion of arrival on resident magma. Pichavant et al. (2018) experimentally constrained the end-member magma composition to ∼50 wt% SiO2 for the basaltic intrusion and 62 wt% SiO2 for the resident andesite. Although long timescales of reservoir replenishment of about 35 ka have been proposed using U-Th-Ra disequilibria methods (Touboul et al., 2007), Pichavant et al. (2018) highlighted much shorter timescales of the order of tens of hours, based on diffusion modelling in orthopyroxenes (following the method given in Solaro et al., 2020).
In order to reconstruct the ascent-crystallization paths of the magmas in the AD 1530 sequence, one needs to infer the chemical composition of the melt from which the microlites crystallized. Ideally, this parental melt is the one in chemical equilibrium with the phenocryst rims in the storage region prior to magma ascent, and may be preserved as glass inclusions in these crystals. Yet, eruptions are often triggered by an intruding more mafic magma, whose melt mixes with the resident one, so that the melt from which microlites crystallize upon ascent may be more mafic than expected from the initial resident melt. Using the AD 1530 fused whole rocks as starting material (i.e., chemically including any late injection of mafic melt), the composition of the pre-eruptive interstitial melt was determined to be 71 ± 1 wt% SiO2 from the phase-equilibrium experiments (Pichavant et al., 2018). Yet, the glass inclusions trapped in phenocrysts of plagioclase and orthopyroxene suggest melt SiO2 contents of 74 ± 1 wt% (recalculated on anhydrous basis; Pichavant et al., 2018). Therefore, melts parental to microlites could span a SiO2 range from ∼71 to ∼74 wt%, after and before mafic melt injection, respectively. As for the P-T conditions of ascent crystallization, it is commonly accepted that decompression-induced microlites crystallize nearly isothermally, that is, for the AD 1530 eruption, at pre-eruptive T of ∼875 or 825°C and P lower than the pre-eruptive P of 175 MPa.
The studied samples come from the lava dome (Figure 1B) and the deposit sequences of the Carbet Springs O1215 site and Galion River site (Boudon et al., 2008). Both deposit sequences have been combined to provide a typical sequence for the AD 1530 deposits (Figure 1C). The samples encompass: three white pumice clasts, including SG7B from the phreatomagmatic unit and SG5A and SG6A from the base of the sub-Plinian unit; two banded pumice samples from the upper part of the sub-Plinian unit: SG11A, in which SG11A_white and SG11A_dark refer to the white and dark layer, respectively, and O1215Eb that represents the white layer of a banded pumice; one dark scoria (SG3) from the Strombolian phase, and a dense block from the AD 1530 lava dome (1227A). The upper sub-Plinian O1215Eb pumice and the 1227A dome clast were sampled by Boudon et al. (2008). The Strombolian SG3 dark scoria, the lower sub-Plinian SG5A and SG6A pumice samples, the phreatomagmatic SG7B pumice, and the upper sub-Plinian SG11A pumice were sampled by Pichavant et al. (2018). These samples are basaltic andesites to andesites, with bulk-rock 56.1 to 61.7 wt% SiO2, 2.7 to 4.2 wt% MgO, and 3.4 to 4.3 wt% alkalis (Boudon et al., 2008; Pichavant et al., 2018).
The petrological studies were conducted on thin sections made from the samples, using a scanning electron microscopy (SEM; Merlin Compact ZEISS at ISTO). They served first to identify glass areas and microlite phases favorable to chemical analysis and, second, to select representative zones for the textural analysis of the matrices.
Crystal and glass chemistries were obtained using either an electron microprobe (EMP; Cameca SX Five at ISTO) or by energy dispersive spectroscopy (EDS; Bruker Quantax XFlash6 30 mm2) on the SEM. The glass H2O contents were measured using either the EMP following a modified “by-difference” method or a Secondary Ion Mass Spectrometer (SIMS; IMS 1280 HR2 spectrometer at the Centre de Recherches Pétrographiques et Géochimiques, CRPG, Nancy). The analytical conditions for these techniques are detailed in Supplementary Material. Importantly for the present study is that the CO2 contents are below 50 ppm in the residual glasses and mostly below 250 ppm in the glass inclusions. Therefore, we disregarded CO2 as a component of the fluid phase and we considered a pure H2O fluid composition.
Silica polymorphs (quartz and cristobalite) were identified by Raman spectroscopy (Renishaw InVia spectrometer at a wavelength of 514 nm and a maximum power of 100 mW; BRGM-ISTO), following the method described in Martel et al. (2021).
Selected SEM images were processed using the SPO software (Launeau and Robin, 1996), following the method described in Martel and Poussineau (2007). The selected images were only matrix (glass, microlites, and bubbles), i.e., avoiding phenocrysts. Bubble area percentage (Φb), plagioclase microlite area percentage (ΦPlag), and area number density of plagioclase microlites (NA) were determined as follows:
Φb = (bubble area/matrix area) x 100; note that Φb was measured on SEM images nesting scales from about 200 × 300 μm to 1,000 × 2000 µm for each sample, which may be slightly underestimated compared to bulk vesicularities performed at macroscopic scale, due to presence of possible fractures or larger bubbles.
ΦPlag = (plagioclase microlite area/bubble-free matrix area) x 100.
NA = number of plagioclase microlites/bubble-free matrix area.
The H2O content of residual glasses can be used to estimate the P at which the magma was quenched, using H2O solubility models and neglecting post-quenching alteration processes, such as re- or dehydration of the glasses. The quench P were calculated using the rhyolite solubility model of Newman and Lowenstern (2002) at T of 875 and 825°C (experimentally-determined main pre-eruptive T and coldest pre-eruptive T of the AD 1530 magma, respectively; Pichavant et al., 2018).
Quench P may also be back-calculated from the gas fraction equation of Jaupart and Allègre (1991), which calculates the gas volume fraction (α) resulting from isothermal degassing of a H2O-saturated melt from initial to final (quench) P, assuming a closed-system degassing (in that gas bubbles remain in contact with the melt). Back-calculating the quench P implies that the gas fraction becomes the vesicularity measured in the natural samples (Φb/100) and that the H2O content of the residual melt follows a solubility law for silicic melts. The details of the calculation are given in Supplementary Material.
Because plagioclase composition is highly sensitive to melt H2O content, natural microlites can give information about the H2O content of the melt from which they crystallize and, by inference, on their crystallization P assuming melt H2O saturation and unaltered melt composition due to other processes. This approach requires experimental calibrations of plagioclase composition for melt and P-T conditions appropriate to the case study. It is also possible to use experiments to calibrate the plagioclase fraction and the residual melt SiO2 content as a function of the P-T conditions. The selection of the experiments and the methodology to calibrate microlite crystallization in the case of the AD 1530 eruption are detailed in Supplementary Material. The results show that the crystallization P can be determined using two sets of equations: one for melts with 71 wt% SiO2 and another one for melts with 74 wt% SiO2.
Selected SEM images of the samples are shown in Figure 2 and textural and compositional analyses are summarized in Table 1.
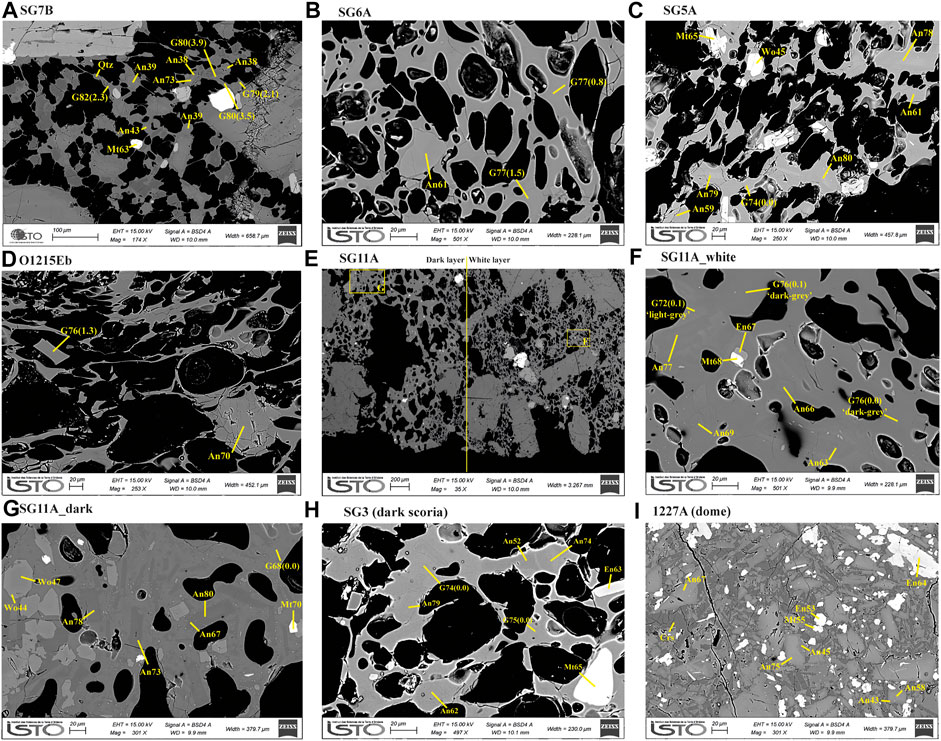
FIGURE 2. Selected SEM images of the sample matrices, showing (A) the phreatomagmatic SG7B white pumice, (B) the lower sub-Plinian SG6A white pumice, (C) the lower sub-Plinian SG5A white pumice, (D) the upper sub-Plinian O1215Eb white pumice, (E) the upper sub-Plinian SG11A banded pumice, with (F) SG11A_white from the “white” layer and (G) SG11A_dark from the “dark” layer, (H) the Strombolian SG3 dark scoria, and (I) the 1227A lava dome clast. An gives the molar content in anorthite of the plagioclase, Mt gives the molar content in magnetite of the titanomagnetite, En gives the molar content in enstatite of the orthopyroxene, Wo gives the molar content in wollastonite of the clinopyroxene, Qtz is quartz, Crs is cristobalite, and G gives the SiO2 content in wt% of the glass with H2O content in wt% in brackets.
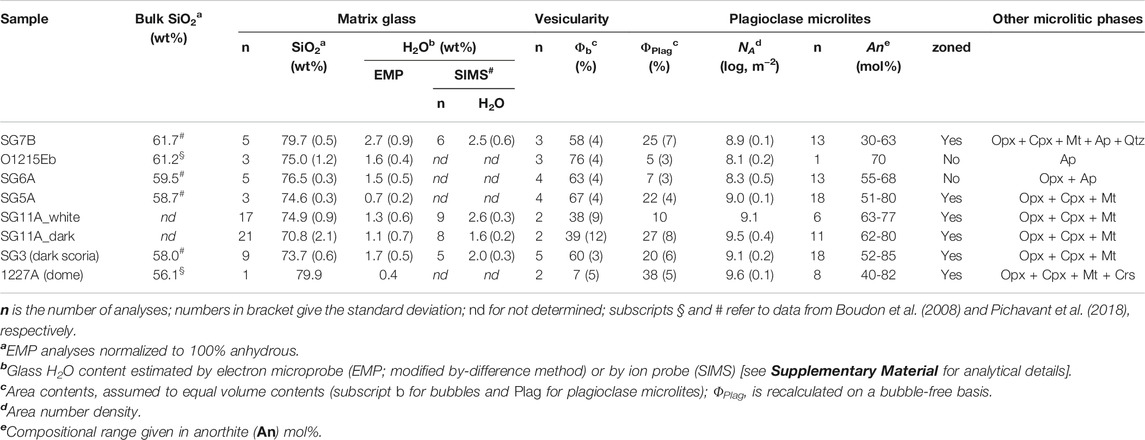
TABLE 1. Compositional and textural characteristics of the sample matrices.
All samples, but the 1227A dome clast, show strong textures of bubble coalescence, with pore borders still showing outlines of initially individual bubbles (Figure 2). The sample vesicularities (Φb) are reported in Table 1 and shown in Figure 3A, as a function of the plagioclase content (ΦPlag). The phreatomagmatic SG7B pumice (Figure 2A) shows Φb of 58 ± 4%. The lower sub-Plinian SG6A (Figure 2B) and SG5A (Figure 2C) pumice samples show Φb of 63 ± 4% and 67 ± 4%, respectively. The upper sub-Plinian O1215Eb (Figure 2D) pumice shows Φb of 76 ± 4%, representing the most vesiculated sample from the present study. Both parts of the upper sub-Plinian SG11A banded pumice (Figure 2E) show similar vesicularities, with Φb of 38 ± 9 and 39 ± 12% in SG11A_white (Figure 2F) and SG11A_dark (Figure 2G), respectively. The Strombolian SG3 dark scoria (Figure 2H) shows Φb of 60 ± 3%. The 1227A dome clast shows highly altered parts with up to millimetric highly hydrated and zoned silica crystals (not studied). The analyses were performed in the fresh-looking parts observed by SEM (Figure 2I), showing Φb of 7 ± 5%. Globally, Figure 3A shows that Φb decreases with increasing ΦPlag.
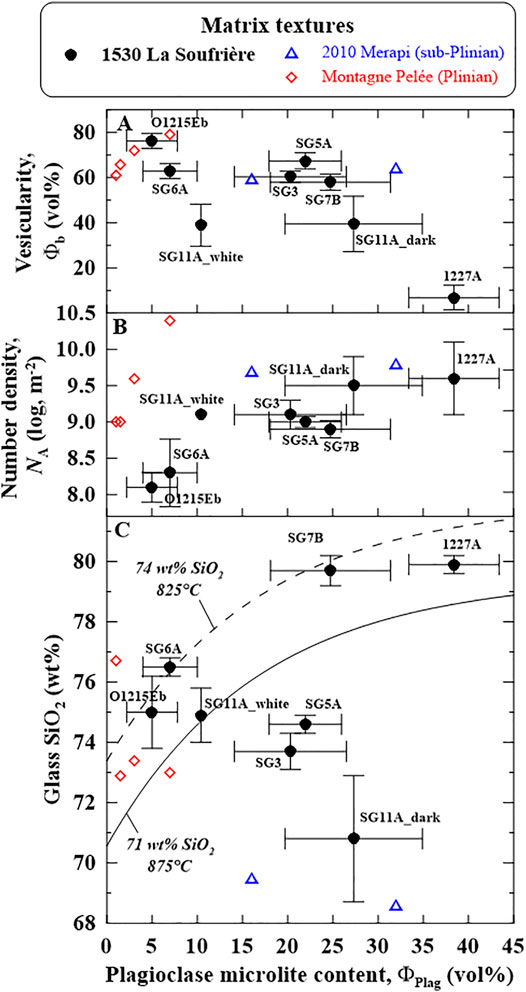
FIGURE 3. Matrix textures defined as the content of the plagioclase microlites versus (A) vesicularity, (B) number density of plagioclase microlites, and (C) SiO2 content of the residual glasses; sample numbers as in Table 1; the curves represent equilibrium crystallization starting from melts with 71 and 74 wt% SiO2 (plain and dashed lines, respectively), as calculated from combining Eq. 3 with Eq. 4 and Eq. 6 in Supplementary Material. For comparison, the blue triangles represent the November 5, 2010 sub-Plinian event of Merapi, Indonesia (from Preece et al., 2014), and the red diamonds show the P1, P2, P3, and P4 Plinian eruptions of Montagne Pelée, Martinique (Martel and Poussineau, 2007).
The plagioclase microlite contents (ΦPlag) and number density (NA) are reported in Table 1 and displayed in Figure 3B. In the phreatomagmatic SG7B pumice, the microlites mostly consist of plagioclase and quartz, with some orthopyroxene, clinopyroxene, magnetite, and apatite (Figure 2A). ΦPlag is 25 ± 7% and logNA is 8.9 ± 0.1 m−2. Quartz microlites represent 22 ± 5% of the total microlites. In the lower sub-Plinian SG6A pumice, the microlites mostly consist of plagioclase, coexisting with scarce orthopyroxene, magnetite, and apatite (Figure 2B). ΦPlag is 7 ± 3% and logNA is 8.3 ± 0.5 m−2. In the lower sub-Plinian SG5A pumice, the microlites mostly consist of plagioclase, with numerous orthopyroxenes, clinopyroxenes, and magnetites (Figure 2C). ΦPlag is 22 ± 4% and logNA is 9.0 ± 0.1 m−2. Pyroxene and magnetite represent 13 ± 3% of the total microlite content. In the upper sub-Plinian O1215Eb pumice, the microlites mostly consist of plagioclase, coexisting with scarce clinopyroxene, magnetite, and apatite (Figure 2D). ΦPlag is 9 ± 3% and logNA is 8.1 ± 0.2 m−2. The upper sub-Plinian SG11A_white sample mostly contain microlites of plagioclase, with rare orthopyroxene and magnetite (Figure 2F). ΦPlag is about 10% and logNA is 9.1 m−2. In the upper sub-Plinian SG11A_dark sample, microlites mostly consist of plagioclase, with numerous clinopyroxenes, rare orthopyroxenes, and magnetites (Figure 2G). ΦPlag is 27 ± 8% and logNA is 9.5 ± 0.4 m−2. In the Strombolian SG3 dark scoria, the microlites mostly consist of plagioclase, with some orthopyroxene, clinopyroxene, and magnetite (Figure 2H). ΦPlag is 20 ± 6% and logNA is 9.1 ± 0.2 m−2. The fresher-looking matrices of the 1227A dome clast show microlites mostly consisting of plagioclase, with numerous orthopyroxenes, clinopyroxenes, magnetites, and cristobalite (Figure 2I). Cristobalite appears as both elongated crystals and large “fish-scale” patches. The former habit suggests a primary magmatic origin (crystallization from the melt) whereas the latter reveals vapor-phase deposition (Schipper et al., 2015). The 1227A dome clast shows ΦPlag of 38 ± 5% and logNA of 9.6 ± 0.1 m−2. Taken together, pyroxene and magnetite microlites represent about 10% of the total microlite content. Globally, Figure 3B shows that NA and ΦPlag positively correlate.
The major-element compositions of the analyzed microlites (plagioclase, magnetite, orthopyroxene, clinopyroxene, apatite, quartz, and cristobalite) are given in Supplementary Material and reported in Figure 4 for plagioclase, magnetite, orthopyroxene, and clinopyroxene. The phreatomagmatic SG7B pumice contains zoned plagioclase microlites, with cores up to An73 and rims from An29 to An52 (Figure 2A). The less calcic microlites (∼An30) have high orthoclase contents (Or, in mol%) up to Or5-6, unlike microlites in the other samples that are < Or1. Coexisting microlites are Mt63 titanomagnetite, En52-57 orthopyroxene, Wo39-42En35-39 clinopyroxene, and apatite (Mt, En, and Wo, are magnetite, enstatite, and wollastonite, contents in mol%, respectively). The lower sub-Plinian SG6A pumice contains unzoned An54-66 plagioclase, coexisting with rare Mt69 titanomagnetite, En54-55 orthopyroxene and apatite (Figure 2B). The lower sub-Plinian SG5A pumice contains zoned plagioclases, with An74-80 cores and An50-67 rims, coexisting with Mt64-65 titanomagnetite, En66-70 orthopyroxene, and ∼Wo45En35 clinopyroxene (Figure 2C). The upper sub-Plinian O1215Eb pumice contains unzoned ∼ An70 plagioclase coexisting with rare Mt66-67 titanomagnetite and apatite (Figure 2D). In the upper sub-Plinian SG11A_white sample, zoned An63 to An77 plagioclase coexist with rare ∼ Mt68 titanomagnetite and unzoned ∼ En67 orthopyroxene (Figure 2F). In the upper sub-Plinian SG11A_dark sample, the plagioclases are zoned from ∼An80 cores to ∼ An62 rims (Figure 2G), a range similar to that of the SG11A_white microlites. Mt69-70 titanomagnetite coexists with zoned clinopyroxene, from Wo47En41 (∼6 wt% Al2O3) core to Wo44En46 (∼3 wt% Al2O3) rim. The Strombolian SG3 dark scoria shows zoned plagioclases with An73-85 cores and An52-67 rims, coexisting with strongly zoned En56-67 orthopyroxene and Wo35-39En38-47 clinopyroxene (Figure 2H). The 1227A dome sample shows strongly zoned plagioclases, with An58-75Or0-1 cores and An43-45Or2-3 rims. The coexisting microlites are Mt54-58 titanomagnetite, zoned En52-64 orthopyroxene, and Wo35-38 En38-39 clinopyroxene (Figure 2I).
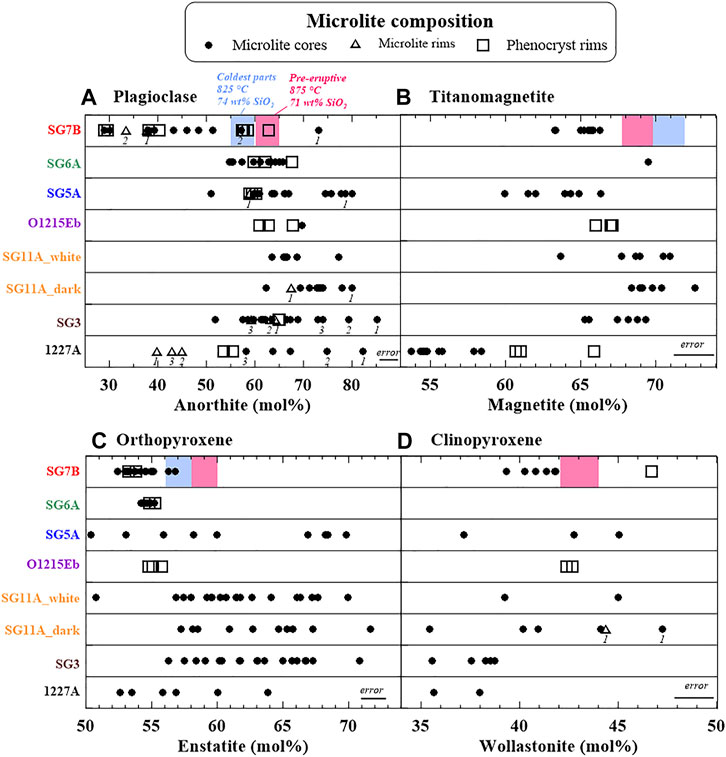
FIGURE 4. Compositions of the microlites of (A) plagioclase in An mol%, (B) titanomagnetite in Mt mol%, (C) orthopyroxene in En mol%, and (C) clinopyroxene in Wo mol%. The red box gives the pre-eruptive compositions at 175 MPa and 875°C determined experimentally for the phreatomagmatic SG7B pumice sample by Pichavant et al. (2018) and the blue box represents those assumed for coldest (∼825°C) parts of the reservoir.
The compositions of residual glasses are reported in Supplementary Material and displayed in Figure 5. All residual glasses are rhyodacitic to rhyolitic, spanning a SiO2 range from 67.5 to 80.2 wt% and alkali contents from 3.5 to 7.5 wt%. The phreatomagmatic SG7B pumice and the 1227A dome sample have overlapping glass compositions, showing 79–80 wt% SiO2, 9–11 wt% Al2O3, <1 wt% CaO, and 4–5 wt% K2O. The upper sub-Plinian O1215Eb and lower sub-Plinian SG5A pumice clasts have overlapping glass compositions, showing narrow ranges of 74–76 wt% SiO2, 12–14 wt% Al2O3, 2–3 wt% CaO, and ∼2 wt% K2O. The lower sub-Plinian SG6A pumice contains 76.5 ± 0.3 wt% SiO2, 11.8 ± 0.2 wt% Al2O3, 2.2 wt% CaO, and 2.3 wt% K2O. The upper sub-Plinian SG11A banded pumice spreads a large range of glass compositions, with a continuum between the upper sub-Plinian SG11A_dark rhyodacitic and SG11A_white rhyolitic glasses, respectively showing 67–74 and 74–76 wt% SiO2, 13–15 and 12–13 wt% Al2O3, 3–5 and 2–3 wt% CaO, and 1.5–2.2 and 2.1–2.5 wt% K2O. In details, however, the glasses from both layers show small-scale chemical heterogeneities, with felsic areas (74–76 wt% SiO2) alternating with more mafic ones (68–72 wt% SiO2) (Pichavant et al., 2018; see also Figure 2F). The Strombolian SG3 dark scoria has rhyolitic glasses, with 73.7 ± 0.6 wt% SiO2, 12.7 ± 0.1 wt% Al2O3, 3.3 wt% CaO, and 2.0 wt% K2O. Globally, these samples show glass SiO2 contents that do not correlate with the microlite contents and do not follow a crystallization linked to melt degassing (Figure 3C).
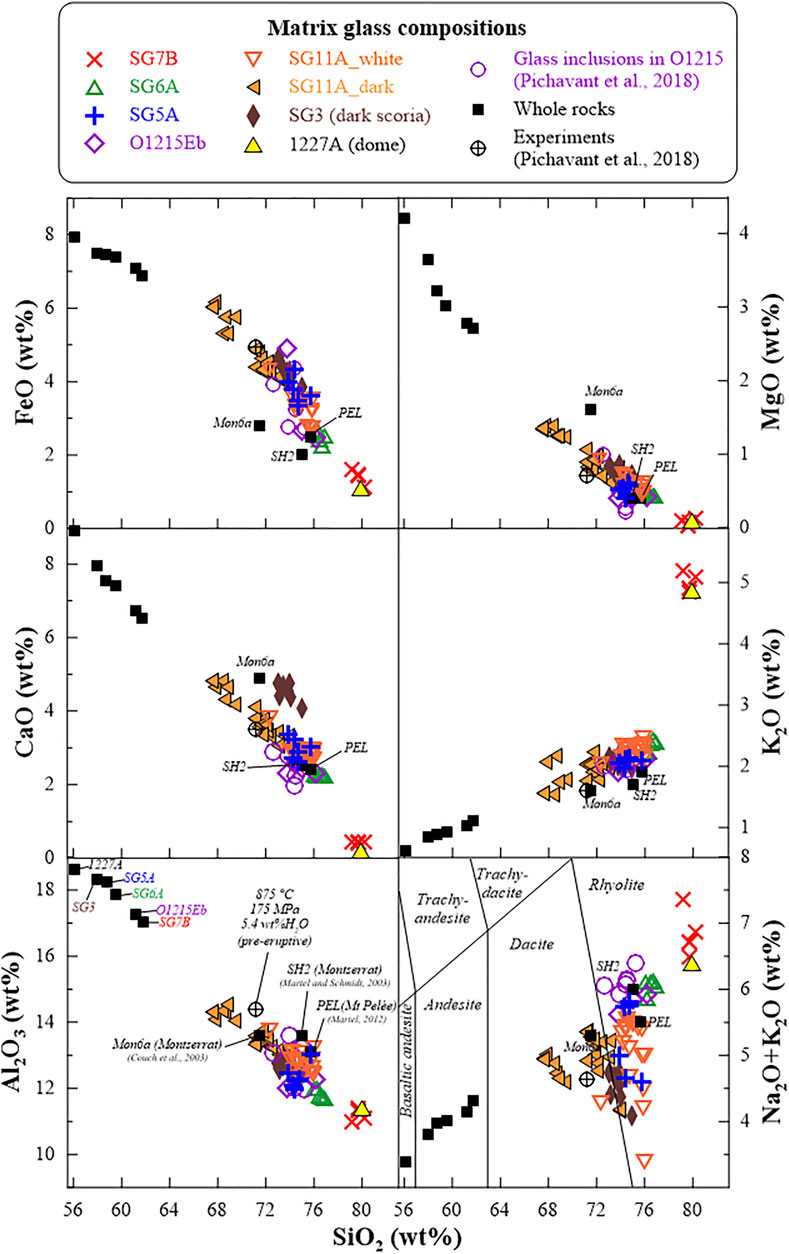
FIGURE 5. Matrix glass compositions. The colored symbols are the AD 1530 samples, with sample numbers as given in Table 1. The purple open circles are the glass inclusions given in Pichavant et al. (2018). The plain black squares show the bulk-rock compositions of the AD 1530 samples (<63 wt% SiO2) from Boudon et al. (2008) and Pichavant et al. (2018), and of the starting samples of the decompression series of Couch et al. (2003a; Mon6a), Martel and Schmidt (2003; SH2), and Martel (2012; PEL). The crossed circle gives the pre-eruptive glass composition determined experimentally by Pichavant et al. (2018).
The H2O contents of the residual glasses determined by EMP and SIMS are reported in Table 1 and displayed in Figure 6. The EMP and SIMS values are in good agreement within respective analytical errors, i.e., not differing by more than 0.5 wt%. One exception is the upper sub-Plinian SG11A_white sample, for which the SIMS data are about 1.3 wt% higher than the EMP values, for a reason that remains unclear. However, the SIMS values in SG11A_white (2.6 ± 0.3 wt% H2O) do not compare to those in SG11A_dark (1.6 ± 0.2 wt% H2O), although coming from the same pumice, and do not compare to the EMP values determined in both layers (1.1 ± 0.7 and 1.3 ± 0.6 wt% H2O), so that the SIMS values in SG11A_white will be further discarded. The H2O contents of the residual glasses are ∼2.5 wt% in the phreatomagmatic SG7B pumice, ∼1.5 wt% in the upper sub-Plinian O1215Eb and SG11A pumice, the lower sub-Plinian SG6A pumice, and the Strombolian SG3 scoria, and 0.4–0.7 wt% H2O in the 1227A dome clast and lower sub-Plinian SG5A pumice.

FIGURE 6. H2O versus SiO2 content of the matrix glasses. The H2O contents are determined by the by-difference method using the electron microprobe, except where “(sims)” is mentioned which refers to H2O determination by ion probe (as given in Table 1). Pressures on the right Y-axis are H2O solubility pressures calculated after Newman and Lowernstern (2002). The purple open circles are the glass inclusion data given in Pichavant et al. (2018). The crossed circles are experiments from Pichavant et al. (2018) and the colored box gives the experimentally-determined pre-eruptive conditions. The curves show the trends for equilibrium crystallization starting from a 71 wt% SiO2 melt (plain curve; after Eq. 4 in Supplementary Material) and from a 74 wt% SiO2 melt (dashed curve; after Eq. 6 in Supplementary Material). The dashed lines show the silica polymorph boundaries in rhyolitic melts as defined in Martel et al. (2021).
The quench P calculated using the H2O solubility model of Newman and Lowenstern (2002) are reported in Figure 7; note that calculating P at 825 and 875°C does not differ by more than ∼5 MPa for H2O contents <3 wt%. The quench P, that can be viewed as the magma fragmentation P in the case of pumice, are ∼50 ± 20 MPa for the phreatomagmatic SG7B pumice, ∼20 ± 15 MPa for the lower sub-Plinian SG6A and upper sub-Plinian O1215Eb pumice, ∼16 ± 15 MPa for the upper sub-Plinian SG11A pumice, and ∼5 ± 2 MPa for the lower sub-Plinian SG5A pumice. For the Strombolian SG3 dark scoria, the calculated quench P is ∼28 ± 13 MPa and <5 MPa for the 1227A dome sample.
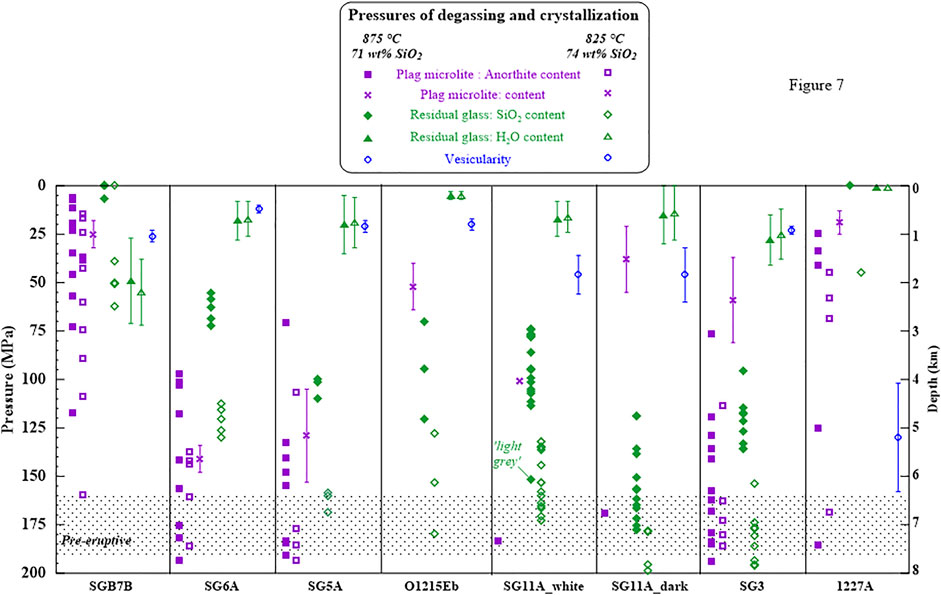
FIGURE 7. Equilibrium pressures of crystallization and degassing calculated from the anorthite content of the plagioclase microlites (Eq. 2 at 875°C and Eq. 5 at 825°C in Supplementary Material), the content of plagioclase microlite (Eq. 3 in Supplementary Material), the SiO2 content of the residual glasses (Eq. 4 at 875°C and Eq. 6 at 825°C in Supplementary Material), the H2O content of the residual glass (from Newman and Lowernstern, 2002), and sample vesicularity (Eq. 1 in Supplementary Material). All pressures calculated at more than 200 MPa are not shown. The dashed box gives the range of pre-eruptive pressure determined by Pichavant et al. (2018).
Back-calculating quench P (from Eq. 1 in Supplementary Material) by replacing α by Φb gives ∼10–30 MPa for the phreatomagmatic SG7B pumice, the lower sub-Plinian SG6A and SG5A pumice, the upper sub-Plinian O1215Eb pumice, and the Strombolian SG3 scoria, ∼50 MPa for both bands of the upper sub-Plinian SG11A pumice, and ∼130 MPa for the 1227A dome sample (Figure 7). Yet for the 1227A dome sample, the degassing obviously did not occur in closed-system, so that the quench P of 130 MPa can be discarded.
The calculated equilibrium P (using Eqs 2–6 in Supplementary Material) are shown in Figure 7 for p ≤ 200 MPa. p > 200 MPa, i.e., higher than the pre-eruptive P, were calculated for all samples, and mostly concern An65-80 microlites that likely grew from melt compositions other than rhyolitic. The phreatomagmatic SG7B pumice shows crystallization P calculated from microlite composition from 5 to 115 MPa (71 wt% SiO2 melt) and from 15 to 160 MPa (74 wt% SiO2 melt). The crystallization P calculated from microlite crystallinity (i.e., plagioclase content) is 25 ± 5 MPa. If the residual glass SiO2 equations are used, P are <10 and <65 MPa, respectively with the 71 and 74 wt% SiO2 melts. In the lower sub-Plinian SG6 pumice, the P calculated from plagioclase composition range from ∼100 to >175 MPa for a 71 wt% SiO2 melt and is > 135 MPa for a 74 wt% SiO2 melt. From microlite crystallinity, P is 130 ± 25 MPa. From glass SiO2, P is ∼55–80 MPa and ∼110–130 MPa when calculated from a 71 and 74 wt% SiO2 melt, respectively. In the lower sub-Plinian SG5A pumice, most of the P calculated from microlite composition are >125 MPa, but rare P of ∼75 MPa are also obtained. P calculated from crystallinity are 50 ± 10 MPa. P deduced from the residual glass SiO2 are ∼100 and ∼160 MPa, when calculated from a 71 and 74 wt% SiO2 melt, respectively. In the upper sub-Plinian O1215Eb, SG11A_white, and SG11A_dark pumice samples, plagioclase microlite compositions are too calcic and no p < 175 MPa are calculated. In the O1215Eb pumice, the P is 140 ± 5 MPa from microlite crystallinity. From residual glass SiO2, P are of 70–120 MPa and 125–180 MPa, respectively with the 71 and 74 wt% SiO2 starting melts. In the Strombolian SG3 dark scoria, most of the P calculated from microlite composition are >125 MPa, but rare P of ∼75 MPa are also obtained. P calculated from crystallinity are 60 ± 22 MPa. P deduced from the residual glass SiO2 are 100–135 MPa and 150–200 MPa, for a 71 and 74 wt% SiO2 melt, respectively. In the 1227A dome sample, P calculated from microlite compositions range from 25 to >200 MPa, is of 20 ± 5 MPa from crystallinity, and of ∼50 MPa and <5 MPa, when calculated from residual glass SiO2 starting from a 71 and 74 wt% SiO2 melt, respectively.
To better fix the crystallization conditions of the microlites, it is useful to look for further constraints on the melt composition (i.e., either 71 or 74 wt% SiO2). The phreatomagmatic SG7B matrix contains quartz, which requires SiO2-saturated melts, i.e., SiO2 contents > ∼79 wt% at ∼50 MPa (Martel et al., 2021). From the H2O-SiO2 contents of the residual glasses, quartz crystallization in SG7B would not be possible at 875°C starting from a 71 wt% SiO2 melt, whereas it may be possible at 825°C if the starting melt contains 74 wt% SiO2 (Figure 6). In contrast, the cristobalite-bearing 1227A dome sample is consistent with an origin by equilibrium crystallization from a 71 wt% SiO2 starting melt at 875°C (Figure 6). In the upper sub-Plinian SG11A banded pumice, the residual glass compositions differ between the white and dark bands (Figure 5). Yet, crystallization from a melt with 74 wt% SiO2 in SG11A_white and 71 wt% SiO2 in SG11A_dark yields overlapping P of residual glass formation in the 130–175 MPa range (Figure 7), validating crystallization from a 74 wt% SiO2 melt in the white bands whereas from a 71 wt% SiO2 melt in the dark bands. The lower sub-Plinian SG6A pumice and the upper sub-Plinian O1215Eb pumice show residual glasses that are slightly more silicic than expected from equilibrium crystallization from a 71 wt% SiO2 melt (Figure 3C). In addition, both samples contain apatite microlites, which were also found in the phreatomagmatic SG7B pumice for which the initial melt has been determined to contain 74 wt% SiO2. Therefore, the microlites in the SG6A and O1215Eb pumice samples likely crystallized from a 74 wt% SiO2 melt. For the lower sub-Plinian SG5A pumice and the Strombolian SG3 dark scoria, the choice of the starting melt composition is less clear. Yet, the SG3 sample does not contain apatite, is dark in colour and has a bulk-rock composition (∼58 wt% SiO2 and ∼3.8 wt% MgO) close to that of the lava dome, comes from a Strombolian event typically involving melts more mafic than for sub-Plinian events, and chronologically just preceded the terminal dome growth, so that it is reasonable to assume a pre-eruptive melt composition similar to that of the dome, i.e., with 71 wt% SiO2. As for the SG5A pumice, both SiO2 contents, 71 and 74 wt%, will be considered.
Comparing the vesicularities measured in the samples to the calculated gas fraction for a closed-system degassing (from Eq. 1 in Supplementary Material) provides information on the magma degassing regime. Figure 8 shows that the phreatomagmatic SG7B pumice, the lower sub-Plinian SG6A pumice, the upper sub-Plinian O1215Eb pumice, and the Strombolian SG3 dark scoria have measured vesicularities close to the theoretical ones, suggesting that they probably degassed in closed system. The large variability in the calculated vesicularities for the phreatomagmatic SG7B pumice result from the high variability in the measured H2O contents of the residual glasses (Table 1). In particular, locally high H2O contents (∼3.0 wt%) lead to theoretical vesicularities (∼20 vol%) much lower than actually measured (∼60 vol%), which possibly result from rehydration of the residual glasses in the external H2O-rich context that characterizes phreatomagmatism. Contrary to these samples, the lower sub-Plinian SG5A homogeneous pumice and the upper sub-Plinian SG11A banded pumice seem to have partially lost bubbles, which could result from local permeability development and partial outgassing in an open-system degassing regime. For the SG5A pumice, the H2O contents of the residual glasses are lower than for the other pumice (0.7 vs >1.1 wt%; Table 1), whereas the measured vesicularities compare (i.e., ∼74 vol%), so that this could alternatively reflect post-fragmentation H2O loss from the glasses (with a resulting overestimated theoretical vesicularity). The 1227A lava dome clast shows a much lower vesicularity (<10 vol%) than calculated (>90 vol%) from its low residual glass H2O content (0.4 wt%), highlighting a strong outgassing, as expected from the slow ascent rates commonly prevailing during lava dome emplacements.
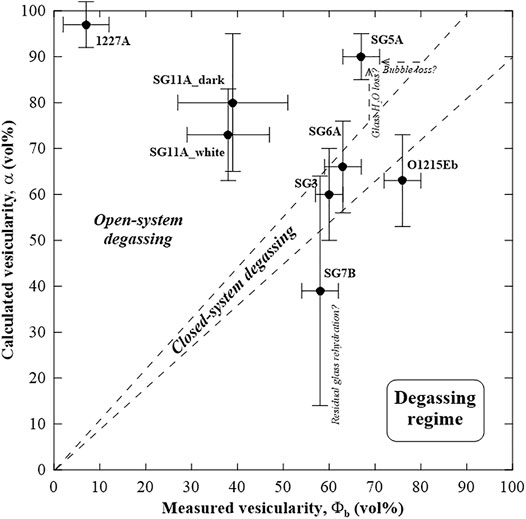
FIGURE 8. Degassing regime, as defined by the vesicularity measured in the natural samples (Φb in Table 1) versus the vesicularity calculated after Eq. 1 in Supplementary Material (Jaupart and Allègre, 1991) for a closed-system degassing for which the gas bubbles stay in the magma. The 1:1 line (enlarged to 10% uncertainty) delimits a closed-system degassing, for which measured and calculated vesicularities compare, to an open-system degassing regime, for which bubbles are lost (outgassing) so that the measured vesicularities are lower than calculated for a closed-system degassing. The error bars give the statistical errors on the vesicularity measurements (X-axis) and the variability of the calculations resulting from the range of residual glass H2O contents (Y-axis), as given in Table 1.
Martel and Iacono-Marziano (2015) demonstrated that the timescales of degassing, i.e. of bubble nucleation, growth, coalescence, and outgassing, primarily depend on the viscosity of the vesiculated magma under very low shear. The formulation of the bubble-melt viscosity used by these authors was set for crystal-free melts, so that the degassing timescales have to be taken with caution when dealing with crystal-bearing magmas. The bubble-melt viscosity was calculated from the steady simple-shear flow equation of Llewellin et al. (2002), calculating the viscosity of the hydrated residual glass at 875 and 825°C after Hess and Dingwell (1996) and using a capillary number (Ca) from 1.0 to 2.5 (characterizing little deformed bubbles). The calculations give bulk viscosities of 105.1–5.3 Pa s at 875°C and 105.6–5.9 Pa s at 825°C, and do not significantly differ for Ca varying from 1.0 to 2.5. Since all pumice samples show textural evidence of bubble coalescence, the ascent durations must have been longer than 1 h (Martel and Iacono-Marziano, 2015; their Figure 6). The magmas of the phreatomagmatic SG7B pumice, the lower sub-Plinian SG6A pumice, the upper sub-Plinian O1215Eb pumice, and the Strombolian SG3 dark scoria, did not outgas significantly, so that maximum ascent durations could be 10–100 h (0.5–4 days). The partially-outgassed lower sub-Plinian SG5A pumice and upper sub-Plinian SG11A banded pumice have calculated bulk viscosity from 105.2 Pa s for T of 875°C to 105.9 Pa s at 825°C, which suggest ascent durations >100 h. The 1227A lava dome sample that nearly fully outgassed has a calculated bulk viscosity of 105.2 and 105.8 Pa s at 875 and 825°C, respectively, suggesting emplacement duration >1,000 h (>40 days).
Ascent crystallization of microlites can be characterized by two main criteria. Firstly, microlite compositions should be compatible with crystallization from the pre-eruptive melt composition, i.e., with compositions more evolved than coexisting phenocryst rims (assuming an ideal case of phenocrysts no more growing upon ascent). Secondly, the proportion of microlites grown during ascent cannot be higher than expected for decompression rates permitting equilibrium crystallization; higher microlite contents would reflect inherited crystals. Based on these criteria, only two samples (the phreatomagmatic SG7B pumice and the 1227A dome clast) show major ascent-crystallization of microlites, three of them (the sub-Plinian O1215Eb, SG6A, and SG11A pumice samples) appear devoid of decompression-induced crystallization, and two others (the sub-Plinian SG5A pumice and the Strombolian SG3 scoria) show scarce ascent-crystallization, as detailed below.
The phreatomagmatic SG7B pumice fulfills the criteria for ascent-crystallization: the microlite compositions are more evolved than those crystallizing under pre-eruptive conditions (Figure 4) and the microlite content agrees with equilibrium crystallization at 825°C from a 74 wt% SiO2 starting melt (Figure 3C). The continuous range of plagioclase microlite compositions suggests steady-state crystallization from reservoir to P of ∼15 MPa (Figure 7); note that ascent-crystallization also took place as overgrowths on phenocrysts, as evidenced by some ∼ An28-40 plagioclase and En53-54 orthopyroxene phenocryst rims (Figures 4A–C). The good agreement between crystallization P deduced from compositions and contents of plagioclase microlites and those calculated from the residual glass compositions (Figure 7) suggests a near-equilibrium crystallization process. Moreover, these crystallization P agree with the degassing P calculated from vesicularity and H2O contents of the residual glasses (Figure 7), so that similar conditions are established for degassing and crystallization in the conduit.
For the 1227A dome sample, the P calculated from the compositions of the plagioclase microlites suggest that microlites continuously crystallized during ascent (Figure 7). Orthopyroxene and clinopyroxene microlite compositions (Figures 4C,D) confirm continuous crystallization during ascent. Degassing P retrieved from residual glass H2O contents are <30 MPa, reaching p < 5 MPa using residual glass compositions, highlighting a crystallization process close to equilibrium, although likely partly hampered by the slow crystallization kinetics prevailing at low P. Yet, lava domes commonly cool upon emplacement, thus driving plagioclase to more albitic compositions than expected from isothermal decompression, so that the crystallization P calculated for this sample have to be taken as minimum values. The Mt55-58 titanomagnetite microlites (Figure 4B) show about 10 mol% Mt less than both the microlites in the other samples and the dome phenocrysts (Supplementary Material). This confirms late-emplacement cooling of the AD 1530 lava dome, rather than evidencing more reduced conditions that appear unlikely since the dome cooled in air.
The lower sub-Plinian SG6A pumice and the upper sub-Plinian O1215Eb, SG11A_white, and SG11A_dark pumice, all show microlite compositions similar or less evolved than the pre-eruptive ones (Figure 4), with calculated p > 130 MPa (Figure 7). Therefore, most of microlites must have crystallized at reservoir depth prior to eruption, without significant decompression-induced crystallization. The strong contrast between these crystallization P and the degassing P (≤50 MPa) deduced from vesicularity and residual glass H2O contents (Figure 7) shows that crystallization and degassing were largely decoupled. Since degassing is a process much faster than crystallization (e.g., Martel and Schmidt, 2003), strong kinetic crystallization delays are implied. In both bands of the SG11A pumice, the orthopyroxene microlites are more magnesian than the phenocryst rims (Figure 4C), likely reflecting crystallization from a more mafic melt. The SG11A_dark sample additionally contains Wo44-47En41-46 clinopyroxene microlites, which cover the compositions of the phenocrysts, from common Wo42 (∼1 wt% Al2O3) augites to Wo46 (∼6 wt% Al2O3) that can be considered as xenocrysts inherited from more mafic compositions (Pichavant et al., 2018). Also, SG11A_dark has a strongly higher microlite content than expected from equilibrium crystallization (Figure 3C). Overall, these observations argue in favor of mostly inherited microlites that crystallized from a more mafic melt intruding the reservoir, as described by Martel et al. (2006). Considering that SG6, O1215Eb, and SG11A_white pumice did not crystallize microlites during ascent, i.e., all microlites are inherited, suggests about 5–10 vol% inherited plagioclase microlites (Φplag values in Table 1) for the magmas coming from the coldest part of the reservoir.
The lower sub-Plinian SG5A pumice and the Strombolian SG3 dark scoria mostly crystallized plagioclase microlites at P of ∼125–200 MPa, i.e., similar to the pre-eruptive P, and some rare microlites at P of 50–75 MPa (Figure 7). The P deduced from the residual melt compositions are similar to the pre-eruptive P when calculated starting with a 74 wt% SiO2 melt (SG5A) and ∼100–130 MPa when calculated with a 71 wt% SiO2 melt (SG5A and SG3). Therefore, the amount of plagioclase microlites grown at 50–75 MPa was likely too low to drive the residual glass compositions to those expected at 50–70 MPa. This may be illustrated by the results of the phase-equilibrium experiments, showing that increasing the plagioclase content by 5 vol% from 75 to 50 MPa (Supplementary Material) does not increase the glass SiO2 contents, which is capped at 79–80 wt% SiO2 (Supplementary Material). The sub-Plinian SG5A sample contains orthopyroxene and clinopyroxene microlites that are compositionally less evolved than expected from decompression-induced crystallization at p < 175 MPa, either from 71 or 74 wt% SiO2 melts (Figure 4). The Strombolian SG3 dark scoria contains orthopyroxene, clinopyroxene, and titanomagnetite microlites, whose compositions are on both sides, either mafic or felsic, of the pre-eruptive compositions (Figure 4). Additionally, the microlite contents are higher than expected from equilibrium crystallization starting from a 71 wt% SiO2 melt (Figure 3C), suggesting a significant amount of inherited microlites. Therefore, most of the microlites in these two samples are inherited from mixing processes at reservoir level, with only a very few fraction crystallizing during magma ascent. Neglecting ascent-crystallization in the cases of the Strombolian SG3 scoria, the upper sub-Plinian SG11A_dark pumice, and the lower sub-Plinian SG5A pumice, may also suggest about 20–27 vol% inherited microlites from the Φplag values in Table 1.
Bubble number density has been demonstrated to correlate with decompression rate in rhyolitic melts (Toramaru, 2006). Yet, the AD 1530 magmas obviously underwent too much bubble coalescence (e.g., Figure 2) to make it possible to restore the original bubble number densities from the pumice samples. Alternatively, the decompression rate can be estimated from the microlite number density, in the case of a single event of crystal nucleation driven by melt H2O exsolution (Toramaru et al., 2008). Among the samples that nucleated plagioclase microlites during ascent, the presence of inherited microlites (predominant in SG5A), around which a part of the decompression-induced crystallization occurred (zoned microlites), means that ascent-crystallization partly occurred as growth around preexisting crystals instead of nucleation of new crystals. This disagrees with the requirements of the decompression-rate meter of Toramaru et al. (2008), implying that the calculated data must be treated with caution. The calculations are reported in Figure 9, and converted below into ascent durations assuming a magma travel from the ∼7 km deep reservoir to subsurface. The phreatomagmatic SG7B pumice could have ascended at rates of ∼400 Pa/s (ascent velocities of ∼0.002 m/s; duration of ∼30 days), the lower sub-Plinian SG5A pumice at rates from 40 to 200 Pa/s (velocities between ∼0.003 and 0.015 m/s and duration from 30 to 2 days, calculated for 74 and 71 wt% SiO2 melts, respectively), and the Strombolian SG3 dark scoria at rates of ∼300 Pa/s (velocity of ∼0.015 m/s; duration of ∼2 days). The decompression rate of 900 Pa/s (velocity of ∼0.05 m/s; duration of 1.5 days) calculated for the 1227A dome sample is unrealistically fast, likely biased by continuous microlite nucleation upon ascent and by non-isothermal crystallization (late microlites formed upon cooling), so that it will not be further considered.
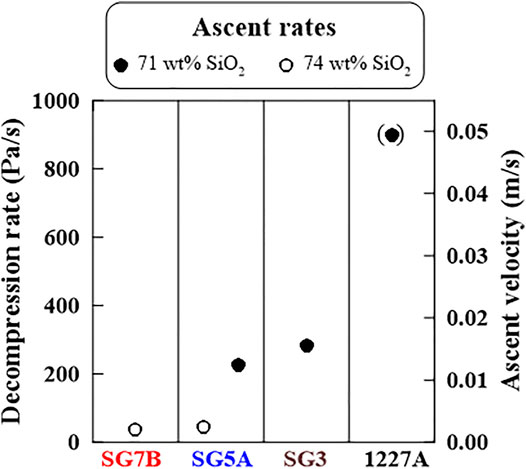
FIGURE 9. Decompression rates calculated from the plagioclase number density using the formulation of Toramaru et al. (2008; their Eq. 10). Plain and open symbols are calculation from a 71 and 74 wt% SiO2 melt, respectively. Volume number density are calculated as NA2/3 following Armienti (2008), initial H2O content is 5.4 wt%, and decompression rate is converted into ascent velocity using a 1.7 g/cm3 bulk density for the vesiculated magma. Note that the decompression rate calculated for the dome magma is unrealistically high, due to multiple events of microlite nucleation (see text).
In comparison with the timescales of degassing deduced from the viscosity of a vesiculated magma (from Martel and Iacono-Marziano, 2015), the timescales of magma ascent calculated from the microlite content (from Toramaru et al., 2008) are about the same order of magnitude for the Strombolian SG3 dark scoria and the sub-Plinian SG5A pumice when calculated using a 71 wt% SiO2 melt (∼2 days versus maximum 0.5–4 days) and much longer for the phreatomagmatic SG7B pumice and the sub-Plinian SG5A pumice when calculated using a 74 wt% SiO2 melt (∼30 days versus maximum 0.5–4 days). Concerning the sub-Plinian SG5A pumice, this could argue for a starting interstitial melt closer to 71 than 74 wt% SiO2, i.e., tapping the main reservoir. As for the phreatomagmatic SG7B pumice, we conclude that the microlite number density could actually reflect a magma ascent duration of ∼30 days, whereas the shorter duration of 0.5–4 days attributed to degassing could reflect outgassing difficulties, as explained below.
The AD 1530 eruptive sequence is revisited below using temporal constraints from microlite crystallization and degassing, as illustrated in Figure 10.
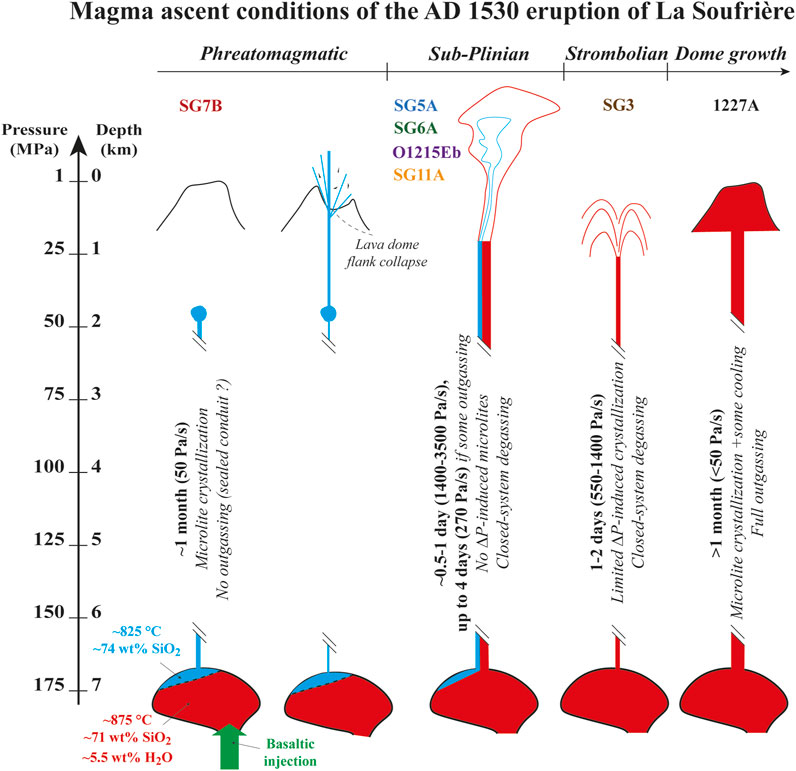
FIGURE 10. Magma ascent conditions of the AD 1530 eruption of la Soufrière of Guadeloupe. The eruption was likely triggered by the injection of a basaltic magma (green arrow) into the residing andesitic magma (red and blue shaded parts of the reservoir). The first magma that emplaced in AD 1530 likely tapped the coldest parts of the main reservoir (in blue; 825°C, interstitial melt with 74 wt% SiO2 and 5.5 wt% H2O) and ascended during about 1 month up to ∼2 km deep. During ascent, the magma had time to crystallize microlites but did not outgas, likely due to sealed conduit walls. Heating and pressurizing the surrounding hydrothermal system triggered a phreatomagmatic explosion, that destabilized the summit of the volcano, generating a flank collapse of the lave dome. This triggered a sub-Plinian event that progressively tapped the main reservoir (in red; 875°C, interstitial melt with 71 wt% SiO2 and 5.5 wt% H2O), emitting homogeneous and banded pumice. The magma ascent durations are estimated to 0.5–4 days. The following short Strombolian event emitted dark scoria that ascended in 1–2 days before fragmentation at ∼1 km deep, and ended by the growth of the present lava dome whose magma ascended in more than 1 month.
The sequence started with phreatic and phreatomagmatic explosions likely triggered by the shallow emplacement of a magma intrusion that overheated the surrounding hydrothermal system. This early magma was probably the “SG7B magma”, coming from the coldest parts of the reservoir (∼825°C) and pushed upwards by a more mafic magma at depth, as evidenced by the Ca-rich cores of the plagioclase microlites (∼An75; Figure 4). During ascent, the magma continuously crystallized microlites of plagioclase, pyroxene, clinopyroxene, apatite, and quartz microlites under near-equilibrium conditions (Figure 3C). Near-equilibrium crystallization of the plagioclase microlites is confirmed by their low number density and rather large (20–100 µm) euhedral shapes, which reflect a growth-dominated crystallization under small undercoolings of < ∼40°C (Hammer and Rutherford, 2002; Mollard et al., 2012). The microlite content suggests magma ascent at low velocity of ∼0.002 m/s (Figure 9; from Toramaru et al., 2008), i.e., in about 1 month from reservoir to quench P of ∼50 MPa (decompression rate of ∼50 Pa/s). Interestingly, the magma did not outgas (Figure 8), which suggest a low permeability of the conduit walls or the presence of a magma plug, including the possibility of a small dome or cryptodome, that prevented bubble loss.
The flank collapse that followed the phreatomagmatic explosions likely depressurized the underlying magma and triggered the sub-Plinian eruption. The white homogeneous pumice (SG6A, SG5A) and the white layers of the banded pumice (O1215Eb, SG11A_white) share close bulk-rock compositions (59-62 wt% SiO2; Figure 5) with the phreatomagmatic SG7B pumice, so that they likely tapped the coldest parts of the reservoir. The magma mixing features in the banded pumice (e.g., upper sub-Plinian SG11A_dark) suggest that the main reservoir (at 875°C) was progressively tapped. Most of these sub-Plinian pumice (i.e., SG5A, SG6A, O1215Eb) did not crystallize upon ascent. This means that the decompression rates of ∼50 Pa/s deduced from the microlite number density in the SG5A sample using the formulation of Toramaru et al. (2008) (Figure 9) may not be valid, because these are microlites inherited from reservoir processes. Decompression durations preventing crystallization are of the order of <1 day, according to decompression experiments performed on compositionally close melts (75–76 wt% SiO2) and T (850–860°C; Martel and Schmidt, 2003; Martel, 2012), but should be > ∼10 h for the bubbles to reach complete expansion (Martel and Schmidt, 2003), as required for a closed-system equilibrium degassing (Figure 8). Such an estimated duration of ∼0.5–1 day converts into a decompression rate of 1,750–3,500 Pa/s (considering a decompression of 150 MPa), and agrees with the maximum ascent duration of 0.5–4 days deduced from the degassing timescale (Martel and Iacono-Marziano, 2015). The “SG5A and SG11A magmas” started to outgas (Figure 8), suggesting local permeability of the conduit walls, and slower decompression rates of ∼270–1700 Pa/s (1–4 days, from Martel and Iacono-Marziano 2015).
The eruption went on by extruding a basaltic andesitic magma (56–59 wt% SiO2) as lava fountaining, from which the SG3 dark scoria was collected. At pre-eruptive conditions of 875°C and 175 MPa, these magmas have melt compositions (in equilibrium with the phenocrysts) of ∼71 wt% SiO2, maybe somewhat less. The “SG3 magma” only crystallized few microlites upon decompression from reservoir to fragmentation depth of ∼2–3 km (P of ∼50–75 MPa; Figure 7). This brackets the ascent duration between ∼1 day (decompression rate of ∼1,400 Pa/s), as experimentally determined for non-crystallizing 71 wt% SiO2 starting melts decompressed at 875–880°C (4–8 h from Couch et al., 2003b, and ∼1 day from Brugger and Hammer, 2010), to about 2–4 days (decompression rate of 200–400 Pa/s) from microlite content (Figures 7, 9), in agreement with durations <0.5–4 days deduced for a magma that did not outgas (Figure 8).
The eruption ended with the growth of the present lava dome. The “1227A” dome sample represents the most mafic magma (∼56 wt% SiO2 and 4.2 wt% MgO) of the eruptive sequence, with pre-eruptive residual melt compositions of ≤71 wt% SiO2 at 875°C and 175 MPa. The ascent duration of the “1227A” magma is not well constrained: it was long enough to allow steady-state microlite crystallization (Figure 7) and full outgassing (Figure 8), the latter argument suggesting ascent duration of more than ∼40 days (from Martel and Iacono-Marziano, 2015; decompression rate <50 Pa/s).
Explosive eruptions, including Plinian, sub-Plinian, and Vulcanian events, and involving dacitic to rhyolitic magmas, commonly show syneruptive decompression rates from 100 to ∼3,000 Pa/s (ascent rates of 0.01–0.1 m/s), based on petrological, experimental, and monitoring data (Cassidy et al., 2018). These rates of decompression agree with the decompression rates of 270–3,500 Pa/s that we propose for the AD 1530 sub-Plinian event of La Soufrière. Nevertheless, refinements can be proposed by restricting the comparison to sub-Plinian events for which magma ascent rates are known, such as the 1996 explosion of Soufrière Hills, Montserrat, and the 2010 eruption of Merapi, Indonesia.
The September 17th, 1996, short-lived sub-Plinian event (VEI 3) of Soufrière Hills volcano (Robertson et al., 1998) produced homogeneous pumices. From the absence of reaction rims around the amphibole phenocrysts in the pumice samples, Devine et al. (1998) estimated magma ascent durations >0.01 m/s, i.e., < 4 days. These ascent rates are comparable to the ascent durations <4 days proposed for the AD 1530 sub-Plinian pumice samples of La Soufrière.
The 2010 eruption of Merapi volcano started on October 26th by a phreatomagmatic explosion, followed by 7 days of dome growth and collapse, a sub-Plinian event (VEI 4) on November 5th, and terminated by a new dome growth (Surono et al., 2012; Komorowski et al., 2013). This eruptive sequence compares to the AD 1530 sequence of La Soufrière. The 2010 Merapi sub-Plinian event produced white pumice and grey scoria. The matrices of the white pumice have some similarities with those of the AD 1530 pumice of Soufrière: they show limited outgassing and tabular feldspar microlites with number densities of 109.8 m−2 and contents of 16–32 vol% (Preece et al., 2016) (Figure 3). Although the 2010 Merapi magma is more mafic (bulk-rock of ∼55–56 wt% SiO2 and residual glasses of ∼68 wt% SiO2 for the white pumice; Preece et al., 2014) and was stored at higher temperature (925–950°C; Erdmann et al., 2016) than for the AD 1530 La Soufrière magma, such textural similarities indicate comparable ascent conditions. The Merapi sub-Plinian event itself lasted 2 h and the preceding dome emplaced during 7 days, thus bracketing the ascent timescales of Merapi magma between 2 h for the pumice to 7 days for the denser clasts. These rates are in the same order of magnitude than those proposed for the AD 1530 sub-Plinian event (0.5–4 days; Figure 10).
Volcanic eruptions often start with a phreatic event that uncorks the conduit, and whether a magmatic eruption follows, it is still not predictable. The trigger of a magmatic eruption, and the possible transitions between effusive and explosive events, relies on interrelated and competing magmatic properties and processes, such as magma viscosity, degassing, conduit geometry and permeability, which ultimately control magma ascent rate (Cassidy et al., 2018). However, as only slight variations in the involved parameters may force a change in the eruptive style, we need to understand the factors controlling the conduit processes.
The study of the phreatomagmatic SG7B pumice from the AD 1530 deposit suggests that the early magma emplaced in a month or so at depth of ∼2 km, likely with little surface outgassing since bubbles did not escape the melt at depth. Such an intrusion could have been similar to that inferred during the 1976–77 phreatic eruption (Feuillard et al., 1983; Villemant et al., 2014). At the present day, a magma intrusion at depth could be detected via geophysical (seismic and ground deformation) methods, depending on the magma volume involved. Such geophysical signals of magma intrusion combined with an absence of surface degassing signals may be interpreted as gas pressurization at depth and potential precursors for an impending explosion. In AD 1530, the phreatomagmatic explosion likely destabilized the summit area of the volcano, generating a flank collapse that depressurized the underlying magma, leading to a sub-Plinian eruption. Such a scenario is nowadays all the more probable considering that the highly fractured and hydrothermalized summit lava dome is unstable (Rosas-Carbajal et al., 2016). In AD 1530, the collapse of the eruptive column during the sub-Plinian phase generated pyroclastic density currents channeled through two or three valleys, but the growth of the lava dome was not accompanied by destruction into pyroclastic density currents, as frequently occurred during the 1995–2010 Soufrière Hills eruption (Sparks and Young, 2002). Yet, superficial laterally directed explosions can also occur, particularly at the beginning of lava dome growth (e.g., historical eruptions at Montagne Pelée; Boudon and Balcone-Boissard, 2021). Such lava dome-related eruptions, which commonly depend on magma ascent rate (Martel, 2012) and lava dome size (Taisne and Jaupart, 2008), have to be considered as likely hazards in future eruptive scenarios of La Soufrière.
Therefore, geophysical and geochemical signals of shallow intrusion of new magma are of prime importance at La Soufrière volcano, because the produced heat could enhance the alteration of the lava-dome rocks eventually generating cascade processes including lava-dome and/or flank collapse and magmatic eruptions. Such a dramatic eruptive scenario threatens up to 70,000 people in southern Basse-Terre island of the region.
The textures and compositions of the matrices from samples emitted from various eruptive styles during the AD 1530 eruption of La Soufrière of Guadeloupe were compared to experimental samples from phase equilibria and decompression experiments from the literature, in order to provide timescales of syn-eruptive crystallization and degassing. We highlighted that:
• The early magma ascended from the reservoir to about 2 km deep in about 1 month. This intrusion heated the surrounding hydrothermal system, which likely lead to a flank collapse a following phreatomagmatic eruption.
• Dome removal decompressed the underlying magma generating magma ascent from the reservoir within 0.5–4 days, leading to a sub-Plinian event emitting homogeneous and banded pumice.
• The sub-Plinian event ended by a Strombolian phase, during which magma ascended in 1–2 days, followed by a terminal dome growth involving magma ascent during more than 1 month.
• Understanding the conduit processes that lead to the AD 1530 eruption is crucial for the hazard evaluation of a future volcanic crisis at La Soufriere, especially in a context of a present altered and instable lava dome that could collapse and trigger a major explosive event.
The original contributions presented in the study are included in the article/Supplementary Material, further inquiries can be directed to the corresponding author.
CM, MP, HB-B, and GB contributed to the conception of the work. CM and MP acquired the data. CM organized the database and wrote the first draft of the manuscript. All authors contributed to manuscript revision, read, and approved the submitted version.
This study benefitted from financial support from the French CNRS-INSU_TelluS program (H. Balcone-Boissard), the ANR V-CARE (ANR-18-CE03-0010; G. Boudon), the EQUIPEX PLANEX project (ANR-11-EQPX-0036; B. Scaillet), and the LABEX VOLTAIRE project (ANR-10-LABX-100-01; B. Scaillet).
The authors declare that the research was conducted in the absence of any commercial or financial relationships that could be construed as a potential conflict of interest.
All claims expressed in this article are solely those of the authors and do not necessarily represent those of their affiliated organizations, or those of the publisher, the editors and the reviewers. Any product that may be evaluated in this article, or claim that may be made by its manufacturer, is not guaranteed or endorsed by the publisher.
HB-B and MP gratefully thank E. Deloule for the access and help with the SIMS analyses. CM and MP thank I. di Carlo for the Raman analyses and help with the EMP analyses, and P. Benoist for the help with the SEM analyses. We gratefully thank the five reviewers, the Associate Editor Mike Carroll and the Editor Valerio Acocella, who volunteered their time to improve the manuscript.
The Supplementary Material for this article can be found online at: https://www.frontiersin.org/articles/10.3389/feart.2021.686342/full#supplementary-material
Armienti, P. (2008). Decryption of Igneous Rock Textures: Crystal Size Distribution Tools. Rev. Mineral. Geochem. 69, 623–649. doi:10.2138/rmg.2008.69.16
Barabé, L., and Jolivet, J. (1958). Les Récentes Manifestations d'activité de la Guadeloupe (Petites Antilles). Bull. Volcanol. 19, 143–158.
Bernard, O., and Bouvet de Maisonneuve, C. (2020). Controls on Eruption Style at Rabaul, Papua New Guinea - Insights from Microlites, Porosity and Permeability Measurements. J. Volcanol. Geotherm. Res. 406, 107068. doi:10.1016/j.jvolgeores.2020.107068
Boichu, M., Villemant, B., and Boudon, G. (2011). Degassing at La Soufrière de Guadeloupe Volcano (Lesser Antilles) since the last Eruptive Crisis in 1975-77: Result of a shallow magma intrusion? J. Volcanol. Geotherm. Res. 203, 102–112. doi:10.1016/j.jvolgeores.2011.04.007
Boudon, G., and Balcone-Boissard, H. (2021). Volcanological Evolution of Montagne Pelée (Martinique): A Textbook Case of Alternating Plinian and Dome-Forming Eruptions. Earth-sci. Rev. 221, 103754. doi:10.1016/j.earscirev.2021.103754
Boudon, G., Dagain, J., Semet, M. P., and Westercamp, D. (1988). Le massif volcanique de La Soufrière. Petites Antilles: département de la Guadeloupe. Carte géologique de la France, Editions BRGM.
Boudon, G., Semet, M. P., and Vincent, P. M. (1989). “The Evolution of La Grande Découverte (La Soufrière) Volcano, Guadeloupe (F.W.I.),” in Volcanic Hazards: Assessment and Monitoring. Editor J. H. Latter (Berlin: Springer-Verlag), 86–109. doi:10.1007/978-3-642-73759-6_5
Boudon, G., Le Friant, A., Komorowski, J.-C., Deplus, C., and Semet, M. P. (2007). Volcano Flank Instability in the Lesser Antilles Arc: Diversity of Scale, Processes, and Temporal Recurrence. J. Geophys. Res. 112, B08205. doi:10.1029/2006jb004674
Boudon, G., Komorowski, J.-C., Villemant, B., and Semet, M. P. (2008). A New Scenario for the Last Magmatic Eruption of La Soufrière of Guadeloupe (Lesser Antilles) in 1530 A.D. Evidence from Stratigraphy Radiocarbon Dating and Magmatic Evolution of Erupted Products. J. Volcanol. Geotherm. Res. 178, 474–490. doi:10.1016/j.jvolgeores.2008.03.006
Brugger, C. R., and Hammer, J. E. (2010). Crystallization Kinetics in Continuous Decompression Experiments: Implications for Interpreting Natural Magma Ascent Processes. J. Petrol. 51, 1941–1965. doi:10.1093/petrology/egq044
Cassidy, M., Manga, M., Cashman, K., and Bachmann, O. (2018). Controls on Explosive-Effusive Volcanic Eruption Styles. Nat. Commun. 9, 2839. doi:10.1038/s41467-018-05293-3
Cichy, S. B., Botcharnikov, R. E., Holtz, F., and Behrens, H. (2011). Vesiculation and Microlite Crystallization Induced by Decompression: a Case Study of the 1991-1995 Mt Unzen Eruption (Japan). J. Petrol. 52, 1469–1492. doi:10.1093/petrology/egq072
Couch, S., Harford, C. L., Sparks, R. S. J., and Carroll, M. R. (2003a). Experimental Constraints on the Conditions of Formation of Highly Calcic Plagioclase Microlites at the Soufrire Hills Volcano, Montserrat. J. Petrol. 44, 1455–1475. doi:10.1093/petrology/44.8.1455
Couch, S., Sparks, R. S. J., and Carroll, M. R. (2003b). The Kinetics of Degassing-Induced Crystallization at Soufriere Hills Volcano, Montserrat. J. Petrol. 44, 1477–1502. doi:10.1093/petrology/44.8.1477
Devine, J. D., Rutherford, M. J., and Gardner, J. E. (1998). Petrologic Determination of Ascent Rates for the 1995-1997 Soufriere Hills Volcano Andesitic Magma. Geophys. Res. Lett. 25, 3673–3676. doi:10.1029/98gl00912
Eichelberger, J. C., Carrigan, C. R., Westrich, H. R., and Price, R. H. (1986). Non-Explosive Silicic Volcanism. Nature 323, 598–602. doi:10.1038/323598a0
Erdmann, S., Martel, C., Pichavant, M., Bourdier, J.-L., Champallier, R., Komorowski, J.-C., et al. (2016). Constraints from Phase Equilibrium Experiments on Pre-eruptive Storage Conditions in Mixed Magma Systems: a Case Study on Crystal-rich Basaltic Andesites from Mount Merapi, Indonesia. J. Petrol. 57, 535–560. doi:10.1093/petrology/egw019
Feuillard, M., Allègre, C. J., Brandéis, G., Gaulon, R., Le Mouël, J. L., Mercier, J. C., et al. (1983). The 1975-1977 Crisis of la Soufriere de Guadeloupe (F.W.I): A still-Born Magmatic Eruption. J. Volcanol. Geotherm. Res. 16, 317–334. doi:10.1016/0377-0273(83)90036-7
Geschwind, C.-H., and Rutherford, M. J. (1995). Crystallization of Microlites during Magma Ascent: the Fluid Mechanics of 1980-1986 Eruptions at Mount St Helens. Bull. Volcanol. 57, 356–370. doi:10.1007/bf00301293
Gonnermann, H. M., and Manga, M. (2013). “Dynamics of Magma Ascent in the Volcanic Conduit,” in Modeling Volcanic Processes: The Physics and Mathematics of Volcanism. Editors S. Fagents, T. Gregg, and R. Lopes (Cambridge: Cambridge University Press), 55–84.
Hammer, J. E., and Rutherford, M. J. (2002). An Experimental Study of the Kinetics of Decompression-Induced Crystallization in Silicic Melts. J. Geophys. Res. 107 (B1), ECV 8-1–ECV 8-24. doi:10.1029/2001jb000281
Hess, K.-U., and Dingwell, D. B. (1996). Viscosities of Hydrous Leucogranitic Melts: Non-arrhenian Model. Am. Mineral. 81, 1297–1300.
Hicks, A., and Few, R. (2015). Trajectories of Social Vulnerability during the Soufrière Hills Volcanic Crisis. J. Appl. Volcanol. 4, 10. doi:10.1186/s13617-015-0029-7
Hincks, T. K., Komorowski, J.-C., Sparks, S. R., and Aspinall, W. P. (2014). Retrospective Analysis of Uncertain Eruption Precursors at La Soufrière Volcano, Guadeloupe, 1975–1977: Volcanic hazard Assessment Using a Bayesian Belief Network Approach. J. Appl. Volcanol. 3, 1–26. doi:10.1186/2191-5040-3-3
Jaupart, C., and Allègre, C. J. (1991). Gas Content, Eruption Rate and Instabilities of Eruption Regime in Silicic Volcanoes. Earth Planet. Sci. Lett. 102, 413–429. doi:10.1016/0012-821x(91)90032-d
Komorowski, J.-C., Boudon, G., Semet, M. P., Beauducel, F., Anténor-Habazac, C., Bazin, S., et al. (2005). “Guadeloupe,” in Volcanic Atlas of the Lesser Antilles. Editors J. M. Lindsay, R. E. A. Robertson, J. B. Shepherd, and S. Ali (Trinidad: The University of the West Indies), 65–102. Seismic Research Unit.
Komorowski, J.-C., Legendre, Y., Caron, B., and Boudon, G. (2008). Reconstruction and Analysis of Sub-plinian Tephra Dispersal during the 1530 A.D. Soufrière (Guadeloupe) Eruption: Implications for Scenario Definition and Hazards Assessment. J. Volcanol. Geotherm. Res. 178, 491–515. doi:10.1016/j.jvolgeores.2007.11.022
Komorowski, J.-C., Jenkins, S., Baxter, P. J., Picquout, A., Lavigne, F., Charbonnier, S., et al. (2013). Paroxysmal Dome Explosion during the Merapi 2010 Eruption: Processes and Facies Relationships of Associated High-Energy Pyroclastic Density Currents. J. Volcanol. Geotherm. Res. 261, 260–294. doi:10.1016/j.jvolgeores.2013.01.007
Launeau, P., and Robin, P.-Y. F. (1996). Fabric Analysis Using the Intercept Method. Tectonophysics 267, 91–119. doi:10.1016/s0040-1951(96)00091-1
Legendre, Y. (2012). Reconstruction Fine de l'histoire éruptive et Scénarii éruptifs à la Soufrière de Guadeloupe : Vers un Modèle Intégré de Fonctionnement du volcan. Paris, France: IPGP. PhD thesis.
Llewellin, E. W., Mader, H. M., and Wilson, S. D. R. (2002). The Constitutive Equation and Flow Dynamics of Bubbly Magmas. Geophys. Res. Lett. 29, 2170. doi:10.1029/2002gl015697
Martel, C., and Iacono-Marziano, G. (2015). Timescales of Bubble Coalescence, Outgassing, and Foam Collapse in Decompressed Rhyolitic Melts. Earth Planet. Sci. Lett. 412, 173–185. doi:10.1016/j.epsl.2014.12.010
Martel, C., and Poussineau, S. (2007). Diversity of Eruptive Styles Inferred from the Microlites of Mt Pelée Andesite (Martinique, Lesser Antilles). J. Volcanol. Geotherm. Res. 166, 233–254. doi:10.1016/j.jvolgeores.2007.08.003
Martel, C., and Schmidt, B. C. (2003). Decompression Experiments as an Insight into Ascent Rates of Silicic Magmas. Contrib. Mineral. Petrol. 144, 397–415. doi:10.1007/s00410-002-0404-3
Martel, C., Radadi Ali, A., Poussineau, S., Gourgaud, A., and Pichavant, M. (2006). Basalt-Inherited Microlites in Silicic Magmas: Evidence from Mount Pelée (Martinique, French West Indies). Geol 34, 905–908. doi:10.1130/g22672a.1
Martel, C., Pichavant, M., Di Carlo, I., Champallier, R., Wille, G., Castro, J. M., et al. (2021). Experimental Constraints on the Crystallization of Silica Phases in Silicic Magmas. J. Petrol. 62, egab004. doi:10.1093/petrology/egab004
Martel, C. (2012). Eruption Dynamics Inferred from Microlite Crystallization Experiments: Application to Plinian and Dome-Forming Eruptions of Mt. Pelee (Martinique, Lesser Antilles). J. Petrol. 53 (4), 699–725. doi:10.1093/petrology/egr076
Metcalfe, A., Moune, S., Komorowski, J.-C., Kilgour, G., Jessop, D. E., Moretti, R., et al. (2021). Magmatic Processes at La Soufrière de Guadeloupe: Insights from Crystal Studies and Diffusion Timescales for Eruption onset. Front. Earth Sci. 9. doi:10.3389/feat.2021.617294
Mollard, E., Martel, C., and Bourdier, J.-L. (2012). Decompression-induced Crystallization in Hydrated Silica-Rich Melts: Empirical Models of Experimental Plagioclase Nucleation and Growth Kinetics. J. Petrol. 53, 1743–1766. doi:10.1093/petrology/egs031
Newman, S., and Lowenstern, J. B. (2002). VOLATILECALC: a Silicate Melt-H2O-CO2 Solution Model Written in Visual Basic for excel. Comput. Geosci. 28 (5), 597–604. doi:10.1016/s0098-3004(01)00081-4
Ostorero, L., Boudon, G., Balcone-Boissard, H., Morgan, D. J., d’Augustin, T., and Solaro, C. (2021). Time-window into the Transcrustal Plumbing System Dynamics of Dominica (Lesser Antilles). Sci. Rep. 11, 11440. doi:10.1038/s41598-021-90831-1
Pichavant, M., Poussineau, S., Lesne, P., Solaro, C., and Bourdier, J.-L. (2018). Experimental Parametrization of Magma Mixing: Application to the Ad 1530 Eruption of La Soufrière, Guadeloupe (Lesser Antilles). J. Petrol. 59, 257–282. doi:10.1093/petrology/egy030
Preece, K., Gertisser, R., Barclay, J., Berlo, K., and Herd, R. A.Edinburgh Ion Microprobe Facility (2014). Pre- and Syn-Eruptive Degassing and Crystallisation Processes of the 2010 and 2006 Eruptions of Merapi Volcano, Indonesia. Contrib. Mineral. Petrol. 168, 1061–1086. doi:10.1007/s00410-014-1061-z
Preece, K., Gertisser, R., Barclay, J., Charbonnier, S. J., Komorowski, J.-C., and Herd, R. A. (2016). Transitions between Explosive and Effusive Phases during the Cataclysmic 2010 Eruption of Merapi Volcano, Java, Indonesia. Bull. Volcanol. 78, 54–70. doi:10.1007/s00445-016-1046-z
Riker, J. M., Cashman, K. V., Rust, A. C., and Blundy, J. D. (2015). Experimental Constraints on Plagioclase Crystallization during H2O- and H2O-CO2-Saturated Magma Decompression. J. Petrol. 56, 1967–1998. doi:10.1093/petrology/egv059
Robertson, R., Cole, P., Sparks, R. S. J., Harford, C., Lejeune, A. M., McGuire, W. J., et al. (1998). The Explosive Eruption of Soufriere Hills Volcano, Montserrat, West Indies, 17 September, 1996. Geophys. Res. Lett. 25, 3429–3432. doi:10.1029/98gl01442
Rosas-Carbajal, M., Komorowski, J.-C., Nicollin, F., and Gibert, D. (2016). Volcano Electrical Tomography Unveils Edifice Collapse hazard Linked to Hydrothermal System Structure and Dynamics. Sci. Rep. 6, 29899. doi:10.1038/srep29899
Rutherford, M. J., and Gardner, J. E. (2000). “Rates of Magma Ascent,” in Encyclopedia of Volcanoes. Editor H. Sigurdsson (San Diego, CA: Academic Press), 207–217.
Schipper, C. I., Castro, J. M., Tuffen, H., Wadsworth, F. B., Chappell, D., Pantoja, A. E., et al. (2015). Cristobalite in the 2011-2012 Cordón Caulle Eruption (Chile). Bull. Volcanol. 77, 34–53. doi:10.1007/s00445-015-0925-z
Semet, M. P., Vatin-Pérignon, N., Vincent, P. M., and Joron, J. L. (1981). L'éruption du XVIème siècle de La Soufrière de Guadeloupe. Mèlange de magmas et dynamismes èruptifs. Bull. PIRPSEV 60, 63.
Solaro, C., Balcone-Boissard, H., Morgan, D. J., Boudon, G., Martel, C., and Ostorero, L. (2020). A System Dynamics Approach to Understanding the Deep Magma Plumbing System beneath Dominica (Lesser Antilles). Front. Earth Sci. doi:10.3389/feart.2020.574032
Sparks, R. S. J., and Young, S. R. (2002). “The Eruption of Soufrière Hills Volcano, Montserrat (1995-1999): Overview of Scientific Results,” in The Eruption of Soufrière Hills Volcano, Montserrat, from 1995 to 1999. Editors T. H. Druitt, and B. P. Kokelaar (London: Geological Society of London), 21, 45–69. doi:10.1144/gsl.mem.2002.021.01.03
Spence, R., Komorowski, J.-C., Saito, K., Brown, A., Pomonis, A., Toyos, G., et al. (2008). Modelling the Impact of a Hypothetical Sub-plinian Eruption at La Soufrière of Guadeloupe (Lesser Antilles). J. Volcanol. Geotherm. Res. 178, 516–528. doi:10.1016/j.jvolgeores.2008.03.016
Surono, , Jousset, P., Pallister, J., Boichu, M., Buongiorno, M. F., Budi-santoso, A., et al. (2012). The 2010 Explosive Eruption of Java's Merapi Volcano - A ‘100-year’ Event. J. Volcanol. Geotherm. Res. 214-242, 121–135. doi:10.1016/j.jvolgeores.2012.06.018
Taisne, B., and Jaupart, C. (2008). Magma Degassing and Intermittent Lava Dome Growth. Geophys. Res. Lett. 35, L20310. doi:10.1029/2008gl035432
Toramaru, A., Noguchi, S., Oyoshihara, S., and Tsune, A. (2008). MND(microlite Number Density) Water Exsolution Rate Meter. J. Volcanol. Geotherm. Res. 175, 156–167. doi:10.1016/j.jvolgeores.2008.03.035
Toramaru, A. (2006). BND (Bubble Number Density) Decompression Rate Meter for Explosive Volcanic Eruptions. J. Volcanol. Geotherm. Res. 154, 303–316. doi:10.1016/j.jvolgeores.2006.03.027
Touboul, M., Bourdon, B., Villemant, B., Boudon, G., and Joron, J.-L. (2007). 238U-230Th-226Ra Disequilibria in Andesitic Lavas of the Last Magmatic Eruption of Guadeloupe Soufriere, French Antilles: Processes and Timescales of Magma Differentiation. Chem. Geol. 246, 181–206. doi:10.1016/j.chemgeo.2007.09.009
Villemant, B., Hammouya, G., Michel, A., Semet, M. P., Komorowski, J.-C., Boudon, G., et al. (2005). The Memory of Volcanic Waters: Shallow Magma Degassing Revealed by Halogen Monitoring in thermal Springs of La Soufrière Volcano (Guadeloupe, Lesser Antilles). Earth Planet. Sci. Lett. 237, 710–728. doi:10.1016/j.epsl.2005.05.013
Villemant, B., Komorowski, J. C., Dessert, C., Michel, A., Crispi, O., Hammouya, G., et al. (2014). Evidence for a New Shallow Magma Intrusion at La Soufrière of Guadeloupe (Lesser Antilles). J. Volcanol. Geotherm. Res. 285, 247–277. doi:10.1016/j.jvolgeores.2014.08.002
Vincent, P. M., Vatin-Pérignon, N., Semet, M., and Cheminée, J. L. (1979). Le dôme de La Soufrière (Guadeloupe), son âge et son mode de mise en place. C. R. Acad. Sc. Paris 288 (D), 51–54.
Keywords: microlite, ascent rate, outgassing, rhyolitic melt, sub-plinian
Citation: Martel C, Pichavant M, Balcone-Boissard H and Boudon G (2021) Syn-Eruptive Conditions of the AD 1530 Sub-Plinian Eruption of La Soufrière of Guadeloupe (Lesser Antilles). Front. Earth Sci. 9:686342. doi: 10.3389/feart.2021.686342
Received: 26 March 2021; Accepted: 27 October 2021;
Published: 19 November 2021.
Edited by:
Michael Robert Carroll, University of Camerino, ItalyReviewed by:
Pier Paolo Giacomoni, University of Ferrara, ItalyCopyright © 2021 Martel, Pichavant, Balcone-Boissard and Boudon. This is an open-access article distributed under the terms of the Creative Commons Attribution License (CC BY). The use, distribution or reproduction in other forums is permitted, provided the original author(s) and the copyright owner(s) are credited and that the original publication in this journal is cited, in accordance with accepted academic practice. No use, distribution or reproduction is permitted which does not comply with these terms.
*Correspondence: Caroline Martel, Y2Fyb2xpbmUubWFydGVsQGNucnMtb3JsZWFucy5mcg==
Disclaimer: All claims expressed in this article are solely those of the authors and do not necessarily represent those of their affiliated organizations, or those of the publisher, the editors and the reviewers. Any product that may be evaluated in this article or claim that may be made by its manufacturer is not guaranteed or endorsed by the publisher.
Research integrity at Frontiers
Learn more about the work of our research integrity team to safeguard the quality of each article we publish.