- 1Key Laboratory of Deep Oil and Gas, China University of Petroleum (East China), Qingdao, China
- 2Geology Scientific Research Institute of Shengli Oilfield Company, Sinopec, Dongying, China
Although China has enormous shale oil resource potential, oil recovery is limited at present, largely because its movable resource is not evaluated. In this study, an evaluation method for movable shale oil resources is proposed. The process first evaluates the total shale oil resource (Qtotal), and then two-dimensional nuclear magnetic resonance (NMR) technology is used to measure the free oil ratio (Rfree) and further define the quantitative relationship (F) between the movable ratio (Rm) in the free oil and centrifugal force. The movable oil resource is calculated by the total shale oil resource, free oil ratio, and movable oil ratio (Qm = Qtotal × Rfree × Rm). This method was applied to the Shahejie Formation of the Dongying Sag, Jiyang Depression, in Bohai Bay Basin, and the relationship between the free oil ratio (Rfree) and depth was established based on several core 2D NMR data. Based on the formation pressure, flowing bottom hole pressure, and relationship (F), the movable shale oil ratio (Rm) in the target area was determined. The results showed that the movable shale oil ratio (Rm) of the lower Es3 is approximately 18.9–20% in the depth range of 3,200–3,700 m, and the movable shale oil resource is approximately 2.52 × 10⁸ t.
Introduction
After decades of development, the global shale oil and gas boom led by the United States has entered an active period of discovery, and unconventional oil and gas has now become an important part of global oil and gas growth (Capuano, 2018; Us Eia, 2019). The successful exploitation of shale oil and gas has greatly improved the oil and gas self-sufficiency rates of the United States. In 2018, the total energy consumption of the United States was 28 × 108 t oil equivalent, total production was 21.1 × 10⁸ t oil equivalent, and external dependence was only 8.3%. The country may achieve “Energy independence” in 2022 (Zou et al., 2020). In 2019, China’s crude oil import volume reached 505.72 million tons, and its degree of dependence on foreign countries reached 70.8%. To meet national energy security needs, China must strengthen its oil exploration and development (CEP, 2020). Currently, China has achieved remarkable results in unconventional oil and gas exploration and development, especially the rapid growth in tight oil, tight gas, and shale gas production, which makes the exploration and development of shale oil rise to national strategic prominence (Li and Zhu, 2020a).
In recent years, China's Ministry of Natural Resources (Ministry of Land and Resources), PetroChina, Sinopec, and other companies have launched shale oil resource evaluations. In 2014, the shale oil resource in Sinopec’s exploration area was approximately 204 × 108 t. In 2016, PetroChina estimated that the shale oil resource in its exploration area was approximately 145 × 108 t, and simultaneously, the evaluation by the Ministry of Land and Resources showed that the shale oil resource in China was 153 × 108 t. Specifically, continental shale oil in China is mainly developed in the Permian, Cretaceous, and Paleogene. The favorable shale oil area of the Permian Lucaogou Formation in the Jimusaer Sag, Junggar Basin is 11.12 × 10⁸ t, where large-scale production began in 2019 (Wu B. C. et al., 2019; Guo et al., 2019; Lv et al., 2019; Zhi et al., 2019). The Paleogene Kongdian Formation and Shahejie Formation in the Cangdong Sag in Bohai Bay Basin also have good oil and gas resource potential, and the total shale oil resources of fifteen vertical wells in the second member of the Kongdian Formation are estimated to be 6.8 × 10⁸ t (Pu et al., 2019; Zhao et al., 2019). Lu et al. (2016a) showed that the total amount of oil trapped in the Bonan Sag shale with an area of less than 1,000 km2 in the Shengli oilfield is as high as 88 × 108 t. Moreover, Song et al. (2013) estimated the shale oil resource of the lower Es3 in the Bonan Sag to be 5.47 × 10⁸ t. In addition, Daqing oilfield performed a geological evaluation of the shale of the first Qingshankou Formation member in the Qijia–Gulong to Sanzhao area of the Songliao Basin and obtained many industrial flowing oil wells, such as Guyeyouping 1 (Wu H. Y. et al., 2019). Although high initial production can be obtained using fracturing technology from shale oil exploration wells, with time, shale oil production decreases rapidly, resulting in poor economic benefits from those wells (Chen F. et al., 2019; Wang et al., 2019; Lv et al., 2020). This is because under geological conditions, shale oil in the pores is not completely movable due to the limitations in reservoir physical properties and formation pressure.
The marine shale oil mobility was characterized by the geochemical parameter OSI (oil saturation index) = S1/TOC × 100. Some scholars also use this method to characterize the mobility of continental shale oil. It is considered that there is a certain lower limit for OSI in the study area, and shale oil can flow only when it exceeds this value (Jarvie and Daniel, 2012; Wang et al., 2015; Xue et al., 2015; Jiang et al., 2016). Zhou et al. (2016) analyzed movable fluids in marine shale reservoirs in southern China through NMR-centrifugal experiments and discussed the fluid mobility under optimal centrifugal force conditions. Wang et al. (2010) discussed the mobility of crude oil in low-permeability reservoirs by NMR displacement experiments on cores from the Yanchang Formation in the Ordos Basin. Zhang et al. (2014) analyzed continental shale oil mobility from the perspective of formation energy. The above research methods accelerated the understanding of shale oil mobility to accurately evaluate movable shale oil resources. However, due to the constraints of geological data and geological conditions, some methods need to be improved. When analyzing shale oil mobility by NMR centrifugation, only considering shale oil mobility under the condition of optimal centrifugal force is not an actual geological condition. Different driving forces of shale oil under different formation overpressures lead to different mobilities. Because of the smaller pore throat structure and stronger hydrocarbon–rock interaction in shale reservoirs, the feasibility and effectiveness of the displacement experiment technology remain debatable.
In this study, a new method for evaluating movable shale oil resources is proposed. The movable shale oil resource (Qm) was calculated using the total shale oil resource (Qtotal), free oil ratio (Rfree), and movable oil ratio (Rm). The application of this method is introduced by considering the Shahejie Formation in the Dongying Sag as an example. This method is of great significance for finding the “sweet spot” in shale oil, thereby guiding future exploration and development.
Methods
The lacustrine shale reservoirs in China are characterized by large thickness, strong longitudinal heterogeneity, ultra-low porosity, ultra-low permeability, and ultra-strong hydrocarbon–rock interaction. Therefore, shale oil mobility should be fully considered while evaluating the degree of shale oil recovery (Lu et al., 2016a). For the above reasons, based on total shale oil resources (Qtotal) and free shale oil resources (Qfree), a new method for evaluating movable shale oil resources (Qm) is established in this study. The specific ideas are as follows.
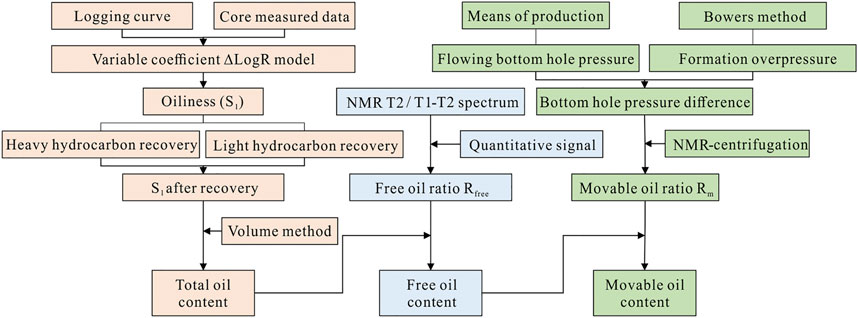
First, combined with conventional logging curves and measured core data, an improved ΔlogR model was used to evaluate the organic heterogeneity and obtain the vertical variation in S1 (Huang et al., 2014; Lu et al., 2017). Then, the total shale oil resources (Qtotal) were calculated using S1 light and heavy hydrocarbon corrections (Wang et al., 2014; Li et al., 2016; Xue et al., 2016). Second, after clarifying the total resource calculation results, to calculate free shale oil resources (Qfree), it was necessary to use the nuclear magnetic resonance (NMR) T1–T2 spectrum to evaluate the free oil ratio (Rfree). Finally, the quantitative relationship (F) between the movable ratio (Rm) in free oil and centrifugal force (ΔP = formation overpressure—flowing bottom hole pressure) was further defined by a centrifugal experiment, and the movable oil resource was calculated using the total shale oil resource, free oil ratio, and movable oil ratio (Qm = Qtotal × Rfree ×Rm). The evaluation process is illustrated in Figure 1.
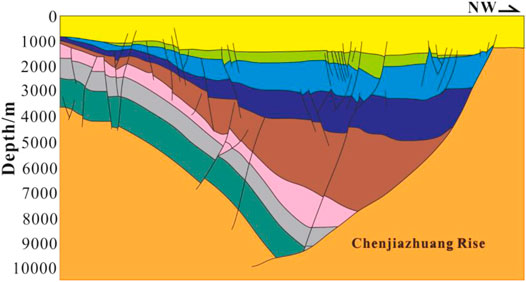
FIGURE 2. Present day north to south structural section of Dongying Depression (modified after Song et al., 2014).
Case Study
Geological Setting
The Dongying Sag is a secondary structural unit located in the Jiyang Depression in the Bohai Bay rift basin in eastern China, which is a typical dustpan structure with “north fault and south overlap” characteristics. The sag starts from Qingtuozi uplift in the east and ends at Qingcheng uplift in the west and starts from Luxi uplift in the south and ends at Chenjiazhuang uplift in the north. Overall, the sag trends east–west, and the northern fault activity is relatively developed, which controls the structural evolutionary characteristics of the entire sag (Figure 3). A large set of lacustrine shales in the lower sub-member of the Shahejie Formation (Es3x) developed in a brackish water environment (Zhang et al., 2014; Zhu et al., 2019). The lithology is mainly layered with laminar shales of high carbonate content. The organic carbon content of Es3x shales ranges between 1 and 5% and contain type Ⅰ and type Ⅱ1 organic matter, with a small amount of type Ⅱ2 kerogen. The shale burial depth is between 1,500 and 4,000 m, and most shales are mature. These characteristics define a set of favorable source rocks with high abundance and good organic matter qualities (Wang et al., 2019).
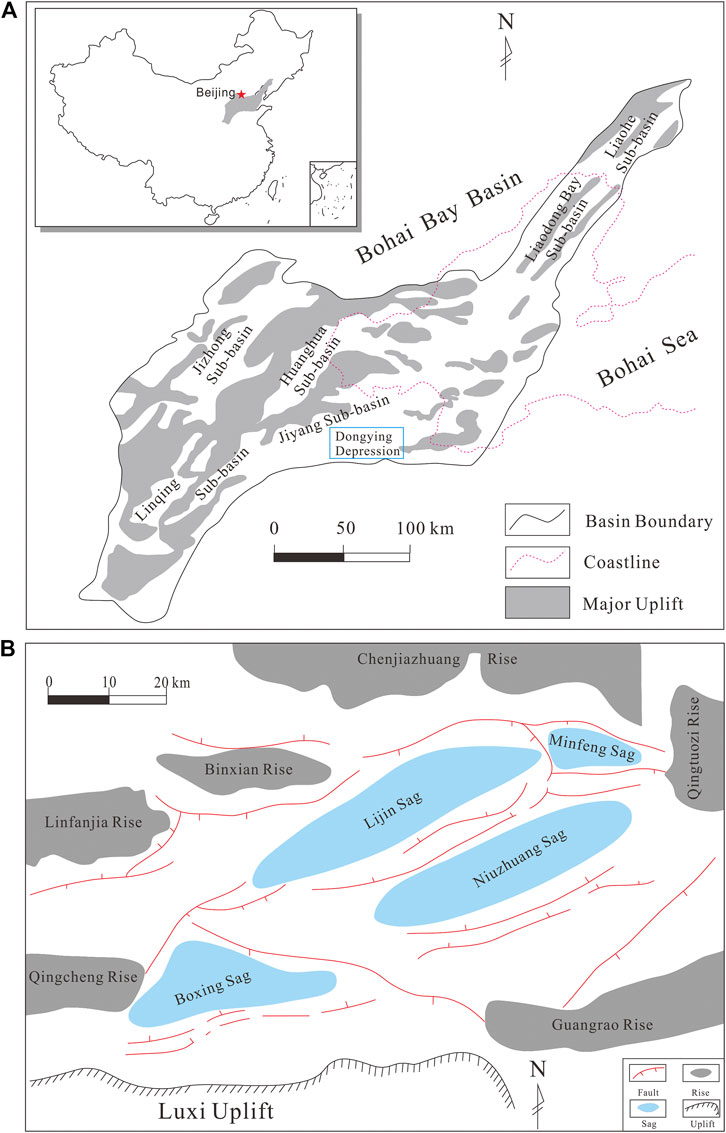
FIGURE 3. Location map of study area (A) schematic map of Bohai Bay Basin and its location in China. (B) Location of Dongying Depression (modified after Zhang et al., 2020).
According to the response characteristics of lithology and logging curves, the lower Es3 sub-member of the Dongying Sag is subdivided into four sub-layers (Li, 2012; Zhang S. et al., 2015; Liu, 2018). By estimating the thickness of each sub-layer, the thickness contour of each layer is established (Figure 4). Figure 4 shows that the thick center is the center of each depression, and the maximum thickness is between 100 and 150 m. An area of approximately 2,468.21 km2 is calculated as the effective area.
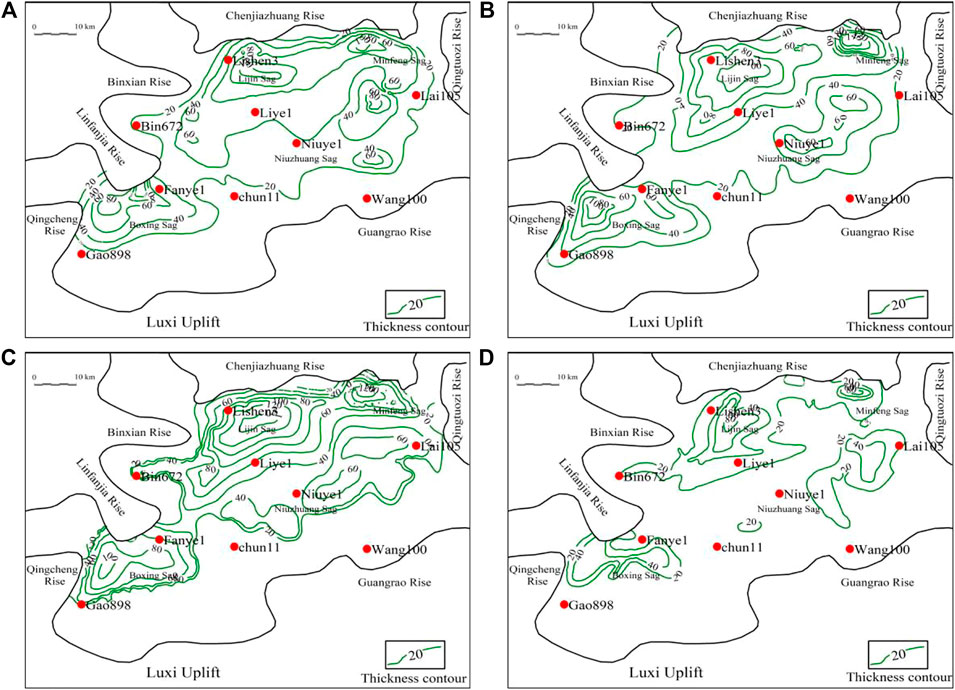
FIGURE 4. Thickness contour map of each sub layer in Es3x (A): first sub layer; (B): second sub layer; (C): third sub layer; (D): fourth sub layer).
Experiment
Pressure Saturation Experiment
Rock samples were dried at 60°C for 24 h to remove impurities and placed in a vacuum pressure saturator. First, the rock sample was held at a 1 × 10⁻⁴ Pa vacuum for 24 h. The sample was then saturated with n-dodecane at 20 MPa. The saturated samples were measured at different times and when the quality was stable (the test variability was within 0.5%), the rock samples were considered to be saturated.
Nuclear Magnetic Resonance Experiment
NMR experiments were performed using a micromr23-060h-1 instrument from Shanghai Niumag Company. The instrument was operated at a resonance frequency of 21.36 MHz and magnetic strength of 0.5 T using a 25.4 mm coil diameter; the magnet temperature was maintained at 32°C. When testing the T2 and the T1–T2 spectra, the Carr–Purcell–Meiboom–Gill (CPMG) sequence was used. For inversion recovery, the CPMG (IR-CPMG) sequence was detected for the T1-T2 spectrum. The measurement parameters used an echo time (TE) of 0.07 ms, waiting time (TW) of 1,000 ms, 90 pulse width (P90) of 5.4 μs, and included 32 scans and 6,000 echoes.
Centrifugation Experiment
In this centrifugal experiment, the saturated oil sample was placed in the rotor of a CSC-12 centrifuge for 8 h. The properties of the centrifuge were as follows: rotor radius, 13.5 cm; centrifugal temperature, 21°C; The centrifugal rotation speed was increased by 2000 rotations until the rotation speed was 12,000 rotations, and the corresponding centrifugal forces were 0.08, 0.33, 0.75, 1.34, 2.09, and 3.01 MPa. Six centrifugation experiments were performed.
Evaluation of Total Shale Oil Resource
The total shale oil resource is the total amount of shale oil contained in the shale reservoir. The total shale oil resource evaluation method is roughly divided into dynamic and static categories. The former uses the dynamic parameters during reservoir development to calculate shale oil resources through numerical simulation, decline curve calculations, and material balance, which uses static parameters to calculate the total shale oil resources. Because of the different calculation methods, they can be subdivided into analog, statistical, and genetic methods (Wang et al., 2014; Wright et al., 2015; Lu et al., 2016b; Chen et al., 2017).
The analog method is typically used to evaluate areas with low exploration degree. It considers an area with a high exploration degree as the analog area, mainly based on the estimated ultimate recoverable reserves (EUR) of production wells. It includes the FORSPAN model and its improved method from the U.S. Geological Survey (Schmoker, 2002; Salazar et al., 2010). In 2010, in Calgary, Canada, the Third International Symposium on oil and gas resource evaluation methods was held. Hood of ExxonMobil used this method to accurately evaluate reservoirs with continuous oil and gas distributions (Hood et al., 2012).
The statistical method, subdivided small area unit volume method, and stochastic simulation method are used to establish relevant mathematical models to predict future change processes according to the known system behavior. Among them, the small area unit volume method is often used by the International Energy Agency (EIA). Almanza used the small area unit volume method to evaluate the tight oil of the Bakken Formation in the Elm Coulee Oilfield in the Williston Basin in 2011 (Guo et al., 2015). In 2010, after summarizing the shortcomings of the traditional analog method, Olea et al. (2010) proposed a stochastic simulation method. Chen and Kirk (2013) used a stochastic simulation method to evaluate tight oil resources in the Cardium Formation of the Upper Cretaceous Colorado Group in the Western Canada Sedimentary Basin. The results showed that the total resources of tight oil in the work area were 29 × 108 m3.
The genetic method evaluation process embodies the principles of oil and gas generation, migration, and accumulation in reservoirs. The residual amount of oil and gas in the final stage is determined by calculating the generation, adsorption, discharge, and loss of hydrocarbons in the source rock. The genetic method can be divided into volume, material balance, and so on. The volume method is the most effective and applicable method for calculating shale oil resources by multiplying the residual hydrocarbon content in shale by the shale volume. Therefore, it is the most commonly used method in the shale oil exploration stage in China. Liu et al. (2013), Yang et al. (2013), Liu B. et al. (2014), Lu et al. (2016b) and Zhu et al. (2019) evaluated the shale oil resource of Malang sag of Santanghu basin, Ordos Basin, Qingshankou formation of Songliao Basin, Damintun Sag, and Dongying sag of Bohai Bay Basin, by volume method, respectively. To obtain the final resource amounts, the material balance method focuses on the calculation of hydrocarbon generation, expulsion, and loss through geochemical parameters (Jiang et al., 2002). Chen et al. (2020) evaluated the shale/tight oil resources of the Lucaogou Formation in the Jimusaer depression using the material balance method. However, the calculation models of hydrocarbon expulsion threshold, hydrocarbon generation conversion rate, and hydrocarbon expulsion efficiency involved in the material balance method are relatively complex, resulting in a low utilization rate of this method.
In practical applications, the volume method is subdivided into the chloroform pitch “A” method and pyrolysis S1 method (Song et al., 2013; Zhu et al., 2015; Li et al., 2020c). In this study, the pyrolysis S1 method was used to calculate the total shale oil resources. The pyrolysis parameter S1 represents the thermal evaporation of the rock below 300 °C during pyrolysis heating. It is the hydrocarbon that has been generated in the source rock but has not been discharged, which is the object of shale oil evaluation and exploration. The calculation formula is as follows:
where Qtotal is total shale oil resource, h is the effective shale thickness, S is effective shale area, ρ is shale density, measured density of the sample is 1.9–2.6 g/cm3 (Zhu et al., 2019), S1 is pyrolytic hydrocarbon content, KL is the light hydrocarbon correction coefficient of S1, and KH is the heavy hydrocarbon correction factor of S1.
In this study, the variable coefficient ΔlogR model was used to evaluate the vertical change in parameter S1. This method is based on the minimum error between the core measured data and the predicted log value and automatically selects the baseline and optimizes the scale factor K (Liu C. et al., 2014). Huang et al. (2014) and Li et al. (2020c) used this method to evaluate the organic heterogeneity of the Shahejie Formation in the Songliao Basin Bonan and Qingshankou formations, and the results were in good agreement with the measured data. The variable coefficient ΔlogR model calculation was completed by a computer. The calculation model is as follows:
where R and Rbaseline are the measured value and the baseline value of the resistivity log(Ω·m); Δt and Δtbaseline are the measured value and the baseline value of the acoustic log(Ω·m); K is the proportion of the resistivity part in ΔlogR model, ranging from 0 to 1; and A and B are fitting coefficients.
Previous studies have shown that hydrocarbons with low molecular weights are lost during transportation, preservation, and sample preparation (Jarvie and Daniel, 2012; Michael, 2013; Wang et al., 2014). The methods of light hydrocarbon recovery include component hydrocarbon generation kinetics, formation volume coefficient, chromatography, experimental comparison, and material balance (Jarvie and Daniel, 2012; Michael, 2013; Wang et al., 2014; Zhu et al., 2015; Chen et al., 2018; Chen Z. et al., 2019). In addition, by comparing the pyrolysis experiments of the extracted and unextracted samples, it was found that when measured at 300°C, there were still some high carbon numbers that could not be pyrolyzed, resulting in a low measured S1 value (Delvaux et al., 1990). Heavy hydrocarbon recovery methods include the comparison of pyrolysis parameters of shale before and after extraction, comparison of the cumulative sum of the FID curve of pyrolysis before and after extraction, and comparison of hydrocarbon generation kinetic parameters of shale organic matter before and after extraction (Wang and Zheng, 1987; Wang et al., 2014; Li et al., 2019).
The heavy hydrocarbon correction of S1 is carried out by looking for the relationship between S1 and chloroform pitch “A.” As shown in Figure 5A, the heavy hydrocarbon correction coefficient (KH) is 2.588 in this area. For the light hydrocarbon correction coefficient of S1, this study adopts the relationship between the light hydrocarbon recovery coefficient (KL) and depth established by Zhu et al. (2015). As shown in Figure 5B, with an increase in depth, the light hydrocarbon recovery coefficient gradually increases, which can be interpreted as the maturity of the source rock increases with the increase in depth, resulting in more light components, which are more likely to be lost in the process of handling and preservation.
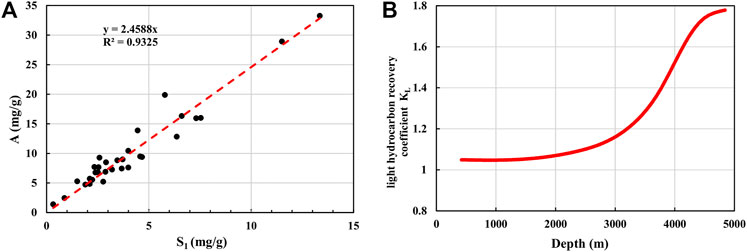
FIGURE 5. Heavy hydrocarbon recovery coefficient (A) and light hydrocarbon recovery coefficient (B) [modified after Zhu et al. (2015)]
Evaluation of Free Shale Oil Resource
It is generally considered that shale oil mainly exists in the adsorbed and free states in the reservoir, and the content of free shale oil plays a major role in shale oil productivity. Theoretically, the maximum movable shale oil resource is directly determined by the free oil content (Zhang et al., 2012; Zou et al., 2013; Jiang et al., 2016; Ning et al., 2017; Li et al., 2019; Wang et al., 2019). Therefore, the calculation of movable shale oil resources should first clarify the free oil content in shale reservoirs.
It is not easy to determine the free state of shale oil. Different scholars have analyzed extensively from different angles (Ribeiro et al., 2009; Zhang L. Y. et al., 2015; Jiang et al., 2016; Li et al., 2016; Qian et al., 2017; Li et al., 2018; Li et al., 2019). One approach is to directly determine the free state shale oil content through experimental methods such as stepwise solvent extraction, heating release, and NMR. The second method is to determine the adsorbed shale oil content and calculate the amount of free oil from the difference between the total and adsorbed oil contents. The main method in the laboratory is the adsorption experiment of an oil solution (swelling experiment). Compared with the complicated and cumbersome analytical process of the solvent stepwise extraction method, the heating release method is relatively simple and easy to implement (Jiang et al., 2016). However, it is debatable whether the thermally released hydrocarbons at a certain temperature in the heating release method are all adsorbed or free compounds are present (Li et al., 2019). In this study, the free shale oil content was determined using the NMR method according to the distribution position of different hydrogen components in the NMR T2/T1–T2 spectrum (Li et al., 2018; Li et al., 2020b).
Because the rock samples are stored in the laboratory after extraction, light hydrocarbon loss will occur. To determine the free oil content of the saturated shale under the formation conditions, the rock sample needs to be pressurized and saturated, and then the free oil content of the saturated shale can be calculated according to the NMR T1–T2 spectrum. Due to the limitations in the experimental equipment, the NMR T1–T2 spectrum test time is long (40 min), and the light components can be lost during the test. To avoid the above situation, this study combines the NMR T1 spectrum (1 min) and NMR T1–T2 spectrum technology to characterize the free oil content of saturated shale. The test process was as follows.
First, core samples with different lithofacies and maturity were selected to test the NMR T1–T2 spectrum, and the signal values of kerogen, adsorbed water, free water, and structural water were quantitatively evaluated. Second, the rock samples were saturated under pressure, and the samples after saturation were analyzed by NMR T2 spectra. According to the signal difference of kerogen, adsorbed water, free water, and structural water evaluated by the NMR T2 and NMR T1–T2 spectra, the adsorbed oil and free oil contents in saturated samples were obtained.
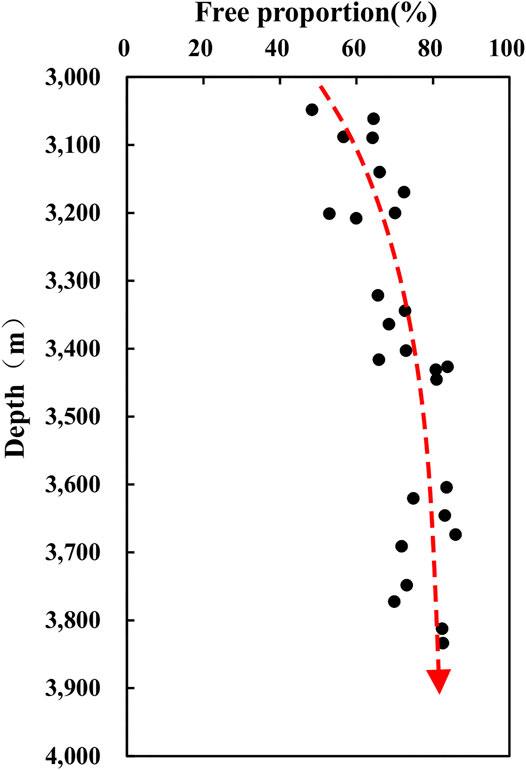
Based on the results of Li et al. (2020b), the 1-ms relaxation time in the T2 spectrum was determined as the boundary between the adsorbed oil and free oil, and then the evolution chart between the free oil ratio (Rfree) and the depth of saturated oil shale was established according to the relationship between oil/water signal intensity and volume/mass in the NMR T2/T1–T2 spectrum (Figure 6). Finally, according to this chart and the total shale oil resources calculated above, the free shale oil resources were estimated.
Evaluation of Movable Shale Oil Resource
As mentioned above, the resource potential of free shale oil represents the theoretical maximum movable resource potential. However, restricted by factors such as the size and shape of pores throats, free shale oil cannot drain completely. Therefore, an accurate evaluation of the movable shale oil resource potential is of great significance in the exploration for “sweet spots.” The important factor that restricts the evaluation accuracy of movable shale oil resources is shale oil mobility (Lu et al., 2016a; Chen F. et al., 2019). Hence, as the introduction describes, many scholars have conducted extensive research on shale oil mobility.
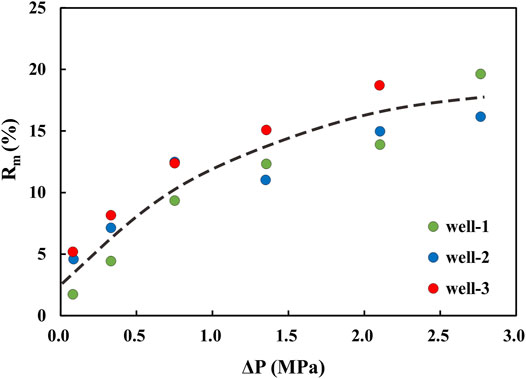
Based on previous research results and considering the actual formation conditions, to retain the residual oil and water in shale, this study performed the pressure saturation treatment on the unwashed oil shale samples and established an evolution chart of the shale oil movable ratio (movable oil/free oil) under different centrifugal forces according to the NMR centrifugal experiment. As shown in Figure 7, the relationship between the shale oil movable ratio and centrifugal force conforms to a Langmuir shape, that is, a curve passing through the origin. With the increase in centrifugal force, the shale oil movable ratio increases, and the rate of increase gradually decreases. The model can be expressed as follows:
where Rm is the movable ratio, ΔP is the centrifugal pressure, Rf is the theoretical maximum movable ratio, and ΔPL is the median pressure.
The above equation is further rewritten as follows:
By plotting the relationship between 1/movable ratio and 1/centrifugal force, the theoretical maximum movable ratio (Rf) and median pressure (ΔPL) of shale oil can be obtained. When applied to the target horizon in the study area, Rf was 20.83 and ΔPL was 1.09. Therefore, the mathematical expression of the shale oil movable ratio is as follows (Eq. 6):
Eq. 6 shows that the difference in production pressure, that is, the difference between the formation overpressure evaluation and flowing bottom hole pressure, needs to be determined when calculating movable shale oil resources by the movable ratio. Hence, this study performed a formation overpressure evaluation and bottom hole flow pressure evaluation. At present, some scholars have explored different quantitative evaluation methods for overpressure caused by different origins; however, they mainly rely on logging methods to analyze the relationship between porosity (acoustic curve, density) and stress (depth) to determine the reason of overpressure. The main methods for the quantitative overpressure prediction are direct estimation, effective vertical stress, effective horizontal stress (e.g., Eaton method), and other effective stress methods (e.g., Bowers method) (Hottmann and Johnson, 1965; Magara and Kinji, 1978; Bilgeri and Ademeno, 1982; Eaton and Eaton, 1997; Dutta, 2002; Xue et al., 2004; Wen, 2019). This study comprehensively analyzes the advantages and disadvantages of the above methods and their applicable conditions and combines the characteristics of the stratigraphic development in the study area to use the Bowers method for overpressure evaluation. The Bowers method is divided into loading and unloading curves. The normal compaction and under-compacted formations are on the loading curve, and the fluid expansion-causing formations are on the unloading curve. The corresponding mathematical expressions were established as follows:
Loading:
Unloading:
where v is acoustic velocity (m/s), vmax is acoustic velocity at the inflection point (m/s), σ is vertical effective stress (kPa), A and B are constant parameters, P0 is overburden pressure, PP is pore pressure, σmax is effective stress at the unloading point (kPa), and U is the elastic coefficient.
Based on the above method combined with actual geological data, this study establishes an overpressure identification equation for the work area (Eq. 10 and Eq. 11). Using this method, the formation pressure coefficient of each well position was calculated, and the formation pressure of the target layer was predicted.
Loading:
Unloading:
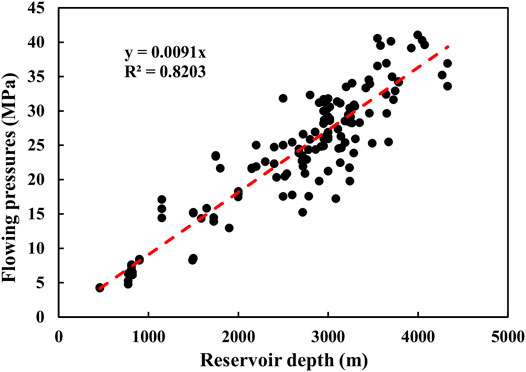
The flowing bottom hole pressure is an important parameter for calculating the movable ratio. There has been considerable research on the evaluation of flowing bottom hole pressure in conventional gas and coalbed methane, and the common methods are the average temperature average deviation coefficient, Cullender–Smith, Chen Jialang–Yue Xiangan, Podio modified “s” curve, and Hasan Kabir analytical methods (Cullender and Smith, 1956; Aziz and Khalid, 1967; Hasan and Kabir, 1988; Mccoy et al., 1988; Chen et al., 1994). For the flowing bottom hole pressure calculation in shale oil wells, good correlation was observed between oil layer depth and flowing bottom hole pressure through intuitive statistics of several well test reports and completion reports in oilfield geological production data (Figure 8), thereby establishing the calculation formula for the flowing bottom hole pressure.
Results and Discussion
The total shale oil, free shale oil, and movable shale oil resources were calculated through the above process. The results show that the total oil resource of the Es3x in the Dongying Sag was 50.7 × 10⁸ t, free oil resource was 12.87 × 10⁸ t, and movable oil resource was 2.52 × 10⁸ t. The second and third layers were more abundant, accounting for 74% of Es3x (Table 1). The movable ratio of shale oil (movable oil/free oil) was approximately 18.9–20% within a buried depth of 3,200–3,700 m. According to the plane distribution characteristics of the total shale oil resource abundance in the Es3x in Dongying Sag (considering the first lower layer of Es3x as an example), shale oil resources were mainly distributed in each sag belt, gradually decreasing from the center to the edge of the sag, and Lijin Sag was the most abundant, with relatively small resource potential near the Boxing and Niuzhuang depressions (Figure 9). From the plane distribution characteristics of free resource and movable resource abundances, compared with the total shale oil resource abundance, the shale oil enrichment area basically remains unchanged.
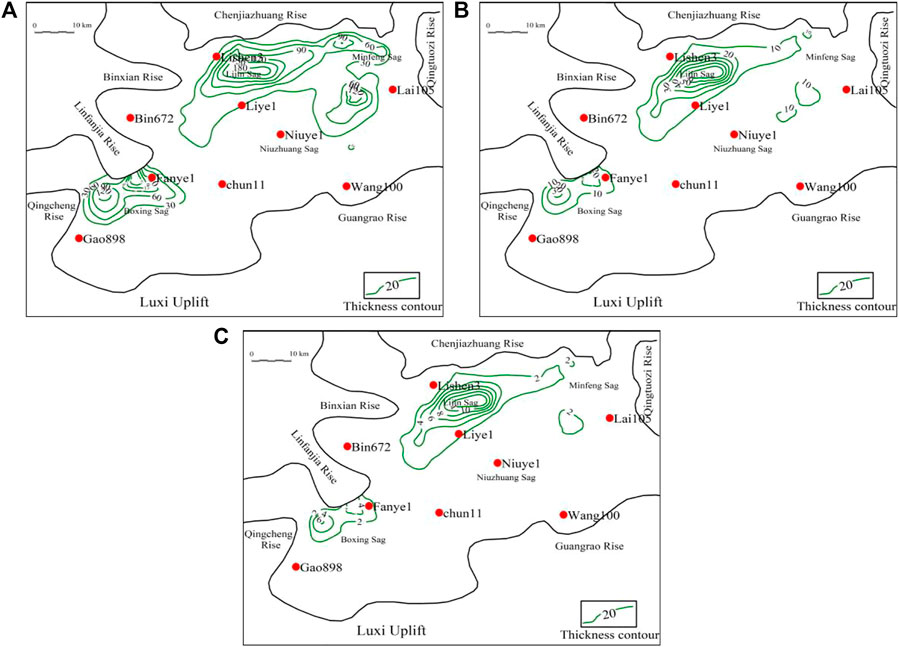
FIGURE 9. Resource abundance contour map of the Shahejie Formation Es3x in the Dongying Sag (A): total resource abundance; (B): free resource abundance; (C): movable resource abundance).
Conclusion
(1) This study explores the relationship between different centrifugal forces and movable ratios through NMR centrifugal experiments and proposes a new method for evaluating movable shale oil resources. When applied to geological conditions, the movable ratio of shale oil can be determined by evaluating the formation pressure and flowing bottom hole pressure, and then the movable oil resource can be estimated. The above method provides new insights for future shale oil resource evaluations.
(2) Considering the Dongying Sag as an example, this study calculates that the movable ratio of shale oil (movable oil/free oil) within the range of 3,200–3,700 m in Es3x is approximately 18.9–20%. The shale oil resource is 50.7 × 10⁸ t, free shale oil resource is 12.87 × 10⁸ t, and movable shale oil resource is 2.52 × 10⁸ t, of which the resources of the second and third layers account for approximately 74% of the resources of the Es3x.
(3) From the distribution of Es3x in Dongying Sag, the movable shale oil resource is mainly concentrated in the Lijin Sag, and the potential of movable shale oil resources near Boxing and Niuzhuang sags is low. The Lijin Sag is a favorable exploration area in the Es3x of the Dongying Sag.
Data Availability Statement
The raw data supporting the conclusion of this article will be made available by the authors, without undue reservation.
Author Contributions
LX, MW, JL, and ML contributed to the conception and design of the study. LX wrote the first draft of the manuscript and led the data analysis and interpreted the results with MW, ZL, RZ, and HL. All authors contributed to manuscript revision, read and approved it for publication.
Conflict of Interest
ZL, RZ, and HL were employed by the company Shengli Oilfield Company, SInopec.
The remaining authors declare that the research was conducted in the absence of any commercial or financial relationships that could be construed as a potential conflict of interest.
Acknowledgments
This study was funded by the National Natural Science Foundation of China (41922015, 42072147), Fundamental Research Funds for the Central Universities (20CX06085A) and Qingdao Postdoctoral (ZX20210070).
References
Aziz and Khalid (1967). Calculation of Bottom-Hole Pressure in Gas Wells. J. Pet. Techn. 19 (07), 897–899.
Bilgeri, D., and Ademeno, E. B. (1982). Predicting Abnormally Pressured Sedimentary Rocks*. Geophys. Prospect 30 (5), 608–621. doi:10.1111/j.1365-2478.1982.tb01329.x
Capuano, L. (2018). International Energy Outlook 2018 (IEO2018). Washington, DC, USA: US Energy Information Administration (EIA), 21.
Chen, F., Zhao, H., Wang, S., Lu, S., Wang, M., and Ding, X. (2019a). Evaluation of Movable Shale Oil Reserves in the Es1L of the Raoyang Sag, Jizhong Depression. Oil Gas Geol. 40 (03), 593–601. doi:10.11743/ogg20190314
Chen, G., Lu, S., Li, J., Xue, H., Wang, M., Tian, S., et al. (2017). A Method to Recover the Original Total Organic Carbon Content and Cracking Potential of Source Rocks Accurately Based on the Hydrocarbon Generation Kinetics Theory. J. Nanosci. Nanotechnol. 17 (9), 6169–6177. doi:10.1166/jnn.2017.14407
Chen, J., Pang, X., Pang, H., Chen, Z., and Jiang, C. (2018). Hydrocarbon Evaporative Loss Evaluation of Lacustrine Shale Oil Based on Mass Balance Method: Permian Lucaogou Formation in Jimusaer Depression, Junggar Basin. Mar. Pet. Geol. 91, 422–431. doi:10.1016/j.marpetgeo.2018.01.021
Chen, J., Pang, X., Wang, X., and Wang, Y. (2020). A New Method for Assessing Tight Oil, with Application to the Lucaogou Formation in the Jimusaer Depression, Junggar Basin, China. Bulletin 104 (6), 1199–1229. doi:10.1306/12191917401
Chen, J., Shi, Z., and Xu, J. (1994). Flow Patterns of Gas-Liquid Two-phase Upward Flow in Vertical Annuli. J. Daqing Pet. Inst. (04), 23–26.
Chen, Z., and Kirk, G. O. (2013). An Assessment of Tight Oil Resource Potential in the Upper Cretaceous Cardium Formation, Western Canada Sedimentary Basin. Pet. Exploration Dev. 40 (03), 320–328. doi:10.1016/s1876-3804(13)60041-5
Chen, Z., Li, M., Jiang, C., and Qian, M. (2019b). Shale Oil Resource Potential and its Mobility Assessment: A Case Study of Upper Devonian Duvernay Shale in Western Canada Sedimentary Basin. Oil Gas Geol. 40 (03), 459–468. doi:10.11743/ogg20190302
China Petroleum Enterprise Association (2020). China's Oil and Gas Industry Development Analysis and Outlook Report Blue Book (2019-2020). China Pet. Enterprise (04), 25–26.
Cullender, M. H., and Smith, R. V. (1956). Practical Solution of Gas-Flow Equations for Wells and Pipelines with Large Temperature Gradients. Trans. AIME 207 (1), 281–287. doi:10.2118/696-g
Delvaux, D., Martin, H., Leplat, P., and Paulet, J. (1990). Comparative Rock-Eval Pyrolysis as an Improved Tool for Sedimentary Organic Matter Analysis. Org. Geochem. 16 (4), 1221–1229. doi:10.1016/0146-6380(90)90157-U
Dutta, N. C. (2002). Geopressure Prediction Using Seismic Data: Current Status and the Road Ahead. Geophysics 67 (6), 2012–2041. doi:10.1190/1.1527101
Eaton, B. A., and Eaton, T. L. (1997). Fracture Gradient Prediction for the New Generation. World Oil 218 (10), 93–100.
Guo, Q. L., Chen, N. S., Liu, C. L., Xie, H. B., Wu, X. Z., Wang, S. J., et al. (2015). Research advance of Hydrocarbon Resource Assessment Method and a New Assessment Software. Acta Petrolei Sinica 36 (10), 1305–1314. doi:10.7623/syxb201510014
Guo, X. G., He, W. J., Yang, S., Wang, J. T., Feng, Y. L., Jia, X. Y., et al. (2019). Evaluation and Application of Key Technologies of “Sweet Area” of Shale Oil in Junggar Basin: Case Study of Permian Lucaogou Formation in Jimusar Depression. Nat. Gas Geosci. 30 (08), 1168–1179. doi:10.11764/j.issn.1672-1926.2019.05.020
Hasan, A. R., and Kabir, C. S. (1988). A Study of Multiphase Flow Behavior in Vertical wells. Spede 3 (02), 263–272. doi:10.2118/15138-pa
HoodYurewiczStefen, K. C. D. A. K. J., Yurewicz, D. A., and Stefen, K. J. (2012). Assessing Continuous Resources - Building the Bridge between Static and Dynamic Analyses. Bull. Can. Pet. Geol. 60 (3), 112–133. doi:10.2113/gscpgbull.60.3.112
Hottmann, C. E., and Johnson, R. K. (1965). Estimation of Formation Pressures from Log-Derived Shale Properties. J. Pet. Techn. 17 (06), 717–722. doi:10.2118/1110-pa
Huang, W. B., Deng, S. W., Lu, S. F., Yu, L., Hu, S., and Zhang, J. (2014). Shale Organic Heterogeneity Evaluation Method and its Application to Shale Oil Resource Evaluation—A Case Study from Qingshankou Formation, Southern Songliao Basin. Oil Gas Geol. 35 (05), 704–711. doi:10.11743/ogg201405
Jarvie, D. M., and Daniel, M. (2012). Shale Resource Systems for Oil and Gas: Part 1—Shale-Gas Resource Systems. Aapg Memoir, 89–119. doi:10.1306/13321446M973489
Jiang, Q. G., Li, M. W., Qian, M. H., Li, Z. M., Li, Z., Huang, Z. K., et al. (2016). Quantitative Characterization of Shale Oil in Different Occurrence States and its Application. Pet. Geol. Exp. 38 (6), 842–849. doi:10.11781/sysydz201606842
Jiang, Z. X., Pang, X. Q., Jin, Z. J., Zhou, H. Y., and Wang, X. D. (2002). Threshold Control over Hydrocarbons and its Application in Distinguishing Valid Source Rock. Earth Sci. (06), 689–695.
Li, G. X., and Zhu, R. K. (2020a). Progress, Challenges and Key Issues of Unconventional Oil and Gas Development of CNPC. China Pet. Exploration 25 (02), 1–13. doi:10.3969/j.issn.1672-7703.2020.02.001
Li, J. B., Lu, S. F., Chen, G. H., Shan, J. F., Hu, Y. J., Mao, J. L., et al. (2016). Correction of Light and Heavy Hydrocarbon Loss for Residual Hydrocarbon S1 and its Significance to Assessing Resource Potential of E2s4(2) Member in Damintun Sag, Bohai Bay Basin. Oil Gas Geol. 37 (04), 538–545. doi:10.11743/ogg20160410
Li, J., Huang, W., Lu, S., Wang, M., Chen, G., Tian, W., et al. (2018). Nuclear Magnetic Resonance T1-T2 Map Division Method for Hydrogen-Bearing Components in Continental Shale. Energy Fuels 32 (9), 9043–9054. doi:10.1021/acs.energyfuels.8b01541
Li, J., Jiang, C., Wang, M., Lu, S., Chen, Z., Chen, G., et al. (2020b). Adsorbed and Free Hydrocarbons in Unconventional Shale Reservoir: A New Insight from NMR T1-T2 Maps. Mar. Pet. Geol. 116, 104311. doi:10.1016/j.marpetgeo.2020.104311
Li, J. Q., Lu, S. F., Zhang, J., Zhang, P. F., and Xue, H. T. (2019). Quantitative Evaluation Models of Adsorbed and Free Shale Oil and its Microscopic Occurrence Mechanism. Oil Gas Geol. 40 (03), 583–592. doi:10.11743/ogg20190313
Li, J., Wang, M., Chen, Z., Lu, S., Jiang, C., Chen, G., et al. (2019). Evaluating the Total Oil Yield Using a Single Routine Rock-Eval experiment on As-Received Shales. J. Anal. Appl. Pyrolysis 144, 104707. doi:10.1016/j.jaap.2019.104707
Li, J., Wang, M., Lu, S., Chen, G., Tian, W., Jiang, C., et al. (2020c). A New Method for Predicting Sweet Spots of Shale Oil Using Conventional Well Logs. Mar. Pet. Geol. 113, 104097. doi:10.1016/j.marpetgeo.2019.104097
Li, W. J. (2012). The Sedimentary System of Es4-Es3x Member of Shahejie Formation on the Southern Slope of Dongying Sag. EastChina: China University of Petroleum.
Li, Z., Zou, Y.-R., Xu, X.-Y., Sun, J.-N., Li, M., and Peng, P. A. (2016). Adsorption of Mudstone Source Rock for Shale Oil - Experiments, Model and a Case Study. Org. Geochem. 92, 55–62. doi:10.1016/j.orggeochem.2015.12.009
Liu, B., Guo, X. B., Huang, Z. L., Tu, X. X., Shen, Y., and Wang, R. (2013). Discussion on Prediction Method for Hydrocarbon Resource Potential of Shale Oil: Taking Lucaogou Formation Shale Oil of Malang Sag as Case. J. Cent. South Univ. (Science Technology) 44 (04), 1472–1478.
Liu, B., He, J., Lv, Y. F., Ran, Q. C., Dai, C. L., and Li, M. (2014a). Parameters and Method for Shale Oil Assessment: Taking Qinshankou Formation Shale Oil of Northern Songliao Basin. J. Cent. South Univ. (Science Technology) 45 (11), 3846–3852.
Liu, C., Lu, S. F., and Xue, H. T. (2014b). Variable-coefficient ΔlogR Model and its Application in Shale Organic Evaluation. Prog. Geophys. 29 (01), 312–317. doi:10.6038/pg20140144
Liu, Y. (2018). Study on Shale Oil Reservoir Characteristics of Shahejie Formation in Jiyang Depression, Bohai Bay Basin. Chengdu, China: Chengdu University of Technology.
Lu, S. F., Chen, G. H., Wang, M., Li, J. B., Wang, X., Shan, J. F., et al. (2016a). Potential Evaluation of Enriched Shale Oil Resource of Member 4 of the Shahejie Formation in the Damintun Sag, Liaohe Depression. Oil Gas Geol. 37 (1), 8–14. doi:10.11743/ogg20160102
Lu, S. F., Xue, H. T., Wang, M., Xiao, D. S., Huang, W. B., Li, J. Q., et al. (2016b). Several Key Issues and Research Trends in Evaluation of Shale Oil. Acta Petrolei Sinica 37 (10), 1309–1322. doi:10.7623/syxb201610012
Lu, S., Liu, W., Wang, M., Zhang, L., Wang, Z., Chen, G., et al. (2017). Lacustrine Shale Oil Resource Potential of Es 3 L Sub-member of Bonan Sag, Bohai Bay Basin, Eastern China. J. Earth Sci. 28 (6), 996–1005. doi:10.1007/s12583-016-0945-4
Lv, D., Li, Z., Wang, D., Li, Y., Liu, H., Liu, Y., et al. (2019). Sedimentary Model of Coal and Shale in the Paleogene Lijiaya Formation of the Huangxian Basin: Insight from Petrological and Geochemical Characteristics of Coal and Shale. Energy Fuels 33 (11), 10442–10456. doi:10.1021/acs.energyfuels.9b01299
Lv, D., Song, Y., Shi, L., Wang, Z., Cong, P., van Loon, A. J., et al. (2020). The Complex Transgression and Regression History of the Northern Margin of the Palaeogene Tarim Sea (NW China), and Implications for Potential Hydrocarbon Occurrences. Mar. Pet. Geol. 112, 104041. doi:10.1016/j.marpetgeo.2019.104041
MagaraKinji (1978). Compaction and Fluid Migration : Practical Petroleum Geology. Elsevier Scientific Publishign Co.
Mccoy, J. N., Podio, A. L., and Huddleston, K. L. (1988). Acoustic Determination of Producing Bottomhole Pressure. Spe Formation Eval. 3 (03), 617–621. doi:10.2118/14254-pa
Michael, G. E., Packwood, J., Holba, A., and Houston, C. (2013). Determination of In-Situ Hydrocarbon Volumes in Liquid Rich Shale Plays. doi:10.1190/urtec2013-211
Ning, F. X., Wang, X. J., Hao, X. F., Yang, W. Q., Yin, Y., Ding, J. H., et al. (2017). Occurrence Mechanism of Shale Oil with Different Lithofacies in Jiyang Depression. Acta PetroLei Sinica 38 (02), 185–195. doi:10.7623/syxb201702006
Olea, R. A., Cook, T. A., and Coleman, J. L. (2010). A Methodology for the Assessment of Unconventional (Continuous) Resources with an Application to the Greater Natural Buttes Gas Field, Utah. Nat. Resour. Res. 19 (4), 237–251. doi:10.1007/s11053-010-9127-8
Pu, X. G., Jin, F. M., Han, Z. W., Shi, Z. F., Cai, A. B., Wang, A. G., et al. (2019). Sweet Spots Geological Characteristics and Key Exploration Technologies of continental Shale Oil: a Case Study of Member 2 of Kongdian Formation in Cangdong Sag. Acta PetroLei Sinica 40 (08), 997–1012. doi:10.7623/syxb201908011
Qian, M. H., Jiang, Q. G., Li, M. W., Li, Z. M., Liu, P., Ma, Y. Y., et al. (2017). Quantitative Characterization of Extractable Organic Matter in Lacustrine Shale with Different Occurrences. Pet. Geol. Exp. 39 (02), 278–286. doi:10.11781/sysydz201702278
Ribeiro, R. C., Correia, J. C. G., and Seidl, P. R. (2009). The Influence of Different Minerals on the Mechanical Resistance of Asphalt Mixtures. J. Pet. Sci. Eng. 65 (3), 171–174. doi:10.1016/j.petrol.2008.12.025
Salazar, J., Mcvay, D. A., and Lee, W. J. (2010). Development of an Improved Methodology to Assess Potential Unconventional Gas Resources. Nat. Resour. Res. 19 (4), 253–268. doi:10.1007/s11053-010-9126-9
Schmoker, J. W. (2002). Resource-assessment Perspectives for Unconventional Gas Systems. AAPG Bull. 86 (11), 1993–1999. doi:10.1306/61EEDDDC-173E-11D7-8645000102C1865D
Song, G. Q., Hao, X. F., and Liu, K. Q. (2014). Tectonic Evolution, Sedimentary System and Petroleum Distribution Patterns in Dustpan-Shaped Rift basin: a Case Study from Jiyang Depression, Bohai Bay Basin. Oil Gas Geol. 35 (03), 303–310. doi:10.11743/ogg201402
Song, G. Q., Zhang, L. Y., Lu, S. F., Xu, X. Y., Zhu, R. F., Wang, M., et al. (2013). Resource Evaluation Method for Shale Oil and its Application. Earth Sci. Front. 20 (4), 221–228.
Wang, A. Q., and Zheng, B. M. (1987). Calibration of Analytic Parameters for Pyrolytic Chromatography. Exp. Pet. Geol. (04), 342–350.
Wang, M., Ma, R., Li, J. B., Lu, S. F., Li, C. M., Guo, Z. Q., et al. (2019). Occurrence Mechanism of Lacustrine Shale Oil in the Paleogene Shahejie Formation of Jiyang Depression, Bohai Bay Basin, China. Pet. Exploration Dev. 46 (04), 789–802. doi:10.11698/PED.2019.04.1910.1016/s1876-3804(19)60242-9
Wang, M., Tian, S., Chen, G., Xue, H., Huang, A., and Wang, W. (2014). Correction Method of Light Hydrocarbons Losing and Heavy Hydrocarbon Handling for Residual Hydrocarbon (S1) from Shale. Acta Geologica Sinica - English Edition 88 (6), 1792–1797. doi:10.1111/1755-6724.12345
Wang, R. F., Sun, W., and Yang, H. (2010). Micro Mechanism of Water Drive in Ultra-low Permeability sandstone Reservoir. J. Lanzhou Univ. (Natural Sciences) 46 (06), 29–33. doi:10.13885/j.issn.0455-2059.2010.06.012
Wang, W. G., Zheng, M., Wang, M., Lu, S. F., Peng, J., Lu, K., et al. (2015). The Discussion of the Evaluation Method of Shale Oil Movable Resources Amount and Palaeogene Shahejie Formation Application Effect in the Northern of Dongpu Depression. Nat. Gas Geosci. 26 (4), 771–781. doi:10.11764/j.issn.1672-1926.2015.04.0771
Wen, C. X. (2019). Identification and Quantitative Evaluation of Overpressure of Different Origin in Kuqa Depression. Xi'an, China: Northwest University. doi:10.1109/iceaa.2019.8879378
Wright, M. C., Court, R. W., Kafantaris, F.-C. A., Spathopoulos, F., and Sephton, M. A. (2015). A New Rapid Method for Shale Oil and Shale Gas Assessment. Fuel 153, 231–239. doi:10.1016/j.fuel.2015.02.089
Wu, B. C., Li, J. M., Wu, Y. Y., Han, L., Zhao, T. F., and Zou, Y. S. (2019a). Development Practices of Geology-Engineering Integration on Upper Sweet Spots of Lucaogou Formation Shale Oil in Jimsar Sag, Junggar Basin. China Pet. Exploration 24 (05), 679–690. doi:10.3969/j.issn.1672-7703.2019.05.014
Wu, H. Y., Lin, T. F., Bai, Y. F., Zhang, J. Y., Liu, X., Huo, Q. L., et al. (2019b). Analyses of the Mudstone (Shale) Oil Exploration Potential in North Songliao Basin. Pet. Geol. Oilfield Dev. Daqing. 38 (05), 78–86. doi:10.19597/J.ISSN.1000-3754.201907007
Xu, G., Guan, L. P., Wang, L. S., Yang, Z. X., and Sun, C. L. (2004). The Technology for Detection of Overpressured Zones in Formations: an Example from the Tongnanba fold-belt, Sichuan basin, China. Prog. Geophys. (03), 645–651.
Xue, G., Guan, L. P., Wang, L. S., Yang, Z. X., and Sun, C. L. (1995). The Technology for Detection of Overpressured Zones in Formations: an Example From the Tongnanba Fold-Belt, Sichuan Basin, China. Prog. Geophys. (3), 645–651.
Xue, H. T., Tian, S. S., Lu, S. F., Zhang, W. H., Du, T. T., and Mu, G. D. (2015). Selection and Verification of Key Parameters in the Quantitative Evaluation of Shale Oil: A Case Study at the Qingshankou Formation, Northern Songliao Basin. Bull. Mineral. Petrol. Geochem. 34 (01), 70–78+2.
Xue, H. T., Tian, S. S., Wang, W. M., Zhang, W. H., Du, T. T., and Mu, G. D. (2016). Correction of Oil Content—One Key Parameter in Shale Oil Resource Assessment. Oil Gas Geol. 37 (01), 15–22. doi:10.11743/ogg20160103
Yang, H., Li, S. X., and Liu, X. Y. (2013). Characteristics and Resource Prospects of Tight Oil and Shale Oil in Ordos Basin. Acta Petrolei Sinica 34 (01), 1–11. doi:10.7623/syxb201301001
Zhang, H., Huang, H., Li, Z., and Liu, M. (2020). Comparative Study between Sequential Solvent-Extraction and Multiple Isothermal Stages Pyrolysis: A Case Study on Eocene Shahejie Formation Shales, Dongying Depression, East China. Fuel 263, 116591. doi:10.1016/j.fuel.2019.116591
Zhang, J. C., Lin, L. M., Li, Y. X., Tang, X., Zhu, L. L., Xing, Y. W., et al. (2012). Classification and Evaluation of Shale Oil. Earth Sci. Front. 19 (05), 322–331.
Zhang, L. Y., Bao, Y. S., Li, J. Y., Li, Z., Zhu, R. F., and Zhang, J. G. (2014). Movability of Lacustrine Shale Oil: A Case Study of Dongying Sag, Jiyang Depression, Bohai Bay Basin. Pet. Exploration Dev. 41 (06), 641–649. doi:10.1016/s1876-3804(14)60084-7
Zhang, L. Y., Bao, Y. S., Li, J. Y., Li, Z., Zhu, R. F., Zhang, L., et al. (2015a). Hydrocarbon and Crude Oil Adsorption Abilities of Minerals and Kerogens in Lacustrine Shales. Pet. Geol. Exp. 37 (06), 776–780. doi:10.11781/sysydz201506776
Zhang, S., Chen, S. J., Yan, J. H., Tan, M. Y., Zhang, Y. Y., Gong, W. L., et al. (2015b). Characteristics of Shale Lithofacies and Reservoir Space in the 3rd and 4th Members of Shahejie Formation, the West of Dongying Sag. Nat. Gas Geosci. 26 (02), 320–332. doi:10.11764/j.issn.1672-1926.2015.02.0320
Zhao, Y. Z., Zhou, L. H., Pu, X. G., Jin, F. M., Shi, Z. N., Xiao, D. Q., et al. (2019). Favorable Formation Conditions and Enrichment Characteristics of Lacustrine Facies Shale Oil in Faulted lake basin: a Case Study of Member 2 of Kongdian Formation in Cangdong Sag, Bohai Bay Basin. Acta Petrolei Sinica 40 (09), 1013–1029. doi:10.7623/syxb201909001
Zhi, D. M., Tang, Y., Yang, Z. F., Guo, X. G., Zheng, M. L., Wan, M., et al. (2019). Geological Characteristics and Accumulation Mechanism of continental Shale Oil in Jimusaer Sag, Junggar Basin. Oil Gas Geol. 40 (03), 524–534. doi:10.11743/ogg20190308
Zhou, S. W., Liu, L. H., Yan, G., Xue, H. Q., and Guo, W. (2016). NMR Research of Movable Fluid and T2 Cutoff of marine Shale in South China. Oil Gas Geol. 37 (04), 612–616. doi:10.11743/ogg20160420
Zhu, R. F., Zhang, L. Y., Li, J. Y., Liu, Q., Li, Z., Wang, R., et al. (2015). Quantitative Evaluation of Residual Liquid Hydrocarbons in Shale. Acta Petrolei Sinica 36 (1), 13–18. doi:10.7623/syxb201501002
Zhu, R. F., Zhang, L. Y., Li, Z., Wang, R., and Zhang, S. L. (2019). Evaluation of Shale Oil Resource Potential in continental Rift basin A Case Study of Lower Es3Member in Dongying Sag. Pet. Geol. Recovery Efficiency 26 (01), 129–136. doi:10.13673/j.cnki.cn37-1359/te.2019.01.014
Zou, C. N., Pan, S. Q., Jing, Z. H., Gao, J. L., Yang, Z., Wu, S. T., et al. (2020). Shale Oil and Gas Revolution and its Impact. Acta Petrolei Sinica 41 (01), 1–12. doi:10.7623/syxb202001001
Keywords: shale oil, movable oil, free oil, nuclear magnetic resonance, jiyang depression
Citation: Xu L, Wang M, Li J, Li M, Li Z, Zhu R and Liu H (2021) Evaluation Method of Movable Shale Oil Resource: A Case Study of the Shahejie Formation in the Dongying Sag, Jiyang Depression. Front. Earth Sci. 9:684592. doi: 10.3389/feart.2021.684592
Received: 23 March 2021; Accepted: 28 May 2021;
Published: 28 June 2021.
Edited by:
Dawei Lv, Shandong University of Science and Technology, ChinaReviewed by:
Clive Francis Burrett, Mahasarakham University, ThailandXianfeng Tan, Chongqing University of Science and Technology, China
Copyright © 2021 Xu, Wang, Li, Li, Li, Zhu and Liu. This is an open-access article distributed under the terms of the Creative Commons Attribution License (CC BY). The use, distribution or reproduction in other forums is permitted, provided the original author(s) and the copyright owner(s) are credited and that the original publication in this journal is cited, in accordance with accepted academic practice. No use, distribution or reproduction is permitted which does not comply with these terms.
*Correspondence: Min Wang, d2FuZ21AdXBjLmVkdS5jbg==; Jinbu Li, NDk4ODkxNDkyQHFxLmNvbQ==
 Liang Xu1
 Min Wang