 Katrin Sieron
 Blake Weissling
 Marco Aurelio Morales-Martínez
 Sergio Teran2
- 1Centro de Ciencias de la Tierra, Universidad Veracruzana, Xalapa, México
- 2Department of Geological Sciences, The University of Texas at San Antonio, San Antonio, TX, United States
A singular precipitation event on the summit glacial slopes of Mexico’s highest volcanic peak, Citlatépetl (also known as Pico de Orizaba), associated with the passage of Hurricane Ernesto across the southern Mexico mainland in August 2012, resulted in a debris flow at altitudes above 4,400 m asl, culminating in a hyperconcentrated flow downstream that had major impacts to a river valley’s channel morphology as well as to communities along a 25 km runout. The lahar originated at the terminal moraine and proglacial ramp of the Little Ice Age (LIA) extent of Citlaltépetl’s Jamapa glacier. Precipitation amounts were estimated based on nearby CONAGUA stations, but also on TRMM satellite images leading to an estimated 106 mm for a 3 day total, with 85 mm (80% of the total) falling on August 9th, the date when the lahar event occurred. The initial debris flow removed a minimum estimated 60,000 m3 of material from the proglacial ramp. A possible causative scenario is that the precipitation event overpressured the groundwater hydrology of an already unstable glacial-melt-saturated moraine. We demonstrate a methodology for the recreation of a pre-event landscape and the environmental conditions at the onset of the lahar, utilizing satellite products, in-situ geomorphological and geological evidence, and UAS technology.
Introduction
Climate-induced melting of tropical mountain glaciers and associated de-stabilization of glacial environments is expected to have significant impacts on local mountain ecosystems, available water supplies, and risk to the safety and security of downstream communities, infrastructure, human populations, and economies (Bradley et al., 2006; Kääb et al., 2005; Richardson and Reynolds, 2000). Mass flows originating in these types of glacial environments, common on many high-altitude volcanoes, where large amounts of unconsolidated material along proglacial ramps exist; have been found to be increasing in frequency as the sediment availability, glacial meltwater, and slope stability are affected by the combination of glacial retreat and meteoric water (Chiarle et al., 2007).
Citlaltépetl or Pico de Orizaba is a classic stratovolcano and the highest volcanic peak in North America. It is considered to be active, though currently in a quiet state with the most notable recent eruptive activity during the years 1,537 and 1,867 (Simkin et al., 1981). It is located within the easternmost part of the Trans-Mexican Volcanic Belt (TMVB) (Figure 1) and is surrounded by tens of cities and towns, comprising more than one million people within a 25 km radius (INEGI - Instituto Nacional de Estadística y Geografía, 2001).
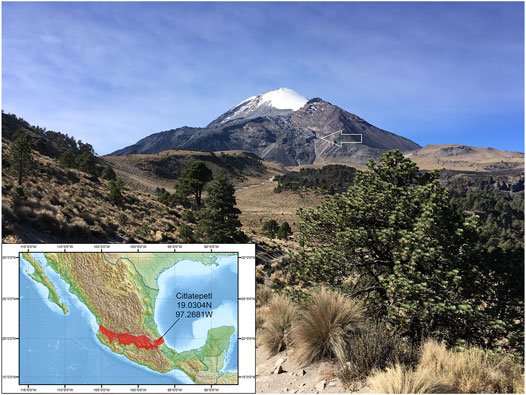
FIGURE 1. Photo of Citlaltépetl, view of the north face. The Jamapa glacial valley and recent lava flow can be seen in the lower mid-section of the volcano. Arrow shows lahar inception area in the uppermost Jamapa watershed. Inset map shows location of the mountain, at the east end of the Trans-Mexican Volcanic Belt (shaded area).
The glacier/ice cap on the north face of Mexico’s Citlaltépetl, the third highest peak in North America at 5,636 m elevation (Brown et al., 2005), has seen remarkable changes in the glacial environment in the past 5 decades, as assessed with satellite imagery and first-hand accounts from climbing expeditions. A few published studies since the 1950’s have addressed the glacier peripherally in the context of volcanic hazard studies (Carrasco-Núñez et al., 2006; Zimbelman et al., 2004), permafrost and periglacial studies (Heine, 1975; Heine, 1988, Heine, 1994; Palacios and Vázquez-Selem, 1996; Soto-Molina and Delgado-Granados, 2020), paleo equilibrium line reconstructions (White, 1981; Lachniet and Vázquez-Selem, 2005), glacier changes and surface energy balance (e.g., Reinthaler et al., 2019; Cortes-Ramos et al., 2019; Ontiveros-González et al., 2015 and alpine ecology studies (Lauer and Klaus, 1975).
Some of these studies are referenced here in order to analyze morphologic changes in the flow-feeding area and to address the water source-problem. The impact of hurricane triggered tropical storms on Mexican volcano slopes have been recognized earlier (e.g., Capra et al., 2018), as well as the general fact of prolonged or intense rainfalls in high mountain proglacial areas and the increase of the frequency of those events (e.g., Chiarle et al., 2007) going along with retreating glaciers and a warming climate (e.g. Huggel et al., 2011).
In this context, it has to be mentioned that glacier retreat uncovers unstable, often unconsolidated and heavily meteorized material far above the vegetation line (treeline). These unconsolidated sediments on steep mountain slopes represent potential sources for debris flows (Kääb et al., 2005; Zimmermann and Haeberli, 1992; McGuire, 2010) and other mass movement related phenomena. Elevation of air temperature, and therefore rock temperature, as well as permafrost thaw further influences the slope stability (Gruber and Haeberli, 2007). Annual precipitation in these high mountain areas usually is scarce (454 mm at Pico de Orizaba glacier; see Ontiveros et al., 2015), but the increasing annual tropical cyclone frequency in response to anthropogenic climate change, especially in the northern hemisphere (Emanuel, 2021) provides increasing amounts of water in these unstable environments, which adding up to glacial meltwater provides ideal conditions for slope instability and mass movements in general.
In this paper we investigate changes in the high mountain glacial environment of Citlaltépetl within the context of natural disasters. Specifically, we forensically examine an extraordinary flood event triggered by the landfall of a tropical storm (class 1 Hurricane Ernesto) in the state of Veracruz during the night of August 9th of 2012, resulting in a lahar, partially modeled by Franco-Ramos et al. (2020). Significant rain and perhaps snow or hail fell in the upper reaches of the Jamapa glacial valley in the vicinity of the historical terminal moraine of the Jamapa glacial tongue. A debris flow event that began at the moraine culminated in a catastrophic damage to downstream infrastructure at Coscomatepec and Calcahualco municipalities. Furthermore river channel morphology, specifically channel width and depth, was altered radically along the 25 km runout as observed in post-event satellite imagery and field work (Figure 2; see also Morales-Martínez et al., 2016). The study area as referenced in this paper refers to the Jamapa glacial valley, which extends from the current foot of the glacier to the terminal moraines and pro-glacial ramp left by the retreat of the Jamapa glacial tongue during the Little Ice Age (LIA).
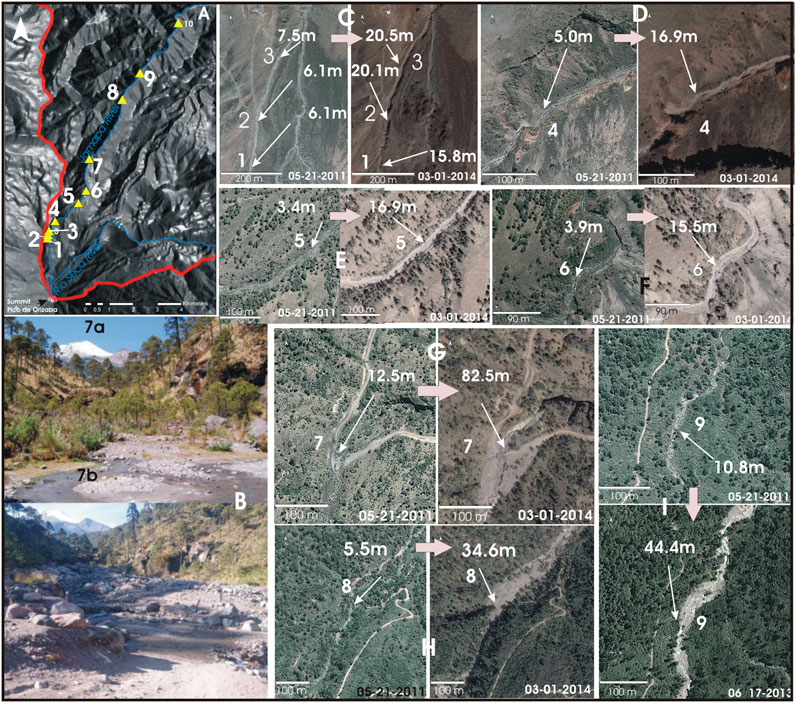
FIGURE 2. (A)–overview of the upper Jamapa watershed (DEM) and virtual “sample points” (1–9) of visual channel width changes. (B)–location number 7 before (7a) and after (7b) the 2012 lahar event. (C–I) Satellite image analysis before and after the 2012 lahar event [location numbers correspond to the ones in (A)]. Measured before- and after widths are indicated.
Although the 2012 lahar can be considered a minor event by volume, substantial economic damage was reported by an emergency declaration published the August 23, 2012 by the Federal Governmental Secretary (Secretaría de Gobernación, 2012). The Calcahualco and Coscomatepec municipalities were principally affected by the severe lahar flows in the Jamapa River Channel (Morales-Martínez et al., 2016; DOF (Diario Oficial de la Federación, México), 2012; CONAGUA, 2012). The total valuation of the infrastructural damage to roads, bridges, and homes and the money allocated for debris removal and construction of provisional thoroughfares in both municipalities was $145, 741, 000.00 (MP–Mexican Pesos) according to an official 2014 report from the National Center of prevention of Disasters (CENAPRED) and the Veracruz State Government 2012 report. The impacts from the Ernesto event were not only reported downslope by printed newspapers but also at higher levels on the northern volcano flanks by local climbing/glacier guides who observed and documented impacting morphologic changes near the inception point (one of the routes to Pico`s summit) and where the Jamapa river crosses one of the two main road accesses to get to the alpine hut. These in situ observations further confirm Ernesto as the triggering mechanism for the lahar and channel altering event.
Setting and Environment
Glacial Environment of Citlaltépetl and the Jamapa Valley
The most prominent loss of glacial ice on Citlaltépetl, in a spatial perspective, has involved the retreat of the Jamapa tongue of the main ice field or ice cap (Figure 3). Once resident in a steep valley exiting the mountain’s main ice field and trending due north, the Jamapa tongue has completely disappeared. As a result of the retreat, the foot of the main glacier field now lies 1,600 m (in plan view) and approximately 700 m (vertically) from its recorded maximum extent during the LIA. The exposed valley shows considerable evidence of historical glacial movement and erosion, with abundant glacial grooves in the volcanic bedrock. According to Palacios and Vázquez-Selem (1996), the Jamapa lava flow, <5,000 years old, now forming the bed of the ancestral Jamapa glacial valley, was completely covered by the Jamapa glacier during the LIA. Three terminal moraine deposits, corresponding to LIA maximum extents at elevations ranging from 4,400–4,500 m, had been identified by Palacios et al. (1999). The same authors described evidence of large debris flows on the well-preserved terminal moraine and proglacial ramp, initiated by proglacial meltwaters, at the acceleration of the glacier retreat after LIA. The proglacial ramp is steep with a slope of 26° and is approximately 400 m in length. Figure 4 shows a diagrammatic plan view and profile of the Jamapa glacial valley, showing the relevant geologic and periglacial features relevant to this study.
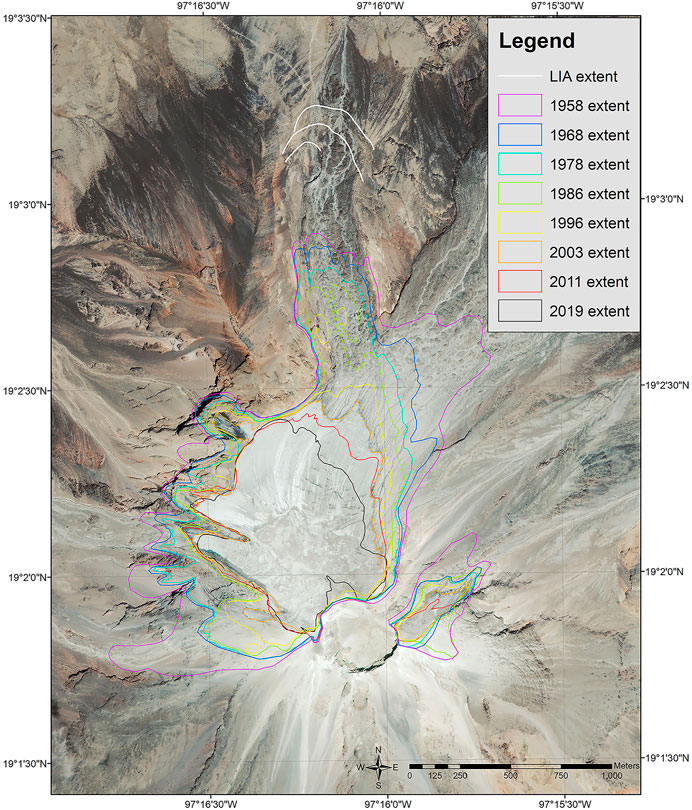
FIGURE 3. Ikonos satellite image (2003) of Citlaltépetl´s summit and north face with overlays of glacier extents since the 1950’s. Included are the mapped LIA terminal moraine ridges (white lines) as mapped by Palacios et al. (1999).
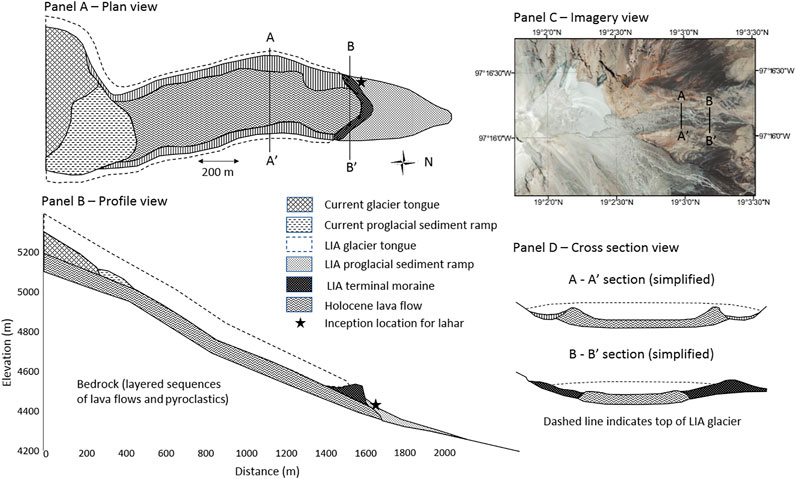
FIGURE 4. Generalized illustration of glacial and periglacial features of the Jamapa glacial valley and former LIA glacial tongue, from the current glacial foot to the LIA proglacial ramp in plan and profile views Two simplified transverse profiles, A–A′ and B–B′, of the glacier tongue and terminal moraine are shown. Inset satellite image dated 2003.
Previous Mass Movement and Flow Events
The volcano has been constructed in three phases according to Carrasco-Núñez et al. (1997) and Carrasco-Núñez (2000) on an upper Cretaceous and lower Paleozoic basement (Schaaf and Carrasco-Núñez, 2010), including two Pleistocene cones, and then superimposed modern mainly Holocene Citlaltépetl cone. The three stages relate directly to individual cone-constructing phases and the subsequent destruction of the first two cones by flank collapse and massive avalanche/lahar generation (e.g., Hoskuldsson and Robin, 1993). The previous flank collapse events have been attributed mainly to hydrothermal alteration and glacial erosion exposing areas of altered unstable rocks (Carrasco-Núñez et al., 1993; Capra et al., 2001). The avalanches reached distances to up to 70–100 km from the source toward the Gulf coast, due to the great height difference between surrounding valleys and the summit.
The occurrence of major lahar events is one of the worst-case scenarios for hazards related to ice-capped volcanoes and represents one of the future scenarios for Citlaltépetl (see generalized hazard map, Sheridan et al., 2001). Smaller magnitude flow-hazard related events have occurred more recently. For example, Palacios et al. (1999) reported a debris flow to have occurred between 1994 and 1995 partly due to the formation of an impermeable layer of ice buried by sediment falling of the unstable exposed walls of the former glacier valley and subsequent saturation of the overlaying layers by melt water, which eventually led to the formation of the debris flow. Later, in June 2003, a lahar, caused by intense precipitation on the southern flank of Citlaltépetl, flooded the Río Chiquito and Río Carbonera valleys causing the destruction of oil pipelines and causalities due to a subsequent explosion (Rodríguez et al., 2006). The material mixed with rainwater had its origin in pyroclastic and epiclastic deposits on intermediate and upper volcano flanks.
These types of events (diluted lahars or hyperconcentrated flows and floods) have very short recurrence intervals, because their origin is related to episodic rainfalls and/or surges in glacier meltwater, in comparison to the previously mentioned big-volume avalanches and related cohesive debris flows due to flank collapses during Citlatépetl´s history.
Hydrology of the Jamapa Valley
For the following description of the hydrology and the geomorphology of the Jamapa glacial valley, the reader is referred to a generalized illustrative model of the valley in plan and profile views (Figure 4).
The Jamapa valley today, with the retreat of the Jamapa glacial tongue, is still the primary drainage conduit for glacial melt, snow melt, and any high mountain precipitation falling on Citlaltépetl’s north face and summit ice cap. The current foot of the ice cap above the Jamapa valley lies at about 5,100 m elevation, which is consistent with the elevation of the summer season 0° isotherm at 5,050 m (as assessed with a network of temperature loggers installed in the Jamapa valley since 2010). Insufficient data exists at this time to make any further conjectures about retreat and melt dynamics as no equilibrium line, mass balance, or long-term meteorological studies have been conducted. Glacier melting is occurring today, although only on rare occasions (during the last 5 years) has it been observed by these authors as melt on the glacier surface. Numerous small streams exiting the ice cap northern and eastern terminus at the ground contact, as can be seen for example in the IKONOS background image used in Figure 3, indicate substantial subglacial ablation. Large rills have developed along the contact line of the ice edge and the underlying unconsolidated base materials, mostly volcaniclastics from prior eruptions. These melt streams rapidly disappear into the highly porous and permeable proglacial sediments, and most certainly move downslope into the Jamapa valley as groundwater. The volcanic and glacial geology of the Jamapa valley controls two distinct surface and groundwater hydrologies. About ninety percent of the glacial valley floor is underlain by the dacitic lava flow described previously. Areas of the lava flow could be considered somewhat permeable (due to fracturing after glacier retreat), and other areas impermeable. There is a definite surface drainage system on the lava flow that is in part sourced by glacier melt and any melting snow on the flow surface. Palacios and Vázquez Selem (1996) described surface stream action as very limited, at least in terms of consistent daily flow. Moreover, there are minimal unconsolidated deposits on this flow that could retain water–most deposits being scoured by the Jamapa glacier tongue that covered this flow during the LIA. The borders or flanks of this flow are raised levee walls that essentially prevent any movement of water onto or off the flow laterally (please refer to Profile A-A′ in Figure 4). Due to these levees and also to the slightly higher topography of the flow, it appears only a small component of meltwater from the current glacier foot makes it onto the lava flow. There could be both downward percolation of water through the lava flow, especially in areas of fracturing, but there could also be upwelling of waters from below the flow through those same fractures depending on hydraulic pressures and local hydraulic gradients.
The flow is flanked on both the east and west sides (outside the levee walls) by unconsolidated fines, gravels, and boulders that were in part the lateral moraines of the LIA glacial tongue as well as rock fall material eroded from the steep walls of the valley (refer to the plan view and transverse profiles of Figure 4). The hydrology of these flanks is strongly dominated by subsurface groundwater flow as the material is highly porous and permeable. However, during the summer melt season the authors have observed a small surface stream developing on a daily basis on this west side of the valley. The volume is much greater higher up the valley than lower suggesting much of the flow is infiltrating the sediments. The stream begins to flow early afternoon and ceases mid-evening. This behavior suggests that the groundwater potentiometric surface is essentially quite close to the surface throughout much of the valley (outside the flanks of the lava flow), especially during the summer season. This has important ramifications in regard to both the sensitivity of the hydrology to additional input such as from a rain or large snow event, and to the stability of the unconsolidated materials due to excessive pore pressures.
Finally, the last elements of the valley hydrology, and the most crucial one in the context of the Ernesto lahar, are the LIA terminal moraine and the proglacial ramp. The moraine is exceptionally well preserved on the east side of the valley, and much less so on the west (refer to profile B–B’ of Figure 4). The west flank is where glacier meltwater drainage dominates, and thus significant erosion has taken place. Figure 5 shows a satellite image of the moraine/ramp area, from March 2011. In this figure, we have annotated the surface channels and surface flow directions with the white arrows. The two separate systems of surface drainage can be seen clearly in this image. The west side drainage, indicated by ellipse A is sourced by the glacial meltwater. The east side drainage, indicated by ellipse B is dominated by surface drainage of the lava flow, almost entirely sourced by rain and snow melt, with a small component of glacier meltwater.
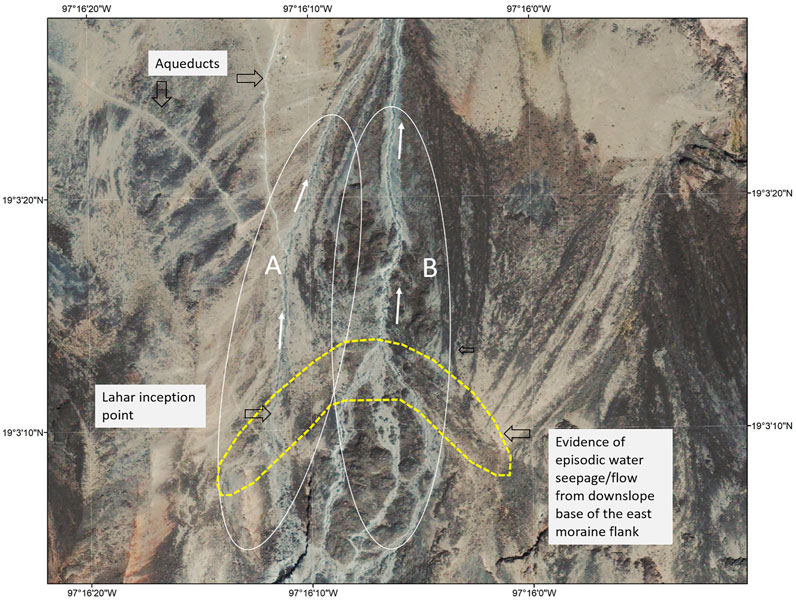
FIGURE 5. Annotated scene of the LIA terminal zone of the glacier, discriminating two distinct surface hydrology zones. Ellipse (A) identifies a surface drainage system from the west side lateral moraine and erosional deposits. Ellipse (B) identifies a surface drainage system from the lava flow.
Precipitation Climatology of the Study Area
There are two distinct hydrologic seasons for the region as well as for the study area; a dry season from November to April and a wet season from May to October. This seasonality is common to the tropics and is driven by fluctuation of the inter-tropical convergence zone (ITCZ) (Cavazos and Hastenrath, 1990). However, given that the study area is on the northern edge of the ITCZ, the area is also influenced by North American frontal systems that occasionally penetrate as far as southern Mexico during the winter months.
The type of precipitation in the region and study area varies seasonally. Mist and fog-based precipitation occurs most frequently in the dry (winter) season but may also occur in the wet summer season. Convective type rainfall occurs most frequently in the summer season as orographic-driven afternoon rainfall. Intense rain events may also be associated with tropical lows and hurricane activity in the adjacent Gulf of Mexico. In the higher mountain environment, above 4,500 m, snow events may occur anytime during the year, but much less frequently during the drier winter than the summer. This behavior is driven largely by the tropical and altitude climatology rather than the seasonal climatology.
A network of precipitation gauge stations operated by Mexico’s National Commission on Water (CONAGUA) exists in the region. Sixty-one gauges are currently operational within a 75 km radius of the study area, 51 of which were operational in August of 2012, the period of the Ernesto event. No CONAGUA stations exist within the study area. The closest station, CONAGUA station 21073 (elev 3,080 m) is 12 km to the southwest. Two other stations, 30486 (elev 2040 m) and 30072 (elev 1,350 m), are 14 km to the south and 29 km to the east, respectively. None of these stations are considered appropriate for estimating precipitation precisely in the study area due to the considerable difference in elevation and to their geographic location–station 21073, in particular, being in the rain shadow of the volcano. For the purposes of estimating precipitation in the study area for the 2012 event, we have resorted to satellite estimates as will be discussed in the methods section.
Recently installed (2018) meteorological stations (financed by projects mentioned in the acknowledgements; not being part of the CONAGUA network) at high altitudes, give some idea on actual rainfall and show a yearly rainfall of 856 mm at 4,500 m asl (April 2018 to March 2019); further downslope at 3,500 m annual precipitation is almost twice as much (1,360 mm for the same time span). Maximum daily rainfall accumulates up to 55 mm at 4,500 mm altitude (September 2019). These data provide some context for evaluating the Ernesto precipitation event as a statistical outlier or not.
Methods and Data
Storm Track and Precipitation Amounts
Between the 1st and August 10, 2012, Ernesto achieved hurricane status in the Western Caribbean south of Jamaica, with an assigned category of 2 (Brown, 2013). The storm made landfall in the Yucatan on August 8th as a category 1 storm. It quickly moved across the Yucatan peninsula moving briefly into the Bay of Campeche, and then followed a track due west staying over the Mexican mainland passing Coatzacoalcos, Veracruz at 13:00 the 9th of August as a tropical storm At 10 a.m. EDT on August 10th, Ernesto’s center was near 18.0 North and 99.2 West placing it about 215 miles (345 km) west-southwest of Citlaltépetl. Ernesto track data was downloaded from International Best Track Archive for Climate Stewardship (IBTrACS) v 4.0, a NOAA online portal for global tropical storm data (https://www.ncdc.noaa.gov/ibtracs/index.php?name=ib-v4-access).
The shortest distance of the center of the storm with respect to the study area was 150 km (Huajuapan de León, Oaxaca). Between the 8th and 10th of August (to be called the precipitation event period), Ernesto produced heavy rainfall in the southern and central part of Veracruz state. The storm center moved rapidly across the mainland, with rain beginning on the 8th, peaking on the 9th, followed by lingering showers on the 10th.
As mentioned previously, no gauge measurements provided any estimate of Ernesto rainfall proximal to the study area in 2012. The nearest meteorological station to the study area is CONAGUA station 21073, located 10 km southwest of the Citlaltépetl summit at an elevation of 3,080 m. This station recorded 2.6 mm on August 8th, 91.6 mm on the 9th, and 0 mm on the 10th. Station 21026, 500 m lower in elevation and 9 km further west, recorded 0 mm, 48.5 mm, and 8.5 mm for August 8th, 9th, and 10th respectively. These stations are on the west side of the north-south divide of the Sierra Madre and may not be very representative of the precipitation that fell within the upper Jamapa valley on the east side of the divide. The closest east-side CONAGUA stations 21067 and 30072, 28 km north-northeast and 30 km due east of Citlaltépetl’s summit, recorded 4, 174, 41, and 6, 132, 30 mm for August 8th, 9th, and 10th, respectively. These stations are at 2,346 and 1,350 m elevation, respectively. Forty-six stations within 75 km of Citlaltépetl received a mean event rainfall of 128 mm (±79 mm SD). The event period means for the east and west sides of the divide were 84(54 mm SD) and 191 mm (66 mm SD). Approximately 80% of the event rainfall occurred on the 9th, for both the east and west sides.
Based on these gauge data, with the study area on the geographic divide between the east and west sides, we arrived at an estimate of 137 mm for the study area, based on a simple mean of the two closest stations.
A more robust approach was to estimate the value at the study site through a natural neighbor spatial interpolation accomplished in ArcMap. That result yielded an estimate of 114 mm for the 3 day event, with 90 mm occurring on the 9th, the day we suspect the lahar event began (Figure 6A).
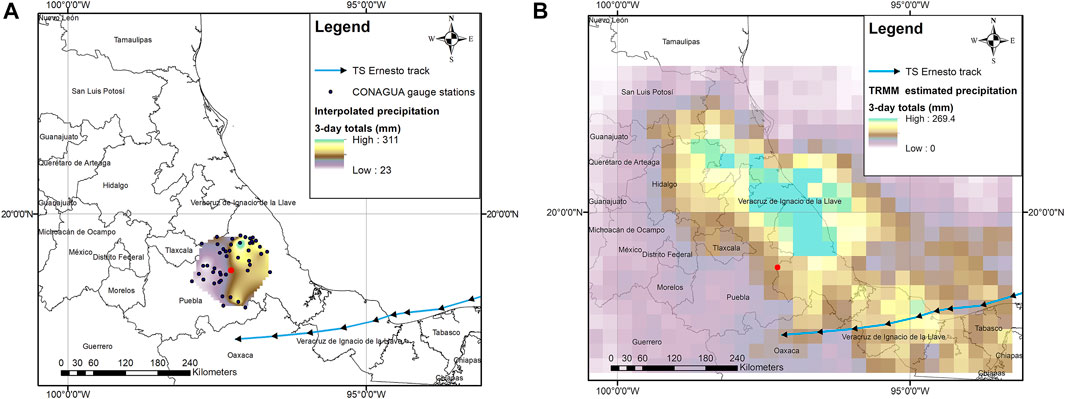
FIGURE 6. Ernesto’s track and spatial interpolation and estimation maps of cumulative precipitation in mm for the Ernesto event of August 8–10, 2012, based on CONAGUA gauge stations (black dots) in the (A) and NASA’s TMPA (TRMM Multi-satellite Precipitation Analysis) in the (B). The small red dot is the study area.
A third approach to estimate the Ernesto event precipitation was through an analysis of satellite precipitation radar, specifically the TRMM (Tropical Rainfall Measurement Mission) Multi-satellite Precipitation Analysis. These data are in the public domain and are available for public and research use through NASA (https://disc.gsfc.nasa.gov/datasets/TRMM_3B42_Daily_7/summary). Figure 6B shows a 3 day composite map of rainfall for the eastern Mexico region from August 8th–10th, 2012. The map is based on a 25 km × 25 km cell size. Also shown on this figure is the track of the storm on the 9th of August.
Surface Mapping of Inception Area
A necessary aspect to reconstructing the upper slope conditions of this lahar event and how it may have been triggered, involves the assessment of landscape change in the region of the inception area. As mentioned previously, there were no eyewitnesses to the event and no known before and after photographs of the immediate area (within a time span of a few months). Two high resolution satellite images frame the event, an image acquired January 2012, 8 months prior to Ernesto, and an image acquired May 2014, some 20 months after. Both images can be viewed by selecting the historical imagery option of Google Earth. Other geo-spatial data available were digital elevation models (DEMs) of the study area–a 90 m resolution product of SRTM (Shuttle Radar Topography Mission), a 30 m product produced by the ASTER sensor, an imaging radiometer onboard NASA’s Terra satellite, and a 15 m product based on airborne LiDAR produced by Mexico’s National Institute of Statistics and Geography (INEGI-Instituto Nacional de Estadística y Geografía, 2001). All were reviewed as part of this study, both before and after the event, and none were deemed to be useful at their coarse resolutions. There is no possible way to capture the details of a channel feature that averaged 7 m wide prior to the event, with a 15 m DEM (the best resolution product available). From a forensics perspective, it was realized that we could digitally reconstruct the pre-event landscape from post-event high resolution drone-based photogrammetry. To that end, we flew multiple drone mapping missions starting in 2017, mapping the entire Jamapa river valley, from the foot of the glacier through the proximal zone of the lahar runout, a distance of approximately 15 km.
Because of the unavailability of high-resolution DEMs needed to reconstruct the changes of the landscape, drone-based DEMs had to be developed. These models were developed from high-resolution (3cm/px) images acquired with a DJI Mavic Pro and DJI Phantom quadcopter. Flight paths were programmed using the Map Pilot mobile application and were set to a flight altitude of 100 m agl and a maximum flight speed of 7.7 m/s. The flight altitude was kept constant at 100 m agl by using the Terrain Awareness feature of this mobile application, which enabled the drone to adjust its elevation based on changes in topography to maintain the pre-selected altitude. The pre-programmed flight missions, in general, took 15 min and yielded 150 to 250 images with an 80% overlap between them and a 25% overlap between each mission.
The high-resolution drone images were imported into Drone Mapper, photogrammetry software that uses a proprietary algorithm and image-matching techniques to generate elevation measurements and a digital point cloud from stereo pairs of digital images. Although different photogrammetry software, Pix4D, was used to produce the DEM and orthomosaic of the pro-glacial ramp, the ease of use offered by Drone Mapper was found to be preferable and was therefore used for all subsequent DEM construction. A working resolution for the drone DEMs was set to 10 cm/px to avoid variation in the finalized products while minimizing the processing time and ensuring the topographic detail was not lost.
While we could elaborate here on the method of reconstructing the pre-event topography of the lahar inception area, that process is more usefully explained in the results section of this paper, where it has more forensic context.
Results
Precipitation Values During Ernesto Event
According to the TRMM (Tropical Rainfall Measurement Mission) Multi-satellite Precipitation Analysis (Figure 6B), the estimate of precipitation for the 3 day Ernesto event was 105.8 mm based on a mean of the two grid cells on either side of the study area location. This estimate is actually in quite good agreement with the interpolation (Figure 6A) based on the CONAGUA gauge stations alone, of 114 mm. For our subsequent analysis of the lahar event we will use a value of 106 mm for the 3 day total, with 85 mm (80% of the total) falling on August 9th. We estimate the uncertainty of the precipitation values derived here as ± 10%.
Further, it is important to take into account the following: It is presumed that the Ernesto event was a rainfall event, and not a snow event for the study area. However, remote sensing imagery indicates the event was most likely a snow event in the valley region above the inception site of the lahar. An analysis of MODIS (Moderate Resolution Imaging Spectroradiometer) imagery of Citlaltépetl on two clear-sky days (∼10:30 AM acquisitions) showed no snow on the mountain (other than that on the glacier surface) August 8th the day before the event. 6 days later, on August 15th, when skies first cleared, a mantle of snow can be seen covering the entire cone of the peak above the 4,600 m level. Another MODIS image on the 29th of August confirmed that this was an exceptionally high accumulation snow event. That image showed that the mantle of snow persisted, retreating only 100 m vertically to the 4,700 m level on average. Light snowfalls on Citlaltépetl, especially down to lower elevations below the seasonal 0° isotherm, typically persist 1–3 days at the most before melting (author´s own observations over a 20+ year period and Ontiveros-González et al., 2015).
Inception Area of the Lahar Event
To our knowledge, no one personally witnessed the beginning of the Ernesto lahar event. As such we are unable to precisely pin down the timing or the mechanics of the inception or genesis of the event. The only visual evidence available are photos from hikers and climbers taken before and after the event (ranging from months to years) as well as satellite imagery of the area. Figure 7 shows two high resolution satellite images acquired May of 2011 and March of 2014 as well as two photographs of the pro-glacial ramp area from March 2012 and August 2015. Both sets of before and after images show a remarkable change in the pro-glacial ramp area of the glacial valley. A deeply incised channel has appeared where none existed before Ernesto. The author’s own recollection of this channel before the event (from 2003 to 2010) was that it was at most 2–3 m in depth, 5–10 m wide and V-shaped, with gently sloping walls. No significant streamflow had ever been observed in this channel. Local farmers during the 1990’s had constructed two sets of aqueducts in an attempt to convey water away from the channel, at about the 4,350 m, from pools that form in the summer melt season. It is not coincidental that these springs are just below (in elevation) the lahar inception area at the downslope edge of the west-side flank of the terminal moraine.
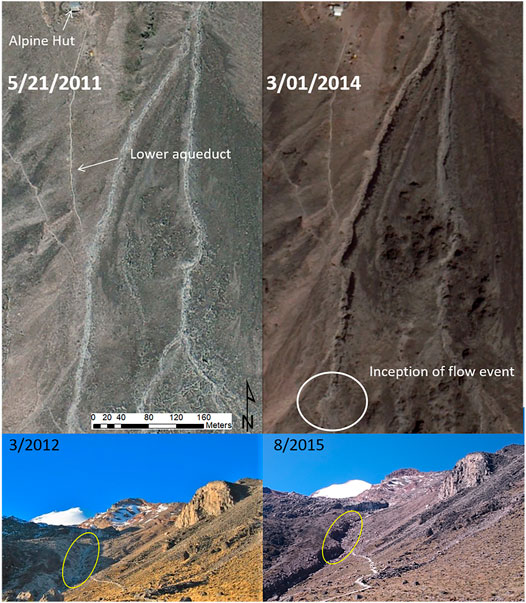
FIGURE 7. Multi-date satellite images of the proglacial ramp and excised channel above Alpine Hut (visible at top of image frames at 4,250 m). Lower edge of image frames is at elevation 4,490 m. Significant widening and deepening is observed after 2012 event (here 2011 and 2014 imagery). Lower photos (3/2012 and 8/2015) show clearly the before and after channel development.
Volume Estimation of Material Mobilized on the Pro-glacial Ramp
One aspect to reconstructing the upper slope conditions that were responsible for the lahar event is that of determining the volume of material that was initially mobilized by the Ernesto precipitation. To that end, high resolution topographic information would be necessary to calculate the change in the landscape from before to after, specifically in the area of the terminal moraine and pro-glacial ramp. However, the best available digital elevation models (DEMs) for the region are 15 m resolution and are thus too coarse to properly estimate the volume of removed material with an acceptable degree of accuracy.
Given the absence of any field-mapping on pre- or post-event geometry on the proglacial ramp channel, we first devised a simple half-cylinder cross-sectional model to calculate the volume of material removed in the erosion of the first linear kilometer of the channel (essentially the length of the ramp) (Figure 8). The model assumes a conservative doubling of channel width and a quadrupling of channel depth. The model also assumes a 25° hillside slope perpendicular to the channel, and no significant incision of the pre-event channel. These two assumptions are consistent with landscape and channel characteristics as observed by the authors prior to the event.
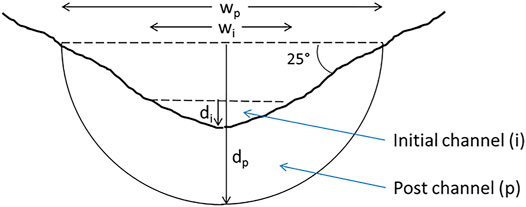
FIGURE 8. Graphic depicting our geometric model for calculating material excised in the channel on the proglacial ramp.
The product of the cross-sectional area of the excised material (the half circle area less the triangular area depicted in the Figure 8) and the channel length gives the volume of material removed. We used a conservative mean channel (post-event) width of 20 m and a channel length of 1,000 m. This yielded an excised volume of 110,400 m3. While such a simple geometric model suffices for a rough estimate of excised volume, we followed up on a more rigorous approach.
In 2017, the author’s conducted the first of several drone mapping flights over the pro-glacial ramp with the objective of creating high resolution (10 cm/px) DEM of the post Ernesto channel shape and topography. Given that no abnormal rain event had occurred in the study area between 2012 and 2017, we made the assumption that the channel had not undergone any significant volume changes. In fact, since 2017 we have observed the channel to be widening from wall collapse but becoming less deep as the wall material has not been carried downstream in any significant way. Therefore, while the channel is slowly changing shape in cross-section the volume has not changed appreciably.
In order to calculate a volume of the material removed in the channel, it was necessary to have a “before” event DEM representative of the surface topography as it existed prior to the last significant erosional event. This was achieved artificially by using the following method. The 2017 DEM, representing the after, was converted to a 2 m interval contour map using ArcMap’s spatial analyst tools. Each segment of contour representing the 2017 channel, from one side of the channel wall to the other, was manually edited to reflect the original channel cross-sectional shape and depth as observed in pre-2012 photos and from personal recollection (Figure 9B). The resultant edited contour map was converted back to a DEM (Figure 9A) and subtracted from the 2017 DEM using ArcMap’s map algebra tool to produce a channel thickness model (or raster) which represented the volume of material removed (Figure 10).
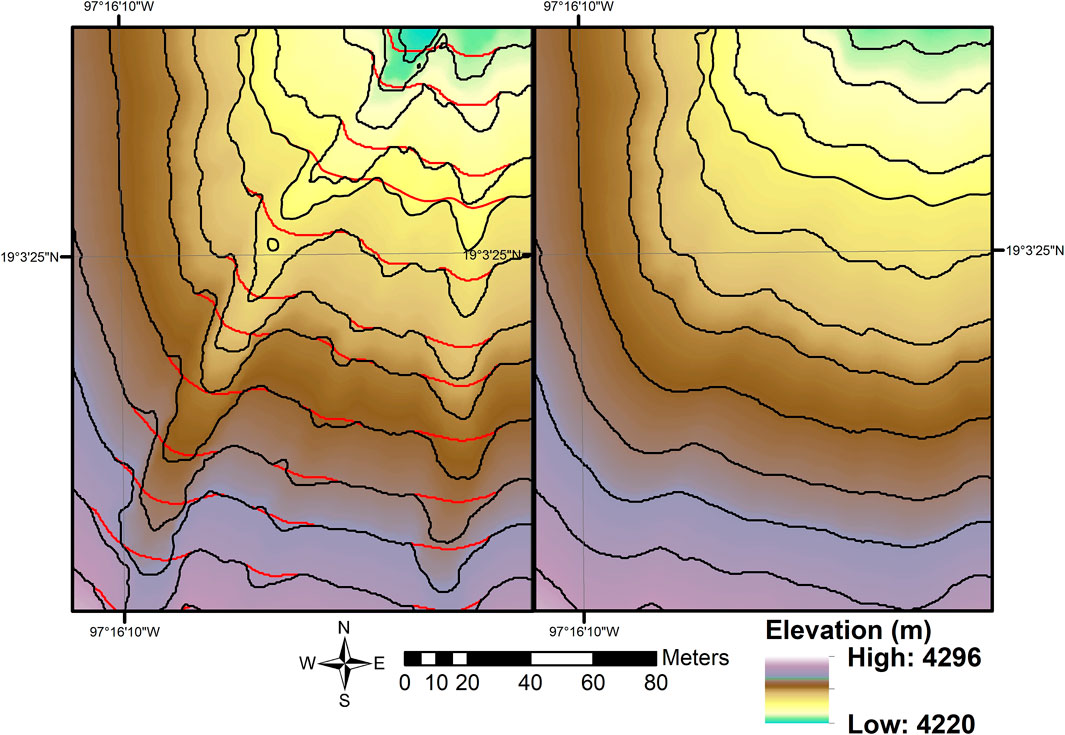
FIGURE 9. Illustrative example of contours overlaying DEMs to reflect pre-Ernesto channel topography (B) from post-Ernesto channel topography (A). The red contours, only channel contours shown, illustrate how contours were edited to recreate the pre-Ernesto topography in the mid-section of the proglacial ramp. Contour interval is 2 m.
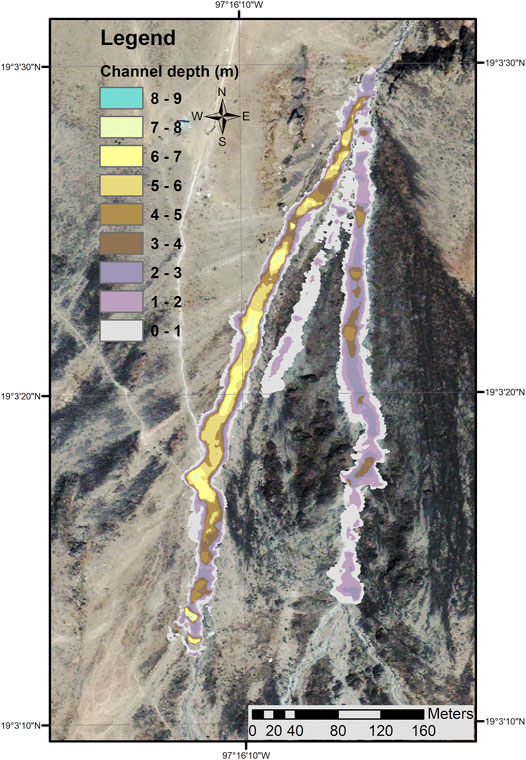
FIGURE 10. Graphic showing the result of the pre- and post-Ernesto DEM substraction described in the text (see also Figure 9). The colors depict thicknesses of the excised channel material. Background is 2003 Ikonos image.
Using the method described above, we determined the volume of material removed from the pro-glacial ramp during the Ernesto event to be 60,443 m3. We consider this number to be a conservative estimate of the volume removed. With the prior calculation of 110,400 m3 based on the original geometric model being a liberal estimate, we will consider a 95% probability that the volume of material removed by the Ernesto event was between 60,000 and 110,000 m3.
Discussion
While hurricane Ernesto moved across Mexico, a flood event (hyperconcentrated flow) originating in the upper reaches of the Jamapa river glacial valley as a debris flow quickly diluting, produced remarkable channel erosion along the whole transect of the upper Jamapa valley, impacting communities downstream and causing considerable infrastructure and environmental damage (DOF (Diario Oficial de la Federación, México, 2015; Morales-Martínez et al., 2016).
Post-event field observations and pre- and post-image analysis has shown convincing visual evidence that, in 2012, extraordinary channel incision took place on the pro-glacial ramp of the Jamapa glacier LIA terminal moraine. This was followed by significant channel widening and deepening downstream in the upper Jamapa valley for approximately 15 km, then large scale surficial erosion and vegetation removal to the end of the 25 km runout of the event near the town Excola as observed in post-event satellite imagery (Morales-Martínez et al., 2016). From first-hand accounts downstream, it is 100% certainty that a lahar event took place the 9th of August 2012, synchronous with the passing of tropical storm Ernesto. As observed by Capra et al. (2018) at Colima volcano, the lahar formation coincides with the peak in rainfall; even though there was no meteorological station directly at the lahar formation site, all stations at Pico de Orizaba lower flanks and the surroundings of the volcano show a precipitation peak the 9th of August coinciding with the lahar event.
Channel deepening and widening of several to tens of meters in the uppermost part of the Jamapa valley is difficult to explain with the 90–110 mm of rainfall estimated to have occurred during the storm event. In order to remove these considerable amounts of material by surface flows, high water discharge is needed, achieved usually by the junction of several small superficial flows. The aggregation of these surface flows increase downstream until sufficient volume is reached (and velocity) to start the erosional process. However, this is not what we see in this particular event. Erosion on a large scale started at the highest reaches of the watershed where the catchment area is quite small, and no aggregation of stream flow could have occurred. A close inspection and comparison of pre- and post-event imagery shows little if any evidence of tributary flow or formation above the point of inception of the lahar event.
Several small debris flows, coinciding with the retreat of the glacier tongue, have been documented and mapped on this proglacial ramp (Palacios et al., 1999). He also postulated the role of buried ice layers and insulating ash layers together with meltwater saturation as trigger mechanisms for recent (1990’s) small debris flows in the area above the alpine but below the beginning of the aqueduct (between 4,100 and 4,400 m approx.). However, in regard to permafrost, studies from the 1970’s (Heine, 1975) indicated a lower limit of permafrost at 4,600 m and later studies (Soto-Molina and Delgado-Granados, 2020) may place the lower limit of continuous permafrost at 4,880 m asl on the N volcano flank. So we do not believe that permafrost plays any role in the current moraine and ramp sediment hydrology. It is noteworthy to point out the remarkable similarities of the map Palacios et al. (1999) produced of the 1994 and 1995 debris flows on the proglacial ramp to the geomorphological feature of the 2012 lahar inception area (Figures 5, 7)
The final question is do we have sufficient rainfall to remove the calculated volume of material in a single event? The catchment area of the valley above the inception point of the channel erosion (at 4,400 m) is 680,000 m2, an area which covers about half the glacier and extends partway to the summit. This generates a volume of water of 68,000 m3 given a 100 mm rain event. This is more than enough water to transport our modeled volume of sediment and rock of approximately 65,000 m3 with an example 50/50 sediment to water ratio (taking an almost maximum value for the solid fraction for diluted flows (20–60% solids) (Beverage and Culbertson, 1964), assuming that none of the precipitation infiltrated–an assumption that has no basis whatsoever, given the highly porous surface materials observed in the glacial valley. Moreover, we are confident that precipitation fell as snow or hail above 4,700 m, leaving a much smaller catchment basin for actual rain.
The portion of the catchment below 4,700 m is 174,000 m2, generating approximately 17,400 m3 of rain, given the 100 mm event as a uniform depth. This would be enough water to form a debris flow with about 73% solids, assuming it was 100% runoff–which is an impossible assumption. Given that the reported date of the beginning of the flood was on the 9th, we cannot envision any conventional mechanism to move that quantity of water (or even a fraction of it) into the drainage system either overland or as groundwater—the former because we see no visual evidence of runoff and gully formation above the moraine from the post-event imagery, and the latter because the subsurface transport time for infiltrating rain would be much too long for a groundwater influx to arrive at the lahar inception point. However, a pressure head is near immediate.
This leads to our hypothesis that glacial melt in the summer melt season has largely saturated the sediment column in the west side lateral moraine and what remains of the west flank of the terminal moraine, maintaining a high water table. Small height increases of this potentiometric surface driven by daily melt pulses from the glacier would explain the daily streamflow behavior in the channel below the moraine, in the vicinity of where the aqueducts intersect the channel.
The rapid downward infiltration of rainwater from the Ernesto event in the porous west-side deposits would have immediately and substantially raised the potentiometric surface and thus pore water pressure. Such an event has immediate consequences and is fundamentally both a hydrologic and soil mechanics problem. The total vertical stress in a saturated column of granular material is equal to the sum of the vertical effective stress and the pore water pressure. This is summarized by the following equation.
The vertical effective stress is the pressure across grain-to-grain contacts in a matrix and is responsible for the rigidity of the material. The pore water pressure acts equally on all grain surfaces and is counter to the effective stress. As long as the total vertical stress is unchanging, or
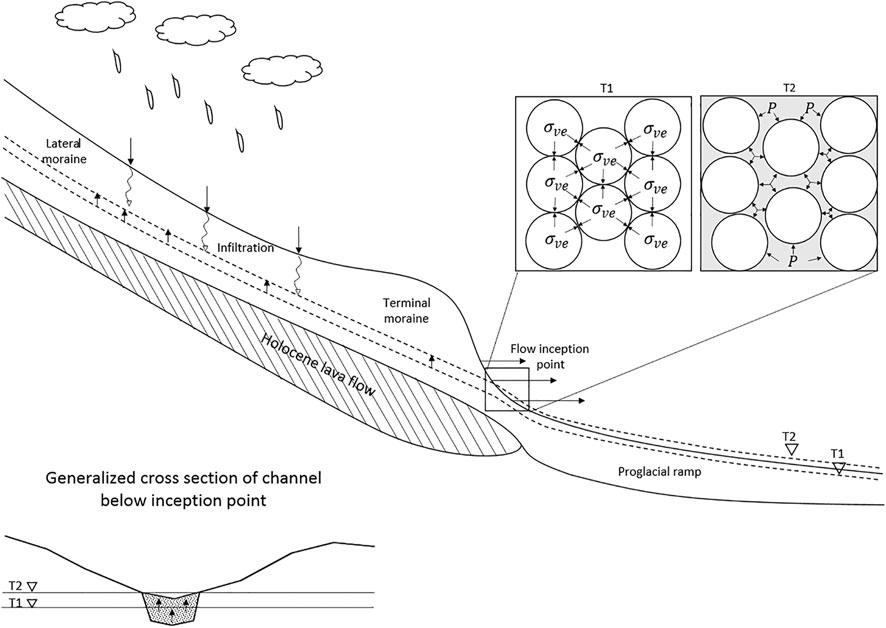
FIGURE 11. Conceptualized graphical drawing, depicting a likely triggering scenario for the observed excision of the sediments in the proglacial ramp channel. The pre- and post- potentiometric surfaces (dashed lines) are shown as T1 and T2 in the longitudinal and transverse cross sections. The insets illustrate the opposing effective stress and pore water stress at grain scale.
Most likely, the channel deposits liquefied and began moving at once. This would explain the morphology of the west side post-event channel, where excision only occurred in the channel. The channel on the east side of the ramp, draining the lava flow for the most part, could have been formed with more conventional overland flow erosion.
This destabilization of moraine deposits phenomenon should come as no surprise to Alpine glaciologists who for years have documented similar moraine outbursts and debris flow events in the Alps (Chiarle et al., 2007), events often triggered by short intense rainfall events overpressuring saturated morainal sediments. Chiarle (2000) study documented 9 debris flows triggered by rainfall and saturation conditions. The most severe of those events had a flow runout of just about 5 km compared to our 25 km, which is explained by the large addition of precipitation and surface water as the material flowed downslope. Although initiated as a debris flow, this way the lahar became hyperconcentrated quickly, as preserved channel deposits show in the proximal area. Incipient stratification and some sorting can be observed along the first 5 km already. Some of the alpine events had total volumes approaching 800,000 m3.
Conclusion
The tropical storm Ernesto event of August 2012 had devastating consequences in the upper Jamapa River valley on the northeast slopes of Citlaltépetl, an ice-capped stratovolcano in eastern Mexico. A lahar event starting as a debris flow, later becoming hyperconcentrated by the quick incorporation of overland and stream water downstream, impacted river channel morphology and the human and natural environment for a remarkable 25 km. This was no ordinary mountain rainfall instigating a flood event, however. It had its origins in a glacial valley with a once extensive and now receded glacial tongue leaving reasonably preserved LIA moraines. Initial ponding of melt water behind those end moraines resulted in large morphological transformation of the proglacial ramp (debris flows breaching these moraines), after main glacier retreat started (see Palacios et al., 1999) after the LIA maximum. Glacier retreat leaves behind unconsolidated material, which after being exposed represents an easily removable medium, once there is any kind of water supply (Chiarle et al., 2007).
Minor debris flows continued to occur since then (Palacios and Vazquez Selem, 1996; Palacios, 1999), restricted in runout, due to input water restrictions.
The Ernesto precipitation event provided sufficient water to remove the lowermost portion of the former incipient water drainage channel (bottom of the valley formed along the proglacial ramp) in the form of liquefaction and a debris flow. Substantial water input (larger watershed area) when moving downslope led to dilution of the initial debris flow into a hyperconcetrated flow, which eroded and deposited along a 25 km long transect along the Jamapa channel.
In situ field observations, photographic records, satellite imagery, and our analysis show reasonably clear evidence that this flow event started as a moraine/ramp outburst (or better, liquefaction from a rising water table) event forming a debris flow, quickly transforming into hyperconcentrated flow downslope. Due to the channel excavation which occurred during the 2012 event, is has been observed that the channel flow is more frequent and more continuous, corresponding to the higher water table relative to the channel bottom, as all the overlying loose material was removed.
The remaining ice cap on Citlaltépetl continues to melt. That water continues to move downslope primarily as groundwater, and most likely will maintain high saturation levels within the glacial and volcanoclastic sediments at the LIA terminal and lateral moraines and proglacial ramp. But before Citlaltépetl’s ice is gone, the approximately one million people that live under its shadow must be ever so aware of the hazard related to lahar events, not to mention the loss of a dependable water supply. That tropical storm activity in the southern Gulf will most likely intensify in coming years, in the context of a warming ocean and atmosphere, is a reminder and a warning that glacial-mountain environments, unstable moraines and high altitude rain events are a dangerous mix.
Data Availability Statement
The raw data supporting the conclusions of this article will be made available by the authors, without undue reservation.
Author Contributions
All authors contributed to the field work, basic for this research. KS and BW had the original idea of the manuscript, but all authors contributed to the manuscript.
Funding
Funding was provided partly by GeoscientistsWithoutBorders® (GWB) Program of the Society of Exploration Geophysicists (SEG), through the project “Hydrometeorologic and geologic hazards at Pico de Orizaba volcano, Mexico” and also by the French and Mexican Government (ECOPICS project, ANR-16-CE03-0009, and CONACYT-2 73659).
Conflict of Interest
The authors declare that the research was conducted in the absence of any commercial or financial relationships that could be construed as a potential conflict of interest.
Publisher’s Note
All claims expressed in this article are solely those of the authors and do not necessarily represent those of their affiliated organizations, or those of the publisher, the editors and the reviewers. Any product that may be evaluated in this article, or claim that may be made by its manufacturer, is not guaranteed or endorsed by the publisher.
References
Beverage, J. P., and Culbertson, J. K. (1964). Hyperconcentrations of Suspended Sediment. J. Hydr. Div. 90 (6), 117–128. doi:10.1061/jyceaj.0001128
Bradley, R., Vuille, M., Diaz, H., and Vergara, W. (2006). Threats to Water Supply in the Tropical Andes. Science. 312, 57811755–57811756. doi:10.1126/science.1128087
Brown, D. P. (2013). Tropical Cyclone Report: Hurricane Ernesto (AL052012). Retrieved from http://www.nhc.noaa.gov/data/tcr/AL052012_ Ernesto.pdf September 2, 2015).
Brown, S., Weissling, B., and Lewis, M. J. (2005). An Ice Thickness Study Utilizing Ground Penetrating Radar on the Lower Jamapa Glacier of Citlaltepetl (El Pico de Orizaba), Mexico. Workshop on Radar Investigations of Planetary and Terrestrial Environments, Houston, Texas. Available at: https://ntrs.nasa.gov/citations/2005016197.
Capra, L., Macías, J. L., Scott, K. M., Abrams, M., and Garduño-Monroy, V. H. (2001). Debris Avalanche and Debris Flow Transformed from Collapse in the Trans-Mexican Volcanic Belt, Mexico – Behavior, and Implications for hazard Assessment. J. Volcanology. Geotherm. Res. 2362, 1–30. doi:10.1016/S0377-0273(01)00252-9
Capra, L., Coviello, V., Borselli, L., Márquez-Ramírez, V.-H., and Arámbula-Mendoza, R. (2018). Hydrological Control of Large hurricane-induced Lahars: Evidence from Rainfall-Runoff Modeling, Seismic and Video Monitoring. Nat. Hazards Earth Syst. Sci. 18, 781–794. doi:10.5194/nhess-18-781-2018
Carrasco-Núñez, G., and Gómez-Tunea, A. (1997). “Volcanogenic sedimentation around Citlaltépetl volcano (Pico de Orizaba) and surroundings, Veracruz, Mexico,” in Magmatism and Tectonics in the Central and Northwestern Mexico – A Selection of the 1997 IAVCEI General Assembly Excursions. Editors G. J. Aguirre-Díaz, J. J. Aranda-Gómez, G. Carrasco-Núñez, and L. Ferrari (Mexico, DF: UNAM, Inst. Geol.), 131–151.
Carrasco-Núñez, G. (2000). Structure and proximal stratigraphy of Citlaltépetl volcano (Pico de Orizaba), Mexico. Geol Soc Am Spec Paper, 334.
Carrasco-Núñez, G., Díaz-Castellón, R., Siebert, L., Hubbard, B., Sheridan, M. F., and Rodríguez, S. R. (2006). Multiple Edifice-Collapse Events in the Eastern Mexican Volcanic Belt: The Role of Sloping Substrate and Implications for hazard Assessment. J. Volcanology Geothermal Res. 158 (1-2), 151–176. doi:10.1016/j.jvolgeores.2006.04.025
Carrasco-Núñez, G., Vallance, J. W., and Rose, W. I. (1993). A Voluminous Avalanche-Induced Lahar from Citlaltépetl Volcano, Mexico: Implications for hazard Assessment. J. Volcanology Geothermal Res. 59, 35–46. doi:10.1016/0377-0273(93)90076-4
Cavazos, T., and Hastenrath, S. (1990). Convection and Rainfall over Mexico and Their Modulation by the Southern Oscillation. Int. J. Climatol. 10 (4), 377–386. doi:10.1002/joc.3370100405
Chiarle, M. (2000). Analisi dei Pericolinaturali in ambiente glaciale. Italy: Unpublished PhD thesisPolitecnico di Torino.
Chiarle, M., Iannotti, S., Mortara, G., and Deline, P. (2007). Recent Debris Flow Occurrences Associated with Glaciers in the Alps. Glob. Planet. Change 56, 123–136. doi:10.1016/j.gloplacha.2006.07.003
CONAGUA (2012). Reseña del huracán “Ernesto” del Océano Atlántico. SEMARNAT. 11. Available at: http://smn.cna.gob.mx/ciclones/tempo2012/atlantico/Ernesto-a2012.pdf.
Cortés-Ramos, J., Delgado-Granados, H., Huggel, C., and Ontiveros-González, G. (2019). Evolution of the Largest Glacier in Mexico (Glaciar Norte) since the 50s: Factors Driving Glacier Retreat. Geografiska Annaler: Ser. A, Phys. Geogr. 101 (4), 350–373. doi:10.1080/04353676.2019.1675465
DOF (Diario Oficial de la Federación, México (2015). ACUERDO por el que se da a conocer el Resumen del Programa de Manejo del Parque Nacional Pico de Orizaba. Available at: http://dof.gob.mx/nota_to_doc.php?codnota=5399982.
DOF (Diario Oficial de la Federación, México) (2012). Declaratoria de Emergencia por la presencia de la tormenta tropical Ernesto (lluvia severa) el 9 de agosto de 2012, en 40 municipios del Estado de Veracruz de Ignacio de la Llave. Available at: http://dof.gob.mx/nota_detalle.php?codigo=5265156&fecha=23/08/2012.
Emanuel, K. (2021). Response of Global Tropical Cyclone Activity to Increasing CO2: Results from Downscaling CMIP6 Models. Am. Meteorol. Soc 34, 57–70. doi:10.1175/JCLI-D-20-0367.1
Franco-Ramos, O., Ballesteros-Cánovas, J. A., Figueroa-García, J. E., Vázquez-Selem, L., Stoffel, M., and Caballero, L. (2020). Modelling the 2012 Lahar in a Sector of Jamapa Gorge (Pico de Orizaba Volcano, Mexico) Using RAMMS and Tree-Ring Evidence. Water 12 (2), 333. doi:10.3390/w12020333
Gruber, S., and Haeberli, W. (2007). Permafrost in Steep Bedrock Slopes and its Temperature-Related Destabilization Following Climate Change. J. Geophys. Res. 112. doi:10.1029/2006JF000547
Heine, K. (1988). Late Quaternary Glacial Chronology of the Mexican Volcanoes. Die Geowissenschaften 7, 197–205.
Heine, K. (1975). Permafrost am Pico de Orizaba/Mexiko. E&g Quat. Sci. J. 26, 212–217. doi:10.3285/eg.26.1.13
Heine, K. (1994). Present and Past Geocryogenic Processes in Mexico. Permafrost Periglac. Process. 5, 1–12. doi:10.1002/ppp.3430050102
Hoskuldsson, A., and Robin, C. (1993). Late Pleistocene to Holocene eruptive activity of Pico de Orizaba, Eastern Mexico. Bull. Volcanol 55, 571–587. doi:10.1007/bf00301810
Huggel, C., Clague, J. J., and Korup, O. (2011). Is Climate Change Responsible for Changing Landslide Activity in High Mountains? Earth Surf. Process. Landforms 37, 77–91. doi:10.1002/esp.2223
INEGI - Instituto Nacional de Estadística y Geografía (2001). Principales resultados del Censo de Población y Vivienda 2010, México. Available at: http://www.inegi.gob.mx.
Kääb, A., Reynolds, J. M., and Haeberli, W. (2005). “Glacier and Permafrost Hazards in High Mountains,” in Global Change and Mountain Regions: An Overview of Current Knowledge. Editors U. M. Huber, H. K. M. Bugmann, and M. A. Reasoner (Dordrecht: Kluwer Academic Publishers), 225–234. doi:10.1007/1-4020-3508-x_23
Lachniet, M. S., and Vazquez-Selem, L. (2005). Last Glacial Maximum Equilibrium Line Altitudes in the Circum-Caribbean (Mexico, Guatemala, Costa Rica, Colombia, and Venezuela). Quat. Int. 138-139, 129–144. doi:10.1016/j.quaint.2005.02.010
Lauer, W., and Klaus, D. (1975). Geoecological Investigations on the Timberline of Pico de Orizaba, Mexico. Arctic Alpine Res. 7, 315–330. doi:10.2307/1550176
McGuire, B. (2010). Potential for a Hazardous Geospheric Response to Projected Future Climate Changes. Phil. Trans. R. Soc. A. 368, 2317–2345. doi:10.1098/rsta.2010.0080
Morales Martínez, M. A., Welsh Rodríguez, C. M., Ruelas Monjardín, L. C., Weissling, B., Sieron, K., Ochoa Martínez, C. A., et al. (2016).Afectaciones por posible asociación de eventos hidrometeorológicos y geológicos en los municipios de Calcahualco y Coscomatepec, in Veracruz. Teoría Y Praxis, Octubre, 12. México: Universidad de Quintana Roo Cozumel, 31–49. doi:10.22403/uqroomx/typne2016/02
Ontiveros-González, G., Delgado-Granados, H., and Cortés-Ramos, J. (2015). Surface Energy Balance Model for High-Altitude Glacial System at 19 °N on Glaciar Norte, Mexico. Geofís Int. 54-4, 299–314.
Palacios, D., Parrilla, G., and Zamorano, J. J. (1999). Paraglacial and postglacial debris flows on a Little Ice Age terminal moraine: Jamapa Glacier, Pico de Orizaba (Mexico). Geomorphology 28, 95–118. doi:10.1016/s0169-555x(98)00098-1
Palacios, D., and Vázquez-Selem, L. (1996). Geomorphic Effects of the Retreat of Jamapa Glacier, Pico De Orizaba Volcano (Mexico). Geografiska Annaler: Ser. A, Phys. Geogr. 78 (1), 19–34. doi:10.1080/04353676.1996.11880449
Reinthaler, J., Paul, F., Granados, H. D., Rivera, A., and Huggel, C. (2019). Area Changes of Glaciers on Active Volcanoes in Latin America between 1986 and 2015 Observed from Multi-Temporal Satellite Imagery. J. Glaciol. 65 (252), 542–556. doi:10.1017/jog.2019.30
Richardson, S. D., and Reynolds, J. M. (2000). An Overview of Glacial Hazards in the Himalayas. Quat. Int. 65-66, 31–47. doi:10.1016/s1040-6182(99)00035-x
Rodríguez, S. R., Mora-González, I., and Murrieta-Hernández, J. L. (2006). Flujos de baja concentración asociados con lluvias de intensidad extraordinaria en el flanco sur del volcán Pico de Orizaba (Citlaltépetl). México, Sociedad Geológica Mexicana, A.C, 58. 223–236. doi:10.18268/bsgm2006v58n2a5
Schaaf, P., and Carrasco-Núñez, G. (2010). Geochemical and isotopic profile of Pico de Orizaba (Citlaltépetl) volcano, Mexico: Insights for magma generation processes. J. Volcanology Geothermal Res. 197 (1-4), 108–122. doi:10.1016/j.jvolgeores.2010.02.016
Secretaría de Gobernación (23 de agosto de (2012). Declaratoria de Emergencia por la presencia de la tormenta tropical Ernesto (lluvia severa) el 9 de agosto de 2012, en 40 municipios del Estado de Veracruz de Ignacio de la Llave. Diario Oficial de la Federación. Available at: http://dof.gob.mx/nota_detalle.php?codigo=5265156&fecha=23/08/2012 .
Sheridan, M. F., Carrasco-Nuñez, G., Hubbard, B. E., Siebe, C., and Rodríguez Elizarrarás, S. (2001). Mapa de Peligros del Volcán Citlaltépetl (Pico de Orizaba), UNAM, CUPREDER, UAP, Gobierno. del Estado de Veracruz, Mexico: Universidad Nacional Autónoma de México.
Simkin, T., Siebert, L., McClelland, L., Bridge, D., Newhall, C., and Latter, J. H. (1981). Volcanoes of the World: A Regional Directory, Gazetteer, and Chronology of Volcanism during the Last 10,000 Years. Pennsylvania: U.S. Hutchinson Ross Publishing, 232.
Soto Molina, V. H., and Delgado Granados, H. (2020). Distribution and current status of permafrost in the highest volcano in North America: Citlaltepetl (Pico de Orizaba), Mexico. GeofInt 59 (1), 39–53. doi:10.22201/igeof.00167169p.2020.59.1.2079
White, S. E. (1981). Equilibrium Line Altitudes of Late Pleistocene and Recent Glaciers in Central Mexico. Geografiska Annaler: Ser. A, Phys. Geogr. 63 (3/4), 241–249. doi:10.1080/04353676.1981.11880039
Zimbelman, D. R., Watters, R. J., Firth, I. R., Breit, G. N., and Carrasco-Nunez, G. (2004). Stratovolcano Stability Assessment Methods and Results from Citlaltépetl, Mexico. Bull. Volcanology 66, 66–79. doi:10.1007/s00445-003-0296-8
Keywords: Citlaltépetl (Pico de Orizaba), Jamapa glacier, hurricane Ernesto, upper slope conditions, secondary lahar
Citation: Sieron K, Weissling B, Morales-Martínez MA and Teran S (2021) Reconstruction of the Upper Slope Conditions of an Extraordinary Hydro-Meteorological Event Along the Jamapa Glacier Drainage System, Citlaltépetl (Pico de Orizaba) Volcano, Mexico. Front. Earth Sci. 9:668266. doi: 10.3389/feart.2021.668266
Received: 15 February 2021; Accepted: 12 July 2021;
Published: 23 July 2021.
Edited by:
Holger Frey, University of Zurich, SwitzerlandReviewed by:
Jorge Cortés-Ramos, Center for Scientific Research and Higher Education in Ensenada, MexicoVelio Coviello, Free University of Bozen-Bolzano, Italy
Copyright © 2021 Sieron, Weissling, Morales-Martínez and Teran. This is an open-access article distributed under the terms of the Creative Commons Attribution License (CC BY). The use, distribution or reproduction in other forums is permitted, provided the original author(s) and the copyright owner(s) are credited and that the original publication in this journal is cited, in accordance with accepted academic practice. No use, distribution or reproduction is permitted which does not comply with these terms.
*Correspondence: Katrin Sieron, a3NpZXJvbkB1di5teA==