 Zhongying Zhao
 Lianhua Hou*
- Research Institute of Petroleum Exploration and Development, PetroChina, Beijing, China
The Lucaogou Formation in the Jimsar Sag is a typical lacustrine shale oil development area where the first large-scale shale oil field in China was discovered, and a large number of studies have been conducted on the genesis and distribution of the shale oil in this formation. However, few detailed studies have been conducted on the comparison between the characteristics of the hydrocarbons in the shale and the adjacent tight reservoirs in the same shale sequence package. In this study, the total scanning fluorescence (TSF) quantitative fluorescence technique, which has been rarely applied to and studied in the Lucaogou Formation in the Jimsar Sag, was used to conduct systematic quantitative fluorescence analysis of the shale, tight reservoirs, and crude oils in the Lucaogou Formation. The geochemical analysis was also carried out for all samples. The results revealed that the shale, tight reservoirs, and oils have similar single-peak TSF spectrograms, and different values of the TSF parameters in the Lucaogou Formation. The TSF parameters R1 and R2 values of the blocky shale, fractured shale, tight reservoirs, and produced oils are decreased successively. The TSF parameters can be used as indicators of hydrocarbon composition, physical properties, thermal maturity, migration, and oil-producing layers. The values of TSF parameters R1 and R2 are generally smaller in the upper section of the Lucaogou Formation (P2l2) than in the lower section (P2l1), indicating that the hydrocarbons in the upper section have better physical properties and higher thermal maturity. The distribution of TSF parameters R1 and R2 in the upper section of the Lucaogou Formation is relatively scattered, indicating that the hydrocarbons have undergone obvious lateral migration. Based on the TSF parameter comparison of core and oil samples, it was preliminarily determined that the shale oil in the upper and lower sections of the Lucaogou Formation was mainly produced from the tight reservoirs in the shale sequence. The results of this study provide new data and ideas for fine studies of the shale oil in the Lucaogou Formation in the Jimsar Sag.
Introduction
Following the shale revolution in North America, the shale oil industry has flourished in the Mesozoic-Cenozoic lacustrine shale in China (Zou et al., 2013; Li et al., 2015; Liu et al., 2017, 2021; Zhao et al., 2018; Hou et al., 2020a,b,c; Ma et al., 2020; Wang et al., 2020). The Junggar Basin has abundant shale oil resources and is the first basin in China in which shale oil has been developed on a large scale. China’s first large-scale shale oil field was discovered in the Jimsar Sag, and the first national-level shale oil demonstration area in China was built there (Wang et al., 2019). Well J174 was drilled in the Jimsar Sag, and it was the first well in China to collect core samples of an entire set of the shale strata of the Lucaogou Formation (over 200 m). The shale oil in the Lucaogou Formation in the Jimsar Sag has been developed for more than 10 years, and numerous studies have been carried out on the sedimentary environment, shale oil genesis, source rock evaluation, reservoir characterization, the patterns of shale oil enrichment and distribution, and shale oil sweet spot identification in this area (Kuang et al., 2012; Gao et al., 2016; Qiu et al., 2016; Chen et al., 2018; Pang et al., 2018; Liu C. et al., 2019; Zha et al., 2019; Hou et al., 2021a,b). However, few detailed studies have been conducted on the comparison between the characteristics of the hydrocarbons in the shale and the adjacent tight reservoirs in the same shale sequence.
The total scanning fluorescence (TSF) technique has been widely used in conventional oil and gas research. It is an important method for fine oil source correlation, exploring reservoir oil and gas properties, identifying current and ancient oil layers, and for the fine analysis of oil and gas properties and migration characteristics (Brooks et al., 1983; Reyes, 1993; Li et al., 2007; Liu et al., 2014, 2016; Fan et al., 2015; Kong et al., 2019). However, TSF research results are rarely reported for the shale oil in the Lucaogou Formation in the Jimsar Sag. TSF is a new quantitative fluorescence analysis technique that was developed based on fluorescence spectroscopy in the 1980s. It uses the emission spectrum obtained by scanning the excitation light with a continuously changing wavelength, and it is an effective method of measuring the distribution and concentration of the aromatic hydrocarbon components (Brooks et al., 1983; Fan et al., 2015; Liu et al., 2016). The hydrocarbons of different origins or extracted from different rocks have different TSF fluorescence spectral characteristics, which are mainly manifested as different indicators, such as the profile of the spectrogram, the position of the main peak, the fluorescence intensity of the specific peak, and the ratio of the fluorescence intensity of two specific peaks. The TSF technique has a fast speed, high sensitivity, small amount of sample required, and fine quantitative and comparative analysis of micro-areas. This technique can be used to perform systematic, continuous quantitative fluorescence analysis of the shale and the adjacent tight reservoirs and for the fine comparison of the fluorescence characteristics of the shale and the adjacent tight reservoirs in the same shale sequence package. Therefore, it provides a good method for studying the factors that control the formation and enrichment of lacustrine shale oil.
In this study, the TSF technique was used to quantitatively analyze the fluorescence characteristics of the shale oil in the Lucaogou Formation in the Jimsar Sag. The shale and the adjacent tight reservoirs in the upper and lower sections of the Lucaogou Formation in Well J174 were systematically and continuously sampled. Oil samples were collected from oil-producing wells in the Lucaogou Formation in the Jimsar Sag. The TSF quantitative fluorescence characteristics of the Lucaogou Formation shale, its adjacent tight reservoirs, and the crude oil samples were systematically analyzed. In addition, all the samples were subjected to geochemical analysis. The relationship between TSF parameters and geochemical parameters were discussed in order to further explore the TSF characteristics of the Lucaogou Formation and their use in guiding shale oil exploration. The results of this study provide new data for the fine studies of the shale oil in the Lucaogou Formation in the Jimsar Sag and new ideas for the detailed studies of shale oil in other lacustrine basins.
Geologic Setting
The Jimsar Sag is located in the southeastern edge of the Junggar Basin in northwestern China. It is a half-graben depression that is deep in the west and shallow in the east, with an area of 1278 km2 (Graham et al., 1990; Gao et al., 2016; Hu et al., 2018; Figure 1). The Permian Lucaogou Formation is the main source rock in the Jimsar Sag and the main stratum for shale oil exploration. The 100–300 m thick Lucaogou Formation was deposited in a semi-deep to deep lake environment with an arid climate and a high salinity (Cao et al., 2016; Ding et al., 2020). The Lucaogou Formation has a complex lithology and strong heterogeneity. The multiple sets of interbedded high-quality source rocks are mainly composed of siliceous and carbonate shales; while the tight reservoirs are mainly composed of siliceous and carbonate siltstones (Kuang et al., 2012; Yang et al., 2019). The Lucaogou Formation consists of an upper section (P2l2) and a lower section (P2l1), each of which contains a set of shale oil sweet spots. The thickness of the upper Lucaogou Formation shale oil sweet spot is about 41 m, and the main part is located in the middle of the depression, with an area of 640 km2. The shale oil sweet spots in the lower Lucaogou Formation are distributed in the sag, with an area of 1096 km2 and a relatively large thickness in the southern part of the sag (Zhi et al., 2019).
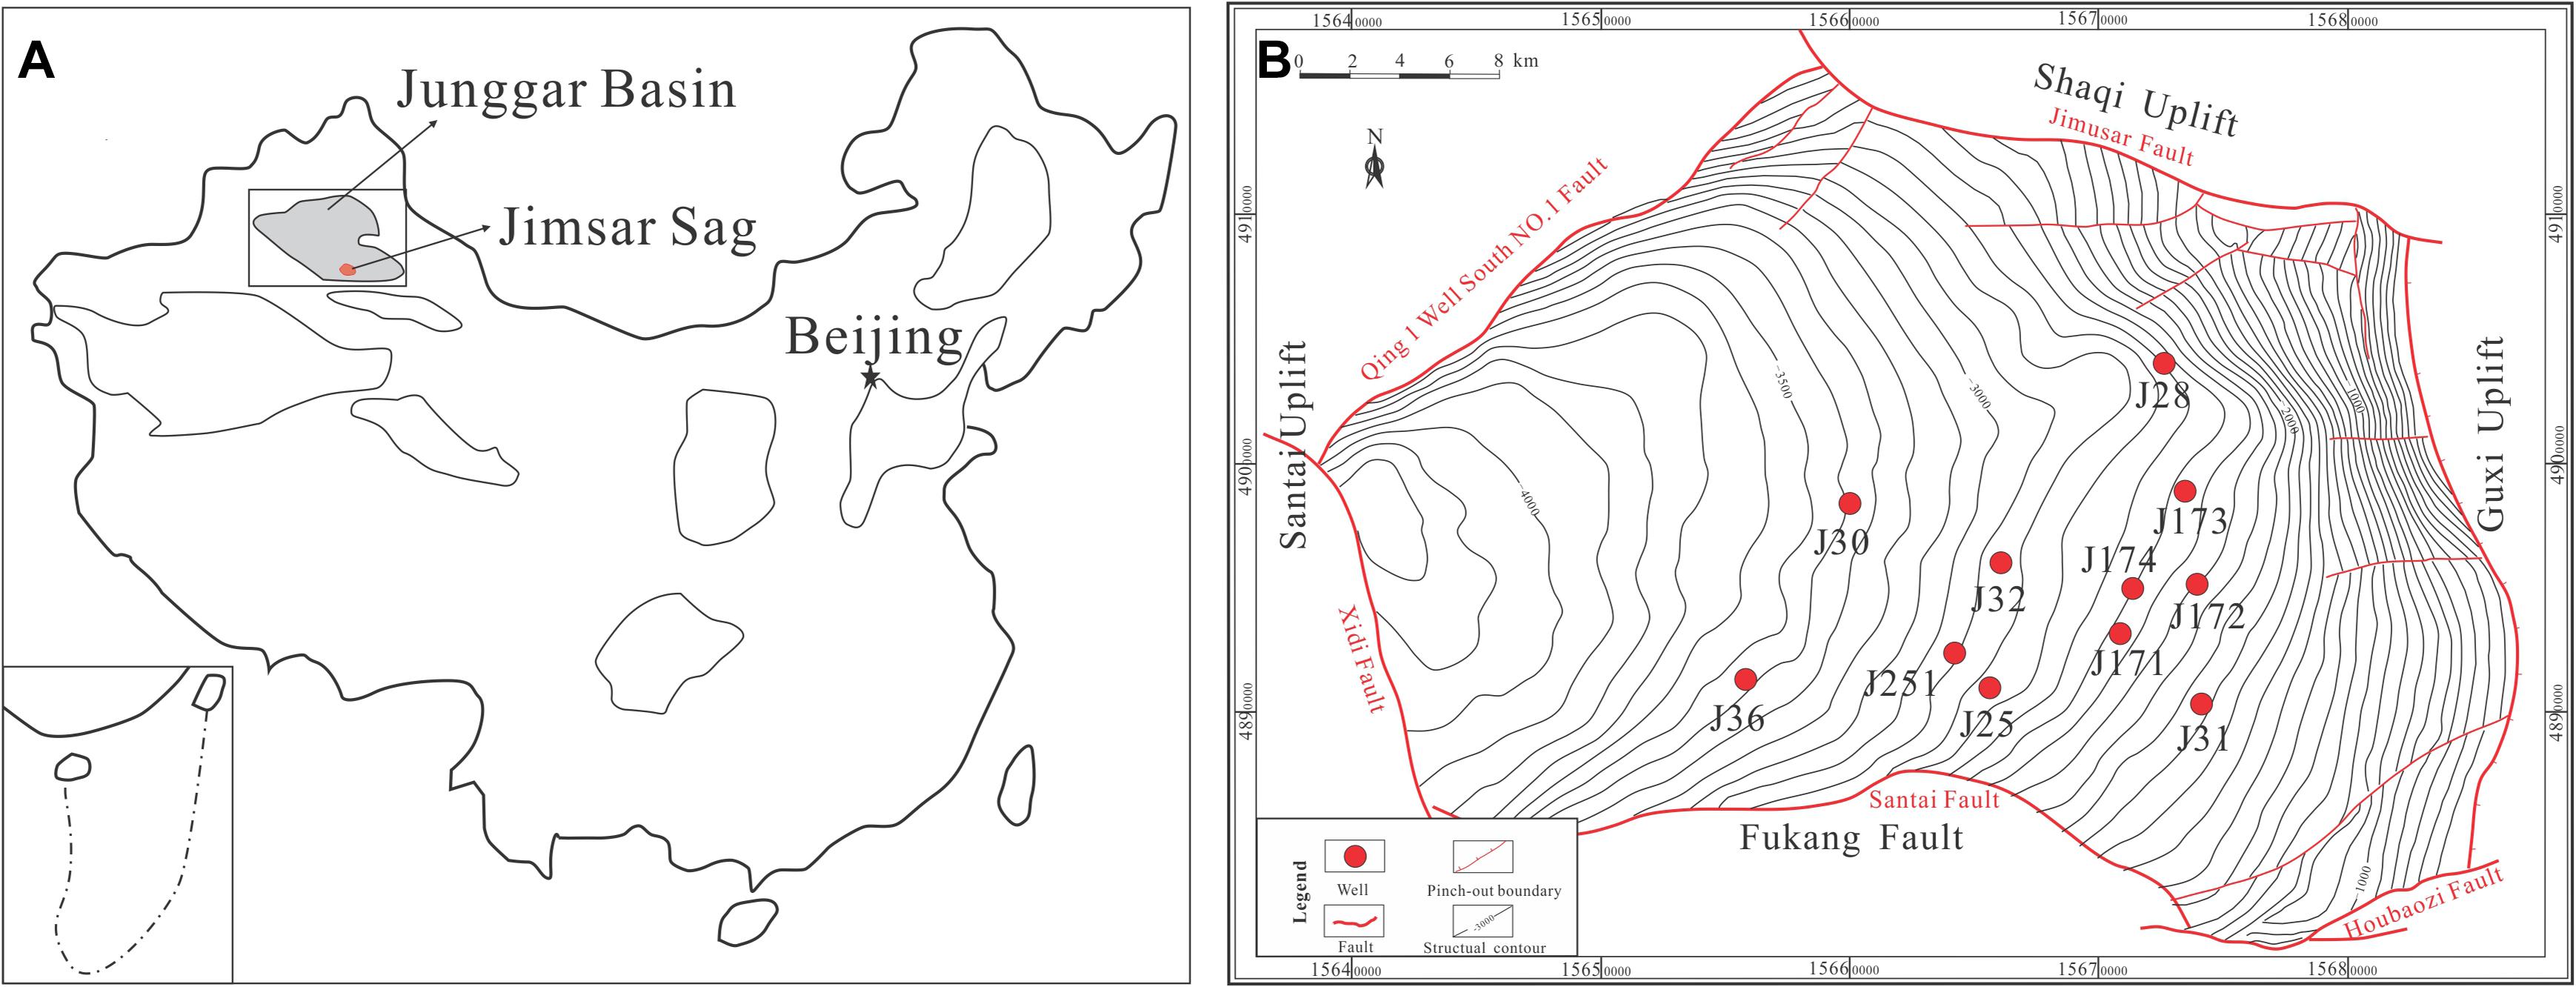
Figure 1. Location of the sampling wells in the Jimsar Sag, Junggar Basin. (A) Locations of Junggar Basin and the Jimsar Sag. (B) Locations of oil wells, with a contour map of the Lucaogou Formation.
The exploration of the Lucaogou Formation in the Jimsar Sag was divided into three stages: In the 2010–2011 exploration and discovery stage, well J25 was discovered, with a daily oil production of 18.25 t and a cumulative oil production of 264.94 t. In the 2012–2015 pilot test stage, the drilling of 22 wells was completed, and 15 wells achieved industrial oil flow. In the key breakthrough stage from 2016 to 2017, 31 horizontal wells were deployed, with a new production capacity of 31.95 × 10⁴ t, achieving an overall breakthrough in the exploration and development of shale oil in the Lucaogou Formation in the Jimsar Sag (Wang et al., 2019). Currently, the upper sweet spot has oil reserves of over 4.5 × 10⁸ t and the lower sweet spot has oil reserves of over 6.7 × 10⁸ t (Zhao et al., 2020).
Samples and Methods
In this study, 22 core samples from the upper and lower sections of the Lucaogou Formation were collected from Well J174 in the Jimsar Sag. The basic information for these samples is presented in Table 1. 11 oil samples were collected from the main oil-producing wells in the Lucaogou Formation in the Jimsar Sag. The locations of these wells are shown in Figure 1B, and the basic information for the oil samples is presented in Table 2. The core samples were subjected to thin section analysis, X-ray diffraction (XRD) analysis, rock pyrolysis analysis, total organic carbon (TOC) determination, and TSF analysis. An extraction experiment was carried out on the core sample, and the extract was subjected to group component analysis, gas chromatography (GC) analysis, and gas chromatography-mass spectrometry (GC-MS) analysis. Physical property determination, group component analysis, GC analysis, GC-MS analysis, and TSF analysis were conducted on the crude oil samples. The TSF analysis was performed in the Australian Commonwealth Scientific and Industrial Research Organization (CSIRO) laboratory. The determination of the physical properties of the crude oil was completed at the Institute of Experiment and Analysis of the Xinjiang Oilfield Company. The other analyses were conducted by the Research Institute of Petroleum Exploration and Development, China National Petroleum Corporation, Beijing.
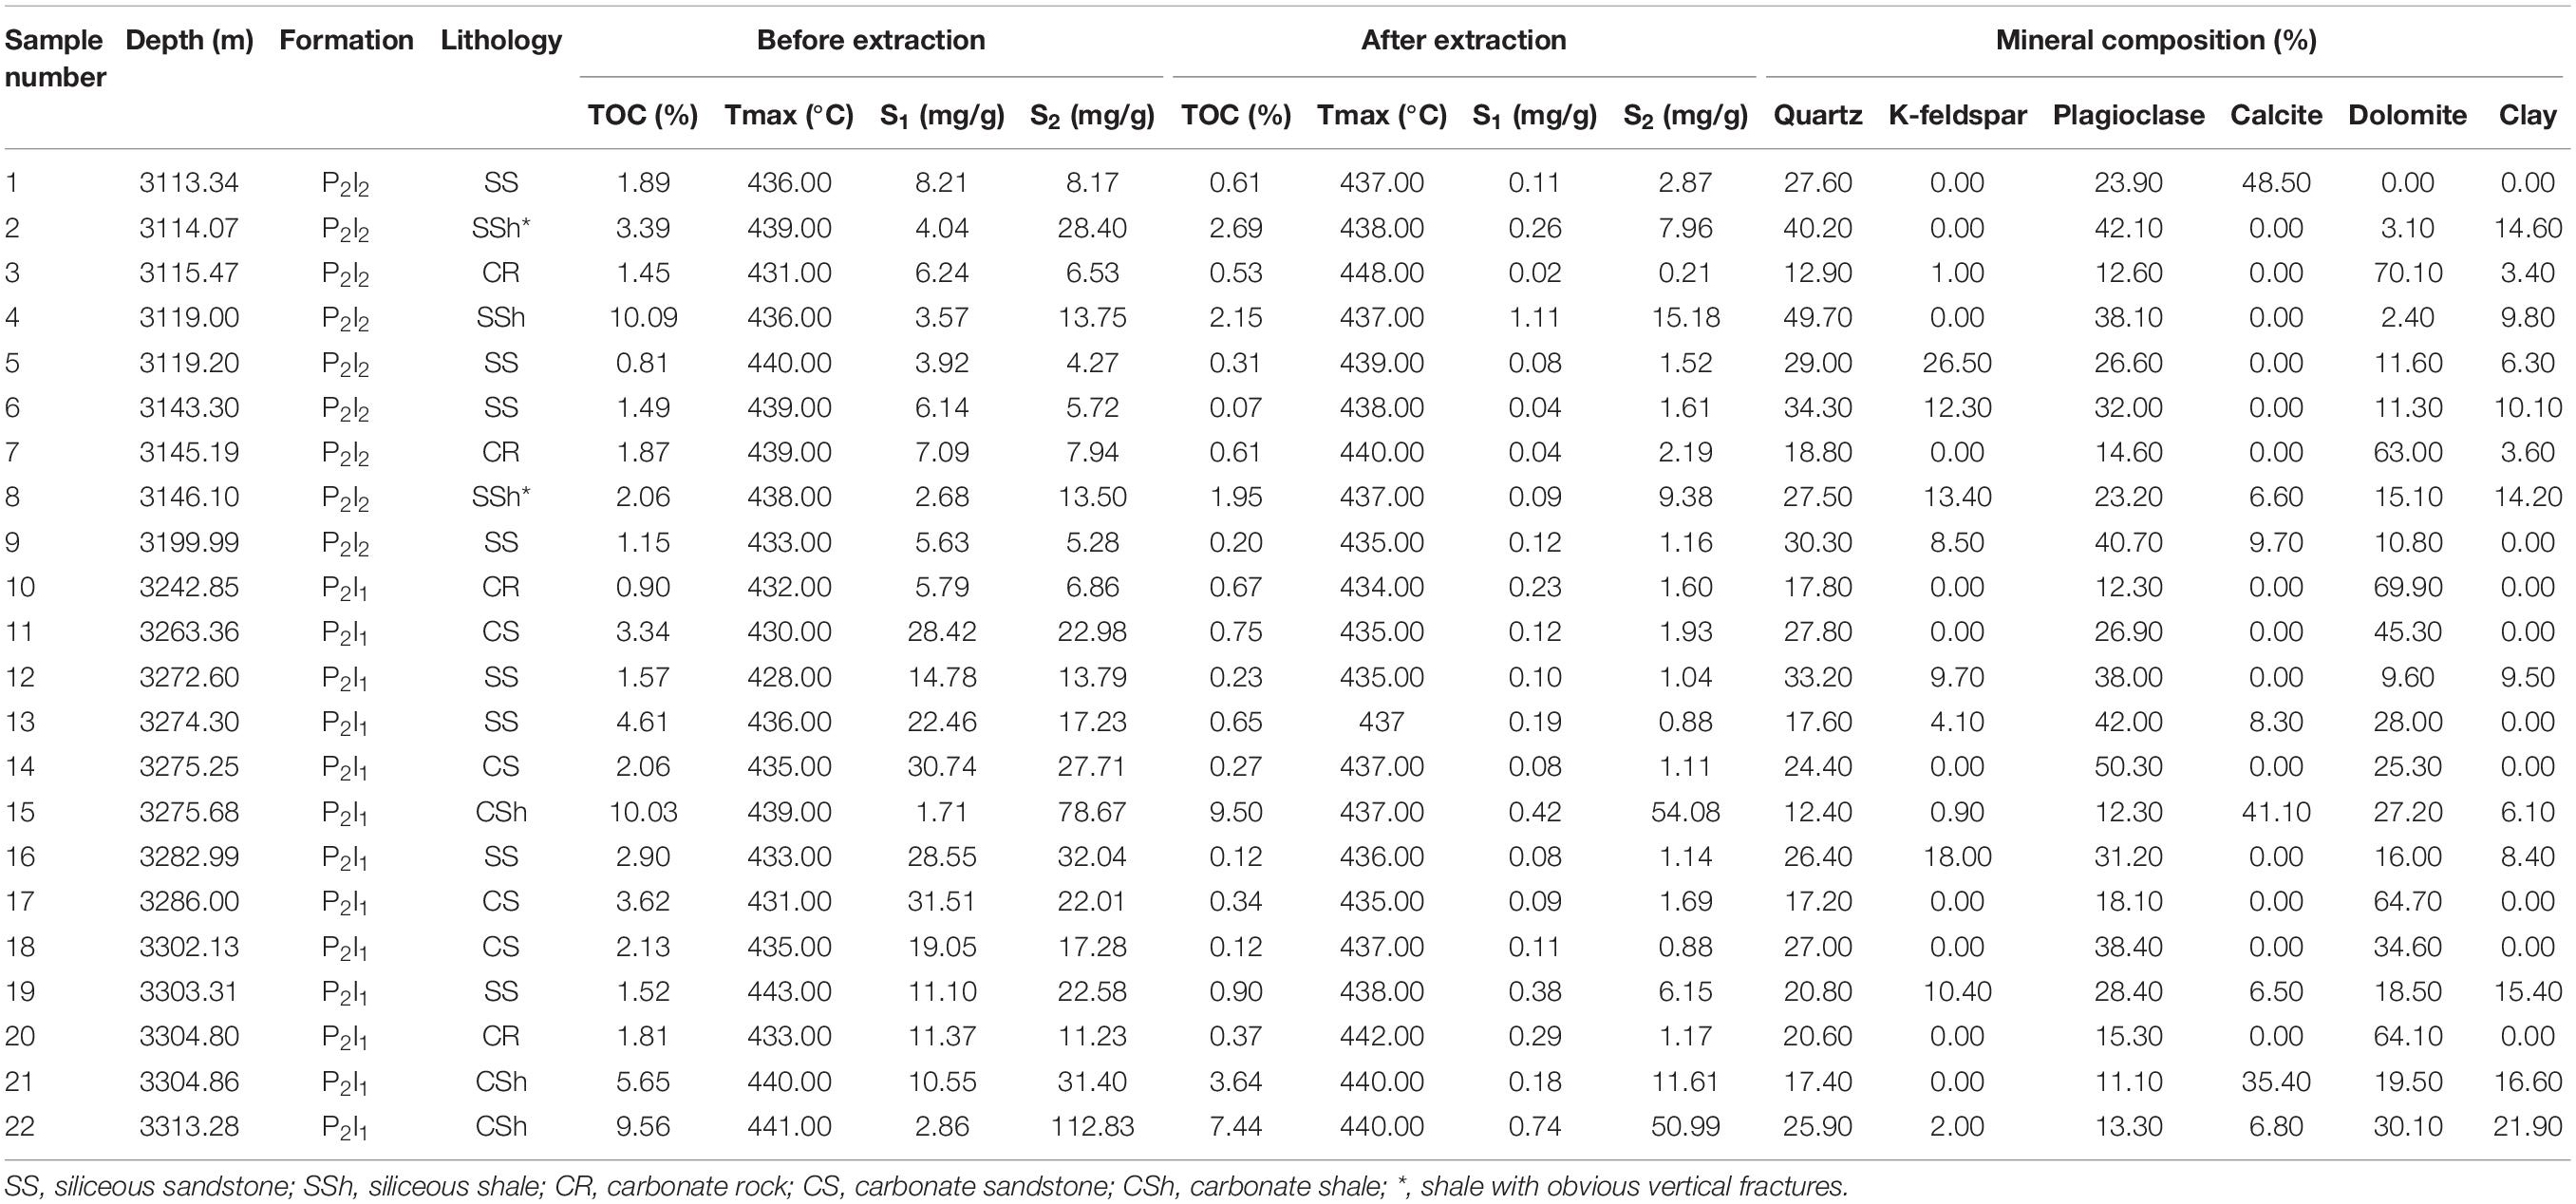
Table 1. Characteristics of core samples from the Lucaogou Formation, Jimsar Sag.
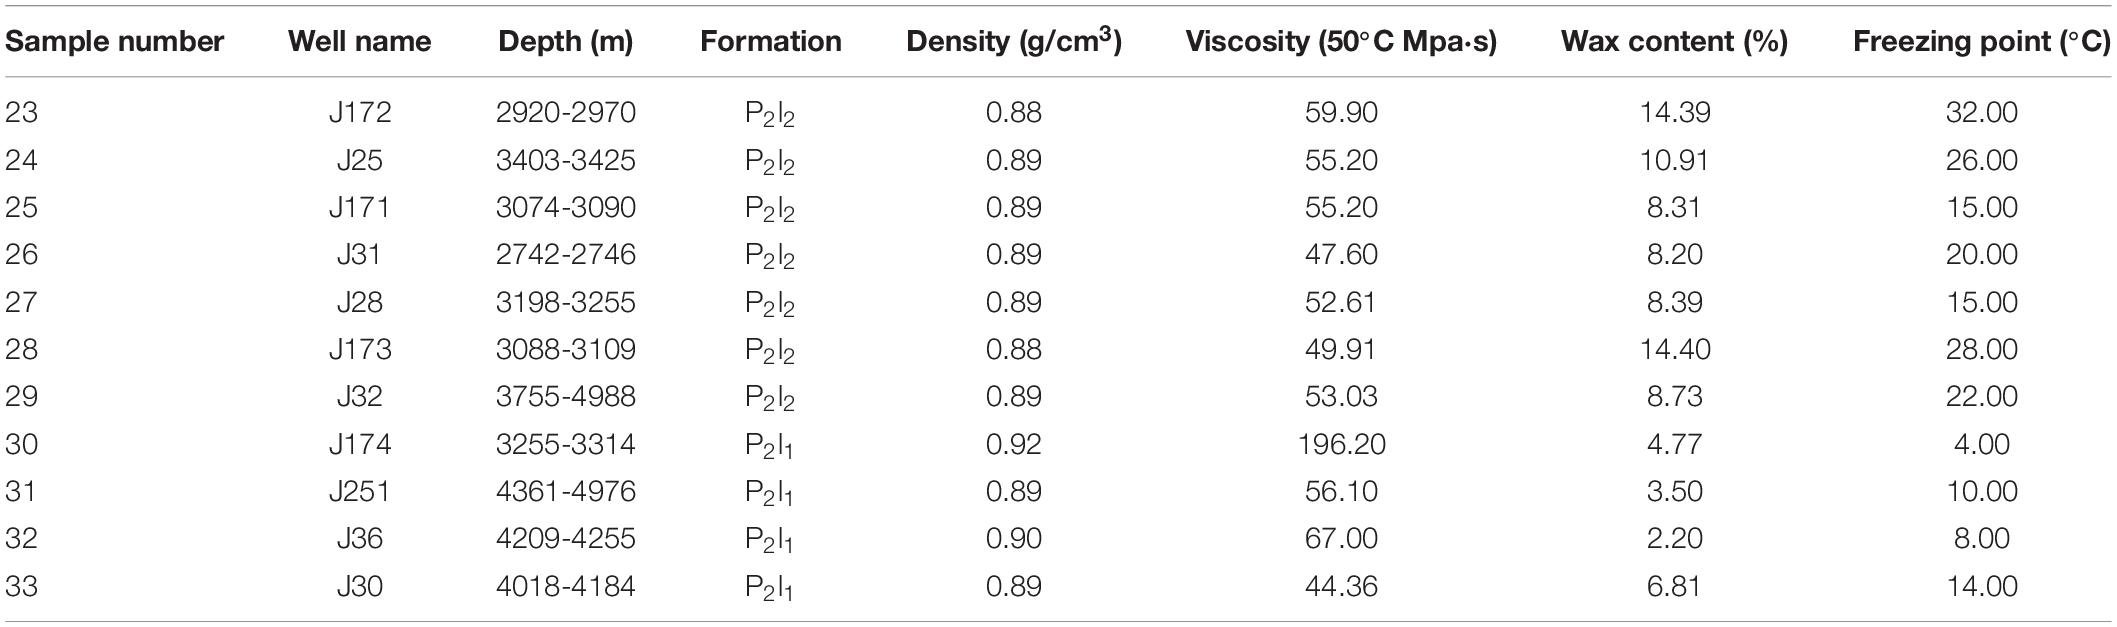
Table 2. Characteristics of crude oil samples from the Lucaogou Formation, Jimsar Sag.
The thin section analyses were performed using a Leica DM4500 microscope equipped with light emitting diode (LED) illumination and a LAS V4.2 digital camera detection system. The XRD analyses were conducted using a Rigaku TTR diffractometer according to Standard No. SY/T 5163-2010 X-ray Diffraction Analysis Method of Clay Minerals and Common Non-clay Minerals in Sedimentary Rocks. The rock pyrolysis analyses and TOC measurements were conducted on original and after-extracted core samples in parallel. The rock pyrolysis analyses were completed using a Rock Eval-6 Standard analyzer, and the amounts of free hydrocarbons (S1) and pyrolysis hydrocarbons (S2), and the temperature of the maximum pyrolysis yield (Tmax) were obtained. The TOC determination was performed using a LECO CS230HC analyzer. The standard procedures of the rock pyrolysis analyses and TOC measurements reported by Espitalié et al. (1984) were used. The density of the oil was measured using a DMA4500M digital densitometer. The viscosity was measured using a MCR101 rheometer. The wax content was determined using a DSC204F1 differential scanning calorimeter. The freezing point was determined using a JRS0919A freezing point instrument. Soxhlet extraction was conducted on the core samples using chloroform for 72 h. The core extracts and oil samples were fractionated via column chromatography into saturated hydrocarbons, aromatic hydrocarbons, non-hydrocarbons, and asphaltenes. The GC analyses were performed using an Agilent 6890N instrument with the flame ionization detector (FID). The GC-MS analyses were performed using an Agilent 6890N gas chromatography interfaced with a 5973C mass spectrometer for biomarker analysis.
The TSF analysis was performed using a Varian Cary-Eclipse fluorescence analyzer. The fluorescence analyzer was mainly composed of a spectrophotometer, a specially designed sample stage, optical filters, and special data analysis software. The analyzed samples were the hydrocarbons extracted from the core samples, and the details of the experimental procedure have been described by Fan et al. (2015) and Liu et al. (2016). The experimental parameters were as follows: the excitation wavelength range was 220:2:340 nm and the emission wavelength range was 250:5:540 nm. To avoid Rayleigh scattering interference, the starting emission wavelength was set to lag behind the starting excitation wavelength by 30 nm, and the experiments were performed at room temperature. The TSF parameters TSF Max, Ex, Em, R1, and R2 were obtained via the TSF analysis. TSF Max is the maximum fluorescence intensity; Ex is the maximum excitation wavelength; Em is the maximum emission wavelength; R1 is the ratio of the emission intensities at 360 nm over 320 nm, corresponding to an excitation wavelength of 270 nm; and R2 is the ratio of the emission intensities at 360 nm over 320 nm, corresponding to an excitation wavelength of 260 nm (Brooks et al., 1983; Liu et al., 2016). In order to eliminate the influence of the uneven oil contents of core samples, multiple TSF experiments were carried out at different oil-content locations on the same core sample. The average values of the multiple experimental results were used as the TSF parameters values of the sample in order to compare with geochemical parameters.
Results
Lithology and Hydrocarbon Generation Potential Characteristics
The core observations, thin section analysis, and XRD analysis reveal that the lithology of the collected core samples can mainly be classified into two categories and five subcategories. The shale includes carbonate shale (CSh) and siliceous shale (SSh). The tight reservoirs include carbonate rock (CR), carbonate sandstone (CS), and siliceous sandstone (SS). Apparent vertical fractures are developed in samples No. 2 and No. 8. In this study, the shale with obvious vertical fractrures is named fractured shale, on the contrary, the shale without obvious vertical fractures is named blocky shale. Table 1 shows the XRD, rock pyrolysis, and TOC analysis results of the core samples. The XRD results reveal that the shale and tight reservoirs contain similar minerals (Figure 2). In comparison, the shale has a relatively high clay content, and the tight reservoirs have a relatively high dolomite content. The clay contents of the shale range from 6.10% to 21.90% (average 13.87%), and the dolomite contents of the tight reservoirs range from 0% to 70.10% (average 33.93%).
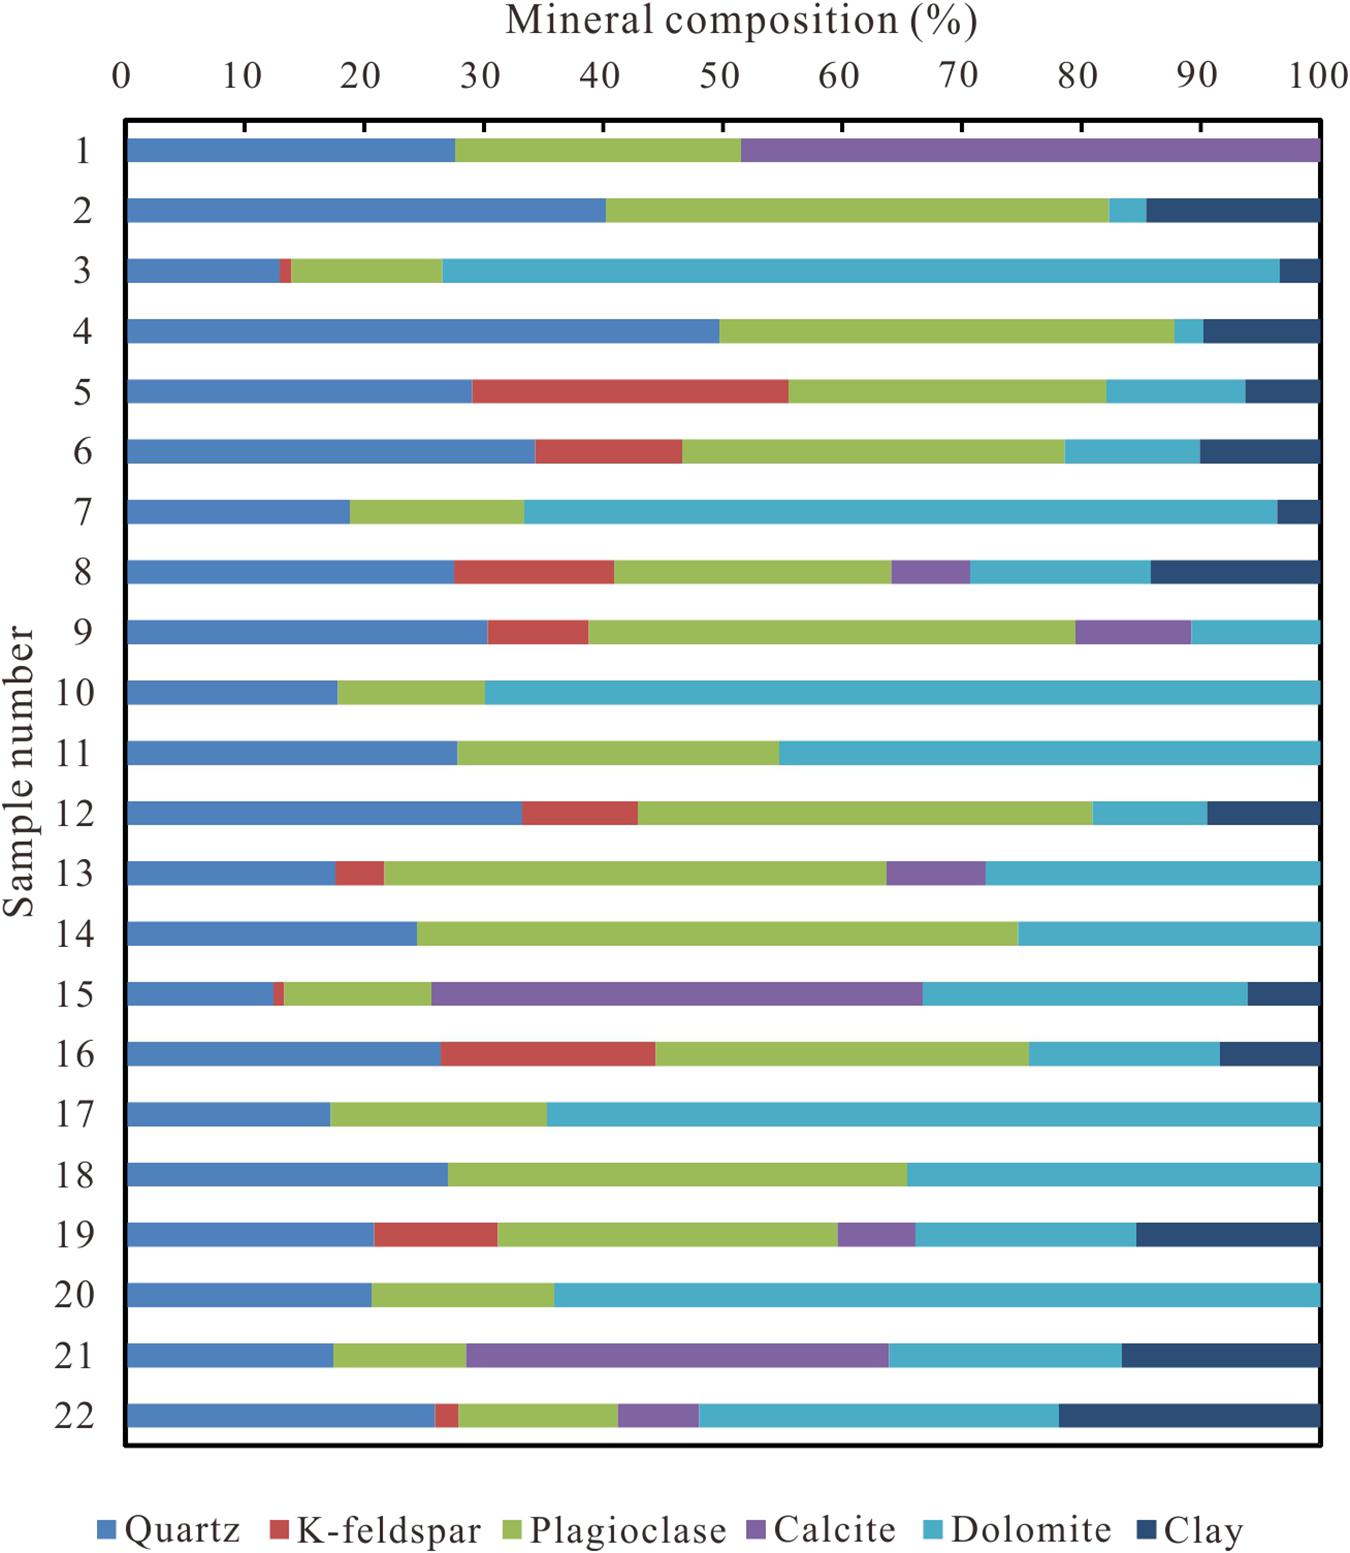
Figure 2. Mineral composition of core samples in the Lucaogou Formation, Jimsar Sag.
Table 1 shows the TOC and pyrolysis data for the core samples before and after extraction. The experimental results indicate that the shale samples are superior to tight-reservoir samples in terms of organic-matter content and potential for hydrocarbon generation. For shale samples, TOC is in the range of 2.06%–10.09% (average 6.80%) for original samples and 1.95%–9.50% (average 4.56%) for after-extracted samples. S1 is in the range of 1.71–10.55 mg/g (average 4.24), and S2 13.50–112.83 mg/g (average 46.43) for original shale samples. S1 is in the range of 0.09–1.11 mg/g (average 0.47), and S2 7.96–54.08 mg/g (average 24.87) for after-extracted shale samples. For tight reservoir samples, TOC is in the range of 0.81%–4.61% (average 2.10%) for original samples and 0.07%–1.22% (average 0.44%) for after-extracted samples. S1 is in the range of 3.92–31.51 mg/g (average 14.74), and S2 4.27–32.04 mg/g (average 14.08) for original tight reservoir samples. S1 is in the range of 0.02–0.41 mg/g (average 0.13), and S2 0.21–6.53 mg/g (average 1.72) for after-extracted tight reservoir samples.
Bulk Properties of the Hydrocarbons
The group components of the core extracts and crude oil samples are presented in Table 3. The group components of the upper and lower sections of the Lucaogou Formation are vastly different (Figure 3). The upper section of the Lucaogou Formation has relatively high saturated hydrocarbon contents of 51.32% to 69% (average 58.92%); relatively low aromatic hydrocarbon contents of 12.30% to 18.61% (average 15.36%); and relatively low non-hydrocarbon contents of 14.62% to 30.22% (average 23.39%). The lower section of the Lucaogou Formation has relatively low saturated hydrocarbon contents of 38.42% to 59.80% (average 48.31%); relatively high aromatic hydrocarbon contents of 13.99% to 20.26% (average 16.17%); and relatively high non-hydrocarbon contents of 15.81% to 43.78% (average 31.39%).
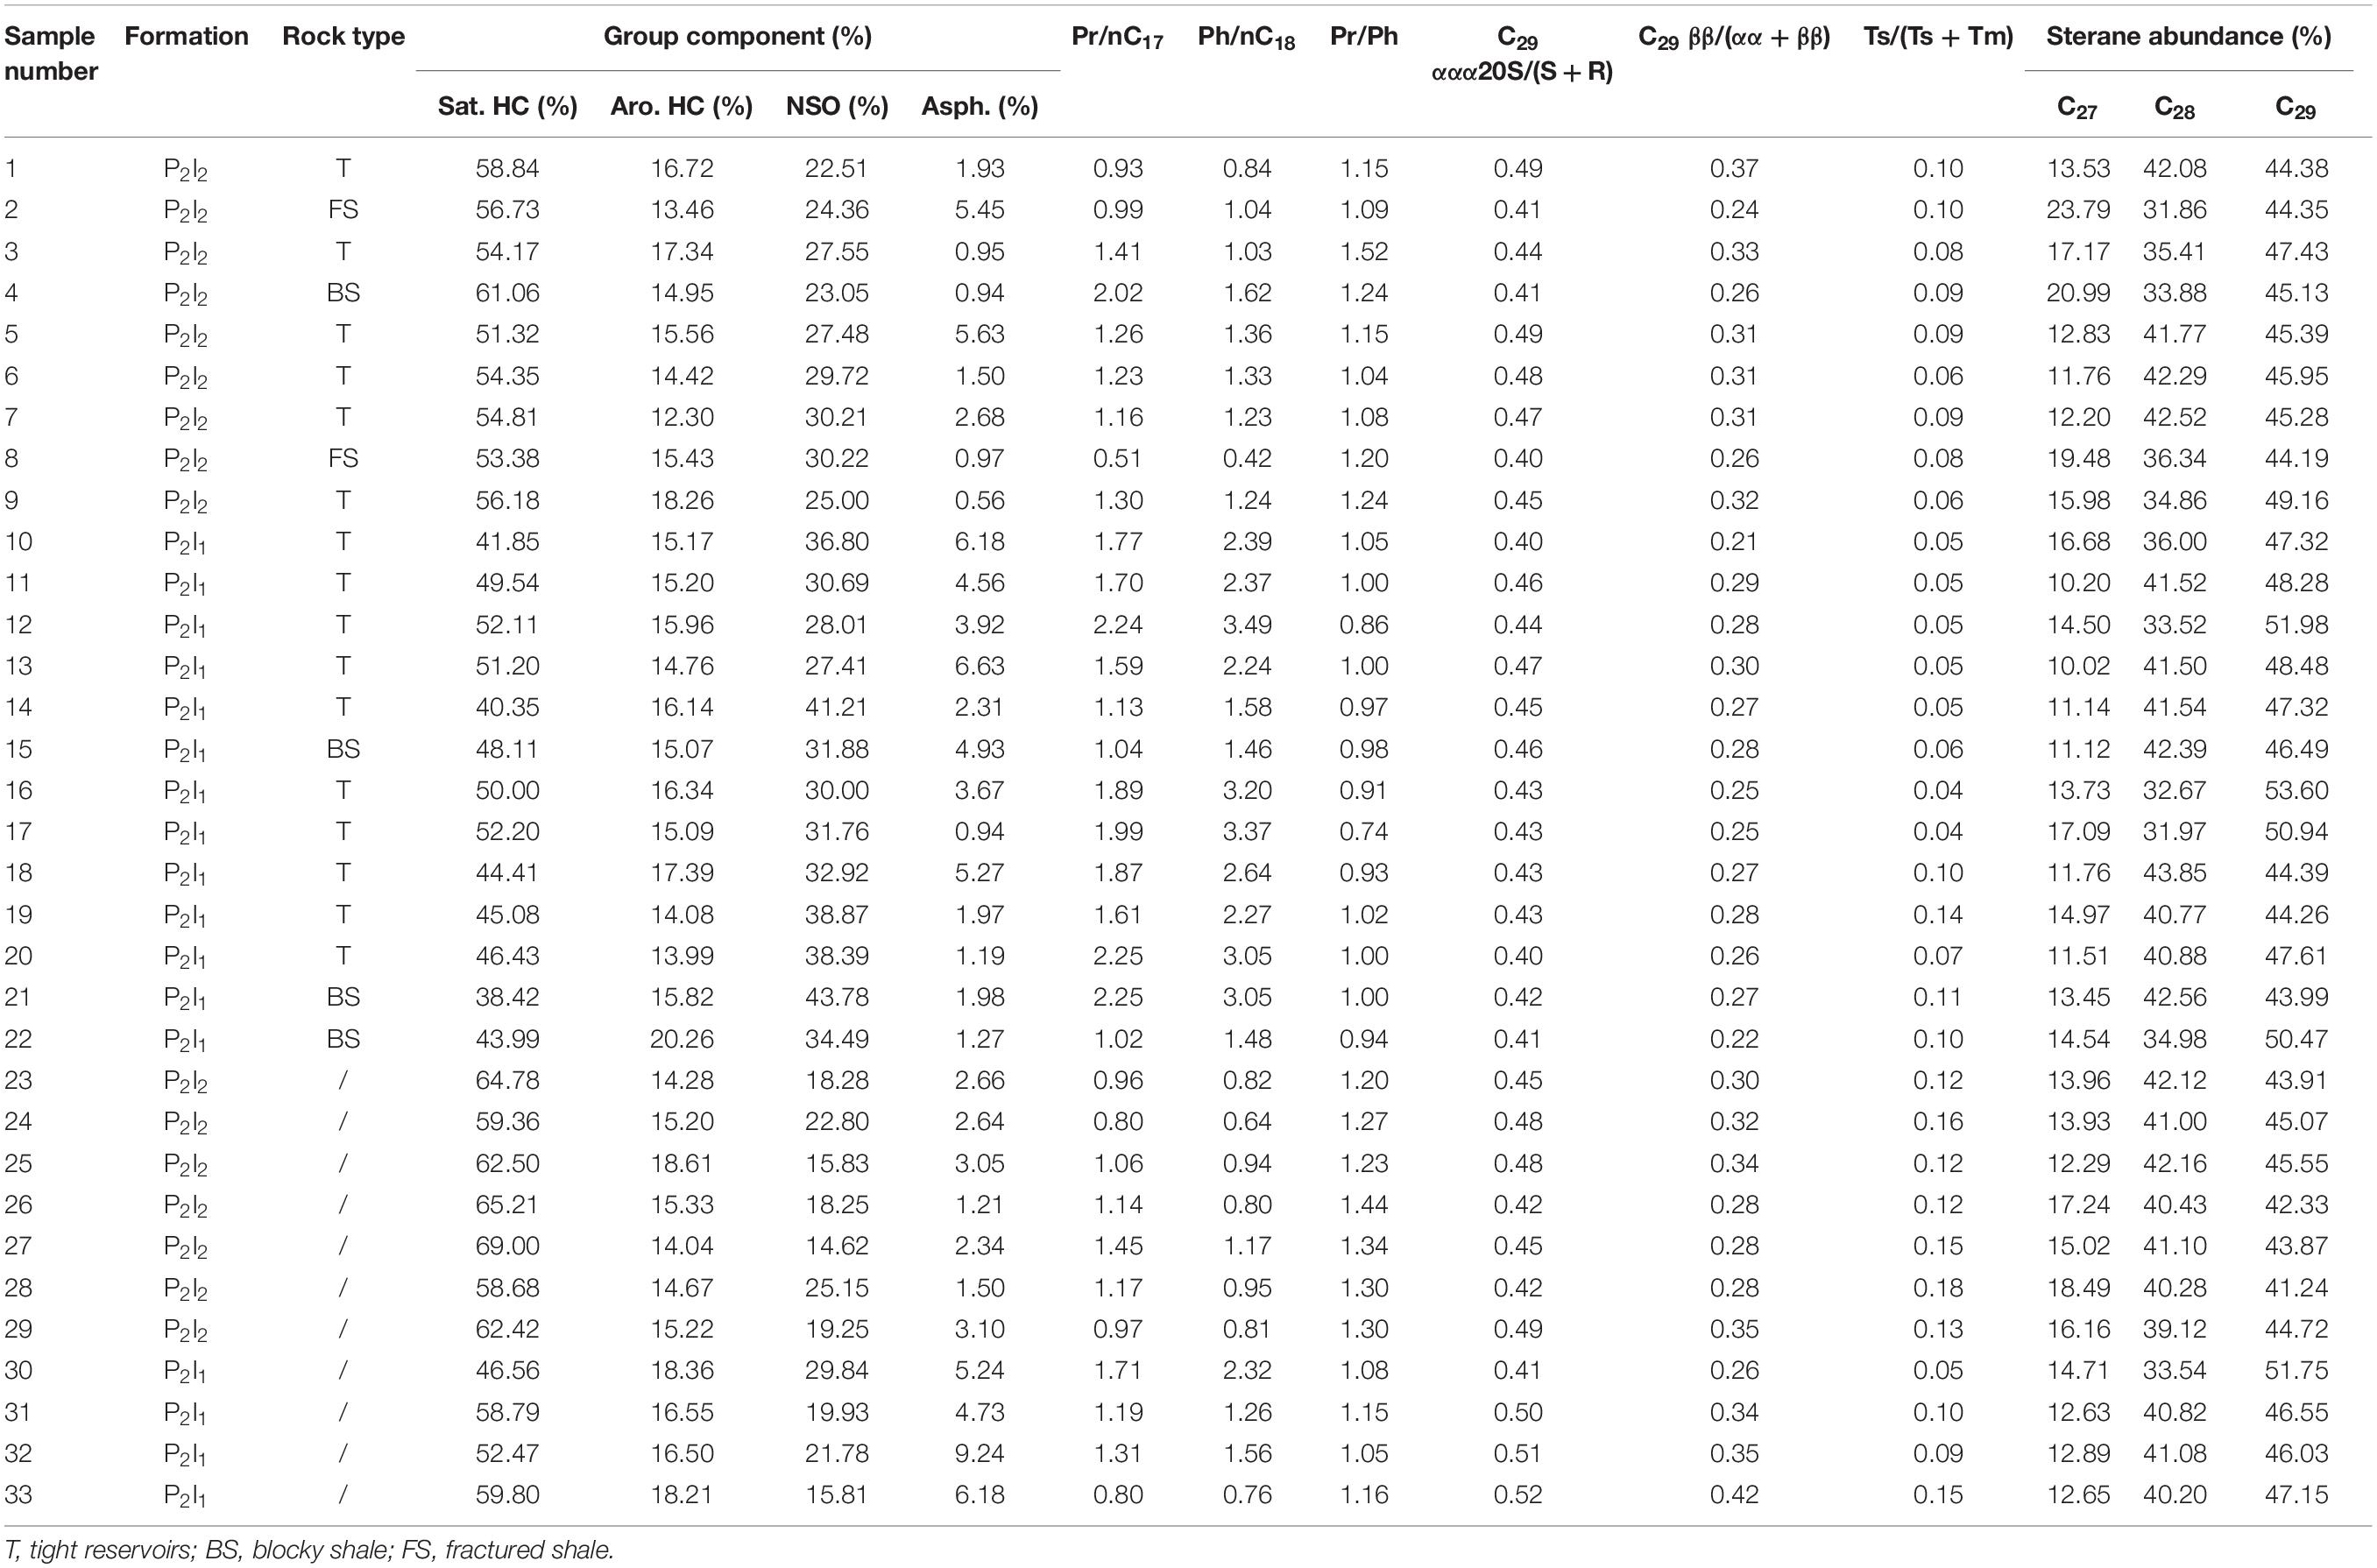
Table 3. Group component and biomaker parameters in the Lucaogou Formation core extracts and oils, Jimsar Sag.
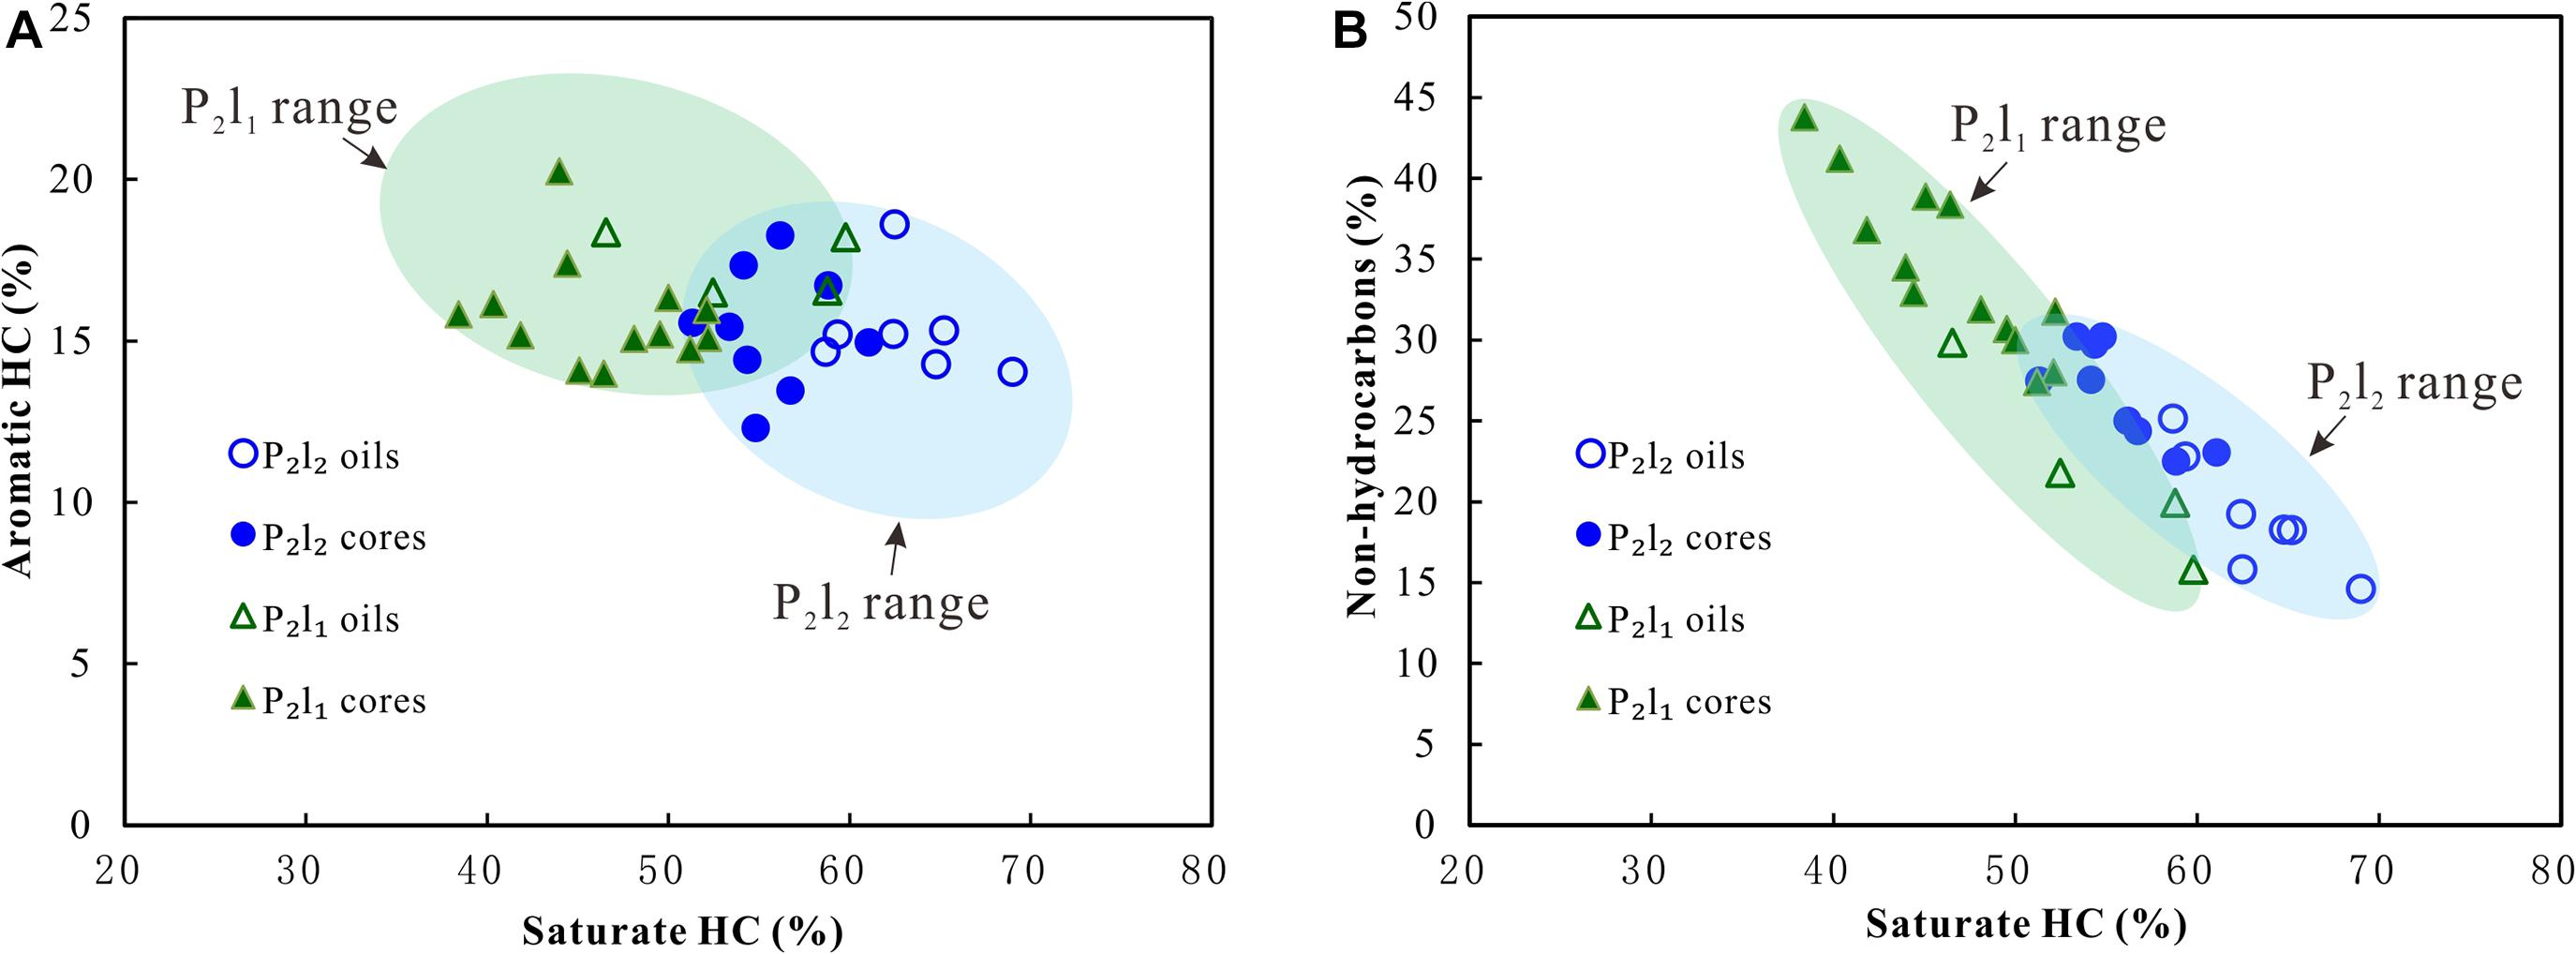
Figure 3. Group component plots for the Lucaogou Formation core extracts and oils, Jimsar Sag. (A) Aromatic HC vs. Saturate HC; (B) Non-hydrocarbons vs. Saturate HC.
The experimental results of the physical property parameters of the crude oil are presented in Table 2. The physical quality of the crude oil in the upper section of the Lucaogou Formation is considerably better than that in the lower section. The density of the crude oil in the lower section of the Lucaogou Formation is relatively low, with an average value of 0.89 g/cm3; the viscosity is relatively low, with an average value of 53.35 Mpa⋅s (50°C); the wax content is relatively high, with an average value of 10.48%; and the freezing point is relatively high, with an average of 22.57°C. The crude oil in the lower section of the Lucaogou Formation has a relatively high density, with an average value of 0.90 g/cm3; a relatively high viscosity, with an average value of 90.92 Mpa⋅s (50°C); a relatively low wax content, with an average value of 4.32%; and a relatively low freezing point, with an average value of 9.00°C.
Biomarker Characteristics
Biomarkers can be used to study the depositional environment, source, and thermal maturity of organic matter. The key biomarker parameters of the core and crude oil samples obtained from the GC and GC-MS analysis are presented in Table 3.
The Pr/Ph, Pr/nC17, and Pr/nC18 ratios are excellent indicators of depositional environment. The Pr/Ph ratio of less than 1 indicates a suboxic or anoxic depositional environment, and a ratio of greater than 1 indicates an oxidizing depositional environment (Didyk et al., 1978). The Pr/Ph ratios of the upper section of the Lucaogou Formation range from 1.04% to 1.52% (average 1.24%), indicating a suboxic or anoxic depositional environment. The Pr/Ph ratios of the lower section of the Lucaogou Formation range from 0.74% to 1.24% (average 1.00%), indicating a mildly oxic or suboxic depositional environment. Figure 4 presents a plot of Pr/nC17 versus Pr/nC18, which also indicates that the upper section of the Lucaogou Formation was deposited in a more oxidative environment than the lower section. This finding is consistent with the results of previous studies (Ding et al., 2019; Su et al., 2019).
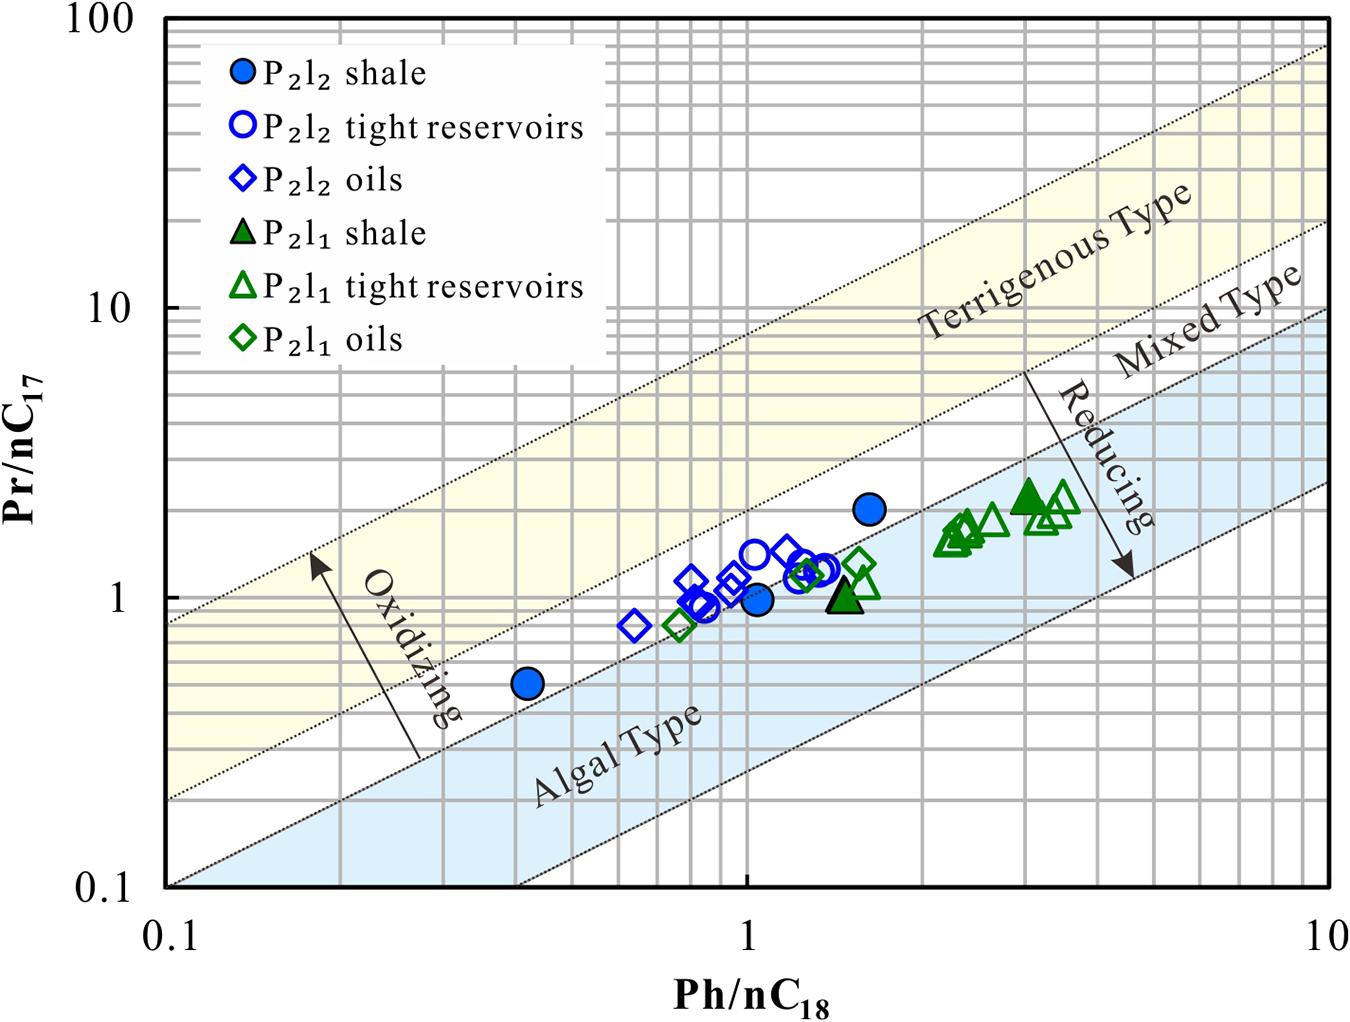
Figure 4. Pr/nC17 vs. Ph/nC18 plot for the core extracts and oils in the Lucaogou Formation, Jimsar Sag (Modified after Peters et al., 1999).
The compositions of regular steranes are usually used as indicators of organic matter origin (Seifert and Moldowan, 1978; Huang and Meinschein, 1979). Figure 5 presents a ternary plot of the regular steranes compositions of the core and oil samples from the Lucaogou Formation. The relative abundances of the C27, C28, and C29 steranes are 10.02-23.79%, 31.86-43.85%, and 41.24-53.60%, respectively (Table 3), indicating that the organic matter was mainly derived from bacteria and advanced plants (Figure 5). There is a slight difference in the sources of the organic matter in the samples from the upper and lower sections of the Lucaogou Formation. In comparison, more organic matter from advanced plants was input in the lower section of the Lucaogou Formation. This finding is consistent with the results of previous studies reported by Ding et al. (2019) and Su et al. (2019).
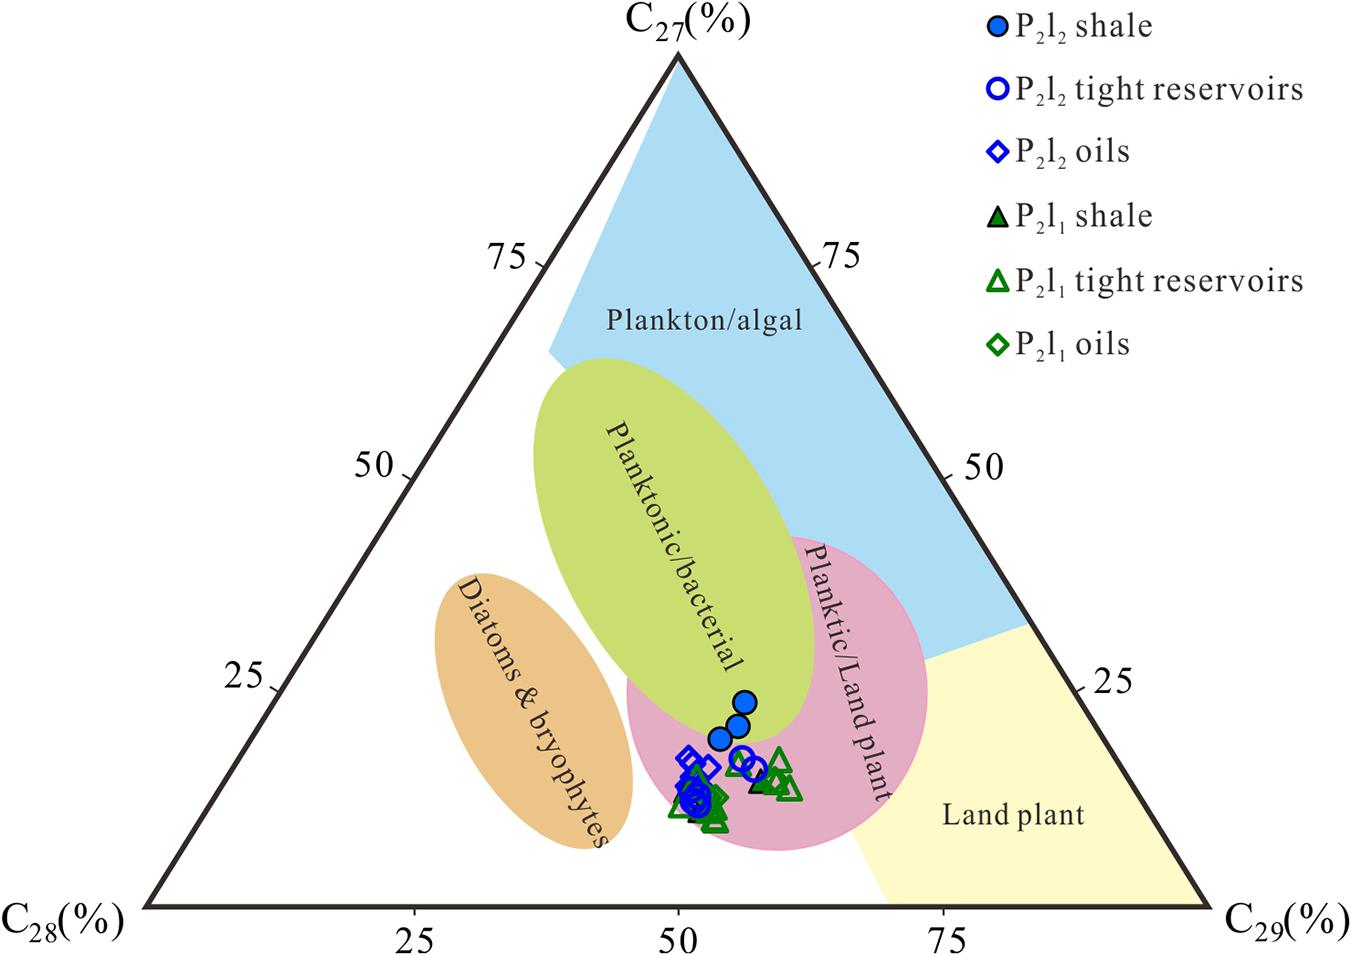
Figure 5. Ternary plot of C27-C28-C29 steranes for the core extracts and oils in the Lucaogou Formation, Jimsar Sag (Modified after Huang and Meinschein, 1979).
The C29ααα20S/(20S + 20R) and C29ββ/(αα + ββ) ratios have always been considered to be effective indicators of thermal maturity (Mackenzie et al., 1980; Seifert and Moldowan, 1980, 1986; Peters and Moldowan, 1993). Larger C29ααα20S/(20S + 20R) and C29ββ/(αα + ββ) ratios indicate a higher thermal maturity. Figure 6 shows the Lucaogou Formation hydrocarbons are in the mature stage. The thermal maturity of the shale hydrocarbons in the upper section of the Lucaogou Formation is slightly lower than that the shale hydrocarbons in the lower section. The average values of the C29ααα20S/(20S + 20R) and C29ββ/(αα + ββ) ratios of the shale in the upper section of the Lucaogou Formation are 0.41 and 0.25, respectively. The average values of the C29ααα20S/(20S + 20R) and C29ββ/(αα + ββ) ratios of the shale in the lower section of the Lucaogou Formation are 0.43 and 0.26, respectively. The thermal maturity of the hydrocarbons in the tight reservoirs in the lower section of the Lucaogou Formation is similar to that of the adjacent shale hydrocarbons. The average values of the C29ααα20S/(20S + 20R) and C29ββ/(αα + ββ) ratios of the tight reservoirs in the lower section of the Lucaogou Formation are the same as those of the shale, i.e., 0.43 and 0.26, respectively. The above results show that the oil in the tight reservoirs in the lower section of the Lucaogou Formation mainly came from the adjacent shale, and the oil did not migrate over a long distance. In comparison, the thermal maturity of the hydrocarbons in the tight reservoirs in the upper section of the Lucaogou Formation is significantly higher than that of the nearby shale hydrocarbons. The average values of the C29ααα20S/(20S + 20R) and C29ββ/(αα + ββ) ratios of the upper-section shale in the Lucaogou Formation are 0.47 and 0.32, respectively. It is inferred that the oil in the tight reservoirs in the upper section of the Lucaogou Formation may be partially derived from the relatively high maturity shale in the deep part of the sag. Compared with that of the lower section of the Lucaogou Formation, the oil in the tight reservoirs in the upper section underwent a longer distance migration.
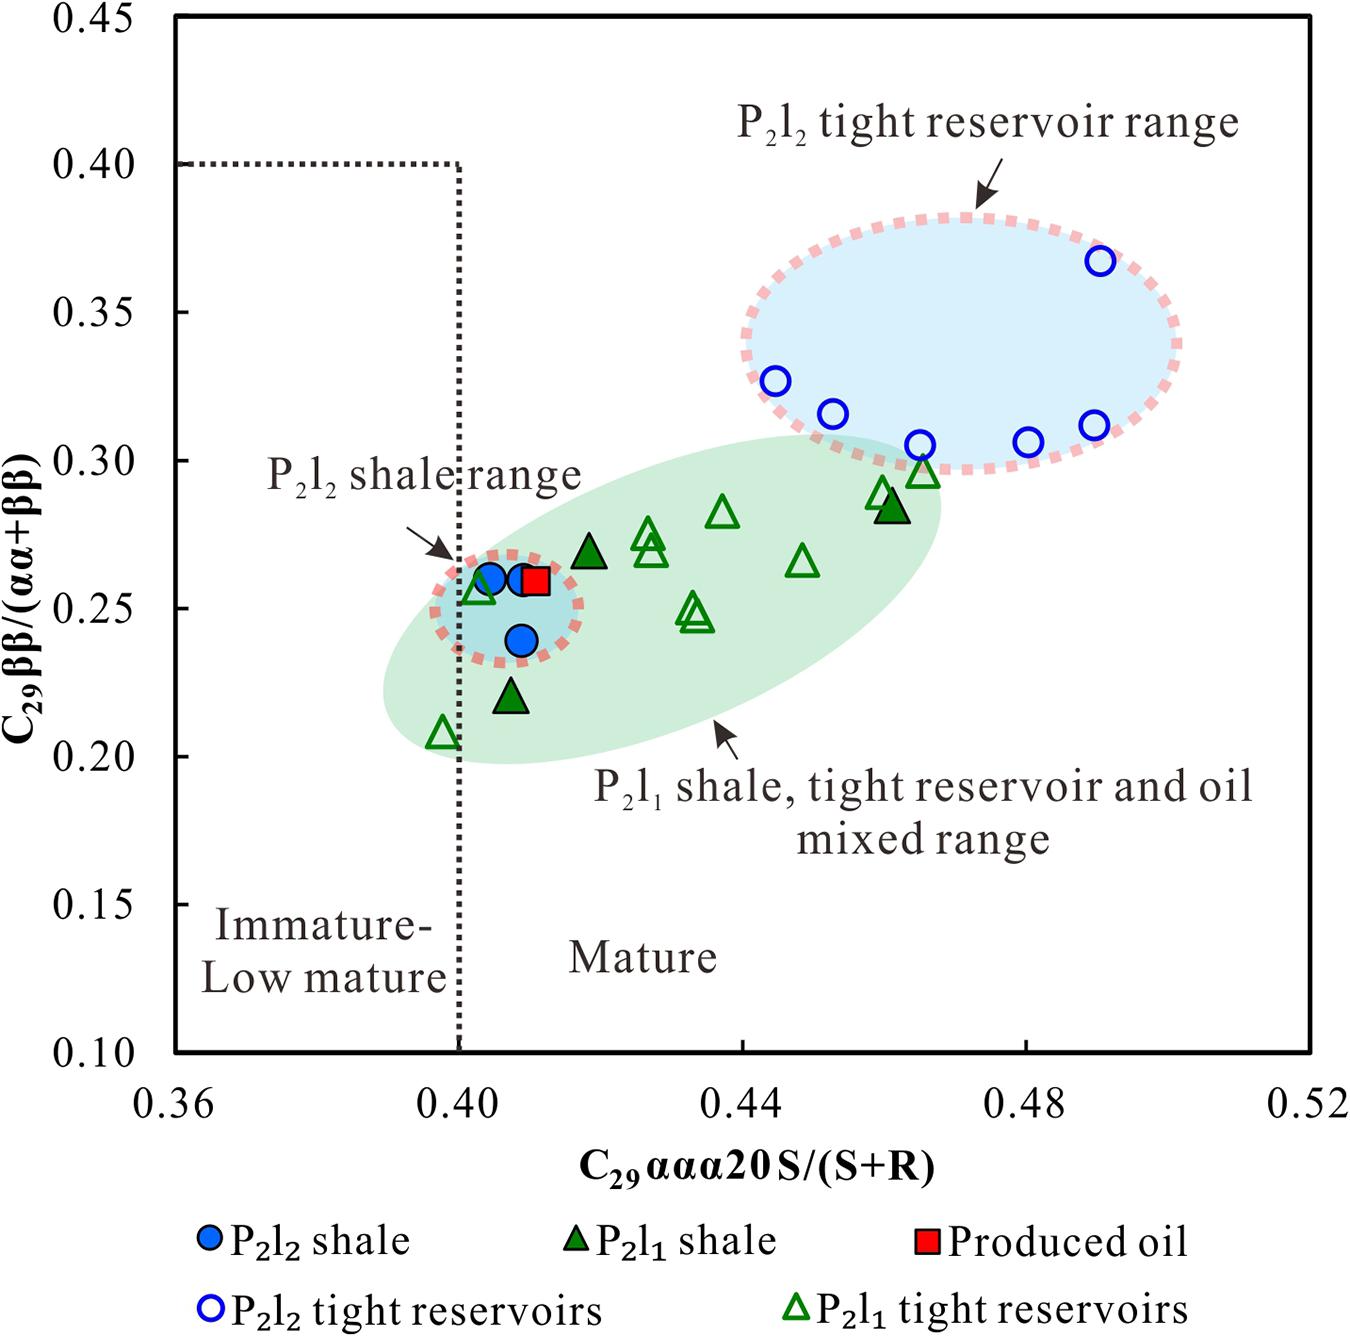
Figure 6. C29ααα20S/(20S + 20R) vs. C29ββ/(αα + ββ) plot for the Lucaogou Formation core extracts and oils in Well J174, Jimsar Sag.
TSF Characteristics
The key fluorescence parameters obtained from the TSF analysis of the core and oil samples are presented in Table 4. Figure 7 depicts the TSF parameters and spectrograms of the shale, tight reservoir, and oil samples from the upper and lower sections of the Lucaogou Formation. The shale, tight reservoir, and oil samples from the Lucaogou Formation have very similar TSF spectrogram characteristics. The TSF spectrograms of the shale, tight reservoir, and oil samples from the Lucaogou Formation all exhibit a single peak, which is very similar to the TSF spectrograms of the shale and oil samples from the Qingshankou Fromation in Songliao Basin (Liu B. et al., 2019).
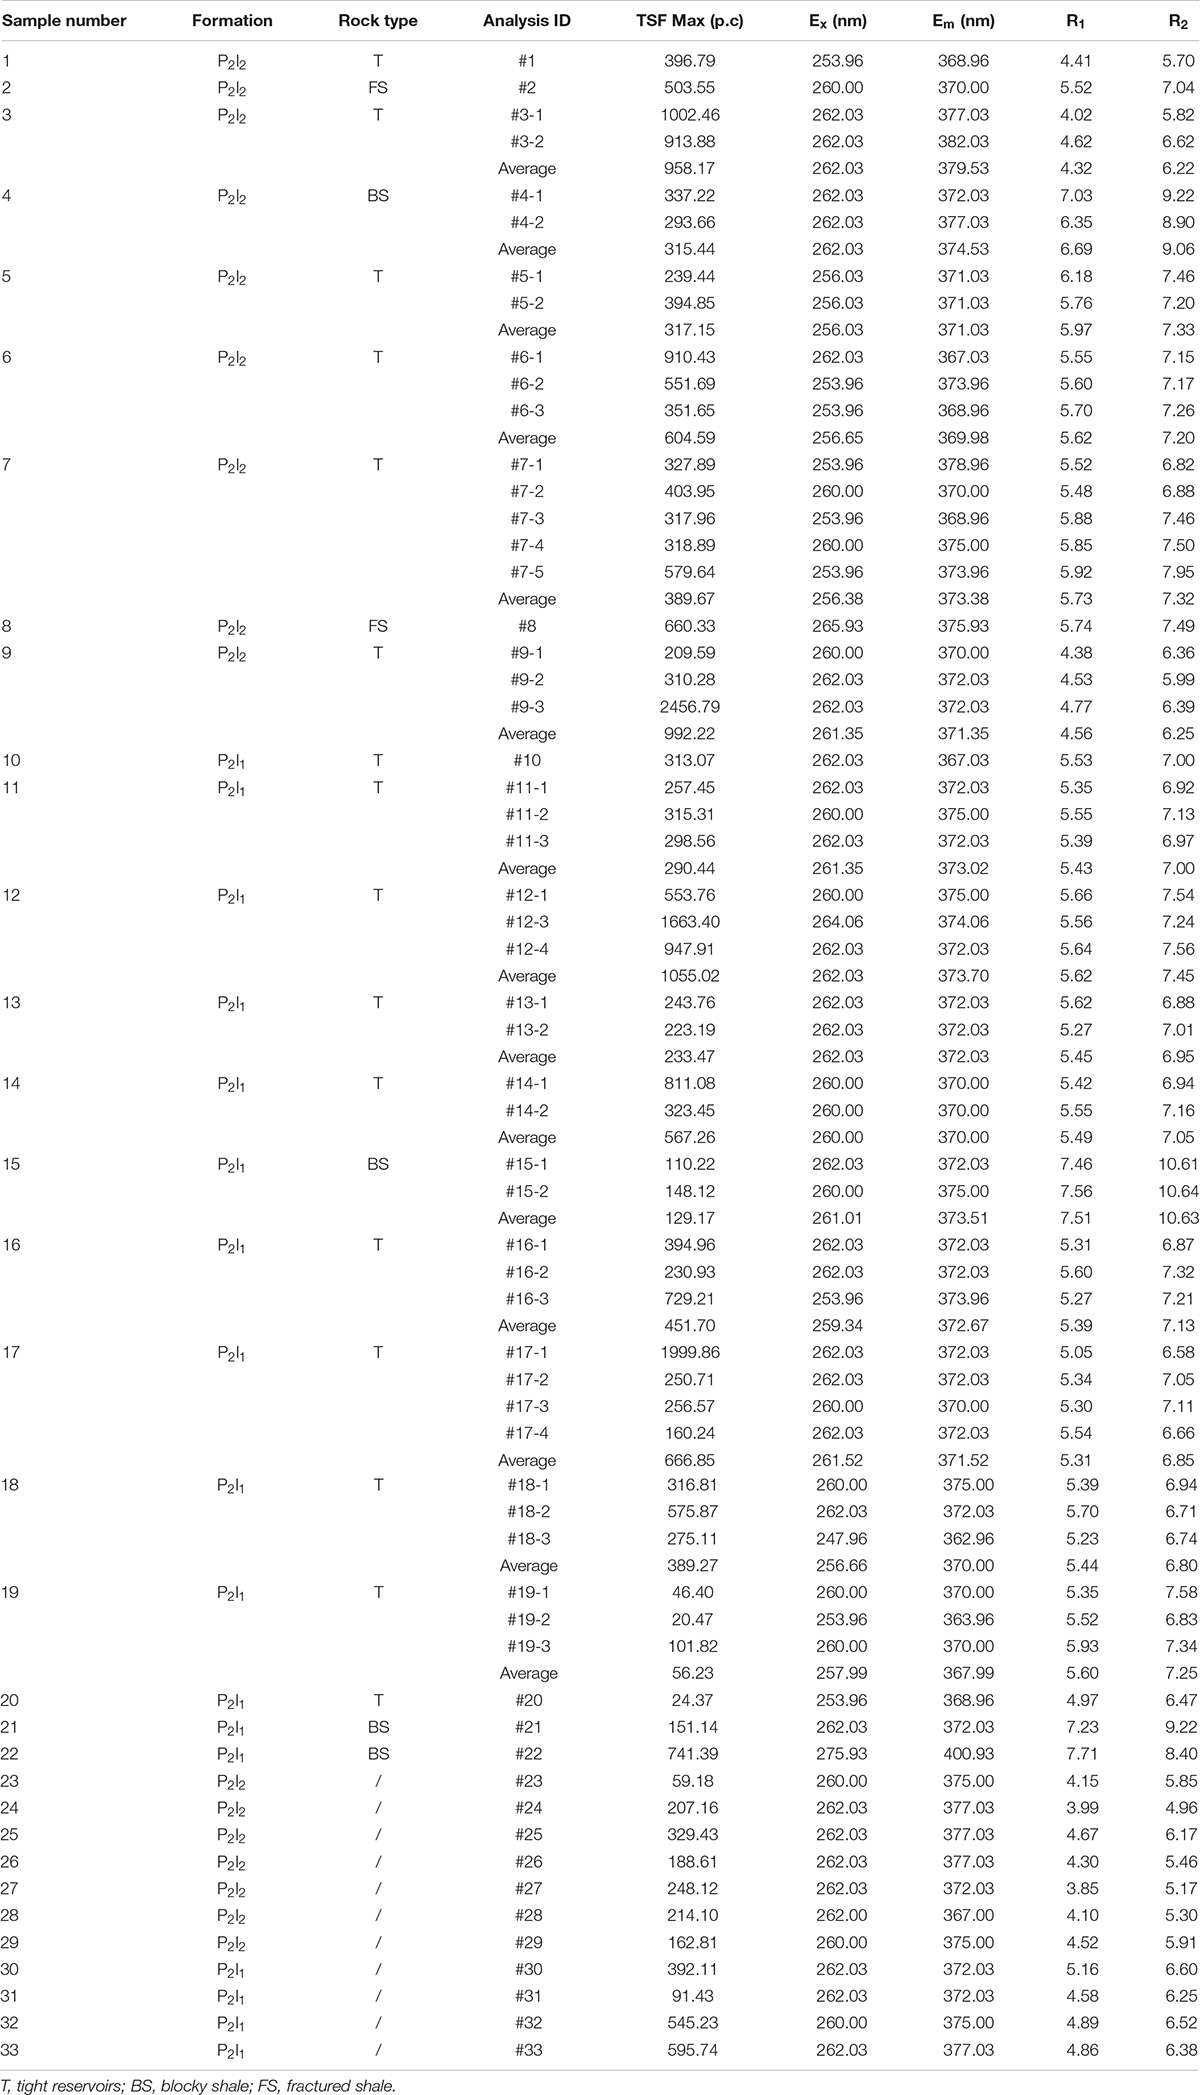
Table 4. TSF parameters of cores and oils in the Lucaogou Formation, Jimsar Sag.
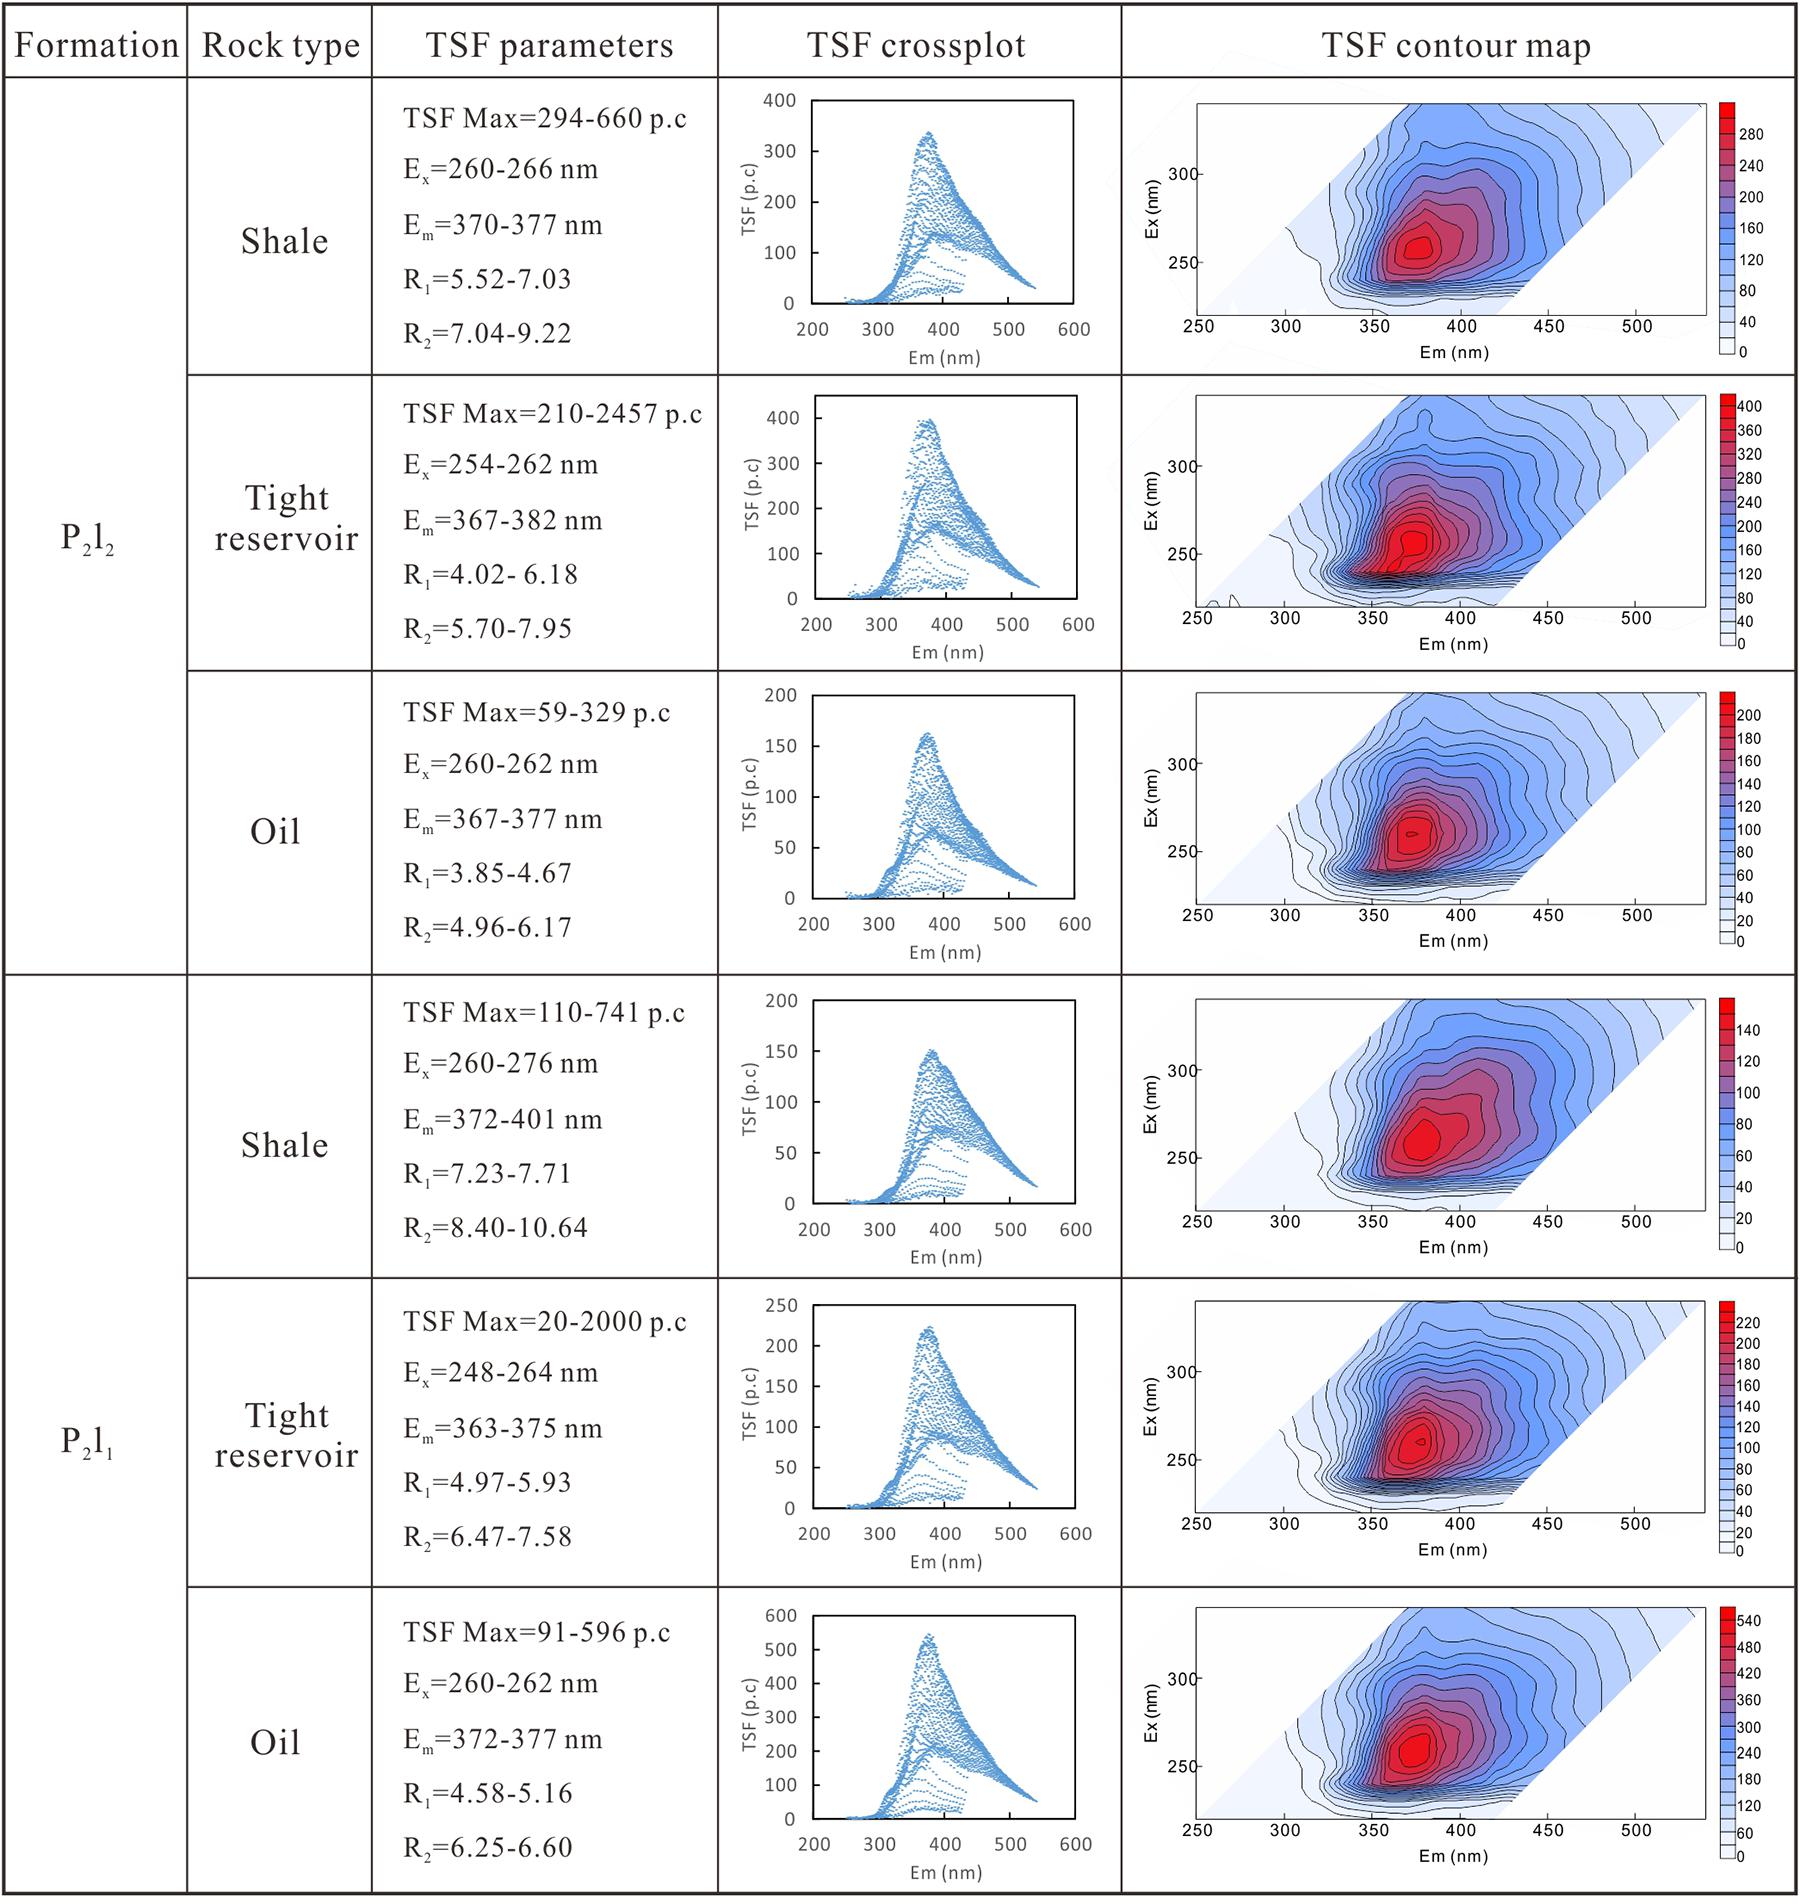
Figure 7. TSF characteristics of shale, tight reservoirs, oils in the Lucaogou Formation, Jimsar Sag.
The shale, tight reservoir, and oil samples have different value ranges of TSF parameters (Figure 7 and Table 4). For the shale in the upper section of the Lucaogou Formation, the TSF Max values range from 293.66 to 660.33 p.c (average 448.69 p.c), the Ex values range from 260.00 to 265.93 nm (average 262.50 nm), the Em values range from 370.00 to 377.03 nm (average 373.75 nm), the R1 values range from 5.52 to 7.03 (average 6.16), and the R2 values range from 7.04 to 9.22 (average 8.16). For the shale in the lower section, the TSF Max values range from 110.22 to 741.39 p.c (average 287.72 p.c), the Ex values range from 260.00 to 275.93 nm (average 265.00 nm), the Em values range from 372.03 to 400.93 nm (average 380.00 nm), the R1 values range from 7.23 to 7.71 (average 7.49), and the R2 values range from 8.40 to 10.64 (average 9.72).
For the tight reservoirs in the upper section of the Lucaogou Formation, the TSF Max values range from 209.59 to 2456.79 p.c (average 605.39 p.c), the Ex values range from 253.96 to 262.03 nm (average 257.87 nm), the Em values range from 367.03 to 382.03 nm (average 372.56 nm), the R1 values range from 4.02 to 6.18 (average 5.26), and the R2 values range from 5.70 to 7.95 (average 6.86). For the tight reservoirs in the lower section, the TSF Max values range from 20.47 to 1999.86 pc (average 453.37 pc), the Ex values range from 247.96 to 264.06 nm (average 259.93 nm), the Em values range from 362.96 to 375.00 nm (average 371.13 nm), the R1 values range from 4.97 to 5.93 (average 5.44), and the R2 values range from 6.47 to 7.58 (average 7.03).
For the crude oils in the upper section of the Lucaogou Formation, the TSF Max values range from 59.18 to 329.43 p.c (average 201.35 p.c), the Ex values range from 260.00 to 262.03 nm (average 261.45 nm), the Em values range from 367.00 to 377.03 nm (average 374.30 nm), the R1 values range from 3.85 to 4.67 (average 4.23), and the R2 values range from 4.96 to 6.17 (average 5.55). For the crude oil in the lower section, the TSF Max values range from 91.43 to 595.74 p.c (average 406.13 pc), the Ex values range from 260.00 to 262.03 nm (average 261.52 nm), the Em values range from 372.03 to 377.03 nm (average 374.02 nm), the R1 values range from 4.58 to 5.16 (average 4.87), and the R2 values range from 6.25 to 6.60 (average 6.44).
Discussion
TSF Parameters vs. Bulk Properties of the Hydrocarbons
The TSF Max of the core and oil samples are positively correlated with the aromatic hydrocarbon content (Figure 8A) but are not significantly correlated with the saturated hydrocarbon, non-hydrocarbon, and asphaltene contents. The above results demonstrate that the fluorescent substances of the shale oil in the Lucaogou Formation are mainly aromatic compounds. There is also a positive correlation between the TSF Max and the aromatic hydrocarbon content of the conventional oil from the North Sea and the Bohai Bay Basin in China (Barwise and Hay, 1996; Li et al., 2007). Therefore, in a sense, all of the factors related to the aromatic hydrocarbon content will have a certain impact on the TSF parameters.
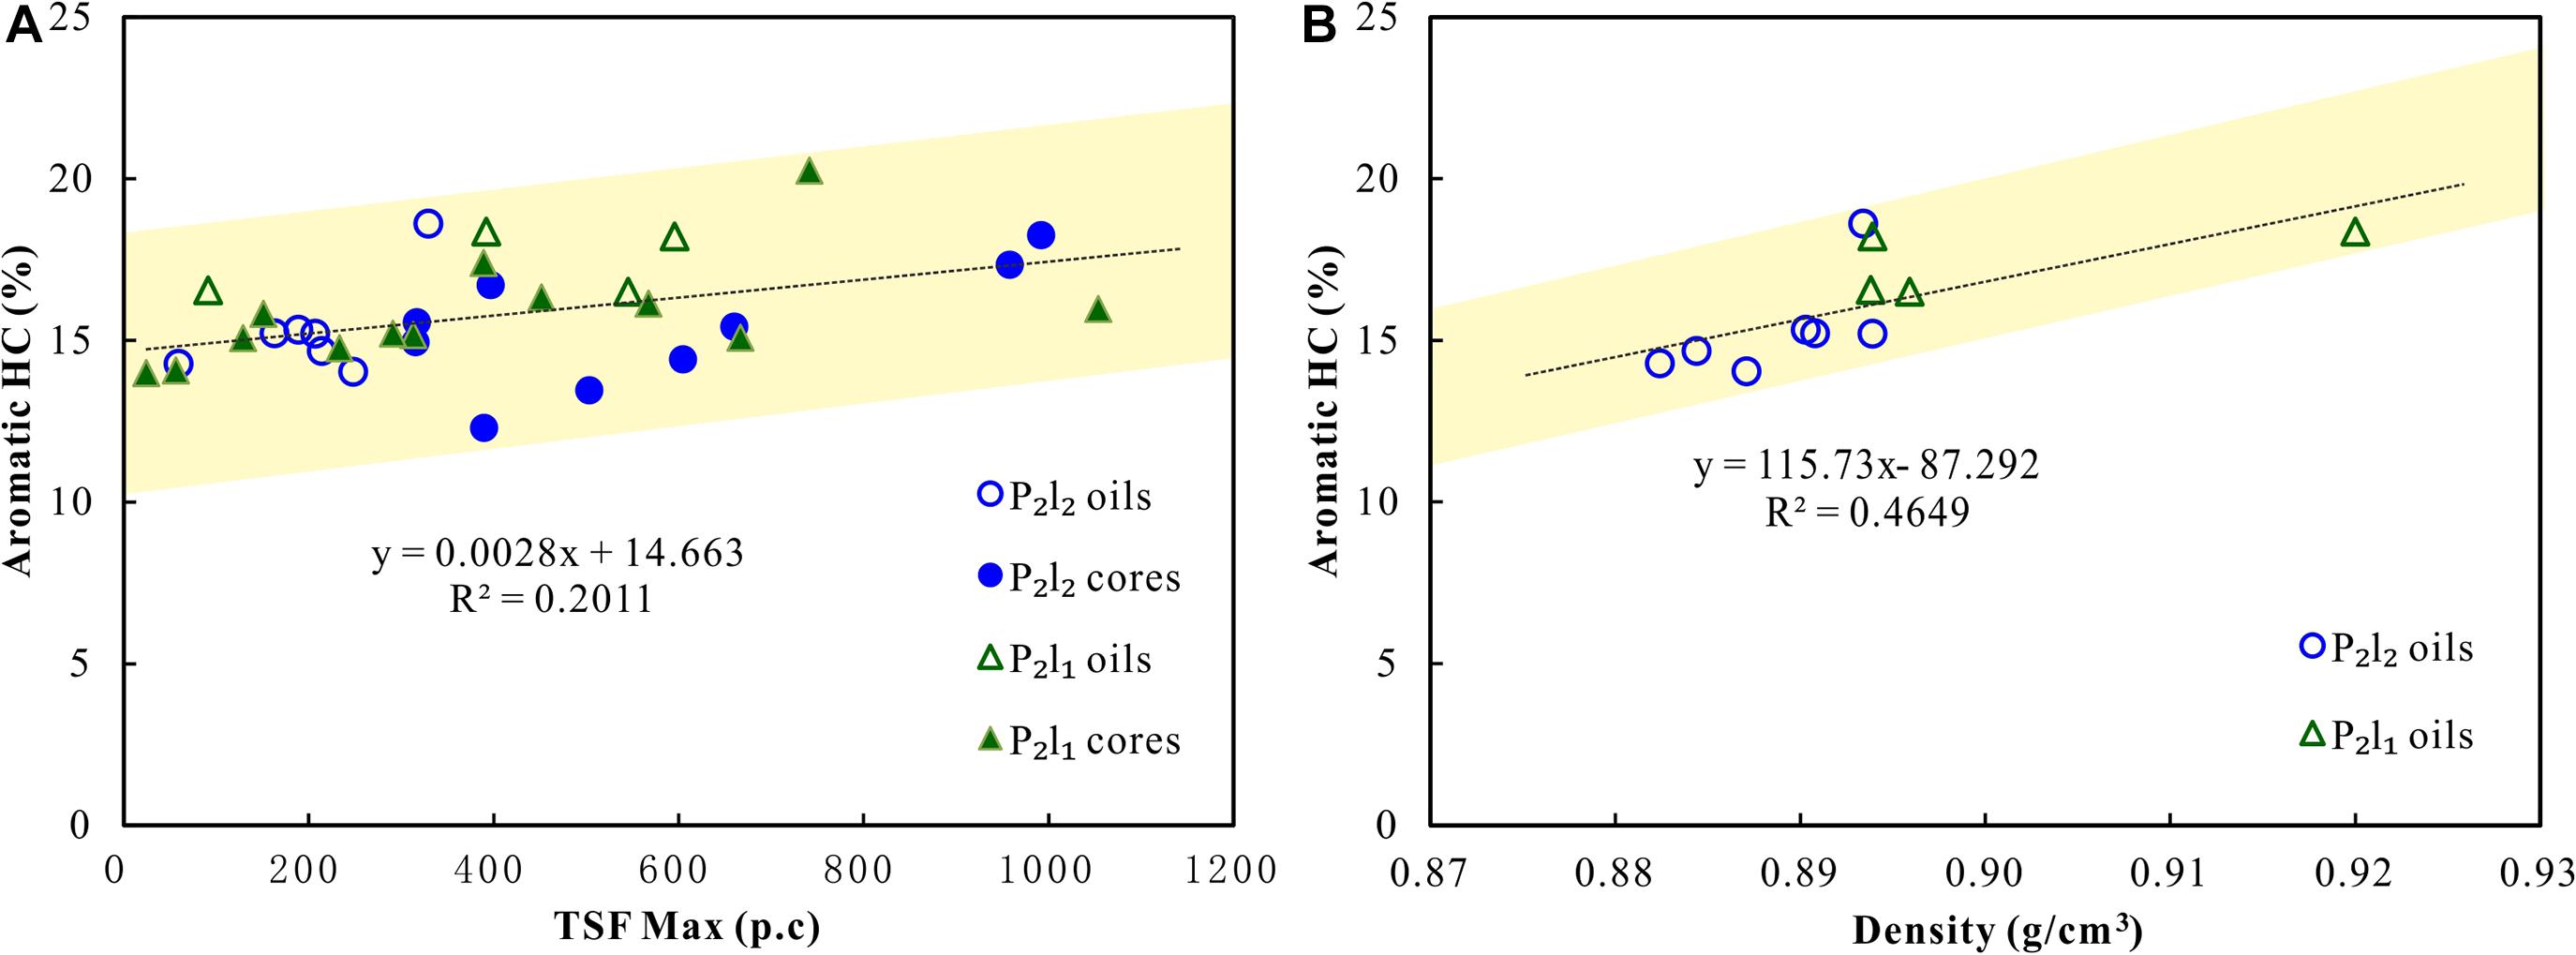
Figure 8. Plots of Aromatic HC vs. TSF Max (A) and Aromatic HC vs. Density (B) in the Lucaogou Formation, Jimsar Sag.
The physical properties of the crude oil samples are strongly correlated with the aromatic content (Figure 8B). Therefore, the TSF parameters exhibit significant correlations with the physical properties of the oil (Figure 9). The TSF Max and R1 values are positively correlated with the oil density, negatively correlated with the wax content, and negatively correlated with the freezing point. The lower TSF Max and R1 values indicate a lower oil density, a higher wax content, a higher freezing point, and a better quality of the crude oil. The TSF Max and R1 values in the upper section of the Lucaogou Formation are lower than those in the lower section (Figure 9), indicating that the physical properties of the oil in the upper section of the Lucaogou Formation are better than those of the oil in the lower section. This result is consistent with the actual exploration results (Table 2). It can be concluded that the quality of the crude oil affects its TSF characteristics. Therefore, the TSF Max and R1 values can be used to predict the quality of the oil to a certain extent.
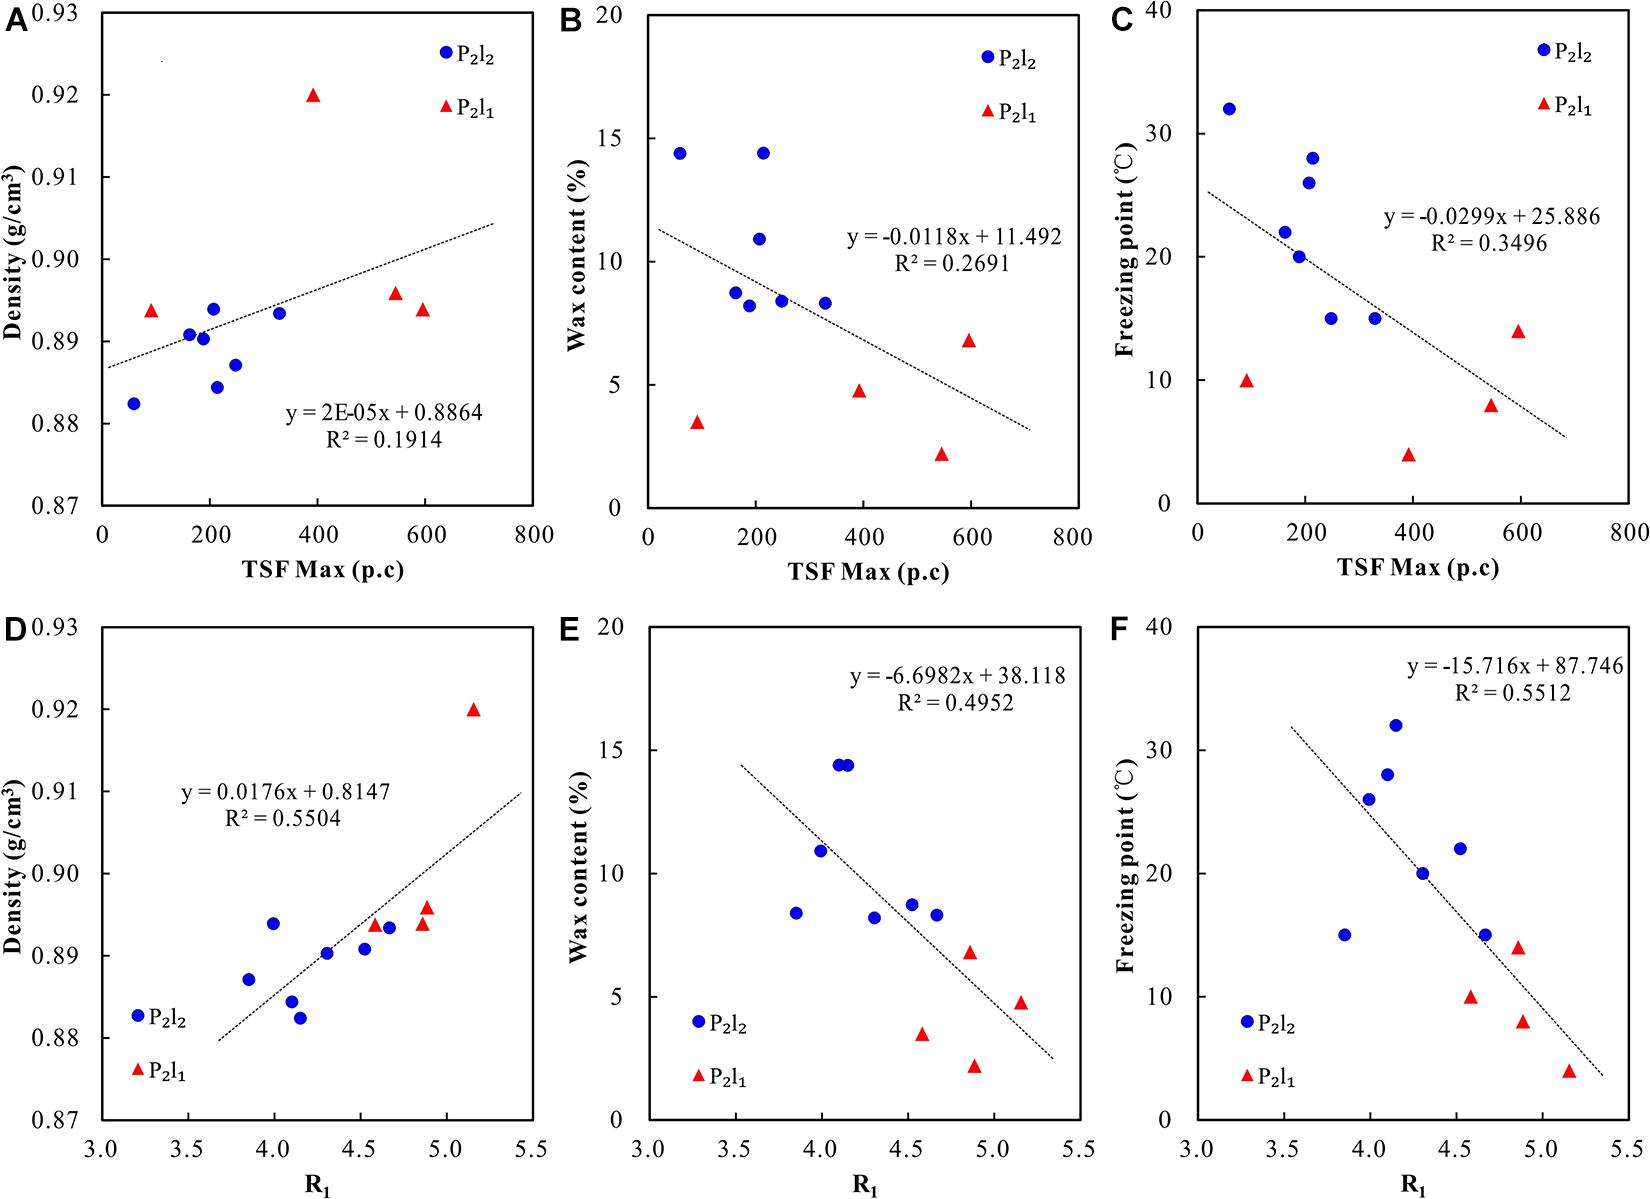
Figure 9. Plots of physical properties vs. TSF parameters for oils in the Lucaogou Formation, Jimsar Sag. (A) Density vs. TSF Max; (B) Wax content vs. TSF Max; (C) Freezing point vs. TSF Max; (D) Density vs. R1; (E) Wax content vs. R1; (F) Freezing point vs. R1.
TSF Parameters vs. Thermal Maturity
Previous studies have shown that maturity is an important factor affecting the fluorescent fingerprint characteristics of crude oil (Barwise and Hay, 1996; Li et al., 2006, 2007; Liu et al., 2014; Wu et al., 2016). The TSF parameter R1 values mainly increase with decreasing thermal maturity, which has been reported for conventional oil from Europe, Australia, and eastern China (Barwise and Hay, 1996; Li et al., 2007; Liu et al., 2014). The emission wavelength of 360 nm mainly represents three-ring aromatics (such as the phenanthrene series), the emission wavelength of 320 nm mainly represents two-ring aromatics (such as the naphthalene series). The R1 and R2 values represent the ratio of the heavy fraction to the light fraction in the sample (Li et al., 2007; Liu et al., 2014, 2016). Therefore, in theory, the lower the values of R1 and R2, the less the heavy fraction and the greater the light fraction, indicating a higher degree of maturity. In this study, the relationships between the R1 values and the C29 ββ/(αα + ββ) and Ts/(Ts + Tm) ratios were analyzed (Figure 10). The results reveal that the R1 values are negatively correlated with thermal maturity. As the R1 values increase, the C29ββ/(αα + ββ) and Ts/(Ts + Tm) ratios decrease (Figure 10 and Table 3). Although there are some differences in depositional environment and organic matter origin between the upper and lower sections of the Lucaogou Formation, the variation trends of the R1 values and the biomarker maturity parameters still exist in the two sections, respectively. As above mentioned, the thermal maturity of the tight reservoirs in the upper section is higher than that of the tight reservoirs in the lower section (Figure 6), which may result in better physical properties, lower aromatic hydrocarbon contents, and smaller R1 values in the upper section than in the lower section of the Lucaogou Formation (Figures 3, 9 and Tables 2–4). It can be concluded that the TSF parameter is a good indicator of the thermal maturity of the shale oil in the Lucaogou Formation in the Jimsar Sag.
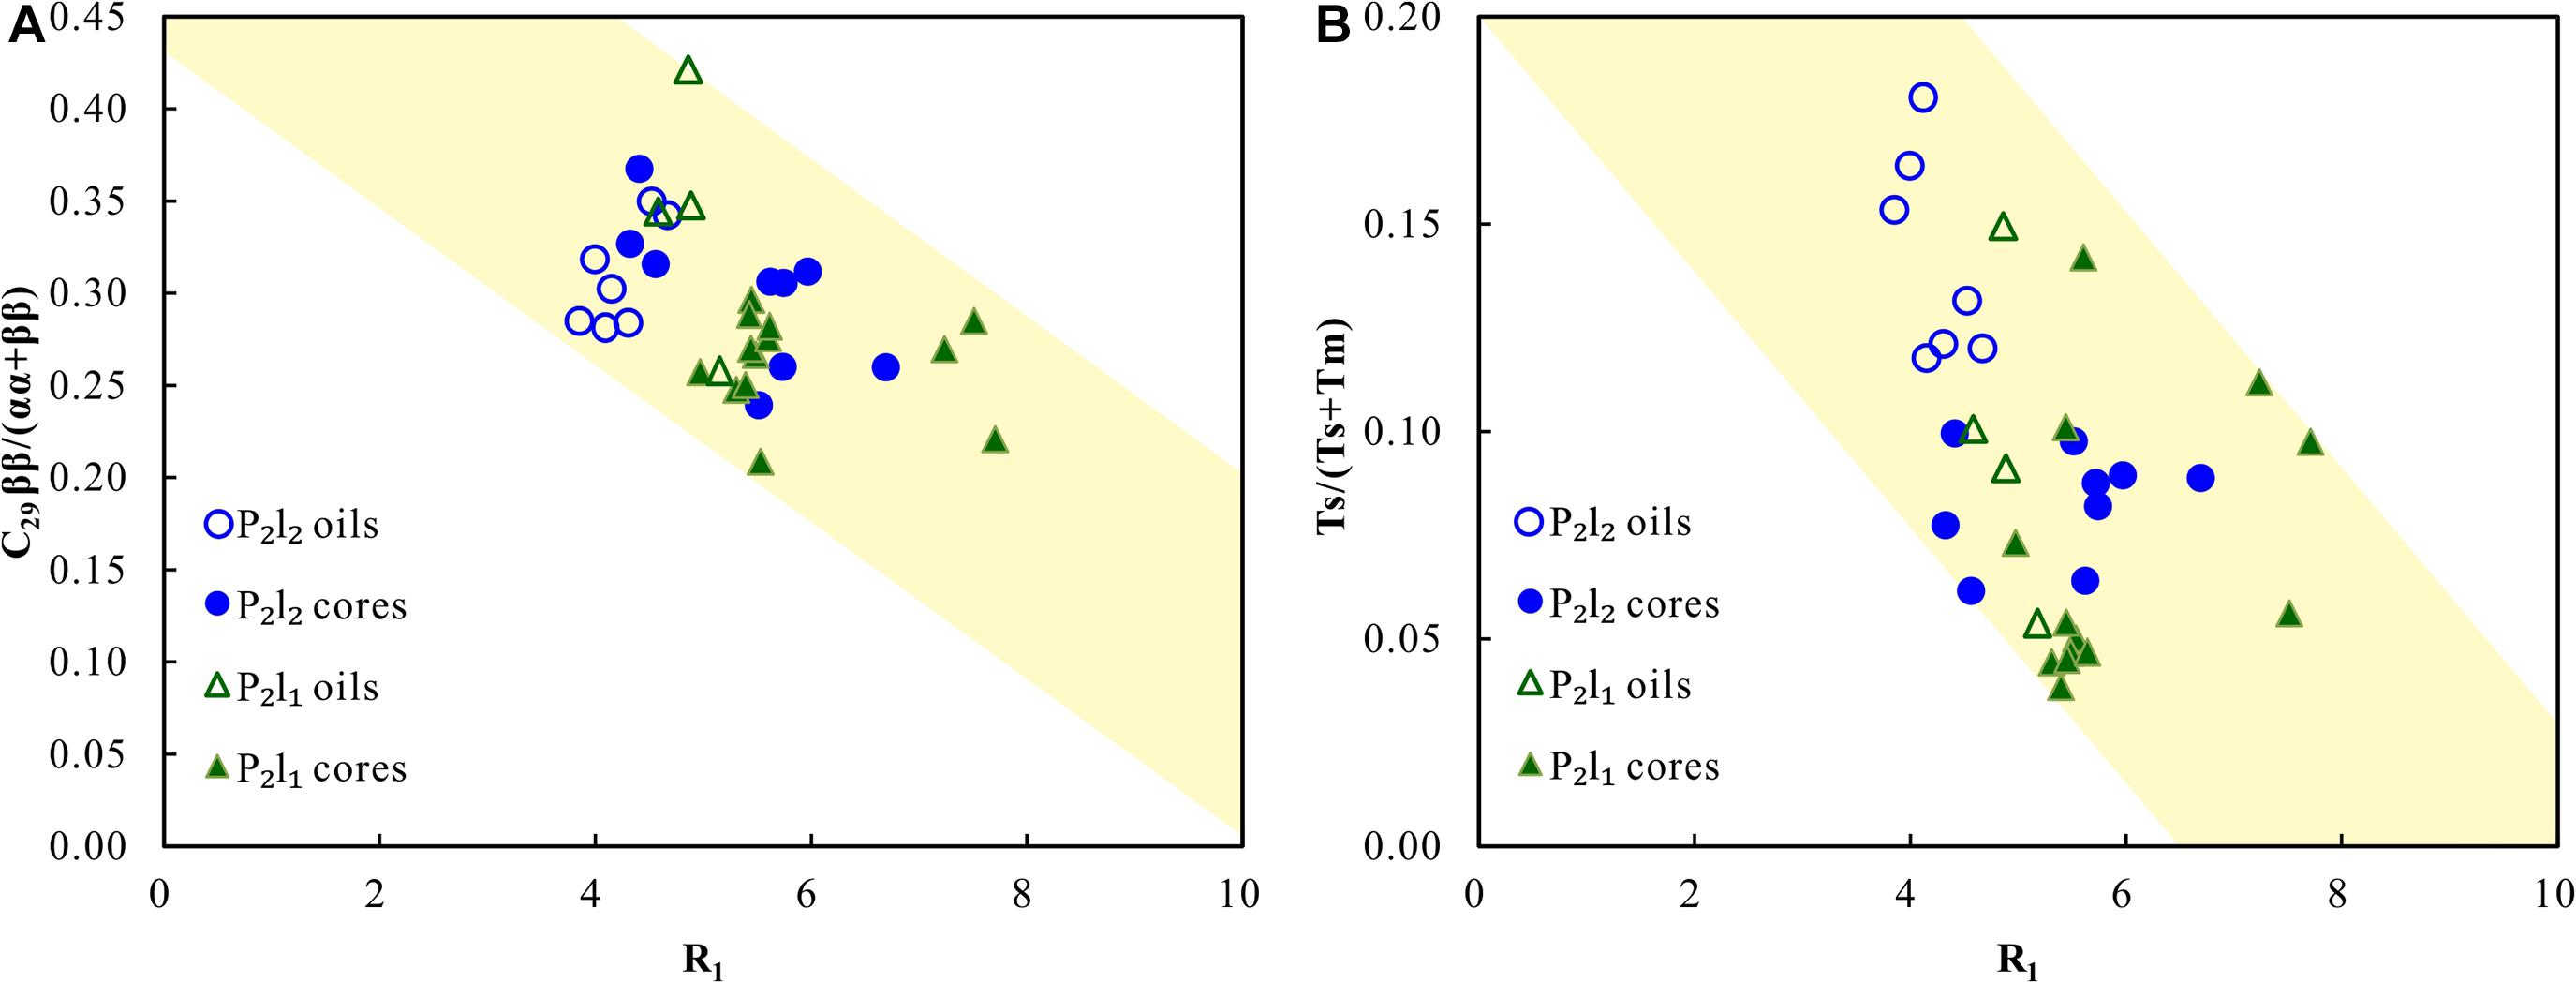
Figure 10. Plots of C29 ββ/(αα + ββ) vs. R1 (A) and Ts/(Ts + Tm) vs. R1 (B) for cores and oils in the Lucaogou Formation, Jimsar Sag.
TSF Parameters vs. Hydrocarbon Migration and Oil-Producing Layer Type
The lacustrine shale sequence in China are characterized by complex lithology, strong heterogeneity, and frequent interbedding of shale and thin tight reservoir layers (Kuang et al., 2012; Zou et al., 2015; Zhao et al., 2020; Hou et al., 2021a), which makes it difficult to determine whether the shale oil is mainly produced from tight reservoirs or the shale in the same shale sequence package. Previous studies have shown that there is an obviously positive correlation between TSF fluorescence intensity and oil content for shale (Liu B. et al., 2019), indicating that the TSF parameters may be used to predict the oil-producing layer. In this study, it was found that on the condition of similar depositional environment, organic matter origin, and maturity, the TSF parameters may be effective indicators for determining the oil-producing layer is the tight reservoirs or the adjacent shale in the same shale sequence package. For a set of shale strata with similar sedimentary environment, organic matter origin, and maturitiy, the largest difference between the oil in the shale and tight reservoirs may be the difference in the oil migration distance. The oil in shale is generated and accumulated in situ, and the oil basically does not migrate. The oil in tight reservoirs originates from adjacent shale and migrates a distance, but the oil migration distance in tight reservoirs is shorter than that in conventional reservoirs. The light fraction of the hydrocarbons migrates more easily than the heavy fraction, so as the migration distance increases, the R1 and R2 values decrease. Therefore, it can be inferred that there may be some differences between the TSF parameters of the shale and tight reservoirs.
Comparisons of the TSF parameter characteristics of the blocky shale, fractured shale, tight reservoirs, and produced oil in the upper and lower sections of the Lucaogou Formation were carried out. The results reveal that the TSF parameter characteristics of the oil in the different reservoirs in the Lucaogou Formation are significantly different. The R1 and R2 values of the blocky shale, fractured shale, tight reservoirs, and produced oils are decreased successively (Figure 11A). The distributions of the R1 and R2 values of the tight reservoir and oil samples from the upper section of the Lucaogou Formation are scattered. In contrast, the distributions of the R1 and R2 values of the tight reservoir and oil samples from the lower section of the Lucaogou Formation are more concentrated. This shows that the hydrocarbons in the tight reservoirs in the upper section of the Lucaogou Formation have migrated over a long distance, and the fractionation effects are more distinct. In comparison, the hydrocarbons in the tight reservoirs in the lower section of the Lucaogou Formation migrated only a short distance, so the fractionation effects are not distinct. These findings are consistent with the above mentioned results revealed by the biomarker characteristics. By comparing the R1 and R2 values of the core and oil samples, it is preliminarily determined that the shale oil in the upper and lower sections of the Lucaogou Formation is mainly produced from the tight reservoirs in the shale sequence (Figure 11). However, since all of the core samples were collected from Well J174, there is a lack of core samples from the wells with higher maturity in the deep part of the Jimsar Sag. Therefore, further studies on the identification of oil-producing layer type of the Lucaogou Formation in other wells are needed.
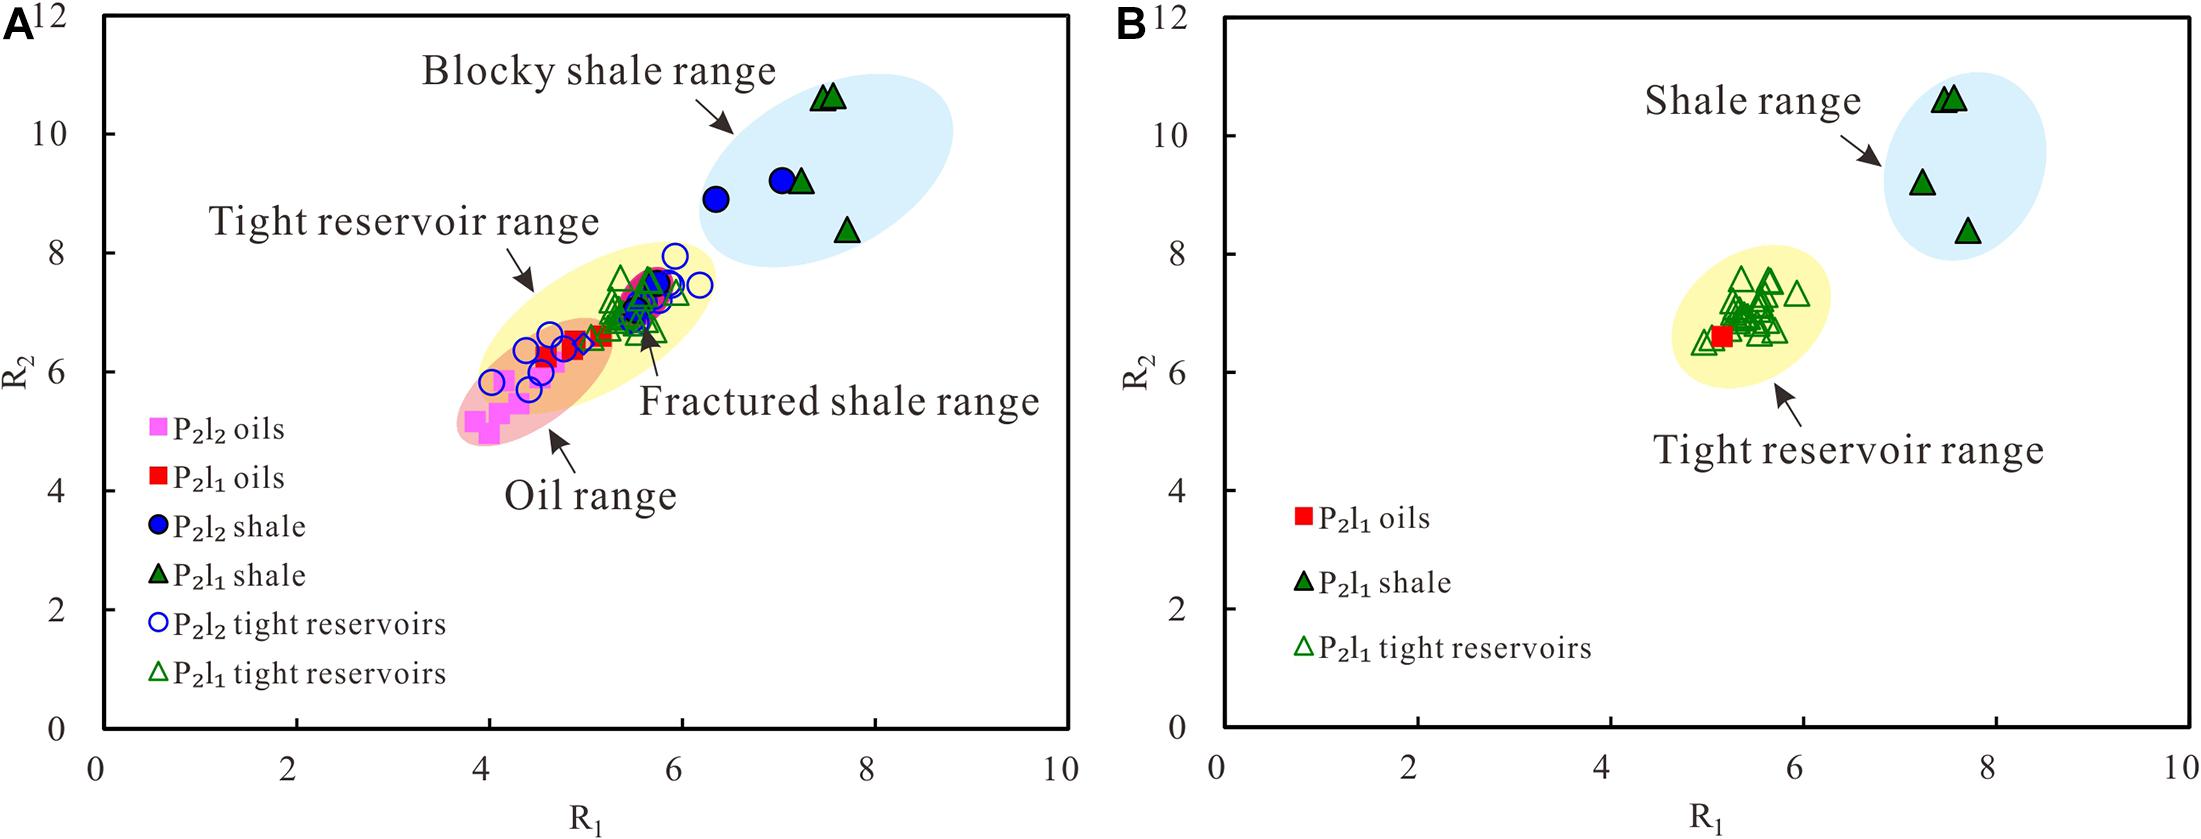
Figure 11. R2 vs. R1 plot for shale, tight reservoirs and oils in the Lucaogou Formation, Jimsar Sag. (A) all the samples; (B) the lower section of the Lucaogou Formation samples in the Well J174.
Conclusion
The TSF analysis of the shale, tight reservoirs, and oils in the Lucaogou Formation in the Jimsar Sag were carried out. The relationship between the TSF parameters and geochemical parameters were discussed. The shale, tight reservoir, and oil samples from the Lucaogou Formation have very similar TSF spectrogram characteristics, but different TSF parameter characteristics. The TSF parameters are good indicators of the hydrocarbon composition, physical properties, thermal maturity, migration, and oil-producing layers. The TSF Max and R1 values are correlated with the aromatic hydrocarbon contents and oil physical parameters. The R1 values increase with decreasing thermal maturity and migration distance. The hydrocarbons have lower aromatic hydrocarbon contents, better physical properties, higher thermal maturity, and longer migration distance in the upper section than in the lower section of the Lucaogou Formation. It is preliminarily concluded that the shale oil was mainly produced from the tight reservoirs in the shale sequence of the Lucaogou Formation, Jimsar Sag.
Data Availability Statement
The original contributions presented in the study are included in the article/supplementary material, further inquiries can be directed to the corresponding author/s.
Author Contributions
All authors contributed to the article and approved the submitted version.
Funding
This work was supported by the CNPC International Science and Technology Cooperation Development Project (2012A-4802-02 and 2015D-4810-02).
Conflict of Interest
All authors are employed by the company PetroChina.
Acknowledgments
We acknowledge the Xinjiang Oilfield for sample collection.
References
Barwise, T., and Hay, S. (1996). “Predicting oil properties from core fluorescence,” in Hydrocarbon Migration and Its Nearsurface Expression, eds D. Schumacher and M. A. Abrams (Tulsa: AAPG Memoir.), 363–371.
Brooks, J., Kennicutt, M. II, Barnard, L., Denoux, G., and Carey, B. (1983). “Applications of total scanning fluorescence to exploration geochemistry,” in Proceedings of the Offshore Technology Conference, London, 393–400.
Cao, Z., Liu, G., Kong, Y., Wang, C., Niu, Z., Zhang, J., et al. (2016). Lacustrine tight oil accumulation characteristics: Permian Lucaogou Formation in Jimusaer Sag, Junggar Basin. Int. J. Coal Geol. 153, 37–51. doi: 10.1016/j.coal.2015.11.004
Chen, J., Pang, X., Pang, H., Chen, Z., and Jiang, C. (2018). Hydrocarbon evaporative loss evaluation of lacustrine shale oil based on mass balance method: permian lucaogou formation in jimusaer depression, junggar basin. Mar. Pet. Geol. 91, 422–431. doi: 10.1016/j.marpetgeo.2018.01.021
Didyk, B., Simoneit, B., and Brassell, C. (1978). Organic geochemical indicators of palaeoenvironmental conditions of sedimentation. Nature 272, 216–222. doi: 10.1038/272216a0
Ding, W., Hou, D., Jiang, L., Jiang, Y., and Wu, P. (2020). High abundance of carotanes in the brackish-saline lacustrine sediments: a possible cyanobacteria source. Int. J. Coal Geol. 219:103373. doi: 10.1016/j.coal.2019.103373
Ding, X., Qu, J., Imin, A., Zha, M., Su, Y., Jiang, Z., et al. (2019). Organic matter origin and accumulation in tuffaceous shale of the lower permian lucaogou formation, Jimsar Sag. J. Pet. Sci. Eng. 179, 696–706. doi: 10.1016/j.petrol.2019.05.004
Espitalié, J., Marquis, F., and Barsony, I. (1984). “Geochemical logging,” in Analytical Pyrolysis, ed. K. J. Voorhess (Boston: Butterworths), 53–79.
Fan, J., Liu, S., Liu, K., Ma, X., and Liu, R. (2015). Preliminary study on determining coal maturity using total scanning fluorescence technique. Sci. Technol. Eng. 34, 139–143.
Gao, G., Zhang, W., Xiang, B., Liu, G., and Ren, J. (2016). Geochemistry characteristics and hydrocarbon-generating potential of lacustrine source rock in Lucaogou Formation of the Jimusaer Sag, Junggar Basin. J. Pet. Sci. Eng. 145, 168–182. doi: 10.1016/j.petrol.2016.03.023
Graham, S., Brassell, S., Carroll, A., Xiao, X., Demaison, G., Mcknight, C., et al. (1990). Characteristics of selected petroleum source rocks, Xinjiang Uygur Autonomous Region, Northwest China. AAPG Bull. 74, 493–512.
Hou, L., Luo, X., Han, W., Lin, S., Pang, Z., and Liu, J. (2020a). Geochemical evaluation of the hydrocarbon potential of shale oil and its correlation with different minerals-a case study of the TYP shale in the Songliao Basin, China. Energy Fuels 34, 11998–12009. doi: 10.1021/acs.energyfuels.0c01285
Hou, L., Luo, X., Zhao, Z., and Zhang, L. (2021a). Identification of oil produced from shale and tight reservoirs in the Permian Lucaogou Shale Sequence, Jimsar Sag, Junggar Basin, NW China. ACS Omega 6, 2127–2142. doi: 10.1021/acsomega.0c05224
Hou, L., Ma, W., Luo, X., Liu, J., Lin, S., and Zhao, Z. (2021b). Hydrocarbon generation-retention-expulsion mechanism and shale oil producibility of the permian lucaogou shale in the Junggar Basin as simulated by semi-open pyrolysis experiments. Mar. Petrol. Geol. 125:104880. doi: 10.1016/j.marpetgeo.2020.104880
Hou, L., Ma, W., Luo, X., Tao, S., Guan, P., and Liu, J. (2020b). Chemical structure changes of lacustrine Type-II kerogen under semi-open pyrolysis as investigated by solid-state 13C NMR and FT-IR spectroscopy. Mar. Pet. Geol. 116:104348. doi: 10.1016/j.marpetgeo.2020.104348
Hou, L., Ma, W., Luo, X., Tao, S., Guan, P., Liu, J., et al. (2020c). Characteristics and quantitative models for hydrocarbon generation-retention-production of shale under ICP conditions: example from the Chang 7 member in the Ordos Basin. Fuel 279:118497. doi: 10.1016/j.fuel.2020.118497
Hu, T., Pang, X., Jiang, S., Wang, Q., Zheng, X., Ding, X., et al. (2018). Oil content evaluation of lacustrine organic-rich shale with strong heterogeneity: a case study of the Middle Permian Lucaogou Formation in Jimusaer Sag, Junggar Basin, NW China. Fuel 222, 196–205. doi: 10.1016/j.fuel.2018.02.082
Huang, W., and Meinschein, G. (1979). Sterols as ecological indicators. Geochem. Cosmochim. Acta 43, 739–745. doi: 10.1016/0016-7037(79)90257-6
Kong, D., Cui, Y., Kong, L., Wang, S., and Shi, H. (2019). The application of digital image recognition to the analysis of three-dimensional fluorescence spectra of mixed oil. Spectrosc. Spectr. Anal. 39, 3407–3413.
Kuang, L., Tang, Y., Lei, D., Chang, Q., Ouyang, M., Hou, L., et al. (2012). Formation conditions and exploration potential of tight oil in the Permian saline lacustrine dolomitic rock, Junggar Basin, NW China. Pet. Explor. Dev. 39, 700–711. doi: 10.1016/s1876-3804(12)60095-0
Li, J., Wang, W., Cao, Q., Shi, Y., Yan, X., and Tian, S. (2015). Impact of hydrocarbon expulsion efficiency of continental shale upon shale oil accumulations in eastern China. Mar. Pet. Geol. 59, 467–479. doi: 10.1016/j.marpetgeo.2014.10.002
Li, S., Pang, X., Liu, K., and Jin, Z. (2006). Characteristics and application of total scanning fluorescence for oils and reservoir rock extracts from the dongying depression. Acta Geol. Sin. 80, 439–445.
Li, S., Pang, X., and Sun, A. (2007). Total scanning fluorescence for oils with different genetic types and controlling factors. Acta Geol. Sin. 81, 230–235.
Liu, B., Bai, L., Chi, Y., Jia, R., Fu, X., and Yang, L. (2019). Geochemical characterization and quantitative evaluation of shale oil reservoir by two-dimensional nuclear magnetic resonance and quantitative grain fluorescence on extract: a case study from the Qingshankou Formation in Southern Songliao Basin, northeast China. Mar. Pet. Geol. 109, 561–573. doi: 10.1016/j.marpetgeo.2019.06.046
Liu, B., Bechtel, A., Sachsenhofer, R. F., Gross, D., Gratzer, R., and Chen, X. (2017). Depositional environment of oil shale within the second member of Permian Lucaogou Formation in the Santanghu Basin, Northwest China. Int. J. Coal Geol. 175, 10–25. doi: 10.1016/j.coal.2017.03.011
Liu, B., Sun, J., Zhang, Y., He, J., Fu, X., Yang, L., et al. (2021). Reservoir space and enrichment model of shale oil in the first member of Cretaceous Qingshankou Formation in the Changling sag, southern Songliao Basin, NE China. Pet. Explor. Dev. 48, 1–16.
Liu, C., Liu, K., Wang, X., Wu, L., and Fan, Y. (2019). Chemostratigraphy and sedimentary facies analysis of the Permian Lucaogou Formation in the Jimusaer Sag, Junggar Basin, NW China: implications for tight oil exploration. J. Asian Earth Sci. 178, 96–111. doi: 10.1016/j.jseaes.2018.04.013
Liu, K. Y., Lu, X., Gui, L., Fan, J., Gong, Y., and Li, X. (2016). Quantitative fluorescence techniques and their application in hydrocarbon accumulation studies. Earth Sci. 41, 373–384.
Liu, K. Y., Simon, C. G., Lu, X., Gong, S., Tian, H., and Gui, L. (2014). Innovative fluorescence spectroscopic techniques for rapidly characterising oil inclusions. Organ. Geochemistr. 72, 34–45. doi: 10.1016/j.orggeochem.2014.04.010
Ma, W., Hou, L., Luo, X., Liu, J., Tao, S., Guan, P., et al. (2020). Generation and expulsion process of the Chang 7 oil shale in the Ordos Basin based on temperature-based semi-open pyrolysis: implications for in-situ conversion process. J. Pet. Sci. Eng. 190:107035. doi: 10.1016/j.petrol.2020.107035
Mackenzie, A., Patience, L., Maxwell, R., Vandenbroucke, M., and Durand, B. (1980). Molecular parameters of maturation in the Toarcian shales, Paris Basin, France—I. Changes in the configurations of acyclic isoprenoid alkanes, steranes and triterpanes. Geochim. Cosmochim. Acta 44, 1709–1721. doi: 10.1016/0016-7037(80)90222-7
Pang, H., Pang, X., Dong, L., and Zhao, X. (2018). Factors impacting on oil retention in lacustrine shale: permian Lucaogou Formation in Jimusaer Depression, Junggar Basin. J. Pet. Sci. Eng. 163, 79–90. doi: 10.1016/j.petrol.2017.12.080
Peters, K., Fraser, H., and Amris, W. (1999). Geochemistry of crude oils from eastern Indonesia. AAPG Bull. 83, 1927–1942.
Peters, K., and Moldowan, J. (1993). The Biomarker Guide: Interpreting Molecular Fossils in Petroleum and Ancient Sediments. Englewood Cliffs, NJ: Prentice Hall.
Qiu, Z., Tao, H., Zou, C., Wang, H., Ji, H., and Zhou, S. (2016). Lithofacies and organic geochemistry of the middle Permian Lucaogou Formation in the Jimusar sag of the Junggar Basin, NW China. J. Pet. Sci. Eng. 140, 97–107. doi: 10.1016/j.petrol.2016.01.014
Reyes, M. (1993). “The application of fluorescence techniques for mudlogging analysis of oil drilled with oil-based muds,” in Proceedings of the 22nd Annual Convention Proceedings, Vol. 2, (Tulsa: AAPG), 157–170.
Seifert, K., and Moldowan, M. (1978). Applications of steranes, terpanes and monoaromatics to the maturation, migration and source of crude oils. Geochem. Cosmochim. Acta 42, 77–95. doi: 10.1016/0016-7037(78)90219-3
Seifert, W., and Moldowan, J. (1980). The effect of thermal stress on source-rock quality as measured by hopane stereochemistry. Phys. Chem. Earth 12, 229–237. doi: 10.1016/0079-1946(79)90107-1
Seifert, W., and Moldowan, J. (1986). Use of biological markers in petroleum exploration. Methods Geochem. Geophys. 24, 261–290.
Su, Y., Zha, M., Ding, X., Qu, J., Gao, C., Jin, J., et al. (2019). Petrographic, palynologic and geochemical characteristics of source rocks of the Permian Lucaogou formation in Jimsar Sag, Junggar Basin, NW China: origin of organic matter input and depositional environments. J. Pet. Sci. Eng. 183:106364. doi: 10.1016/j.petrol.2019.106364
Wang, X., Yang, Z., Guo, X., Wang, X., Feng, Y., and Huang, L. (2019). Practices and prospects of shale oil exploration in Jimsar Sag of Junggar Basin. Xinjiang Petrol. Geol. 40, 402–413.
Wang, Y., Cao, J., Tao, K., Li, E., Ma, C., and Shi, C. (2020). Reevaluating the source and accumulation of tight oil in the middle Permian Lucaogou Formation of the Junggar Basin, China. Mar. Pet. Geol. 117:104384. doi: 10.1016/j.marpetgeo.2020.104384
Wu, H., Zhao, M., Zhuo, Q., Lu, X., Li, W., Zeng, F., et al. (2016). Palaeofluid evolution process in Well Block Tubei 1 in the Kuqa Depression, Tarim Basin. Nat. Gas Ind. B 3, 129–138. doi: 10.1016/j.ngib.2016.03.007
Yang, Z., Zou, C., Hou, L., Wu, S., Lin, S., Luo, X., et al. (2019). Division of fine-grained rocks and selection of “sweet sections” in the oldest continental shale in China: taking the coexisting combination of tight and shale oil in the Permian Junggar Basin. Mar. Pet. Geol. 109, 339–348. doi: 10.1016/j.marpetgeo.2019.06.010
Zha, M., Wang, S., Ding, X., Feng, Q., Xue, H., and Su, Y. (2019). Tight oil accumulation mechanisms of the Lucaogou Formation in the Jimsar Sag, NW China: insights from pore network modeling and physical experiments. J. Asian Earth Sci. 178, 204–215. doi: 10.1016/j.jseaes.2018.05.037
Zhao, W., Hu, S., and Hou, L. (2018). Connotation and strategic role of in-situ conversion processing of shale oil underground in the onshore China. Pet. Explor. Dev. 45, 563–572. doi: 10.1016/s1876-3804(18)30063-6
Zhao, W., Hu, S., Hou, L., Yang, T., and Yang, Z. (2020). Types and resource potential of continental shale oil in China and its boundary with tight oil. Pet. Explor. Dev. 47, 1–11. doi: 10.1016/s1876-3804(20)60001-5
Zhi, D., Tang, Y., Yang, Z., Guo, X., Zheng, M., Wan, M., et al. (2019). Geological characteristics and accumulation mechanism of continental shale oil in Jimusaer sag, Junggar Basin. Oil Gas Geol. 40, 524–535.
Zou, C., Yang, Z., Cui, J., Zhu, R., Hou, L., and Tao, S. (2013). Formation mechanism, geological characteristics, and development strategy of nonmarine shale oil in China. Petrol. Exploration Dev. 40, 15–27. doi: 10.1016/s1876-3804(13)60002-6
Keywords: total scanning fluorescence, lacustrine shale oil, lucaogou formation, Jimsar sag, Junggar basin
Citation: Zhao Z, Hou L, Luo X, Sun F, Lin S and Zhang L (2021) Total Scanning Fluorescence Characteristics and Implications of Shale Oil in the Lucaogou Formation, Jimsar Sag, Junggar Basin, NW China. Front. Earth Sci. 9:664330. doi: 10.3389/feart.2021.664330
Received: 05 February 2021; Accepted: 07 April 2021;
Published: 30 April 2021.
Edited by:
Dawei Lv, Shandong University of Science and Technology, ChinaReviewed by:
Xianfeng Tan, Chongqing University of Science and Technology, ChinaBo Liu, Northeast Petroleum University, China
Copyright © 2021 Zhao, Hou, Luo, Sun, Lin and Zhang. This is an open-access article distributed under the terms of the Creative Commons Attribution License (CC BY). The use, distribution or reproduction in other forums is permitted, provided the original author(s) and the copyright owner(s) are credited and that the original publication in this journal is cited, in accordance with accepted academic practice. No use, distribution or reproduction is permitted which does not comply with these terms.
*Correspondence: Lianhua Hou, aG91bGhAcGV0cm9jaGluYS5jb20uY24=; Xia Luo, bHVveGlhNjlAcGV0cm9jaGluYS5jb20uY24=