 Taiqiang Yang
 Daochuan Liu3
 Xiaojun Guo
 Jun Zhang
94% of researchers rate our articles as excellent or good
Learn more about the work of our research integrity team to safeguard the quality of each article we publish.
Find out more
ORIGINAL RESEARCH article
Front. Earth Sci., 14 April 2021
Sec. Hydrosphere
Volume 9 - 2021 | https://doi.org/10.3389/feart.2021.660634
This article is part of the Research TopicWater-Related Natural Disasters in Mountainous AreaView all 39 articles
The generation and development of excess pore water pressure directly affects the grain interaction in debris flow, which can significantly reduce the friction strength and promote the movement of debris flow. It has been found that coarse grains favor the increase in excess pore water pressure, but the effect due to grain configuration is missing in studies. In order to study the influence of grain configuration, field investigations and laboratory tests were carried out for two typical cases, i.e., flow with coarse grains evenly mixed (case I) and flow with coarse grains floating on the surface (case II). The results show that case II generates much higher excess pore water pressure than case I. The variation of relative excess pore water pressure (Ur) with time (t) satisfies the power function relationship: Ur = mt–n. Case II often has a smaller n value, meaning a low dissipation rate of excess pore water pressure. This study is helpful for a better understanding of granular effects in debris flow.
The wide-graded grain composition (from 10–6 m clay to 1 m gravel) plays a decisive role in the formation and movement of debris flow. The change of grain composition affects the dynamic parameters, such as viscosity, velocity, and density (Iverson and Denlinger, 2001; Iverson and Vallance, 2001; Li et al., 2015, 2016). The separation and migration of grains cause changes in the volume concentration and the physical properties, leading to a complex, random, and unstable structure (Kaitna et al., 2007; Chen and Cui, 2017; Cui et al., 2017). Granular materials often exhibit manifold properties such as dilatancy, separation, thixotropy, and blockage, these affect the grain composition and the movement of debris flows (Savage and Lun, 1988; Coussot and Meunier, 1996; Shu et al., 2012; Wang et al., 2014; Pellegrino and Schippa, 2018). There have been many studies on the granular effects and structures and the related mechanisms in debris flows (Bagnold, 1954; Middleton, 1970; Cui et al., 1993; Deng, 1995; Vallance and Savage, 2000; Luo, 2003; Ni and Qu, 2003; Yang, 2003; Fan, 2010; Shu et al., 2012), but no studies on the influence due to the detailed grain configuration on the sustained fluidity.
A typical bedding structure is that coarse grains (sometimes larger than 8 mm) accumulating on the surface, while the average grain size of the underlying layer is smaller poorly sorted (Enos, 1977; Major, 1995; Wang et al., 2009). This means that there exist roughening layers on the surface; and it is believed to influence the pore water pressure (Takahashi, 2014). In particular, unlike the point concentrated load generated by the boulder, the layered load generated by the overlying coarse-grained layer is a concentrated load applied to the underlying fluid, and the consequent effects on fluids are extensive. For the debris-flow mass containing the overlying coarse-grained layer moving in the confining channel (Pierson, 1981), the influence of coarser grains accumulating on the surface on its mobilization has not been studied in depth.
In this study, through the fresh debris flow materials and deposit obtained in the field, the samples of two grain configurations were reconstituted, and then the variation of relative excess pore water pressure was measured by laboratory experiments. The peak relative pore water pressure caused by grain separation was compared. Finally, through the quantitative analysis of the change of relative excess pore water pressure, the influence of coarse-grained layer on the mobility of debris flow is discussed.
The field investigation was carried out on a tributary gully (N: 26°15′3′′, E: 103°9′11′′) in Jiangjia Gully (JJG), Kunming, Yunnan Province. The small-scale debris flows in the tributary are frequent and easy to observe on site. At the observation position shown in Figure 1, the debris flows occurring in the tributary were continuously observed for 7 h, and the in-situ density (ρ), flow velocity (v), and flow depth (H) were measured. During the period, a total of 24 debris flows occurred.
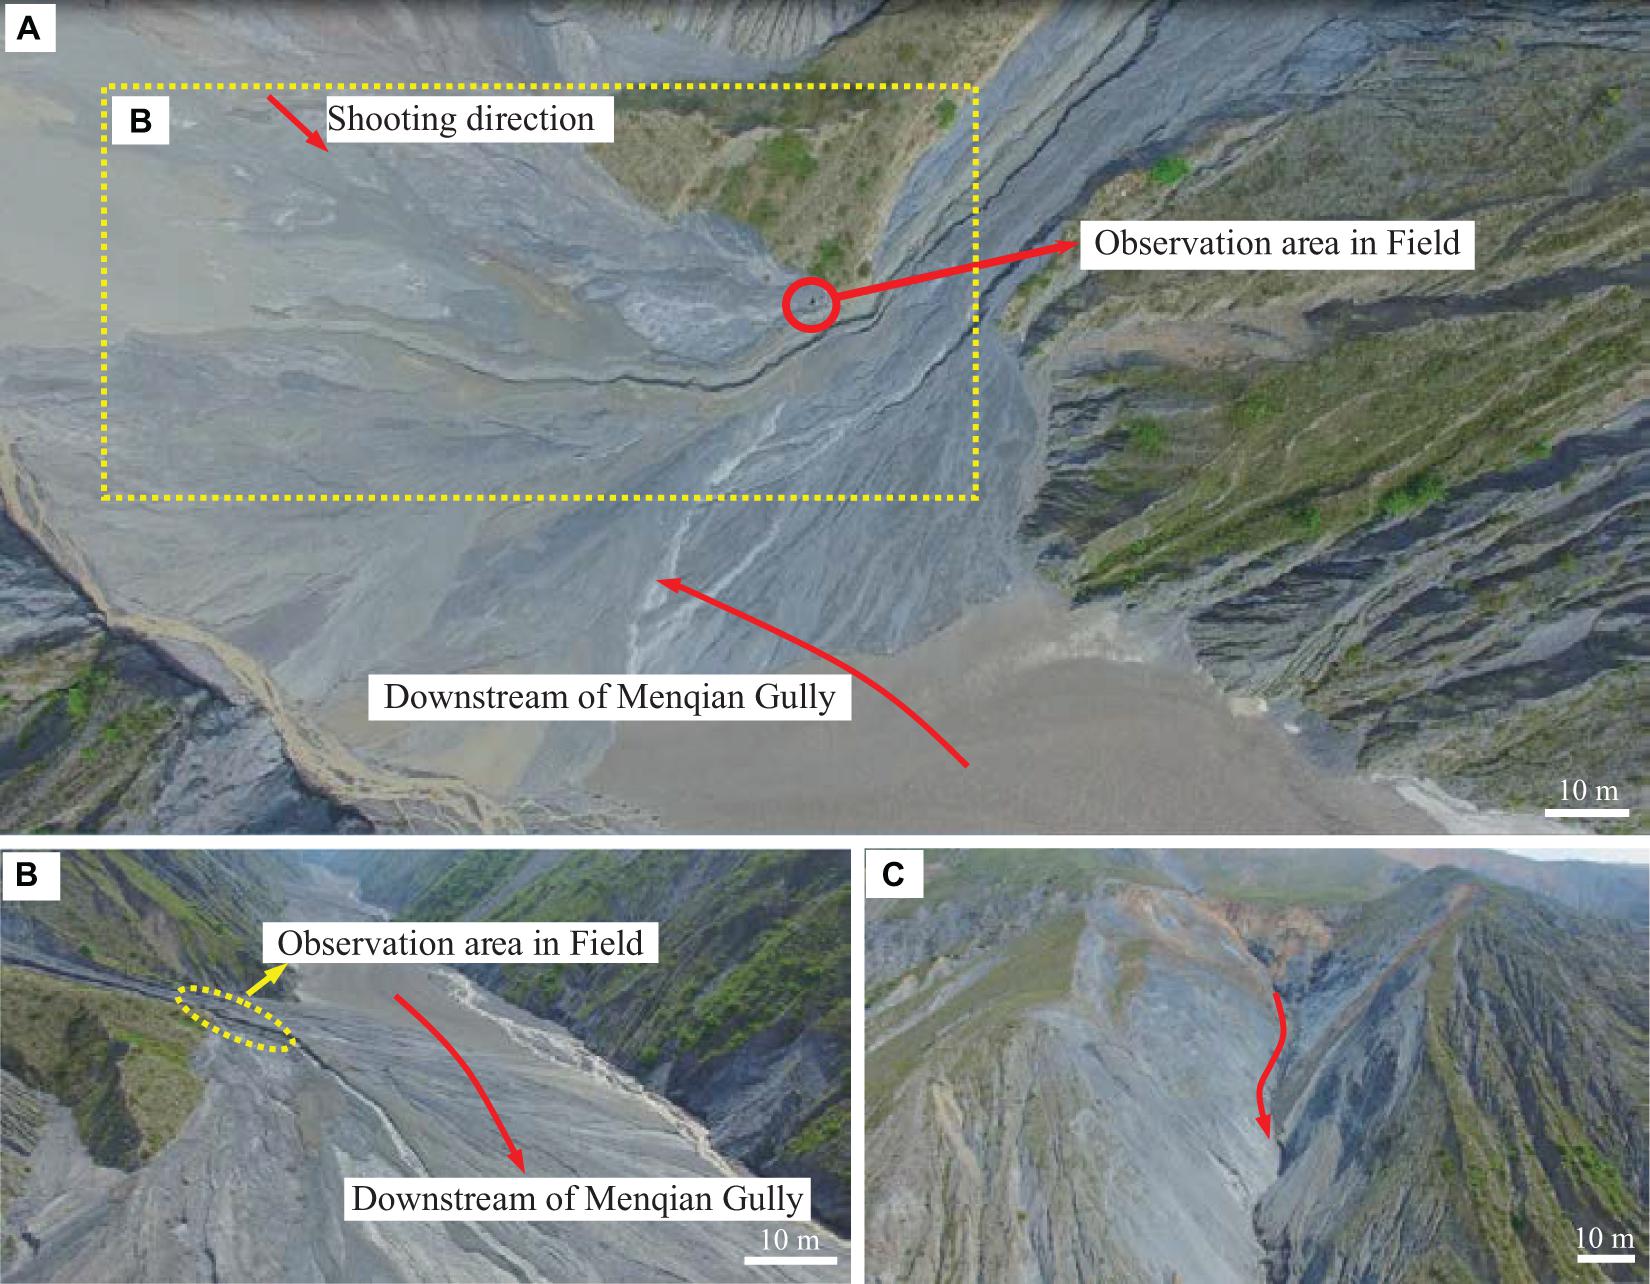
Figure 1. Aerial image of the tributary gully. (A) Top view of the middle and lower tributary gully. (B) Side view of the middle and lower tributary gully. (C) Upstream of the tributary gully.
Each surge shows a different flow regime (Figure 2), and the density, velocity, depth and grain composition are different. After flowing through the gentle slope, some surges slow down in the form of creep, while others show high mobility and move continuously to the downstream.
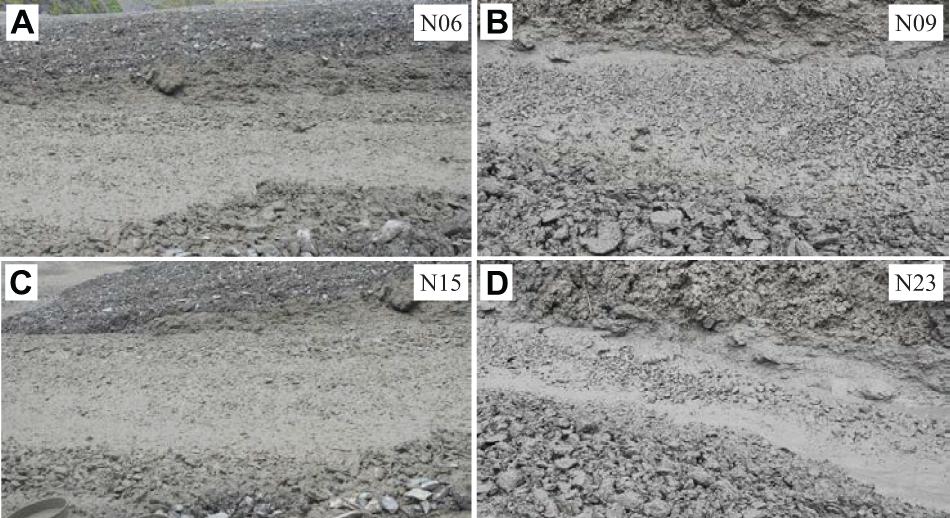
Figure 2. Flow regime of partial surges.
Among the surges, three cases (N04, N11, and N12) have obvious coarse-grained aggregation on the surface (see Figure 3), i.e., reverse grading bedding, while the others have no such a coarse-grained layer. The grain configuration shown in Figure 3 is significantly different from that shown in Figure 2. There are also boulders with grains size greater than 200 mm on the surface. These boulders are partially submerged in the fluid, partially protruding, without turning or sinking, and the position is stable.
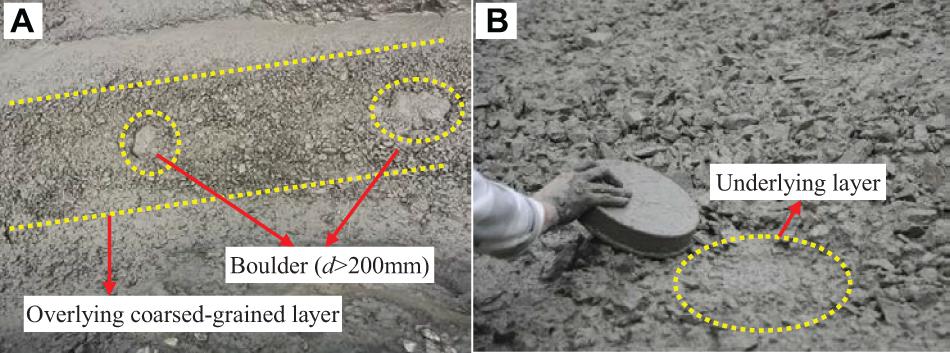
Figure 3. Overlying coarse layer configuration.
It is noted that the three surges move much faster than the others and have longer run-out distances. The average velocity of N04, N11, and N12 is 5.1m/s, and the average run-out distance is 27.4 m; while for the other surges the average velocity is 3.6 m/s, and the run-out distance is 16.6 m. The density, velocity, flow depth and pore pressure number (Np) of the surge measured are shown in Table 1. Np is an important dimensionless parameter to describe the flow regime, which reflects the ratio of timescales for debris flow movement and pore pressure diffusion (Iverson, 1997, 2015; Iverson et al., 2010).
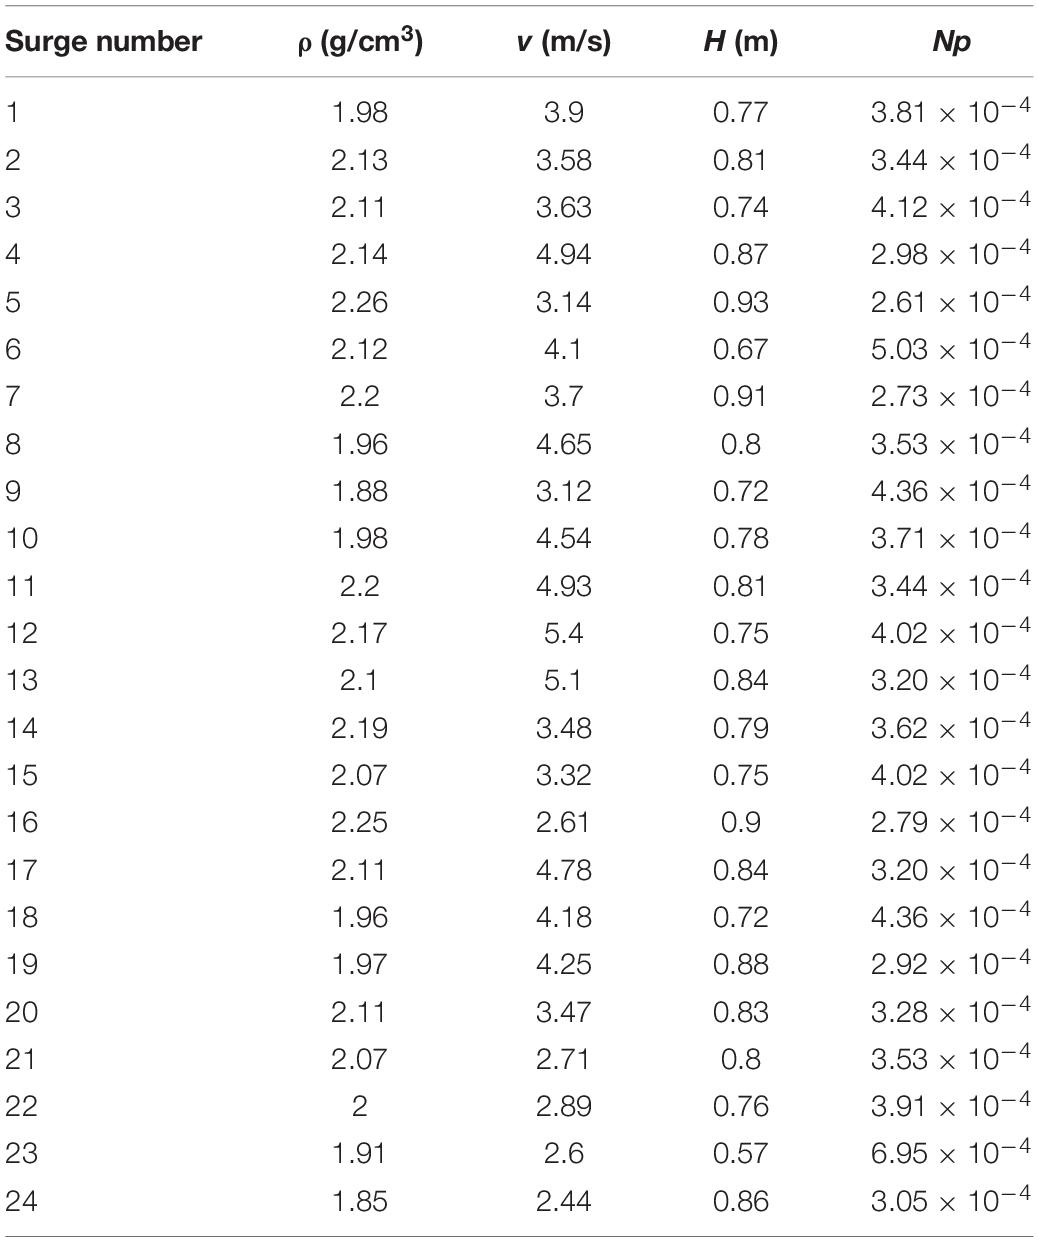
Table 1. Observed quantities of debris flow surges (number according to the order of occurrence).
where L is the channel length (m), g is the gravitational acceleration (9.8 m/s2), H is the flow depth (m), Df is hydraulic diffusivity (m2/s). The Np of each surge is much less than 1, indicating that excess pore pressure, if present, will persist much longer than the time required for the flow to move along the channel. This shows that the excess pore water pressure always exists in the process of debris flow movement, and its value must have an impact on the dynamic characteristics of debris flow.
The factors affecting the velocity of debris flow are complex and diverse, and we will not discuss it in detail here. We are more concerned about whether this reverse graded bedding structure contributes to the flow acceleration. As changes in grain composition and the presence of grain separation can affect intergranular friction and pore distribution, the pore water pressure is inevitably affected by the overlying coarse-grained layer; and this must impose on the movement of flow.
In order to explore the feedback effect of the above two grain configurations on pore water pressure, on-site sampling of the three surges (N04, N11, and N12) was carried out. Firstly, the coarse-grained layer samples were collected, and then a certain amount of the corresponding underlying flow mass were sampled; finally, all the samples were sealed and stored in plastic bags and brought back to the laboratory. Part of the sample was dried in an oven and subjected to a sieving test. The fraction of material less than 0.25 mm was measured using a MS2000 Laser Particle Size Analyzer.
Finally, the grain size distribution (GSD) curves of the test samples were obtained (as shown in Figure 4). It can be seen that the GSD curves of the overlying coarse-grained layer are above the underlying layer samples, indicating that the upper layer contains more coarse grains. In addition, the general formula of GSD, P(D) = CD–μexp(−D/Dc), is used, which derives the GSD parameters (μ, Dc) (Li et al., 2013). The parameter μ reflects the change of fine grains. Dc reflects the range of grain composition, the larger the value is, the larger the range of grain size variation is, and the more the content of coarse grains is. It is found that the Dc of the overlying layer is larger than that of the underlying layer, which also indicates that the overlying layer contains more coarse grains than the underlying layer.
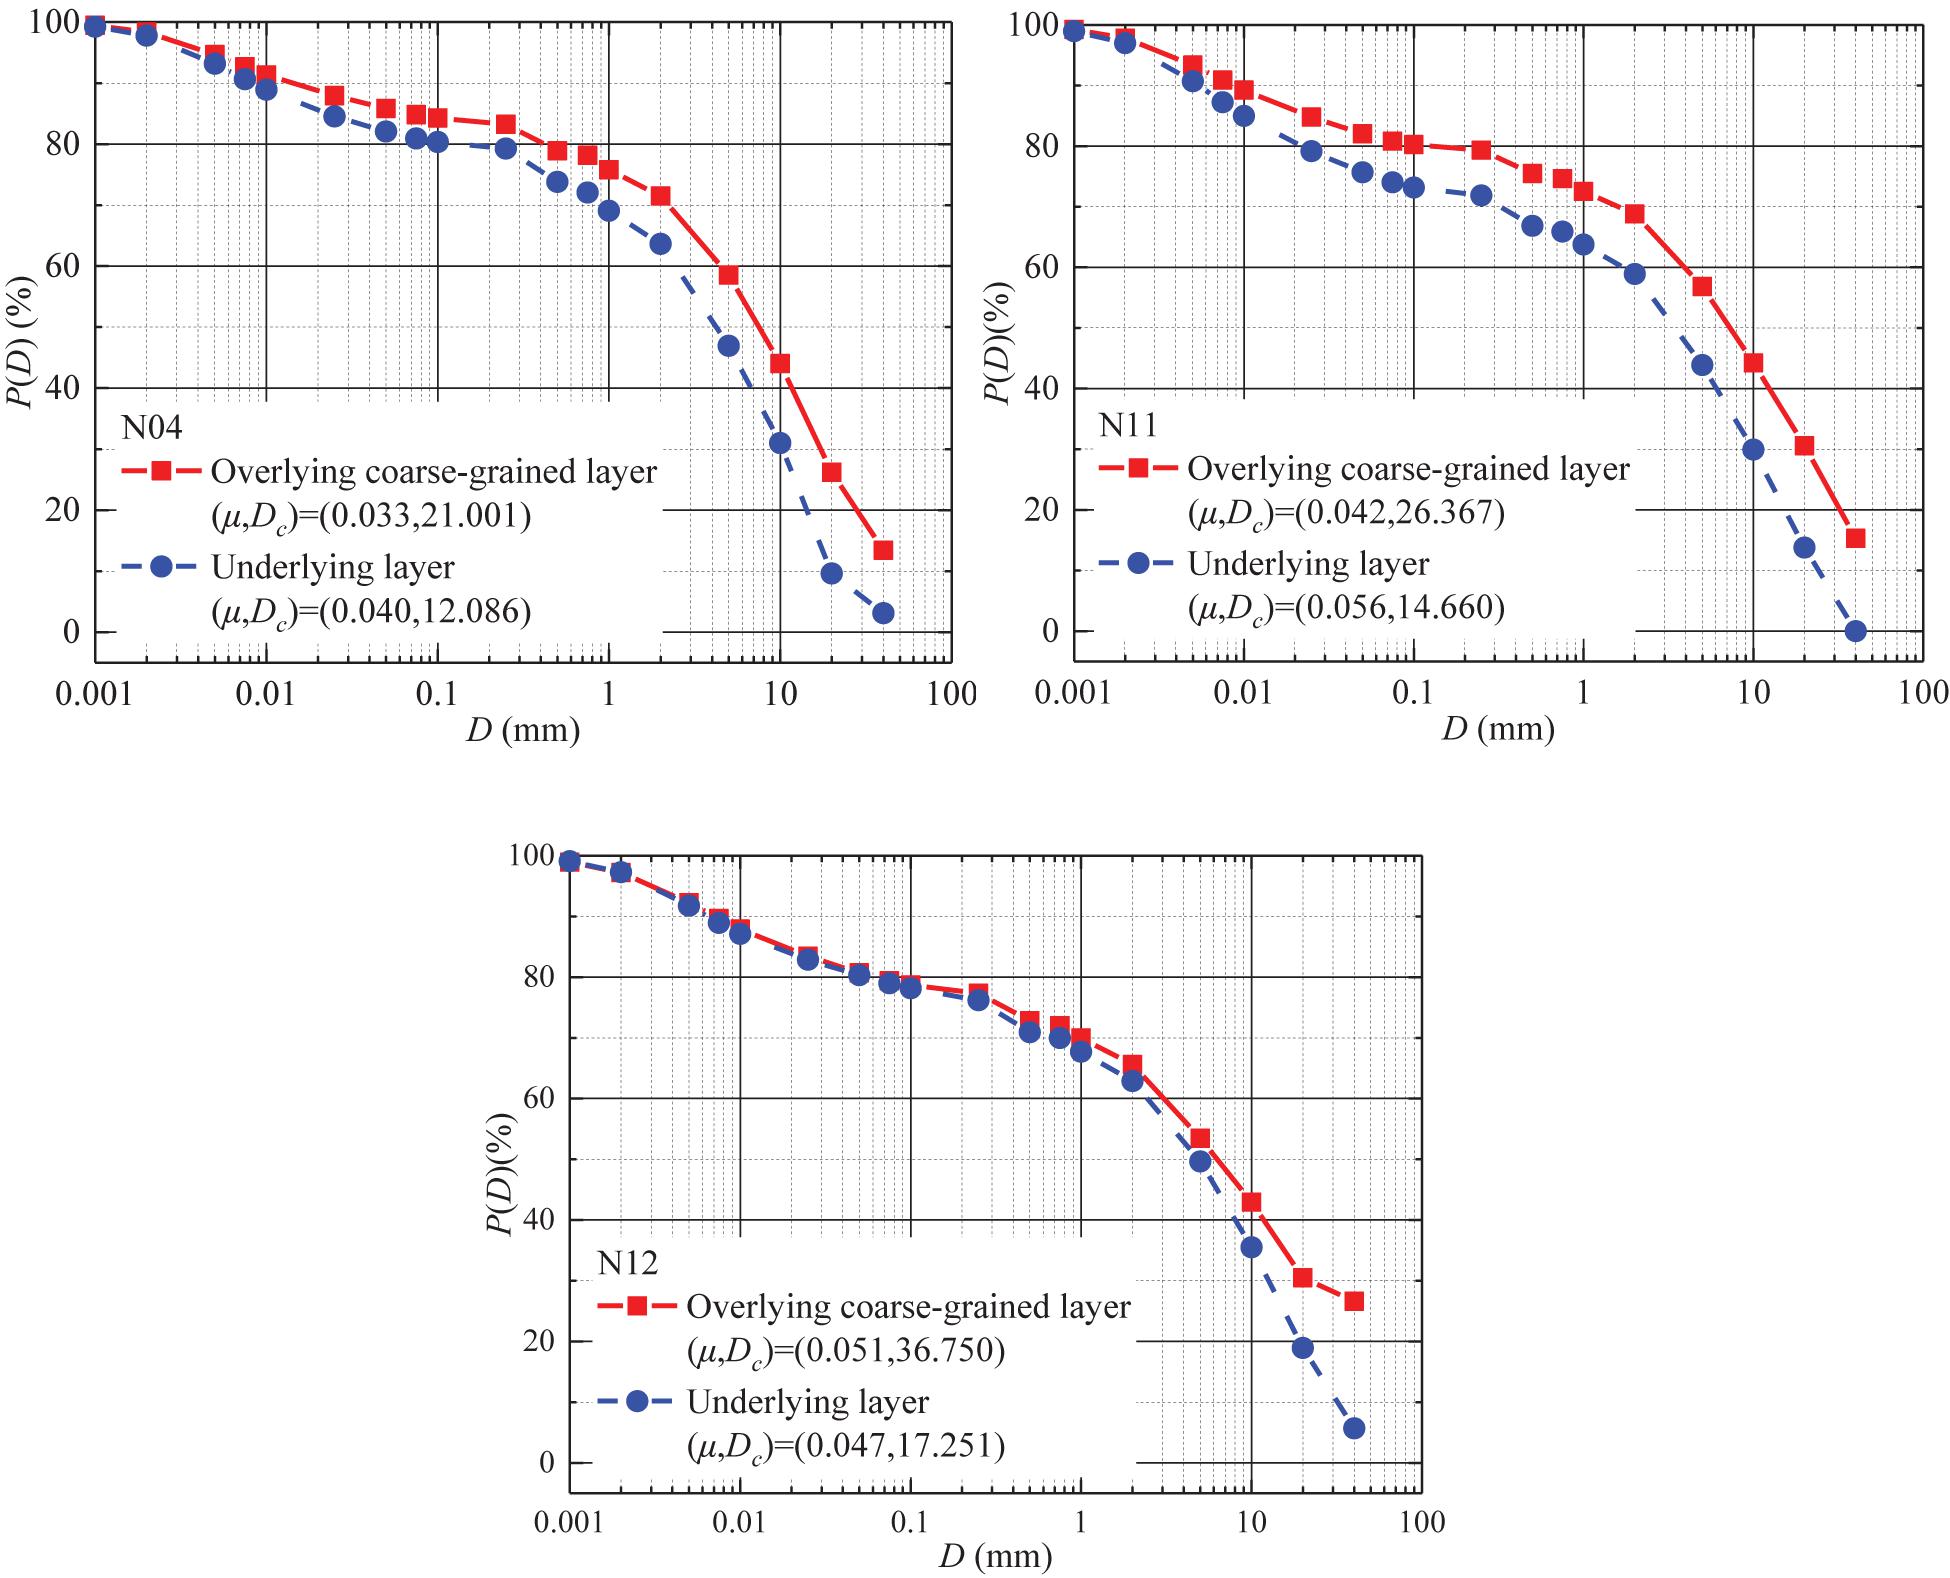
Figure 4. Grain size distribution curves of overlying coarse-grained layer and underlying fluid in surges.
In addition, a certain amount of deposition samples were taken back to the laboratory in the main gully, different grain groups were separated in the laboratory, and different grain configurations were simulated in the laboratory in order to compare with the natural debris flow samples.
Debris flow does not always show uniform and mixed grain configurations, and different configurations will be formed because of grain separation under different dynamic conditions. In order to explore the effect of configuration on excess pore water pressure, a series of experiments testing static relative excess pore water pressure were carried out. The experiment equipment consists of a cylindrical container, a piezometer and an appropriate amount of gauze. The piezometer is a transparent plastic tube with a diameter of 5 mm and a tube thickness of 1 mm, and a millimeter scale line is engraved on the outer wall of the tube (see Figure 5). The test was carried out in a cylindrical container with a diameter of 300 mm and a height of 300 mm. The container was used to store the slurry of a certain density and a certain upper limit grain size. During the test, the piezometer was inserted into the prepared slurry sample, and its end inserted into the sample was wrapped with gauze to prevent the grains from entering the tube and blocking the tube hole to affect the pore water circulation.
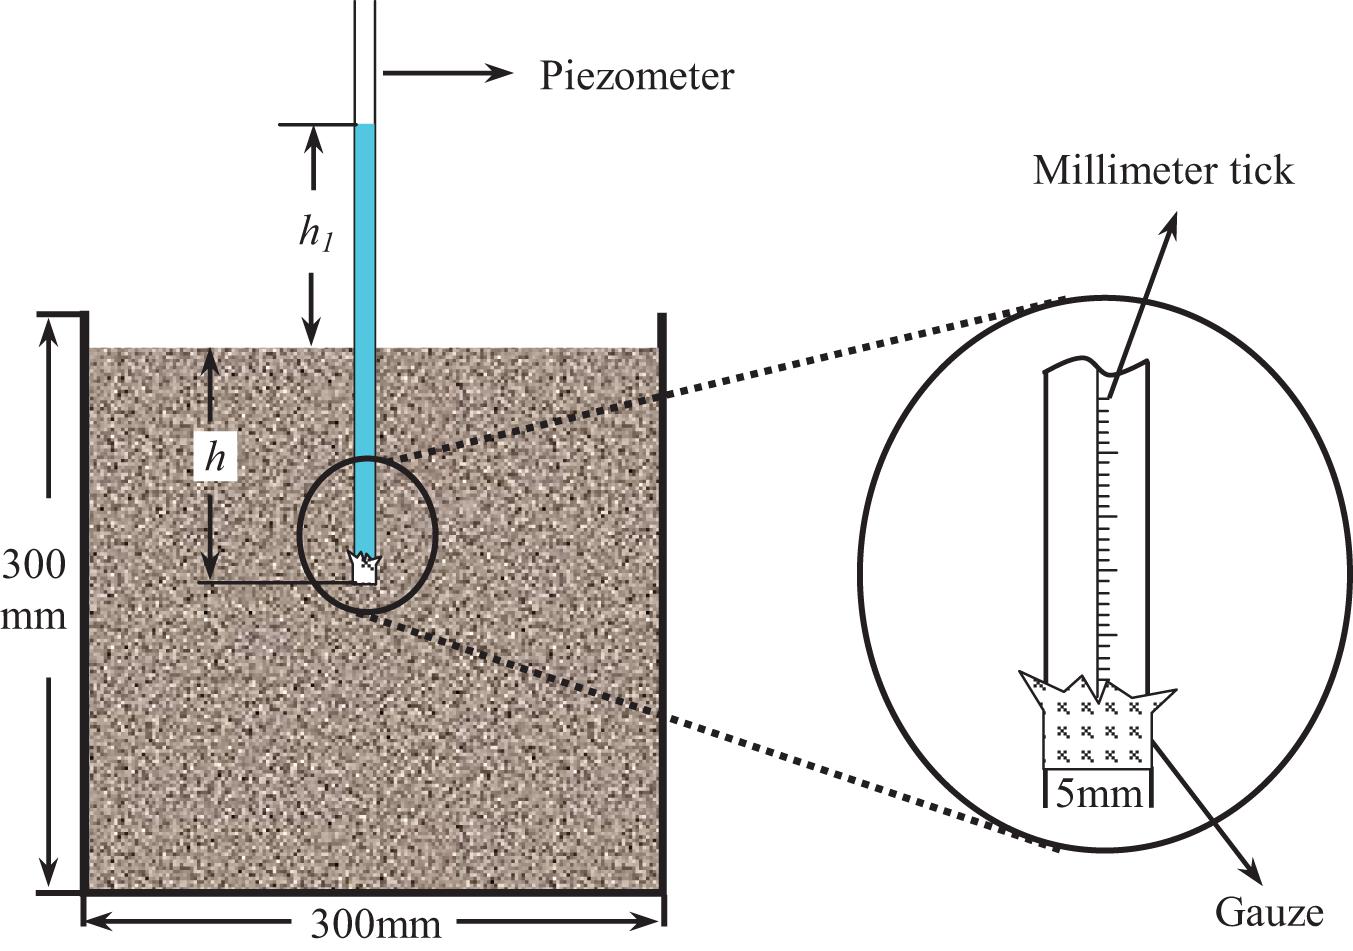
Figure 5. Schematic diagram of experimental device.
The pore pressure (U) in flow mass is the sum of hydrostatic pore pressure (U0) and excess pore pressure (Up) (Hampton, 1979):
The relative excess pore pressure Ur is (Pierson, 1981):
where h1 is the hydraulic head in the piezometer above the flow surface, h is the depth of the piezometer below the surface, Cv is the solid volumetric concentration, and ρr and ρ0 refer to the densities of solid grains and water, respectively. The Ur value reflects the development and dissipation of excess pore water pressure, and the maximum Ur value (Urmax) reflects the maximum pore water pressure at the corresponding time. The process before the maximum Ur value cannot be seen as a reflection of the true excess pore water pressure, but rather a normal growth process before the real excess pore water pressure is reached. When Urmax is reached, the change in Ur can truly reflect the change in the size of the internal excess pore water pressure. The total test time for each sample is 450 min. The height of the water column in the piezometer is recorded once every minute from 0 to 60 min, every 2 min from 60 to 90 min, and every 5 min from 90 to 450 min.
The three methods of processing the sample shown in Figure 6 are explained as follows:
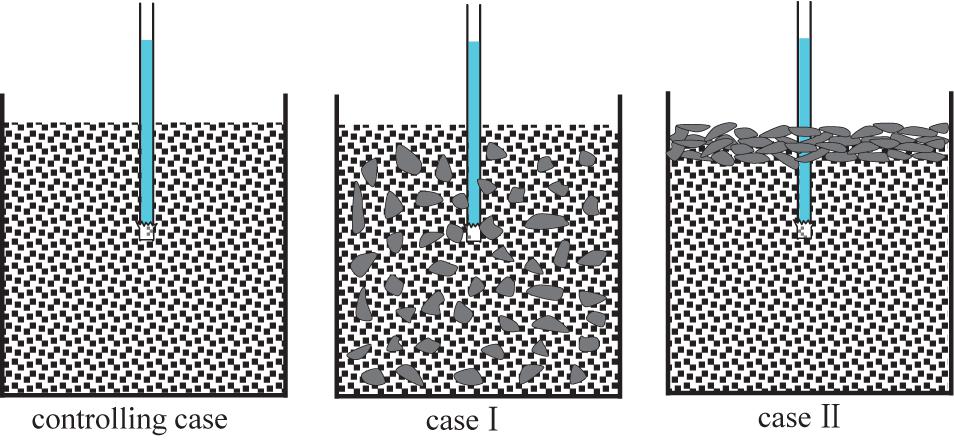
Figure 6. Test operation mode.
(1) Direct determination of the mixture of the underlying layer with finer grains, taken as the controlling case;
(2) 2,000 g coarser grains are mixed into the underlying layer mixture, which is referred as case I.
(3) The coarser grains of 2,000 g are evenly laid on the surface of the mixture in the underlying layer, which is referred as case II.
The Ur test was carried out on the three natural debris flow samples obtained in the tributary after the operations shown in Figure 6. According to the above three cases, the information of the three test groups is shown in Table 2.
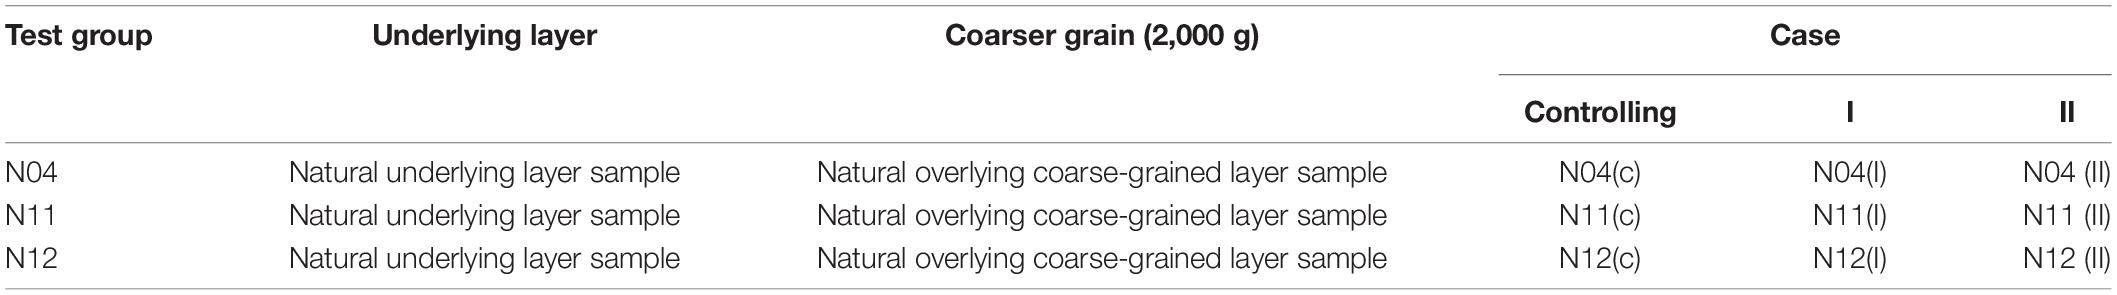
Table 2. Test group information of natural debris flow samples.
After testing the natural samples, the comparing tests were carried out using debris flow deposits in the main channel of JJG. There are five groups of separated coarser grains, which are 1–2, 2–5, 5–10, 10–20, and 20–40 mm, respectively. The separated grain groups are dried in an oven, and then the slurry is prepared for samples below 1 mm, below 2 mm, below 5 mm, below 10 mm, and below 20 mm, and the prepared slurry density is 1.95 g/cm3. The height of the mixture slurry in the container was maintained at 260 mm. The test was divided into five groups (Test 1-Test 5), and each set of test samples was carried out according to the operation shown in Figure 6, and different grain groups were added to the corresponding slurry and numbered (see Table 3). At the time of the test, the relative excess pore water pressure test was first performed on the prepared slurry samples (A1–E1) with a density of 1.95 g/cm3 in accordance with the operation shown in controlling case. Then, as shown in case I, 2,000 g of separated grains of different grain groups were respectively added to the corresponding slurry and stirred uniformly to carry out the test. Finally, as shown in case II, 2,000 g of separated grains of the five grain groups were respectively dispersed on the surface of A1–E1 slurry sample, and then the height of the water column was observed. Figure 6 represent three different sample treatment methods.
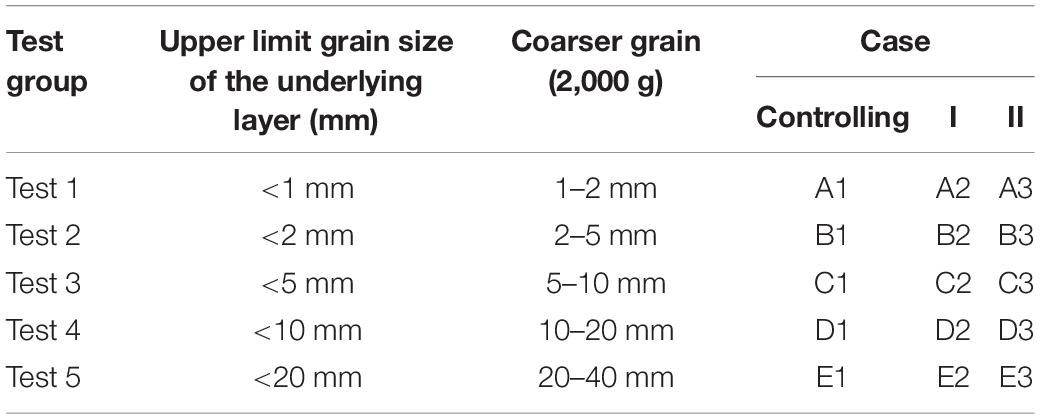
Table 3. Test group information of deposition samples.
The results of Ur test on the samples taken from the active debris flow in the tributary are shown in Figure 7. It is evident that the Ur has undergone a similar change process.
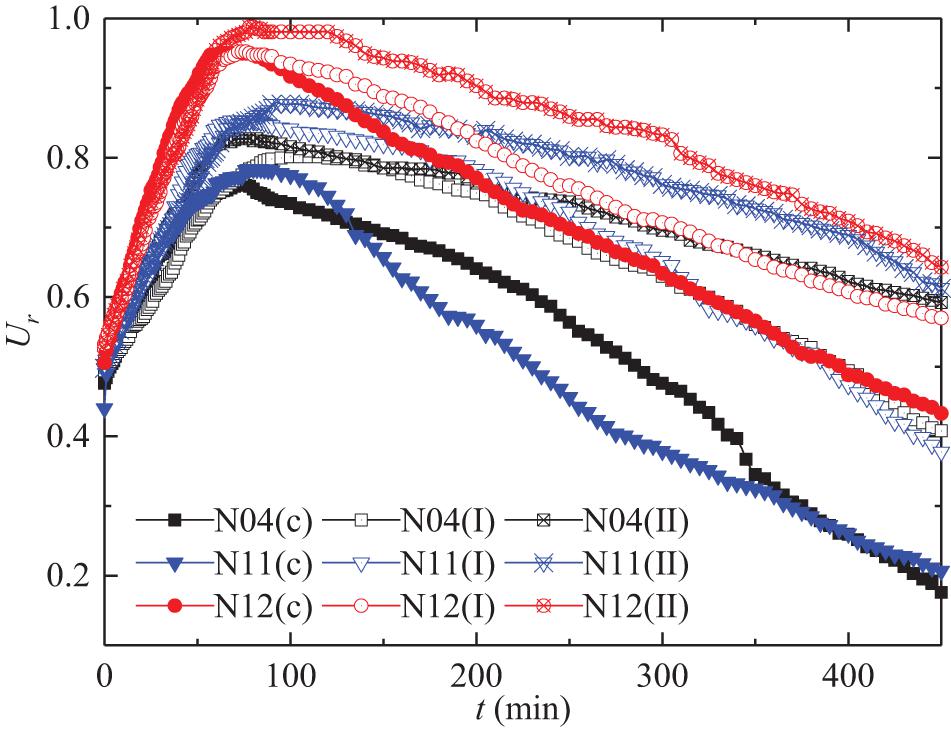
Figure 7. Temporal variation of relative excess pore pressure (Ur).
When Ur reaches the peak value Urmax in roughly liner way at about 80s, it turns to decrease with time (t) in a power law:
The fitting coefficient m and power exponent n are shown in Table 4:
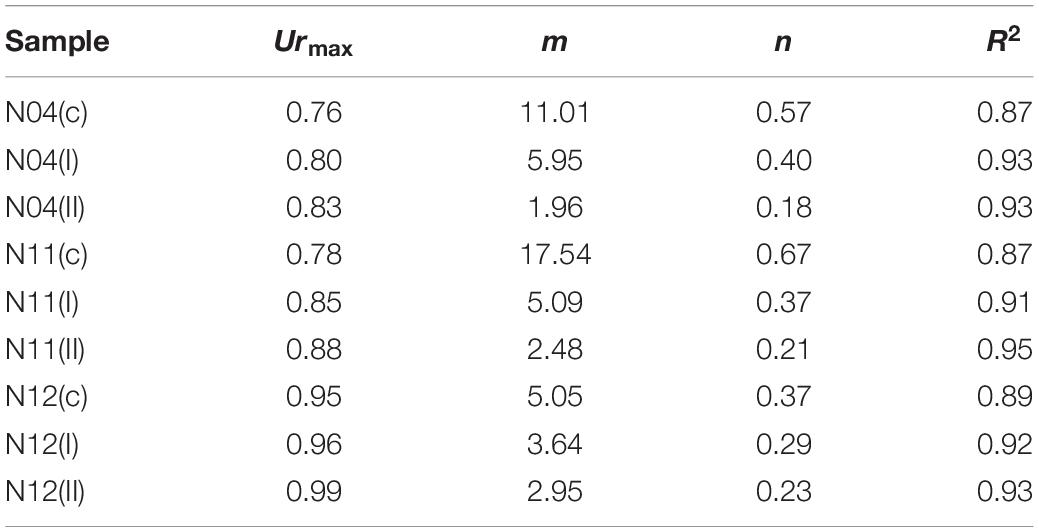
Table 4. Urmax and decaying index of Ur.
The power exponent n reflects the degree of dissipation of Ur, which is a decay index, that is, the higher the value of n, the faster it dissipates. According to the analysis of the same group of samples, it is found that n is closely related to Urmax, and the functional relationship is as follows:
The variation range of fitting parameter α is 0.18–2.90 and β is 0.86–1.05. Among them, the parameters α and β reach the maximum in case II.
Comparing various Urmax indicates that, if the grains from overlying coarse-grained layer are uniformly stirred in the underlying layer samples, the excess pore water pressure will increase, but the increase is not as high as that of the overlying coarser grains dispersed on the sample surface. In the case of overlying coarser grains uniformly dispersed inside the slurry, the Urmax increases by 3.10, 6.53, and 6.04%, respectively; while in the case of overlying coarser grains uniformly dispersed on the surface, the Urmax increases by 24.96, 18.82, and 19.37%, respectively. These results indicate that the presence of such an overlying coarse-grained layer has a positive effect on promoting the excess pore water pressure.
When the debris flow at low velocity does not have obvious erosion and entrainment in the gentle channel, and some coarser grains are collected on the surface, the overlying coarse-grained layer produces a layered concentrated load, which is prone to generate high excess pore water pressure and highly concentrated sliding force. Under certain initial velocity conditions, the high-density, wide-gradation, and coarse-grain separation characteristics of debris flows will have acceleration / deceleration effects on it through changes in excess pore water pressure.
After the tests of deposition samples, a series of relative excess pore water pressure tests were carried out, and the relative excess Ur changes of the respective samples are shown in Figure 8. It is found that the same amount of coarser grains can cause different excess pore water pressure responses due to different grain configurations. When a certain amount of coarser grains is added to the corresponding slurry sample with a density of 1.95 g/cm3 as operation case I, and the mixture is uniformly stirred, the measured Urmax is increased to some extent. When a certain amount of coarser grains are dispersed on the surface as case II, the Urmax value is also improved, but the increase is significantly higher than that of the sample treated as operation case I. Similarly, when the Ur reaches the peak, it decays in the same way as the case of flow tests (Eq. 4). The fitting parameters, Urmax and the maximum upper limit grain size Dmax of each sample are shown in Table 5.
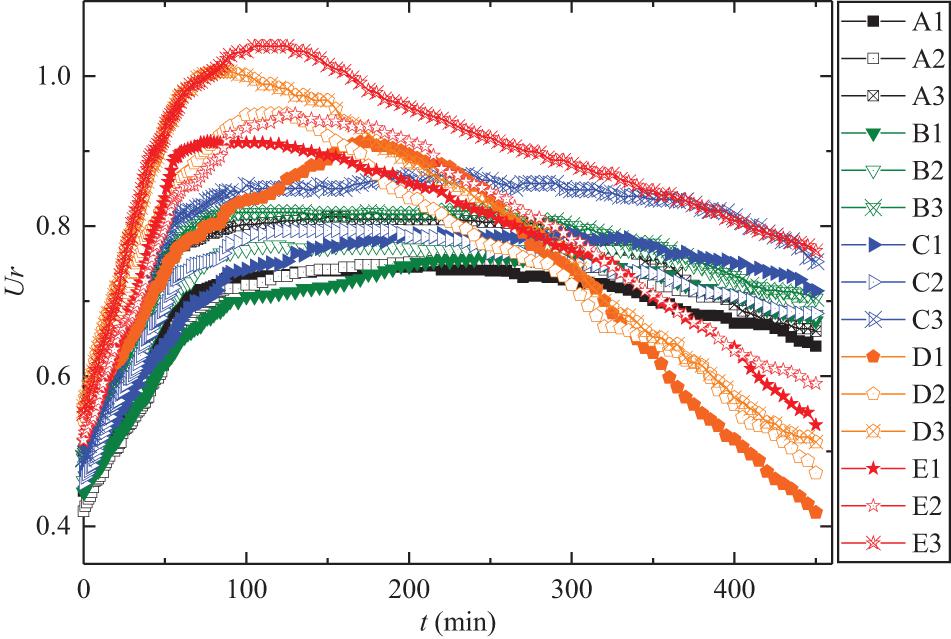
Figure 8. Curves for changes in relative excess pore water pressure.
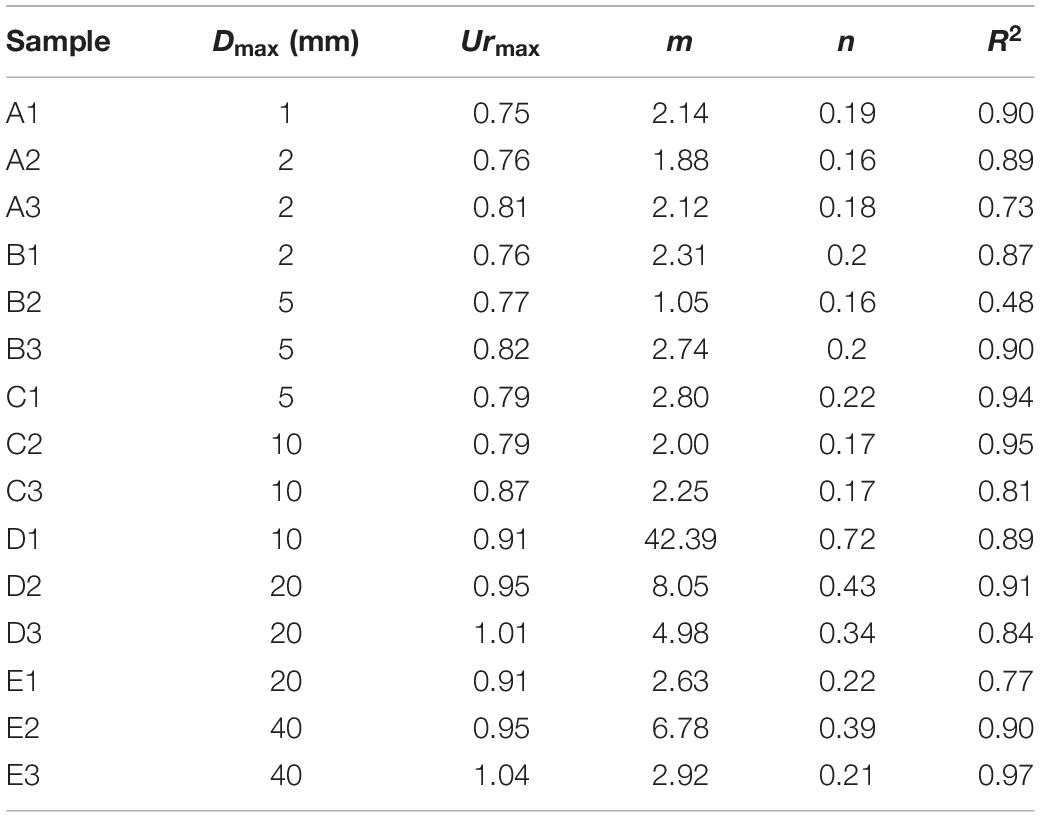
Table 5. Urmax, Dmax, and decaying index of Ur.
Figure 8 shows that the curves of Test 1–Test 5 are gradually shifted upward, which also shows that the increase of coarser grains can elevate the excess pore water pressure. Based on the test results of each operation mode, it is found that there is a positive correlation between Urmax and the maximum grain size (Dmax), that is, the Urmax increases with the increase of coarser grain size, and the two are in a sublinear relationship (see Figure 9):
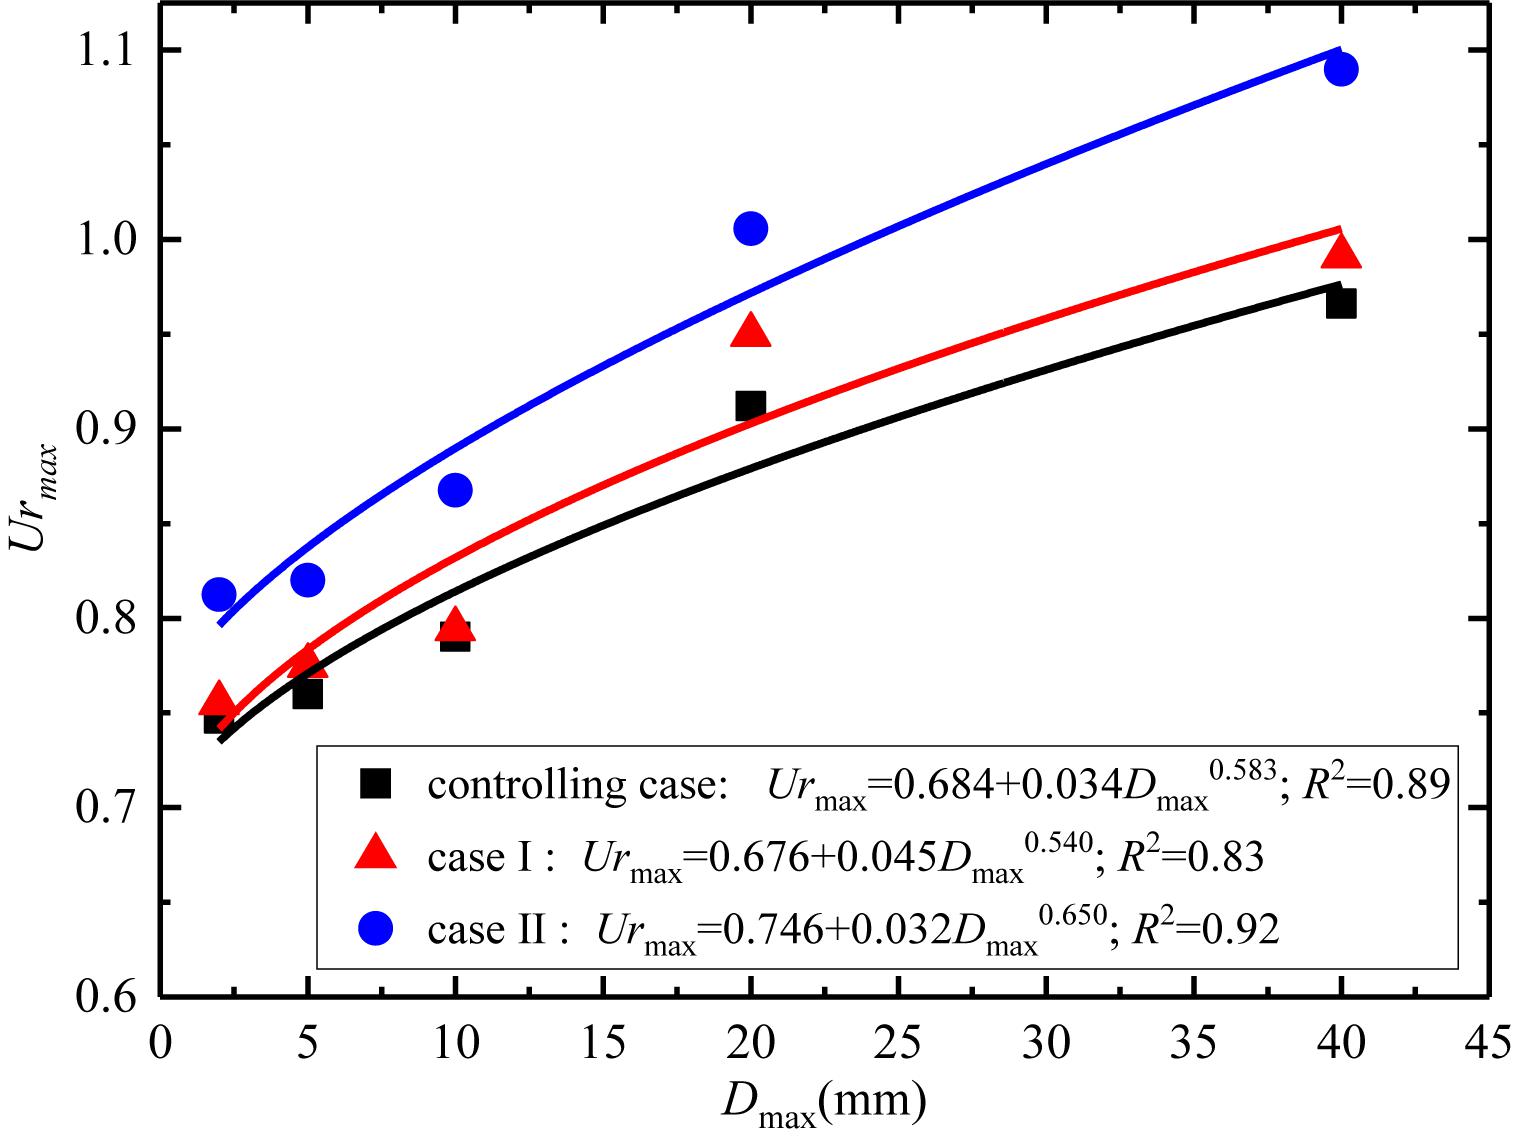
Figure 9. Relationship between Urmax and Dmax under different operation modes.
and R2 is greater than 0.80. The range of fitting parameter a is 0.684–0.746, and b is 0.034–0.045. The power exponent c is the largest in operation case II, which is 0.650, while that in controlling case and case I is the smallest, both of which are close to each other, with an average of 0.56.
The reason for the close relationship between Urmax and Dmax in the controlling case and case I is that the sample grains treated by operation are uniformly mixed. After the operation case II was performed on the sample, the Urmax values increased by 1.11, 1.98, 0.52, 4.14, and 2.60%, respectively, compared to the samples of the controlling case. And after the case II, the Urmax values increased by 8.76, 7.93, 9.79, 10.28, and 12.80%, respectively. That is to say, the influence of the increase of coarser grains on excess pore water pressure is not only affected by the grain content, but also by the configuration of coarser grains in the mixture. In addition, under the same density of the experimental slurry, the relative excess pore water pressure is found to rise with the increase of upper limit grain size (e.g., from 1 to 20 mm). This indicates that the wide gradation is positive for the increase of excess pore water pressure. The power exponent n from Test 1 to Test 3 changes little, showing similar characteristics, mainly because the grains of the samples are very fine, and the dissipation rate of pore water pressure is relatively close. However, the variation characteristics of n in Test 4 and Test 5 are generally consistent with those of natural debris flow samples, that is, the samples treated in case II have a smaller dissipation rate.
In addition, comparing between Tables 4, 5 shows that the n value obtained by deposition is generally small; this is mainly because that the deposition sample is artificial, and the simulated underlying layer is a mixture made of grains below a certain grain size, and the grains are fine (except Test 4 and Test 5), which is not the actual underlying layer with a wide range of grain size. This experiment also shows that when the content of fine grains is large, the pore water pressure dissipates slowly, corresponding to a small n value.
The experiments indicate that the overlying coarse-grained layer facilitates the generation of high excess pore pressure in high-density debris flows, where the pressure can’t dissipate readily and the grains in the underlying layer shows a semi-fluid property, which helps promote the overall migration of grains and reduce the placement and deposition of debris along the flow track (Guthrie et al., 2010).
It has been widely recognized that fine grains can increase debris-flow mobility through a “ball-bearing-like effect” (Hsü, 1975; Iverson, 1997; Brewster, 2004; Roche et al., 2005; Phillips et al., 2006; Iverson et al., 2010; Roche, 2012), and our experiments reveal the acceleration effect due to coarse grains. A critical point here is the persistence of high excess pore water pressure. Considering the effective stress principle of Terzaghi (Terzaghi, 1943; Kaitna et al., 2016), the development of pore fluid pressure plays a key role in the mobility of debris flow (Iverson, 1997). Only when there is a large positive pore pressure in the bottom sediment, the erosion and entrainment of debris flow will be accompanied by the increase of flow momentum and velocity (Iverson et al., 2011).
We find that the overlying coarse-grained layer results in the redistribution of excess pore water pressure through the loading pattern and hence affects the fluid shear strength, and enhances the mobility of flow. There exists a dynamic mutual feedback mechanism between the overlying coarse-grained layer and the movement. When this kind of grain configuration is formed in the process of debris flow movement, the bottom bed fluid produces higher excess pore water pressure, and there are more fine grains in the lower part of the whole fluid than in the upper part, which is beneficial for the fluid to develop an increasingly well retained excess pore pressures (De Haas et al., 2015). The ability to maintain high excess pore water pressure depends on the GSD (Pierson, 1980, 1981). The existence of abundant and poorly sorted coarse grains is also important because it provides a more compact grain framework in which the pore fluid is more easily trapped and can bear part of the load and reduce the friction between grains. However, too many coarse grains mean an increase in internal friction, which will weaken the advantage of the increased excess pore water pressure, and the flow will be “frozen” (Pierson, 1981; Godt and Coe, 2007). The upward movement of some coarse grains from the bottom and the formation of a coarse-grained layer on the surface will not strongly change the GSD of the lower fluid, and there are still abundant coarse grains with poor sorting in the lower part. On the contrary, it will delay the decay of grain collision stress and reduce grain contact friction, and greatly delay the accumulation of debris flow (Lowe, 1976; Major, 2000).
The entrainment of coarse grains and the accumulation of coarse grains on the surface can significantly exceed the excess pore water pressure and contribute to the mobility, which can be regarded as the acceleration stage of debris flow. When the movement slows down, the coarse grains do not increase significantly and there is no overlying phenomenon of coarse grains, the excess pore water pressure dissipates gradually, corresponding to the deceleration stage of debris flow, the schematic diagram of this process is shown in Figure 10. The acceleration phase in this process is different from the potential energy acceleration phase, which is a “tortuous” rising process (Figure 10), and is the result of reducing the effective stress on the sliding surface caused by excess pore water pressure (Gabet and Mudd, 2006). The shaded part of Figure 10 indicates a rapid increase in excess pore water pressure, which is often due to the increase of coarse grains eroded and entrained along the way, or the development of overlying coarse-grained layer configuration. Increased pore water pressure reduces substrate friction and leads to an increase in velocity, mass and momentum (Iverson et al., 2011). In addition, the separation of coarse grains reduces the solid volume concentration of the lower fluid and increases the content of fine grains, which are beneficial to reduce the yield stress (Coussot and Proust, 1996; Pellegrino and Schippa, 2018). After the excess pore water pressure has experienced rapid growth and reached a certain level, the debris flow enters the process of dissipating the excess pore water pressure until the next condition that can cause the generation of the excess pore water pressure. After the debris flow enters the gentle slope deceleration phase, it can be considered that the content of coarser grains has not changed and the potential energy acceleration effect has weakened. At this time, the key to whether the debris flow can continue to flow is to see whether the conditions for generating and maintaining high excess pore water pressure are available at this time, and the coarser grains concentrating on the surface is a favorable condition for the generation and development of excess pore water pressure, which delays the deposition of debris flow on the gentle slope (Pierson, 1980, 1981), and promotes it to maintain high mobility and burst out of the tributary into the main gully.
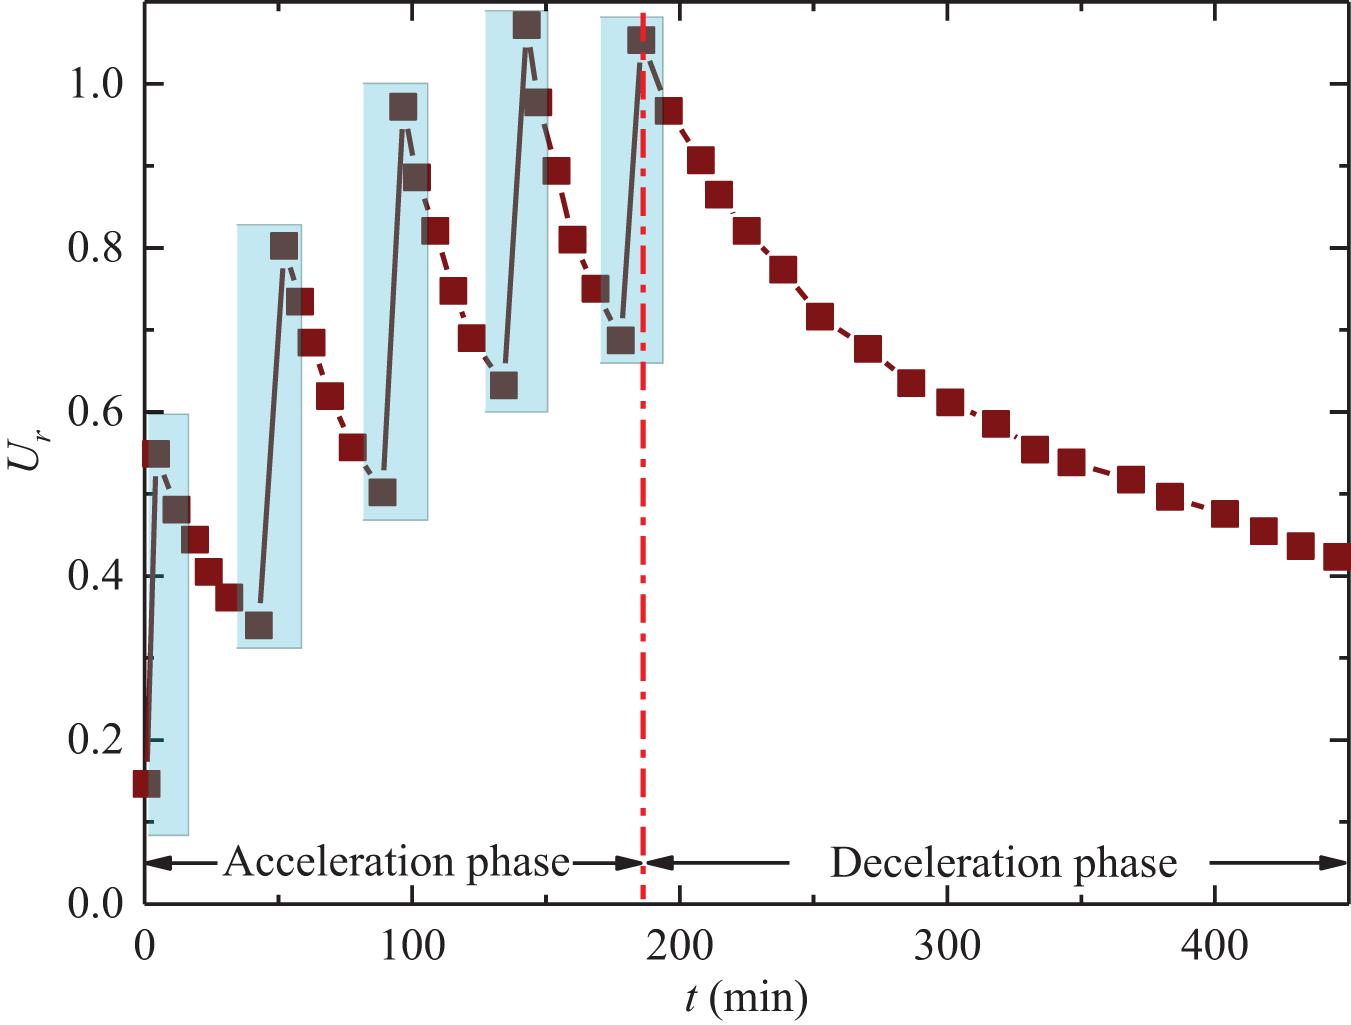
Figure 10. Schematic diagram of relative excess pore pressure change under grain disturbance.
Therefore, it is necessary to carry out in-depth research on the formation conditions, mechanisms and effects of non-uniform grain organization patterns that can cause high excess pore water pressure in debris flows.
Under different conditions, the grain configuration has a great influence on the properties of debris flows. Excess pore pressure distributions will occur when the grains are in segregation or non-homogeneous; and high excess pore pressure is more likely to occur in flow with overlying coarse-grained layer, which has a positive effect on the debris-flow mobility. Even for debris flows with the same or similar grain composition, different grain configurations will cause significant differences in the level of pore water pressure. There exists a mutual feedback mechanism between the debris-flow movement and the overlying coarse-grained layer.
The debris-flow movement gives rise to grain segregation, facilitating the formation of overlying coarse-grained layer; and in turn, the overlying coarse-grained layer promotes debris-flow movement by affecting the fluid properties in the specific region.
The raw data supporting the conclusions of this article will be made available by the authors, without undue reservation.
TY produced the figures and wrote the manuscript. YL was responsible for the main idea of the manuscript and contributed to the manuscript revision. DL, XG, JZ, and YJ provided input to figure and text editing. All the authors contributed to the article and approved the submitted version.
This study was supported by the Major Program of National Natural Science Foundation of China (grant no. 41790432), the Strategic Priority Research Program of the Chinese Academy of Sciences (grant no. XDA23090202), and the Key International S and T Cooperation Project (grant no. 2016YFE0122400).
DL was employed by the company Sichuan Highway Planning, Survey, Design and Research Institute Ltd.
The remaining authors declare that the research was conducted in the absence of any commercial or financial relationships that could be construed as a potential conflict of interest.
Bagnold, R. A. (1954). Experiments on gravity-free dispersion of large solid spheres in a newtonian fluid under shear. Proc. R. Soc. Lond. A Math. Phys. Sci. 225, 49–63. doi: 10.1098/rspa.1954.0186
Brewster, R. (2004). On dense granular flows. Eur. Phys. J. E Soft Matter 14, 341–365. doi: 10.1140/epje/i2003-10153-0
Chen, X. Z., and Cui, Y. (2017). The formation of the Wulipo landslide and the resulting debris flow in Dujiangyan City, China. J. Mt. Sci. 14, 1100–1112. doi: 10.1007/s11629-017-4392-1
Coussot, P., and Meunier, M. (1996). Recognition, classification and mechanical description of debris flows. Earth Sci. Rev. 40, 209–227. doi: 10.1016/0012-8252(95)00065-8
Coussot, P., and Proust, S. (1996). Slow, unconfined spreading of a mudflow. J. Geophys. Res. Solid Earth 101, 25217–25229. doi: 10.1029/96JB02486
Cui, Y., Zhou, X. J., and Guo, C. X. (2017). Experimental study on the moving characteristics of fine grains in wide grading unconsolidated soil under heavy rainfall. J. Mt. Sci. 14, 417–431. doi: 10.1007/s11629-016-4303-x
Cui, Z. J., Wu, Y. Q., and Xie, Y. Y. (1993). Study of sedimentary character of debris-flow at Lengshuigou outlet, Duanjiahe basin, Nanning-Kunming railway (in Chinese). Chin. J. Geol. Hazard Control 2, 52–62.
De Haas, T., Braat, L., Leuven, J. R. F. W., Lokhorst, I. R., and Kleinhans, M. G. (2015). Effects of debris flow composition on runout, depositional mechanisms, and deposit morphology in laboratory experiments. J. Geophys. Res.-Earth Surf. 120, 1949–1972. doi: 10.1002/2015jf003525
Deng, Y. X. (1995). Process of accumulation and characteristics of glacial debris flow deposits trangformed by moraine. Acta Sedimentol. Sin. 13, 37–48.
Enos, P. (1977). Flow regimes in debris flow. Sedimentology 24, 133–142. doi: 10.1111/j.1365-3091.1977.tb00123.x
Fan, Y. (2010). Analysis of conceptual two-phase resistance for accumulation state of debris flow. J. Eng. Geol. 18, 100–104. doi: 10.1631/jzus.A1000244
Gabet, E. J., and Mudd, S. M. (2006). The mobilization of debris flows from shallow landslides. Geomorphology 74, 207–218. doi: 10.1016/j.geomorph.2005.08.013
Godt, J. W., and Coe, J. A. (2007). Alpine debris flows triggered by a 28 july 1999 thunderstorm in the central front range, colorado. Geomorphology 84, 80–97. doi: 10.1016/j.geomorph.2006.07.009
Guthrie, R. H., Hockin, A., Colquhoun, L., Nagy, T., Evans, S. G., and Ayles, C. (2010). An examination of controls on debris flow mobility: evidence from coastal British Columbia. Geomorhology 114, 601–613. doi: 10.1016/j.geomorph.2009.09.021
Hampton, M. A. (1979). Buoyancy in debris flows. J. Sediment. Res. 49, 753–758. doi: 10.1306/212F7838-2B24-11D7-8648000102C1865D
Hsü, K. J. (1975). Catastrophic debris streams (Sturzstroms) generated by rockfalls. Geol. Soc. Am. Bull. 86, 129–140. doi: 10.1130/0016-7606197586<129:CDSSGB<2.0.CO;2
Iverson, R. M. (1997). The physics of debris flows. Rev. Geophys. 35, 245–296. doi: 10.1029/97RG00426
Iverson, R. M. (2015). Scaling and design of landslide and debris-flow experiments. Geomorphology 244, 9–20. doi: 10.1016/j.geomorph.2015.02.033
Iverson, R. M., and Denlinger, R. P. (2001). Flow of variably fluidized granular masses across three-dimensional terrain: 1. Coulomb mixture theory. J. Geophys. Res. Solid Earth 106, 537–552. doi: 10.1029/2000JB900329
Iverson, R. M., Logan, M., Lahusen, R. G., and Berti, M. (2010). The perfect debris flow? Aggregated results from 28 large-scale experiments. J. Geophys. Res. Earth Surf. 115:F03005. doi: 10.1029/2009JF001514
Iverson, R. M., Reid, M. E., Logan, M., Lahusen, R. G., Godt, J. W., and Griswold, J. P. (2011). Positive feedback and momentum growth during debris-flow entrainment of wet bed sediment. Nat. Geosci. 4, 116–121. doi: 10.1038/ngeo1040
Iverson, R. M., and Vallance, J. W. (2001). New views of granular mass flows. Geology 29, 115–118. doi: 10.1130/0091-761320010292.0.CO;2
Kaitna, R., Palucis, M. C., Yohannes, B., Hill, K. M., and Dietrich, W. E. (2016). Effects of coarse grain size distribution and fine particle content on pore fluid pressure and shear behavior in experimental debris flows. J. Geophys. Res. Earth Surf. 121, 415–441. doi: 10.1002/2015jf003725
Kaitna, R., Rickenmann, D., and Schatzmann, M. J. A. G. (2007). Experimental study on rheologic behaviour of debris flow material. Acta Geotech. 2, 71–85. doi: 10.1007/s11440-007-0026-z
Li, Y., Gou, W. C., Wang, B. L., and Liu, D. C. (2016). Grain composition and the fluctuation of debris flow motion. Mt. Res. 34, 468–475. doi: 10.16089/j.cnki.1008-2786.000152
Li, Y., Liu, J. J., Su, F. H., Xie, J., and Wang, B. L. (2015). Relationship between grain composition and debris flow characteristics: a case study of the Jiangjia Gully in China. Landslides 12, 19–28. doi: 10.1007/s10346-014-0475-z
Li, Y., Zhou, X. J., Su, P. C., Kong, Y. D., and Liu, J. J. (2013). A scaling distribution for grain composition of debris flow. Geomorphology 192, 30–42. doi: 10.1016/j.geomorph.2013.03.015
Lowe, D. (1976). Grain flow and grain flow deposits. J. Sediment. Res. 46, 188–199. doi: 10.1306/212F6EF1-2B24-11D7-8648000102C1865D
Luo, Y. H. (2003). Analysis for process of debris flow deposition (in Chinese). Earth Sci. J. China Univ. Geosci. 28, 533–536.
Major, J. J. (1995). Experimental Studies of Deposition at a Debris-Flow Flume. Reston, VA: U.S. Geological Survey. Open-File Report. 028-94.
Major, J. J. (2000). Gravity-driven consolidation of granular slurries: implications for debris-flow deposition and deposit characteristics. J. Sediment. Res. 70, 64–83. doi: 10.1306/2DC408FF-0E47-11D7-8643000102C1865D
Middleton, G. V. (1970). “Experimental studies related to problems of flysch sedimentation,” in Flysch Sedimentology in North America, ed. J. Lajoie (Toronto: Toronto Business and Economic Service Ltd), 253–272.
Ni, J. R., and Qu, Y. Z. (2003). Modeling of vertical segregation of solid particles in sediment-laden flow (in Chinese). J. Hydrodynam. 18, 349–354.
Pellegrino, A. M., and Schippa, L. J. E. E. S. (2018). A laboratory experience on the effect of grains concentration and coarse sediment on the rheology of natural debris-flows. Environ. Earth Sci. 77:749. doi: 10.1007/s12665-018-7934-0
Phillips, J. C., Hogg, A. J., Kerswell, R. R., and Thomas, N. H. (2006). Enhanced mobility of granular mixtures of fine and coarse particles. Earth Planet. Sci. Lett. 246, 466–480. doi: 10.1016/j.epsl.2006.04.007
Pierson, T. C. (1980). Erosion and deposition by debris flows at mt thomas, north canterbury, new zealand. Earth Surf. Process. 5, 227–247. doi: 10.1002/esp.3760050302
Pierson, T. C. (1981). Dominant particle support mechanisms in debris flows at mt thomas, new zealand, and implications for flow mobility. Sedimentology 28, 49–60. doi: 10.1111/j.1365-3091.1981.tb01662.x
Roche, O. (2012). Depositional processes and gas pore pressure in pyroclastic flows: an experimental perspective. Bull. Volcanol. 74, 1807–1820. doi: 10.1007/s00445-012-0639-4
Roche, O., Gilbertson, M. A., Phillips, J. C., and Sparks, R. S. J. (2005). Inviscid behaviour of fines-rich pyroclastic flows inferred from experiments on gas-particle mixtures. Earth Planet. Sci. Lett. 240, 401–414. doi: 10.1016/j.epsl.2005.09.053
Savage, S., and Lun, C. (1988). Particle size segregation in inclined chute flow of dry cohesionless granular solids. J. Fluid Mech. 189, 311–335. doi: 10.1017/S002211208800103X
Shu, A. P., Yang, K., Li, F. H., and Pan, H. L. (2012). Characteristics of grain size and grain order distribution in the deposition processes for non-homogeneous debris flow. J. Hydraul. Eng. 43, 1322–1327. doi: 10.13243/j.cnki.slxb.2012.11.002
Takahashi, T. (2014). Debris Flow Mechanics, Prediction And Countermeasures. London: Taylor and Francis.
Vallance, J. W., and Savage, S. B. (2000). “Particle segregation in granular flows down chutes,” in IUTAM Symposium on Segregation in Granular Flows, eds A. D. Rosato and D. L. Blackmore (Dordrecht: Springer), 31–51. doi: 10.1007/978-94-015-9498-1_3
Wang, Y. Y., Tan, R. Z., Zhan, Q. D., and Tian, B. (2009). Gravel accumulation in deposits of viscous debris flows with hyper-concentration. J. Mt. Sci. 6, 88–95. doi: 10.1007/s11629-009-0120-9
Wang, Y. Y., Zhan, Q. D., and Yan, B. Y. (2014). Debris-Flow Rheology And Movement. Changsha: Hunan Science and Technology Press.
Keywords: debris flow, grain configuration, excess pore pressure, mobility, acceleration
Citation: Yang T, Liu D, Li Y, Guo X, Zhang J and Jiang Y (2021) Grain Configuration Effect on Pore Water Pressure in Debris Flow. Front. Earth Sci. 9:660634. doi: 10.3389/feart.2021.660634
Received: 04 February 2021; Accepted: 15 March 2021;
Published: 14 April 2021.
Edited by:
Tao Zhao, Brunel University London, United KingdomReviewed by:
Yifei Cui, Tsinghua University, ChinaCopyright © 2021 Yang, Liu, Li, Guo, Zhang and Jiang. This is an open-access article distributed under the terms of the Creative Commons Attribution License (CC BY). The use, distribution or reproduction in other forums is permitted, provided the original author(s) and the copyright owner(s) are credited and that the original publication in this journal is cited, in accordance with accepted academic practice. No use, distribution or reproduction is permitted which does not comply with these terms.
*Correspondence: Yong Li, eWxpZUBpbWRlLmFjLmNu
Disclaimer: All claims expressed in this article are solely those of the authors and do not necessarily represent those of their affiliated organizations, or those of the publisher, the editors and the reviewers. Any product that may be evaluated in this article or claim that may be made by its manufacturer is not guaranteed or endorsed by the publisher.
Research integrity at Frontiers
Learn more about the work of our research integrity team to safeguard the quality of each article we publish.