 Jiang Zhang1
 Qiuan Zhu1,2,3*
 Minshu Yuan1
 Xinwei Liu4
 Huai Chen4
 Changhui Peng1,5
 Meng Wang6
 Zhenan Yang7
 Lin Jiang1
 Pengxiang Zhao8*
- 1Center for Ecological Forecasting and Global Change, College of Forestry, Northwest A&F University, Yangling, China
- 2College of Hydrology and Water Resources, Hohai University, Nanjing, China
- 3National Earth System Science Data Center, National Science & Technology Infrastructure of China, Beijing, China
- 4Chengdu Institute of Biology, Chinese Academy of Sciences, Chengdu, China
- 5Department of Biology Sciences, Institute of Environment Sciences, University of Quebec at Montreal, Montreal, QC, Canada
- 6Key Laboratory of Geographical Processes and Ecological Security in Changbai Mountains, Ministry of Education, School of Geographical Sciences, Northeast Normal University, Changchun, China
- 7Key Laboratory of Southwest China Wildlife Resources Conservation (China West Normal University), Ministry of Education, Nanchong, China
- 8College of Forestry, Northwest A&F University, Yangling, China
A Corrigendum on
Extrapolation and Uncertainty Evaluation of Carbon Dioxide and Methane Emissions in the Qinghai-Tibetan Plateau Wetlands Since the 1960s
by Zhang, J., Zhu, Q., Yuan, M., Liu, X., Chen, H., Peng, C., et al. (2020). Front. Earth Sci. 8:361. doi: 10.3389/feart.2020.00361
In the original article, we intended to show the annual mean GHG flux rate within Figures 4, 5, and Table 1. However, there was an oversight in dividing the number by 12 (months).
Below, you can find the corrected Figures 4, 5, and Table 1, as well as the corrections of the numbers cited at various points in the text. The updated section in the Abstract, Page 1, Lines 11–14, can be found below. In addition, the updated portion in the Results, section ‘Extrapolation of CO2 and CH4 Emission Rates of the Study Site’, Page 7, Lines 1–22, can also be found below.
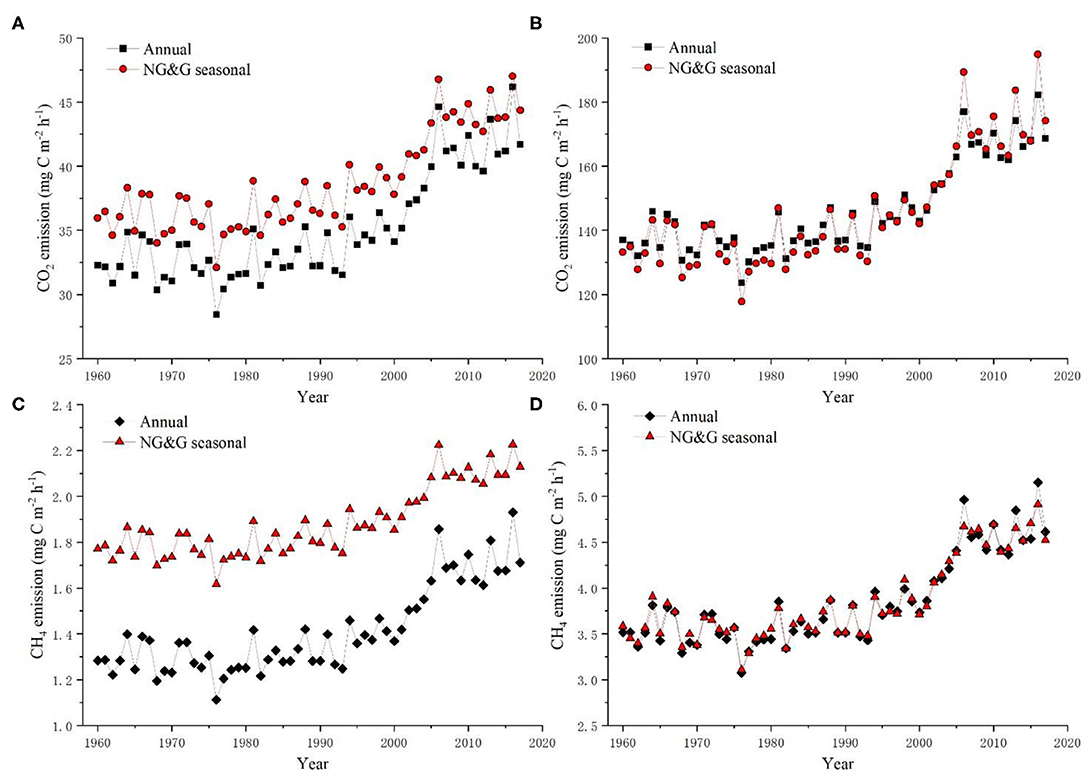
Figure 4. Annual CO2 and CH4 emission rates of the study site from 1960 to 2017 were extrapolated based on regression models between soil temperature and CO2/CH4 emissions measured using the static chamber method (A,C) and using the eddy covariance method (B,D) at different timescales (Annual or NG&G seasonal).
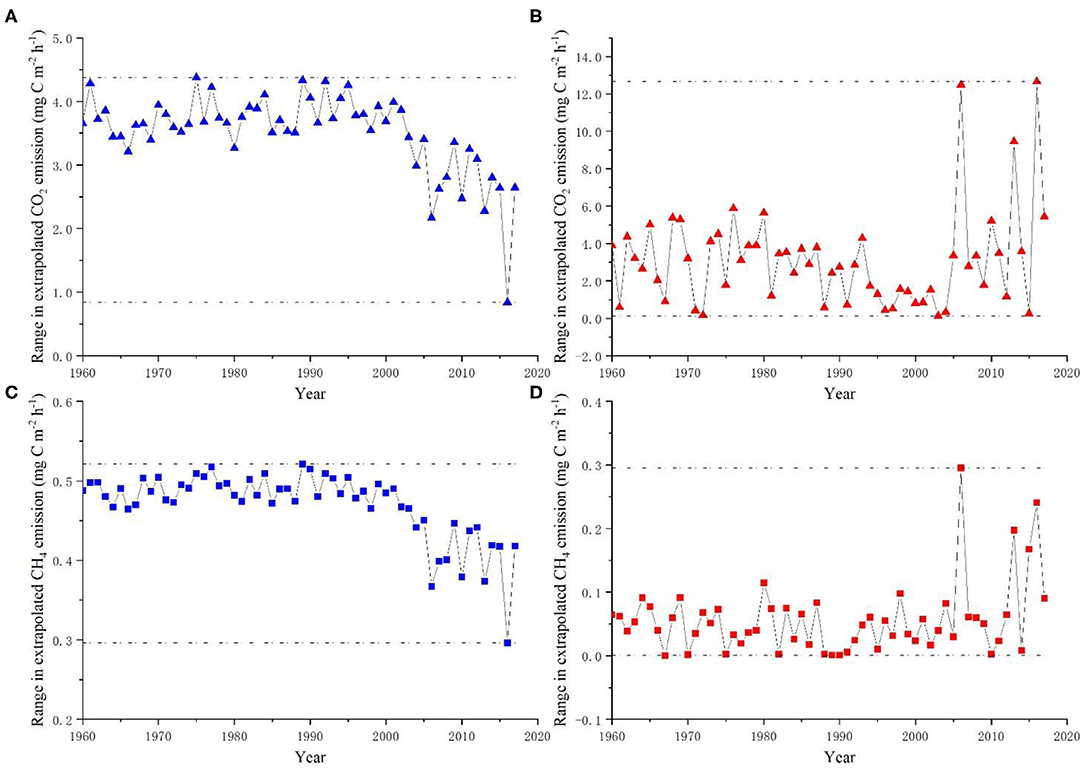
Figure 5. Calculated differences between extrapolated annual greenhouse gas emission rate of study site from 1960 to 2017. CO2 and CH4 emission rates were extrapolated by models based on data derived from the static chamber method (A,C) or Eddy covariance method (B,D) at annual and NG&G seasonal timescales, respectively. The differences between the maximum and minimum extrapolated values of each year were plotted.
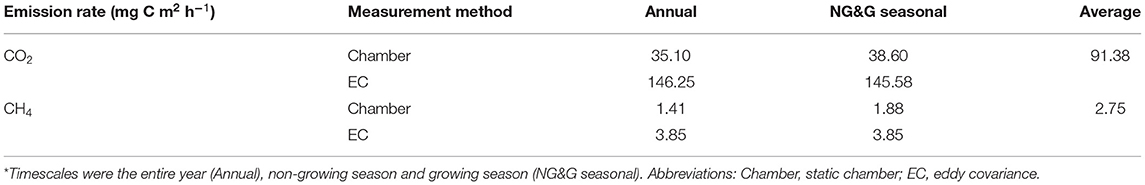
Table 1. Extrapolated mean emission rate of CO2 and CH4 of study site for the period 1960–2017, based on models derived from data obtained using the chamber or EC method at different timescales*.
We apologize for these errors and state that this does not change the scientific conclusions of the article in any way. The original article has been updated.
Abstract
Based on such relationship patterns and soil temperature data (1960–2017), we extrapolated the CO2 and CH4 emissions of study site for the past 57 years: the mean CO2 emission rate was 91.38 mg C m−2 h−1 on different measurement methods and timescales, with the range of the mean emission rate from 35.10 to 146.25 mg C m−2 h−1, while the mean CH4 emission rate was 2.75 mg C m−2 h−1, with the ranges of the mean emission rate from 1.41 to 3.85 mg C m−2 h−1.
Results
Extrapolation of CO2 and CH4 Emission Rates of the Study Site
Extrapolated mean CO2 emission rate of study site from 1960 to 2017 was calculated to be 91.38 mg C m−2 h−1, with the ranges of the mean emission rate from 35.10 to 146.25 mg C m−2 h−1 on different measurement methods and timescales (Table 1). The differences of emission rates between the maximum and minimum values extrapolated for each year reflected uncertainties from the same measurement method at different timescales. Uncertainties in extrapolation of the CO2 emission rates ranged from 0.84 to 4.38 mg C m−2 h−1 based on static chamber data, and from 0.13 to 12.67 mg C m−2 h−1 based on EC data (Figures 5A,B).
Extrapolated values for CH4 emission rate based on EC data were three times larger than extrapolated values based on chamber data (Figures 4C,D). Extrapolated mean CH4 emission rate of the study site was 2.75 mg C m−2 h−1 from 1960 to 2017, with the ranges of the mean emission rate from 1.41 to 3.85 mg C m−2 h−1 on different measurement methods and timescales (Table 1). Differences in annual average maxima and minima reflected uncertainties from static chamber method data ranging from 0.30 to 0.52 mg C m−2 h−1 (Figure 5C), while uncertainties in data extrapolated from the EC method ranged from 0 to 0.30 mg C m−2 h−1 (Figure 5D).
Keywords: climate change, wetlands, greenhouse gas, carbon fluxes, global warming potential
Citation: Zhang J, Zhu Q, Yuan M, Liu X, Chen H, Peng C, Wang M, Yang Z, Jiang L and Zhao P (2021) Corrigendum: Extrapolation and Uncertainty Evaluation of Carbon Dioxide and Methane Emissions in the Qinghai-Tibetan Plateau Wetlands Since the 1960s. Front. Earth Sci. 9:653753. doi: 10.3389/feart.2021.653753
Received: 15 January 2021; Accepted: 03 March 2021;
Published: 26 March 2021.
Edited and reviewed by: Matthias Peichl, Swedish University of Agricultural Sciences, Sweden
Copyright © 2021 Zhang, Zhu, Yuan, Liu, Chen, Peng, Wang, Yang, Jiang and Zhao. This is an open-access article distributed under the terms of the Creative Commons Attribution License (CC BY). The use, distribution or reproduction in other forums is permitted, provided the original author(s) and the copyright owner(s) are credited and that the original publication in this journal is cited, in accordance with accepted academic practice. No use, distribution or reproduction is permitted which does not comply with these terms.
*Correspondence: Qiuan Zhu, emh1cUBoaHUuZWR1LmNu; Pengxiang Zhao, emhhb3Blbmd4aWFuZ0Bud2FmdS5lZHUuY24=