 John J. Wellik
 Stephanie G. Prejean
 Devy K. Syahbana
94% of researchers rate our articles as excellent or good
Learn more about the work of our research integrity team to safeguard the quality of each article we publish.
Find out more
ORIGINAL RESEARCH article
Front. Earth Sci., 17 May 2021
Sec. Volcanology
Volume 9 - 2021 | https://doi.org/10.3389/feart.2021.653164
This article is part of the Research TopicSeismicity in Volcanic AreasView all 20 articles
In 2017, Mount Agung produced a small (VEI 2) eruption that was preceded by an energetic volcano-tectonic (VT) swarm (>800 earthquakes per day up to M4.9) and two months of declining activity. The period of decreased seismic activity complicated forecasting efforts for scientists monitoring the volcano. We examine the time history of earthquake families at Mount Agung in search of additional insight into the temporal changes in the shallow crust prior to eruption. Specifically, we analyze the period of declining seismic activity about five weeks prior to the eruption when forecasting uncertainty was greatest. We use REDPy (Hotovec-Ellis and Jeffries, 2016) to build a catalog of 6,508 earthquakes from 18 October 2017–15 February 2018 and group them into families of repeating earthquakes based on waveform similarity using a cross-correlation coefficient threshold of 0.8. We show that the evolution of earthquake families provides evidence that Mount Agung was progressing toward eruption even though overall earthquake rates and seismic-energy-release declined. We find that earthquake families that dominated seismicity during the beginning of the crisis ceased near the onset of tremor on 12 November 2017. Then, earthquake families took on characteristics commonly observed during effusive phases of eruptions on 15 November—a full six days before the first phreatomagmatic eruption on 21 November 2017 and a full ten days before the actual onset of lava effusion on 25 November 2017. We interpret the transitions in seismicity as the manifestation of a three-phase physical model including an Intrusion Phase, a Transition Phase, and a Eruptive Phase. During the Intrusion Phase, seismicity was dominated by VT earthquakes with a relatively high percentage of repeaters (59%) grouped into numerous (65) simultaneous families. During the Eruptive Phase, seismicity included both VT and low frequency earthquakes that grouped into relatively long-lived families despite a low overall percentage of repeaters (14%). The Transition Phase exhibited characteristics of earthquake families between the Intrusion Phase and Eruptive Phase. We conclude that the time history of earthquake families provides insight into the evolution of the stress distribution in the volcanic edifice, the development of the volcanic conduit, and seismogenesis of magma effusion. Finally, we discuss the role that repeating earthquakes could play in real-time monitoring at restless volcanoes. Our work suggests eruption forecasts can be improved by incorporating automatic processing codes to assist seismologists during sustained periods of high earthquake rates, even at sparsely monitored volcanoes.
Continuous seismic data have been the primary data stream used to forecast eruptive activity during volcanic crises since modern volcano monitoring began. Examples of forecasts from seismic data are numerous (e.g., Endo et al., 1981; Malone et al., 1983; Klein, 1984; Swanson et al., 1985; Power and Lalla, 2010; Chouet et al., 1994; Harlow et al., 1996; Soosalu et al., 2005; Power and Lala, 2010; Buurman and West, 2010; and; Ruppert et al., 2011). The most established seismic indicators of incipient eruption include increasing number and amplitude of seismic events and shifts in types of seismic events from VTs (volcano-tectonic) to LFs (low frequency) and tremor as magma nears the surface (e.g., Minakami, 1974; Voight, 1988; Chouet, 1996; McNutt, 1996; Boué et al., 2015; McCausland et al., 2019; White and McCausland, 2019). Many of these methods are most reliable for explosive eruptions, whereas small and slowly evolving eruptions can be more difficult to forecast reliably (e.g., Cameron et al., 2018) and require a detailed understanding of a volcano’s structure, tectonic framework, hydrologic system, and eruptive history.
Seismicity escalated dramatically in the months prior to the 2017–2018 eruption at Mount Agung, Bali, Indonesia, providing ample warning of an impending eruption (Syahbana et al., 2019) and raising fears of a violent eruption, similar to the VEI 5 in 1963 (Kusmandinata, 1964). Although the eruption was expected in the long term, forecasting the size and onset time of the eruption in the short term was difficult. Ultimately, the eruption was only a VEI 2, characterized by relatively small explosions and the extrusion of 24 million m3 of lava at the summit crater (Syahbana et al., 2019). Ash fall affected local farmland and small lahars traveled down drainages on the N and S flanks, and there were no fatalities.
Several challenges presented themselves throughout the crisis:
(1) Scientists with CVGHM (Indonesia’s Center for Volcanology and Geologic Hazard Mitigation), who were responsible for monitoring, had very few automatic processing tools to assist them in their work. Aside from RSAM (Realtime Seismic Amplitude Measurement: Endo and Murray, 1991), staff manually counted and classified earthquakes to interpret volcanic activity and provide information to decision makers and the public.
(2) There were no records of seismicity from the 1963 eruption, and there had been no detected unrest on the local network in the decades prior to 2017 to serve as a comparison.
(3) After an initial intense swarm of earthquakes, overall rates of seismicity decreased for almost two months leading into the first phreatomagmatic and magmatic eruptions, thus creating uncertainty as to when or if activity would progress toward an eruption (Syahbana et al., 2019).
(4) Seismic signatures that commonly reflect shallowing magma (McNutt, 1996; White and McCausland, 2019)–tremor, low frequency earthquakes, and proximal brittle failure earthquakes—were subtle, low in amplitude, and difficult to detect through cultural noise.
Small eruptions can be difficult to forecast precisely because precursory signals can be subtle, but in densely populated areas small eruptions still pose a great threat. Thus, new approaches and analysis tools are needed. Studies of repeating earthquakes, or earthquake families, have been successful, though often in retrospect, of showing notable changes in eruptive activity at a variety of volcanoes (e.g., Green and Neuberg, 2006; Umakoshi et al., 2008; Arambula-Mendoza et al., 2011; Thelen et al., 2011; Buurman et al., 2013; Rodgers et al., 2013). Repeating earthquake families can include either broad-band brittle failure or low-frequency earthquakes and are observed when seismic sources are stationary, non-destructive and of the same mechanism (Geller and Mueller, 1980). Processes that cause them vary widely, including brittle failure associated with deep pressurization and conduit building under the summit (Buurman and West, 2010; Deshon et al., 2010; Budi-Santoso and Lesage, 2016), shallow fluid movement and lava dome growth at the surface (Stephens and Chouet, 2001; Rowe et al., 2004; Green and Neuberg, 2006; Umakoshi et al., 2008; Matoza and Chouet, 2010; Thelen et al., 2011), magma-water interaction in the shallow system (Rodgers et al., 2013; Rodgers et al., 2015), and degassing (Caplan-Auerbach and Petersen, 2005; Waite et al., 2008; Matoza et al., 2015).
In this retrospective study, we examine the time history of earthquake families at Mount Agung in search of additional insight into the temporal changes in the shallow crust (upper 20 km) prior to eruption. Specifically, we analyze the period of declining seismic activity ∼5 weeks prior to the eruption. We show that the evolution of earthquake families illustrates that Mount Agung was progressing toward eruption even though overall earthquake rates and seismic-energy-release declined.
After a 50 + year period of repose, unrest at Mount Agung began in mid-July with anomalous levels of seismicity, thermal anomalies, and an increase in steaming at the volcano’s summit (Syahbana et al., 2019). Earthquake rates and magnitudes intensified in September, and reports of felt seismicity and locations for the largest earthquakes (>M2.3)—computed by Indonesia’s Meteorological, Climatological, and Geophysical Agency (BMKG), which runs the national seismic network—suggested the earthquakes were located between the edifices of Mount Agung and Batur (NW of Mount Agung) at depths between 10 and 20 km below sea level (Figure 1). The growing swarm of brittle failure VTs was interpreted as the seismic response of the crust as a deep intrusion under the summit of Mount Agung (White and McCausland, 2016). Later work helped clarify the path magma took to reach the surface. A series of InSAR images from 21 September 2017 UTC to 8 November 2017 UTC show a pattern of inflation that is consistent with a dike intrusion between 7 and 13 km depth on the NW flank of Mount Agung (Albino et al., 2018). The location of the magma reservoir below the depth of the dike is not known, but Syahbana et al. (2019) favor a model where a the dike propagated laterally from a deeper magma reservoir (12 to >15 km) beneath the summit of Mount Agung before magma continued to the summit.
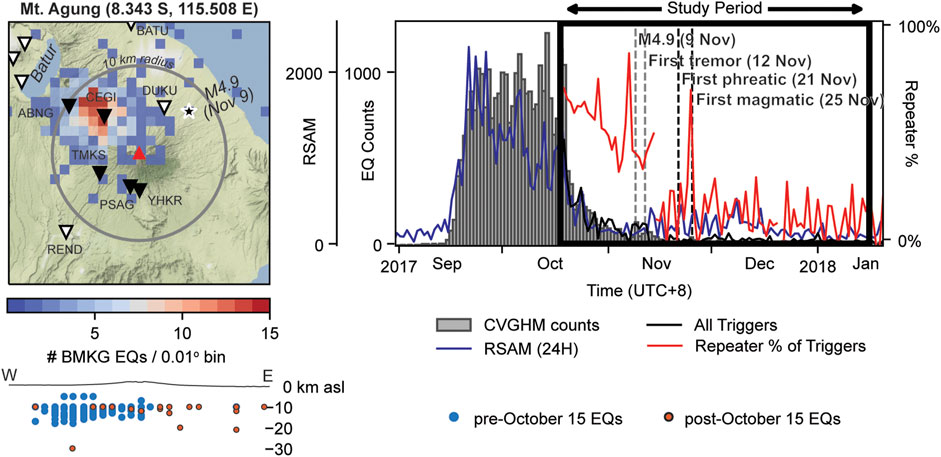
FIGURE 1. Map (left) and timeseries (right) of seismicity throughout the entire crisis. The map displays information about locations for the 423 earthquakes located near Mount Agung by Indonesia’s Meteorological, Climatological, and Geophysical Agency (BMKG) from September 2017 through February 2018. Specifically, the map shows the number of earthquakes in the BMKG by Indonesia’s Meteorological, Climatological, and Geophysical Agency (BMKG) catalog per 0.01x0.01o bin, the resolution of the BMKG catalog (∼1.1km x 1.1km at this latitude). Black triangles represent seismic stations used in this study. White triangles represent additional stations that were not included due to frequent data outages or high levels of noise. The EW cross-section below the map shows the BMKG depth for all earthquakes on the map. Earthquakes before 15 October are plotted in blue, and earthquakes after 15 October are plotted in orange. The apparent shift in hypocenters from west of the volcano to east of the volcano in mid-October was noticed during the crisis (Syahbana et al., 2019) and is discussed in the text. The timeseries shows the Center for Volcanology and Geologic Hazard Mitigation’s (CVGHM) earthquake counts (gray bars), 24-Hour RSAM derived from the filtered (1–10 Hz) seismic data of station TMKS (blue line), all triggers produced by REDPy (black line), and the repeater percentage of triggers (red line). Key dates, such as the largest earthquake in the sequence (M4.9 on 9 Nov SGT), the first appearance of tremor (12 Nov SGT), the first phreatic eruption (21 Nov SGT), and the first magmatic eruption (25 Nov SGT) are also included. All dates are Agung local time (UTC+8; “SGT”). Figure 2 shows more detail for the study period.
One day before the peak seismic earthquake rates on 23 September 2017, CVGHM raised the alert level to IV (the highest of 4 levels). Earthquake magnitudes reached a new maximum (M4.2) a day later on 23 September 2017 (Syahbana et al., 2019), but subsequently earthquake rates and RSAM values decreased significantly (Figure 1). After a month of reduced earthquake rates and declining RSAM values, the alert level was lowered to III on 29 October 2017 (Syahbana et al., 2019).
During this time of uncertainty, CVGHM staff were vigilant for any signs of shallowing magma, such as the emergence of tremor and low-frequency (LF) seismicity or a shift of seismicity toward the summit (Chouet, 1996; White and McCausland, 2019). On 9 November 2017, a M4.9 earthquake, the largest of the crisis, and a series of aftershocks occurred in a prominent new location NE of the mountain at ∼10 km depth, according to BMKG. According to global solutions by the U.S. Geological Survey (USGS) National Earthquake Information Center2 and the Global Centroid Moment Tensor3 (Dziewonski et al., 1981; Ekström et al., 2012), the earthquake occurred on an approximately E-W striking, south-dipping thrust fault—consistent with seismicity in the back-arc of the Sunda convergent margin (Supendi et al., 2020). On 12 November, CVGHM staff noted the first significant tremor as well as the first appearance of LF earthquakes. These tremor bursts were ∼40–120 s each, were broadband (1–10 Hz), and were barely strong enough to rise above the amplitudes of daytime cultural noise on the analog stations TMKS and PSAG (Syahbana et al., 2019). Together, the M4.9 earthquake and appearance of tremor and LFs were interpreted by CVGHM as a possible shift toward a more phreatic phase of precursory unrest as heat interacted with the shallow hydrologic system and fluids and gases moving toward the surface began opening the conduit. Later work by (Sahara et al., 2021) (submitted) lend credence to this interpretation by showing a gradual shift in earthquake locations toward the summit.
The fact that tremor did not continue and that shallow LF earthquakes were few in number, however, suggested that if processes in the volcanic conduit were progressing toward eruption, they were doing so slowly. The lack of convincing evidence for shallow conduit seismicity and the increased lag time since the energetic VT swarm increased CVGHM’s uncertainty that an eruption would occur in the near future (Syahbana et al., 2019), and CVGHM opted not to raise the alert level. In hindsight, another InSAR image from 20 November showed significant depletion from the inflation source under the NW flank, which Albino et al. (2018) interpret as a sign that magma had begun to migrate toward the summit. The first gas measurements, which were taken by unoccupied aircraft systems early on 21 November, also showed high levels of CO2, which was interpreted as a significant sign of unrest (Syahbana et al., 2019).
Earthquake rates remained at low levels and fluctuations in RSAM stayed within normal bounds leading up to the first phreatomagmatic eruption on 21 November. LF earthquakes and tremor increased after the first phreatomagmatic eruption, and on 25 November, CVGHM staff documented 21 larger LF signals with a dominant frequency of ∼2 Hz over a 90-min period (Syahbana et al., 2019). These earthquakes were closely associated in time with the onset of lava at the summit, and within just a few days, 24 million m3 of lava had filled one-third of the summit crater, and regular explosions occurred until mid-January 2018 (Syahbana et al., 2019).
We used REDPy (Hotovec-Eills and Jeffries, 2016) to build an earthquake catalog at Mount Agung prior to, during, and after the late-November 2017 eruptions, and we group those earthquakes into families based on waveform similarity to assess changes in seismicity over time. We focus on the time period of greatest forecasting uncertainty—i.e., when seismicity decreased following peak rates in late September, and then in the period after the eruption started.
REDPy is designed to comb through real-time or archived continuous data to produce a catalog of triggered signals using a short-time-average/long-time-average (STA/LTA) algorithm. It then cross-correlates all triggered signals against each other, and earthquakes with cross-correlation coefficients above a certain threshold are grouped into families of repeating earthquakes. Earthquakes from a single family are presumed to have originated from a similar location and a similar source mechanism, thus providing some information about earthquake source properties even if the network is insufficient to compute hypocenters or focal mechanisms (Geller and Mueller, 1980). Earthquakes whose cross-correlation coefficients with prior events are below a defined threshold are labeled “orphans” and remain in the catalog to be compared to future earthquakes. We also use REDPy to compute the Frequency Index (FI) of each earthquake by comparing energy in a high frequency band (5–10 Hz) to energy in a low frequency band (1–2.5 Hz) (Buurman and West, 2010). Frequency index is an arithmetical method to describe earthquake frequency content, and in our case, we empirically define the boundary between VT and LF earthquakes at 0 (Figure 2).
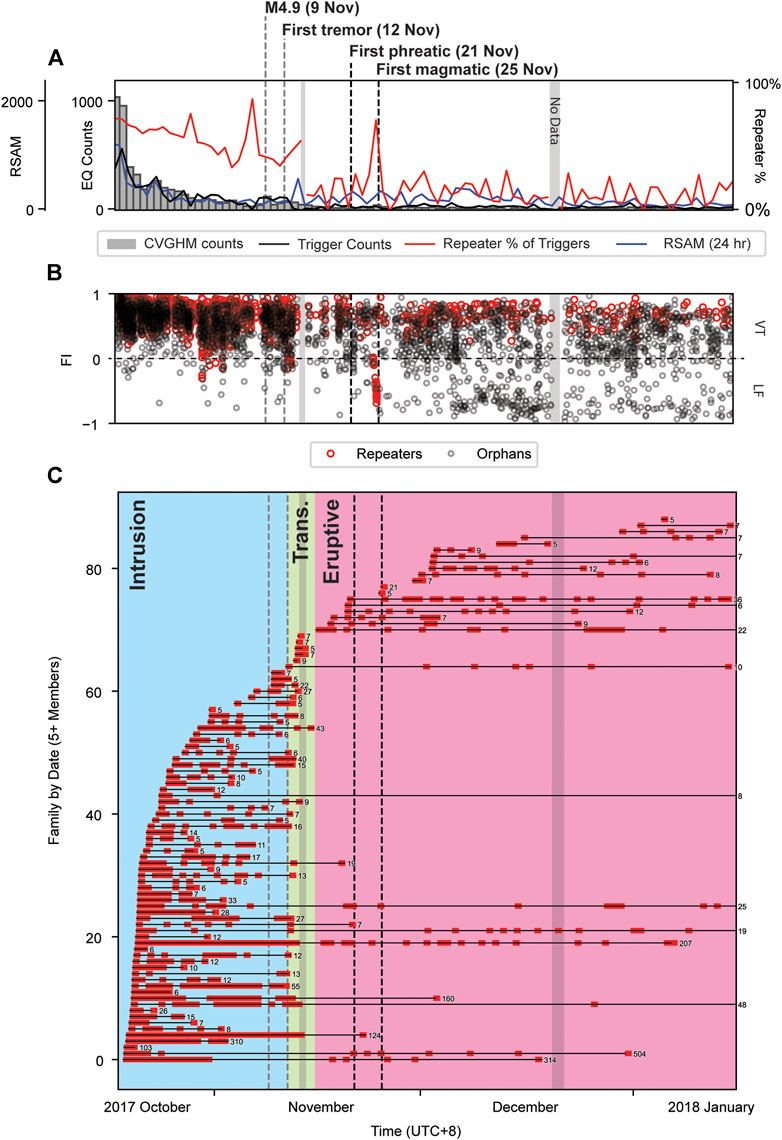
FIGURE 2. Detailed look of the study period from Figure 1. (A) Detailed look at Figure 1. See Figure 1 for explanation. The gray bars in mid-November and mid-to late-December labeled “No Data” represent times when there were not enough stations (i.e., less than 3) for REDPy to produce a trigger. These gray bars extend to subplots B and C (B) Frequency Index of all triggers and repeaters in the REDPy catalog. The swarm of 21 LF earthquakes on 25 November SGT is clearly distinguishable. We empirically define the boundary between VTs and LFs at 0. See text for details. (C). Each horizontal line represents one earthquake family (5 + members). Red boxes represent hours when the family was active. Numbers to the right of each line represent the total number of repeaters in the family. The definitions for the start and stop of the Intrusion Phase (blue), Transition Phase (green), and Eruptive Phase (pink) are based on the patterns of earthquake families in this plot (see Discussion). Vertical dashed lines and vertical gray bar are extensions of labels from A.
Prior to the crisis, the seismic monitoring network at Mount Agung consisted of two short-period, vertical seismometers that were transmitted via analog telemetry back to the observatory post at Pos Rendang. The stations were ∼4 and 5 km away from the summit. Between mid-October and early November, CVGHM and VDAP (USGS-USAID Volcano Disaster Assistance Program) installed seven new seismometers — 6 broadband and 1 short-period—with digital telemetry back to the observatory post (Figure 1). Four of those stations were located <10 km from the volcano while the other three were located farther away. For this analysis, we used 5 stations (the two original short-period analog stations (TMKS, PSAG), the short-period digital station (ABNG) and two of the closest broadbands (CEGI, YHKR) (Figure 1). We did not include the other proximal broadband, DUKU, because it had significant data outages during our study.
We filtered all data between 1 and 10 Hz before applying the recursive STA/LTA algorithm (short-time widow: 3 s; long-time window: 8 s; trigger on threshold: 1.8; trigger off threshold: 1.3). We required a detection at 3 stations in order to produce a trigger, and we required a cross-correlation coefficient of 0.8 at 3 stations in order to be considered a matching waveform. Finally, we required families comprise five earthquakes or more for the events to be grouped as a family and counted as a repeater for the purposes of Figures 1–3 and Table 1.
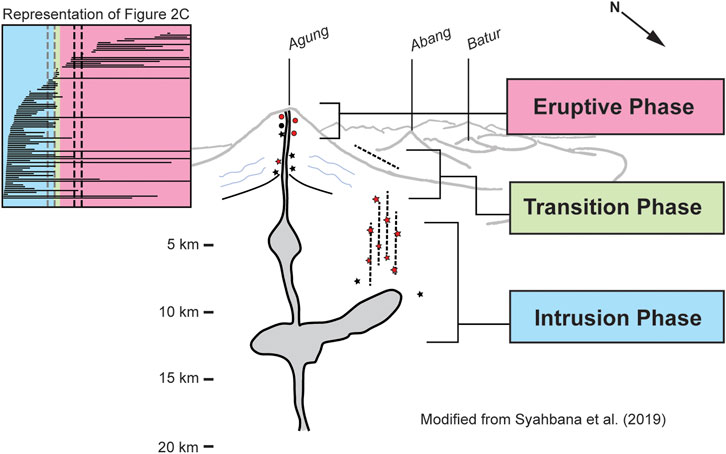
FIGURE 3. Schematic of the preferred model from Syahbana et al. (2019). Each phase of activity from the Discussion and Figure 2C is tied to a general location of earthquake activity. A generalized version of Figure 2C is reproduced in the top left for easy reference. In the model sketch, stars represent high-frequency VT earthquakes, and circles represent low-frequency earthquakes. Red represents a preponderance of repeaters while black represents a preponderance of orphans. The representation of VTs, LFs, repeaters, and orphans in this figure is for illustrative purposes only. This figure modifies Figure 2B from Syahbana et al. (2019).
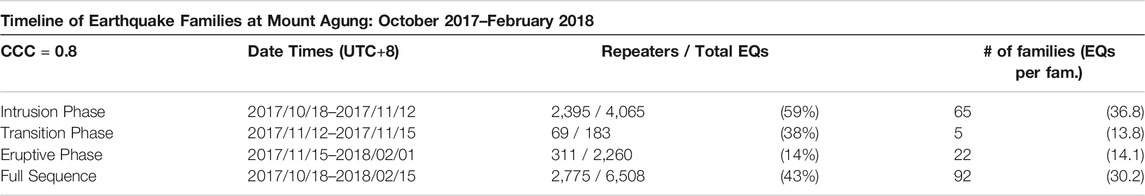
TABLE 1. Percentage of earthquakes that are repeaters during each phase of activity. In general, the Intrusion Phase of seismicity is dominated by repeaters while the Transitional Phase and Eruptive Phase are overwhelmingly dominated by orphans. CCC = cross-correlation coefficient.
We reviewed all earthquake waveforms in Swarm4 to verify that regional earthquakes and noise were not included in our analysis. We also repeated our analysis with cross-correlation coefficients of 0.6 and 0.7 to verify that the interpretation of our results is not sensitive to this value (Supplementary Table S1). Finally, we extended our analysis to the beginning of the crisis (early September) by using just the 2 original analog stations and a cross-correlation coefficient of 0.8 to verify that observations made in the study period are representative of the beginning of the crisis.
Our analysis resulted in a catalog of 6,508 earthquakes from 21 October 2017 to 15 February 2018 (Table 1). The calculated daily counts correspond well with manual counts conducted by CVGHM during the crisis (Figure 2). Over the course of the entire study period, 43% of earthquakes in our catalog—including 9 of the 24 BMKG earthquakes recorded on three local stations or more (Supplementary Table S2) — group into one of 92 families of 5 earthquakes or more (Table 1). Several characteristics of repeating earthquake families—including the percentage of repeating earthquakes as a portion of total seismicity and the longevity of each family—change throughout the course of the unrest and eruption.
From the beginning of the study (21 October) through the onset of tremor on 12 November 2017, the pattern of repeating earthquakes was defined by a large number of simultaneous families, each with a large number of events (Figure 2; Table 1). In total, this time period included 4,065 earthquakes, 2,395 (∼59%) of which grouped into 65 different families (Table 1). These earthquakes ranged in magnitude from <M1 to M3, and all were brittle-failure or volcano-tectonic (VT) events.
Coinciding with the beginning of our study period, the BMKG catalog shows that earthquake locations began to occur N and NE of the volcano as well as on the W flank near Abang where a large majority of earthquakes had previously occurred (Syahbana et al., 2019). None of the BMKG-located earthquakes were part of an earthquake family until some of the 50 + located aftershocks that followed the M4.9 earthquake on 9 November 2017 05:54 SGT grouped into various earthquake families (Supplementary Table S2).
On 12 November, the behavior of earthquake families changed for a brief period. Most (54 of 65, or ∼83%) pre-existing families ceased on or shortly after 12 November, and new families appeared. The first new family (Family 66) appeared during the onset of tremor. Over the course of the next three days, a total of five new families appeared, comprising 35 earthquakes. The new families ranged in longevity from ∼1 h to ∼25 h. Waveforms were emergent and low-frequency (<5 Hz). None were large enough to be located with the BMKG network. Overall, from 12 November to 15 November, there were 183 total earthquakes, 69 (∼38%) of which were in earthquake families—including those that belonged to pre-existing families (Table 1).
The nature of earthquake families changed again several days prior to the onset of the eruptions. Starting on 15 November, earthquake families were defined by a small number that comprised a relatively low percentage of the overall seismicity but were long-lived. A majority of earthquakes during this time period were small (<M3) and were a mix of VT events and LF events. Overall, only 14% of earthquakes (311 out of 2260) were part of earthquake families (Table 1). Several families remained active through the end of the study. After 15 November, the BMKG catalog includes 13 earthquakes with sufficient data for our study, and 5 of them had repeating waveforms. All belong to families that appeared after 15 November (Supplementary Table S2).
Seismic rates remained low in the days prior to the initial phreatomagmatic eruption on 21 November, and there were no unique patterns among the few repeating earthquakes that occurred. The swarm of larger, low frequency earthquakes that roughly coincided with the onset of lava effusion on 25 November (see Eruption Timeline and Response), however, is clearly highlighted in our results. Starting at ∼0530h SGT, a new family of 21 highly repetitive (cross-correlation coefficient, CCC ∼0.95) earthquakes appeared (Supplementary Figure S1). These earthquakes had a strong peak energy at ∼2 Hz and are clearly identifiable by their frequency index in Figure 2B.
The remainder of the study period, which included continuous to semi-continuous ash explosions until 19 January 2018, was characterized by low rates of seismicity, low numbers of repeating earthquakes, and long-lasting families (Figure 2).
Extending the analysis to the beginning of the crisis using just the 2 analog, short-period stations resulted in a larger number of detected earthquakes. Many of the additional earthquakes were either lower amplitude with lower signal-to-noize ratio or were larger magnitude, clipped signals from the most intense part of the unrest. This resulted in a smaller proportion of repeating earthquakes overall (∼30%), but certain key observations remained consistent between this longer term analysis with lower quality data and our primary results—a large number of simultaneous families at the beginning of the crisis, the cessation of a most families (>90%) on or shortly after 12 November, the overall decrease in repeating earthquake percentage over time, a prominent swarm of 20 + LFs on 25 November, and notably longer-lived families after the onset of lava effusion.
Earthquake families—based on cross-correlation analyses—have long-been studied at a large number of volcanoes. However, very few examples document earthquake family evolution associated with the lateral emplacement of a dike, followed by magma migration and eruption (White et al., 2011). The evolution of earthquake families at Mount Agung illustrates a changing volcanic system. We interpret the transitions in seismicity as the manifestation of a three-phase physical model. The three phases inferred by our analysis in context of other observations are: 1) the Intrusion Phase, 2) the Transitional Phase, and 3) the Eruptive Phase (Figure 2; Figure 3).
During the Intrusion Phase, earthquakes were occurring mostly under the NW flank of Mount Agung, proximal to an intruded dike (Syahbana et al., 2019; Albino et al., 2018; Figure 1). The large number of repeating earthquakes from a large number of earthquake families fits well with the conceptual model that dike intrusion can cause small, repeated failures, and rapid reloading of shear stress on a large number of small faults in the shallow crust near the dike. The large number of families as well as the significant percentage of orphaned earthquakes (∼40%) may also speak to the diversity of faulting at different orientations in the shallow crust (Barton et al., 1995; Townend and Zoback, 2000). If dike intrusion increases pore pressure in the region through heating existing ground water or through exsolution of fluid and gas, in addition to gradually increasing shear stress across favorably oriented faults, faults of a wide variety of orientations may fail as the effective normal stresses across faults are decreased systematically in the area.
None of the earthquakes from the BMKG catalog group into a family until the series of aftershocks after the M4.9 earthquake on 9 November, which was located to the NE of the Mount Agung (Figure 1; Supplementary Table S2). During the crisis, CVGHM staff noted variable aftershock productivity for some of the largest earthquakes. This may reflect temporal variability in how ‘primed’ area faults were to fail in a typical brittle failure cascade as high seismicity rates continued. For example, the M4.9 earthquake produced a large number of aftershocks whereas a M4.0 earthquake on 16 November, located on the NW flank of the mountain, produced relatively few aftershocks. Although this observation is interesting and deserving of further study, a rigorous analysis of aftershock productivity at Mount Agung is beyond the scope of this study.
New observations of tremor and LF earthquakes on 12 November marked a significant change in the state of the system at Mount Agung and a new phase of unrest. During the crisis, this was the first indication that magma had started to move toward the summit. At the time, there was uncertainty interpreting the M4.9 that occurred 3 days prior on 9 November. In retrospect, one possibility was that this earthquake, which occurred in a prominent new location NE of the volcano, was the result of redistribution of stress in the shallow crust as magma moved to a new location closer to the summit. The delay between the large earthquake and the subtle, short-lived LF seismicity on 12 November suggests that stress transfer across the region occurred gradually. Although BMKG earthquake locations available during the crisis did not reveal a shallowing of hypocenters between early September and mid-November, later work by Sahara et al. (submitted, this issue) did show a shallowing trend of hypocenters over this time frame, consistent with the interpretation that magma was moving toward the summit.
Changes in earthquake families, revealed by our analysis, provide additional evidence that Agung was entering a new phase of unrest close to 12 November. Almost all (54 of 65) earthquake families from the Intrusion Phase ceased on or shortly after 12 November, when the appearance of LF earthquakes marked the start of new families. This suggests that as magma started to move toward the summit around 12 November (Albino et al., 2018), the effective shear to normal stress ratio on faults surrounding the dike, located NE of the summit, decreased, unloading these faults. The short duration of the families born on 12 November suggests that the source processes and locations for these earthquakes were ephemeral and likely represent an intermediary step between magma intrusion into the dike and shallow magmatic activity closer to the summit. The relative lack of seismicity during this time period (all the way up to and through the beginning stages of the eruption; see next section) suggests that the crust under the summit was much hotter and more ductile than originally assumed due to the fact that the volcano had not erupted in 50 years.
Interpreting subtle changes in seismicity during a crisis is often difficult. Any additional line of evidence that suggests a change can help clarify the state of the system. Thus, observed changes in earthquake families may not be a diagnostic indication of magma movement toward the surface, but they can lend confidence to other observations.
The first phreatomagmatic eruption did not occur until 21 November, and lava effusion did not begin until 25 November, but characteristics of earthquake families changed as early as 15 November and persisted throughout the eruptive phase of the eruption. A large majority of earthquakes after this date (86%) are orphans. The BMKG catalog includes 15 earthquakes from this time period, most of which were located on the N to NE side of the mountain, but CVGHM staff noted that many of the smaller earthquakes appeared to be located shallowly and near the summit based on their waveforms. These earthquakes included both brittle failure VT earthquakes and LF earthquakes (Syahbana et al., 2019). One possible explanation is that these earthquakes occurred at shallow levels on a network of new cracks that was created by continually destructive processes. Following this model, waveforms became much more complex and less similar to other waveforms leading to a drastically smaller percentage of seismicity represented by repeating earthquakes as magma/water interaction occurred along the evolving pathway in the few kilometers below the summit.
Families that do appear during this phase tend to be long-lived. As pathways are developed and magma is able to migrate toward the surface, the few repetitive sources that exist remain stable. At Mount Agung, these sources remain stable despite significant changes in behavior at the surface including periods of continuous ash emission, discrete explosions, Strombolian activity, and a drastic decrease in eruptions in mid-January 2018 (Figure 2 in Syahbana et al., 2019). This is consistent with observations by Green and Neuberg (2006) and Thelen et al. (2011) where earthquake families during the eruptive phase of eruptions at Soufriere Hills, Mount St. Helens, and Bezymianny persisted through small explosions and collapses of the dome. In those systems, it is likely that the earthquakes were located deep enough to not be affected by small explosions and dome collapse at the surface.
The swarm of 21 larger LF earthquakes (peak energy ∼2 Hz) that occurred on 25 November is one notable exception to the general trend of long-lived families during the eruptive phase. Lasting only 90 minutes, these earthquakes represent a temporarily stable seismic source associated with the magma’s final push to the summit. Satellite observations confirm that lava effusion into the summit crater first started sometime on 25 November, but there are no direct visual observations that allow us to note the exact time of onset (Syahbana et al., 2019). Thus, we can only say that this swarm is roughly coincident with the first magmatic explosions and the appearance of lava at the surface. It is possible that these earthquakes are the manifestation of gas escape around the plug or shallow magma movement prior to or coincident with the onset of lava effusion at the surface. The pattern of repetitive co-eruptive seismicity or repetitive inter-eruption seismicity is common at frequently active, volcanic systems that are open to degassing (e.g., White and McCausland, 2019). The repeating waveforms are commonly attributed to conduit convection and bubble bursts, either at the surface or in the conduit (e.g., Caplan-Auerbach and Petersen, 2005), resonance associated with gas flow through the conduit (e.g., Chouet, 1996; Molina et al., 2008; Lyons et al., 2016), or stick-slip processes in a hot, viscous environment (e.g., Iverson et al., 2006).
After the initial emplacement of lava at the surface and the swarm of 21 LFs, extrusion rates remained high, emplacing 24 million m3 of lava within less than a week. The surface of the lava flow was punctuated by a series of near continuous explosions, but the explosion craters were quickly filled in and covered by newly extruded lava (Syahbana et al., 2019). Earthquake rates during this period of high extrusion, however, remained low with very little repetitive seismicity. On 5 December, the rate of ash explosions decreased, and cracks began to appear on the surface of the lava dome as effusion rates slowed. At this same time, new families begin to occur, and orphans became notably more LF although earthquakes in families did not shift frequency content (Figure 2).
We interpret the relative lack of seismicity during the highest rates of effusion followed by the increased rate of LF earthquakes as effusion slowed as a manifestation of the rate-dependent nature of seismicity in a conduit (Dmitrieva et al., 2013). Changes in magma viscosity may have also played a role, but this information is not available at this time. As lava cooled at the surface and restricted flow through the conduit, pressure increased, which allowed more repetitive earthquakes to occur.
Although our study was completed retrospectively, we can speculate on the role of our analysis in real-time eruption forecasting. In general, the operational value of repeating earthquakes depends on the ability to recognize patterns and interpret the processes that drive those patterns. This depends, in part, on the characteristics of the crust, the conduit, and the magma itself. It also depends on the availability of seismic records from past eruptions because volcanoes can display similar precursors to multiple eruptions.
Traditionally, seismologists rely on metrics such as earthquake rates, amplitudes, and frequency-based classifications to interpret unrest at a particular volcano. Repeating earthquake analyses provide additional metrics—such as the repeater percentage of total seismicity, the number of concurrent families, and the longevity of each family—that can aid the interpretation of unrest.
We are generally successful at detecting and alarming on the precursors we expect to see, while we are far less successful if we do not know what to expect from a volcano. Automatic detection of changes in repeating earthquakes could be an exceptionally valuable tool for eruption forecasting at well-understood volcanoes. For example, some studies suggest that certain sequences may be alarmable. Explosions at Volcán de Colima in 2004–2005 (Arámbula-Mendoza et al., 2011) and at Augustine in 2006 (Buurman and West, 2010) were preceded by diagnostic occurrences of certain earthquake families. In addition, cyclic patterns of dome deflation at Soufrière Hills in 1997 were preceded by the same pattern of repeating earthquakes (Green and Neuberg, 2006).
Repeating earthquakes have been most well-studied during episodes of dome growth, thus providing several models and common observations to explain their occurrence. For example, Thelen et al. (2011) note that earthquake families tended to be longer-lived during stable phases of effusion across multiple eruptions at Mount St. Helens and Bezymianny. This is consistent with our observation of relatively long-lived families after lava extruded at Agung.
Although repeating earthquakes have been most well-studied at domes, earthquake sources repeat throughout the crust beneath volcanoes of all types. Therefore, all phases of unrest that produce seismicity are likely to produce repeating seismicity. When we lack a clear paradigm for eruption precursors at a volcano, we interpret repeating earthquakes by applying generic models that incorporate knowledge of the magma properties, the stability of the conduit and degassing pathways, and the overall geomechanics of the crust. For example, increasing numbers of VT earthquake families at a closed-system volcano, particularly in combination with increasing seismic amplitudes, may be a concerning sign of pressurization of the edifice as more faults are activated. In contrast, increasing numbers or amplitudes of LP earthquakes within stable earthquake families at a volcano open to degassing, may simply mean that the degassing rate has increased without a significant increase in the overall hazard. Or during an intrusive phase of unrest, for example, rapidly changing sets of earthquake families may indicate migrating magma, while stable earthquake family may indicate rapid reloading of shear-stress on the same faults.
At Agung, little was known about crustal and conduit conditions or about seismicity associated with prior eruptions. However, clear changes in repeating earthquakes—such as those on 12 November and 15 November—could have given observatory scientists an indication that the volcanic system was evolving when other monitoring parameters were stable. This could have increased vigilance and encouraged more cross disciplinary discussion of the volcano’s current state. During a protracted unrest sequence, such as this one, scientist fatigue can be a significant problem, and any clear indication of meaningful changes in monitoring parameters is an advantage.
Seismicity is often the most readily available data stream for tracking unrest during volcanic crizes. Interpreting changes in earthquake rates, earthquake magnitudes, earthquake classifications, and RSAM has led to many successful forecasts. When unrest does not progress in a traditional pattern, however, relying on these metrics leads to uncertainty. In these scenarios, other tools add value. We analyzed the evolution of earthquake families with time during the Mount Agung volcanic crisis. We find that when considered in context of other observations, the time history of earthquake families provides insight into the evolution of the stress distribution in the volcanic edifice, the development of the volcanic conduit, and seismogenesis of magma effusion.
CVGHM staff noted the new appearance of volcanic tremor—nominally a harbinger for an evolving magmatic system—on 12 November 2017 after months of elevated seismicity at Mount Agung, but volcanic tremor and LF seismicity were subtle and earthquake rates were not high compared to prior months. Thus, the time frame over which to expect eruption remained uncertain.
Our retrospective study shows that earthquake families that dominated seismicity during the early stages of unrest ceased near the onset of tremor, highlighting that stress in the crust had been re-distributed as magma migrated toward the summit. Furthermore, earthquake families at Mount Agung took on characteristics commonly observed during effusive phases of eruptions on 15 November—a full six days before the first phreatomagmatic eruption on 21 November 2017 and a full ten days prior to the first magmatic eruption on 25 November 2017.
It is feasible to conduct advanced analyses like this in near-real time thanks to the availability of high-quality open-source codes written by the seismology community in recent years. This study demonstrates how analyzing earthquake families can be used to improve future eruption-response efforts.
The data analyzed in this study is subject to the following licenses/restrictions: They may not be used without the permission of Indonesia’s Center for Volcanology and Geologic Hazard Mitigation. Requests to access these datasets should be directed tocHZtYmdAZXNkbS5nby5pZA==.
JW conducted the analysis. DK and SP helped guide the direction of the study, and SP made many contributions to the prose. All authors provided critical insights that shaped this work.
This work was born of the collaboration between Indonesia’s Center for Volcanology and Geologic Hazard Mitigation (CVGHM) and the Volcano Disaster Assistance Program (VDAP). CVGHM receives funding from the Ministry of Energy and Mineral Resources of the Republic of Indonesia, and VDAP receives funding from the USAID Bureau of Humanitarian Assistance and the USGS Volcano Hazards Program.
The authors declare that the research was conducted in the absence of any commercial or financial relationships that could be construed as a potential conflict of interest.
Jeremy Pesicek, Mike Poland, Jake Lowenstern, Alicia Hotovec-Ellis, and Aaron Wech provided feedback on the manuscript that improved the quality of this work. Thoughtful reviews from Wes Thelen and two journal reviewers also improved the final product. We’d like to thank Alicia Hotovec-Ellis for answering questions about REDPy and maintaining the code. Numerous people provided support in the field and the office during the crisis in 2017–2018 that facilitated the response to the eruption and ultimately made this work possible.
The Supplementary Material for this article can be found online at: https://www.frontiersin.org/articles/10.3389/feart.2021.653164/full#supplementary-material
Supplementary Figure 1 | This figure shows the waveform similarity within a given family and the dissimilarity of waveforms across families. The top of the figure shows a zoomed in look (∼5 sec) of all waveforms from station TMKS (Figure 1) that make up Family #78. This is a family of 21 low-frequency earthquakes that occurred on 25 November roughly coincident with the onset of lava extrusion at the surface (Figure 2). The thick black line represents the stack from station TMKS, and the think grey lines show each individual earthquake in the family. The bottom of the figure shows the stacked waveform for the largest earthquake families in the study (20+ members). Each stack was computed from station TMKS. The family number (corresponding to the y-axis on Figure 2) is listed to the left of each waveform, and the frequency index for the stack at TMKS is listed to the right of each waveform. In this study, a frequency index above 0 indicates a volcano-tectonic earthquake, and a frequency index below 0 indicates a low-frequency earthquake. See text for details. All signals were band-pass filtered between 1–10 Hz on station TMKS before being stacked.
1All dates and times are UTC+8, “SGT” unless noted otherwise.
4https://volcanoes.usgs.gov/software/swarm/index.shtml
Albino, F., Biggs, J., and Syahbana, D. K. (2018). Dyke Intrusion between Neighbouring Arc Volcanoes Responsible for 2017 Pre-eruptive Seismic Swarm at Agung. Nat. Commun. 10 (1), 748. doi:10.1038/s41467-019-08564-9
Arámbula-Mendoza, R., Lesage, P., Valdés-González, C., Varley, N. R., Reyes-Dávila, G., and Navarro, C. (2011). Seismic activity that accompanied the effusive and explosive eruptions during the 2004-2005 period at Volcán de Colima, Mexico. J. Volcanol. Geothermal Res. 205 (1–2), 30–46. doi:10.1016/j.jvolgeores.2011.02.009
Barton, C. A., Zoback, M. D., and Moos, D. (1995). Fluid Flow along Potentially Active Faults in Crystalline Rock. Geol, 23(8), 683. doi:10.1130/0091-7613(1995)023<0683:FFAPAF>2.3.CO;2
Boué, A., Lesage, P., Cortés, G., Valette, B., and Reyes-Dávila, G. (2015). Real-time Eruption Forecasting Using the Material Failure Forecast Method with a Bayesian Approach. J. Geophys. Res. Solid Earth 120 (4), 2143–2161. doi:10.1002/2014jb011637
Budi-Santoso, A., and Lesage, P. (2016). Velocity Variations Associated with the Large 2010 Eruption of Merapi Volcano, Java, Retrieved from Seismic Multiplets and Ambient Noise Cross-Correlation. Geophys. J. Int. 206 (1), 221–240. doi:10.1093/gji/ggw145
Buurman, H., West, M. E., and Roman, D. C. (2013). Using Repeating Volcano-Tectonic Earthquakes to Track Post-eruptive Activity in the Conduit System at Redoubt Volcano, Alaska. Geology 41 (4), 511–514. doi:10.1130/g34089.1
Buurman, H., and West, M. E. (2010). “Seismic Precursors to Volcanic Explosions during the 2006 Eruption of Augustine Volcano,” in The 2006 Eruption of Augustine Volcano, Alaska. Editors J. A. Power, M. L. Coombs, and J. T. Freymueller (U.S. Geological Survey). Chapter 2.
Cameron, C. E., Prejean, S. G., Coombs, M. L., Wallace, K. L., Power, J. A., and Roman, D. C. (2018). Alaska Volcano Observatory Alert and Forecasting Timeliness: 1989–2017. Front. Earth Sci. 6, 86. doi:10.3389/feart.2018.00174
Caplan-Auerbach, J., and Petersen, T. (2005). Repeating Coupled Earthquakes at Shishaldin Volcano, Alaska. J. Volcanology Geothermal Res. 145 (1–2), 151–172. doi:10.1016/j.jvolgeores.2005.01.011
Chouet, B. A. (1996). “New Methods and Future Trends in Seismological Volcano Monitoring,” in Monitoring and Mitigation of Volcano Hazards. Editors R. Scarpa, and R. I. Tilling (Berlin: Springer), 23–97. doi:10.1007/978-3-642-80087-0_2
Chouet, B. A., Page, R. A., Stephens, C. D., Lahr, J. C., and Power, J. A. (1994). Precursory Swarms of Long-Period Events at Redoubt Volcano (1989-1990), Alaska: Their Origin and Use as a Forecasting Tool. J. Volcanol. Geothermal Res. 62 (1–4), 95–135. doi:10.1016/0377-0273(94)90030-2
Deshon, H. R., Thurber, C. H., and Power, J. A. (2010). Earthquake Waveform Similarity and Evolution at Augstine Volcano from 1993 to 2006. in The 2006 Eruption of Augustine Volcano, Alaska. Editors J. A. Power, M. L. Coombs, and J. T. Freymueller (U.S. Geological Survey Professional Paper 1769). Chapter 5
Dmitrieva, K., Hotovec-Ellis, A. J., Prejean, S., and Dunham, E. M. (2013). Frictional-faulting Model for Harmonic Tremor before Redoubt Volcano Eruptions. Nat. Geosci 6 (8), 652–656. doi:10.1038/ngeo1879
Dziewonski, A. M., Chou, T.-A., and Woodhouse, J. H. (1981). Determination of Earthquake Source Parameters from Waveform Data for Studies of Global and Regional Seismicity. J. Geophys. Res. 86, 2825–2852. doi:10.1029/JB086iB04p02825
Ekström, G., Nettles, M., and Dziewoński, A. M. (2012). The Global CMT Project 2004-2010: Centroid-Moment Tensors for 13,017 Earthquakes. Phys. Earth Planet. Interiors 200-201, 1–9. doi:10.1016/j.pepi.2012.04.002
Endo, E. T., Malone, S. D., Noson, L. L., and Weaver, C. S. (1981). “Locations, Magnitudes, and Statistics of the March 20–May 18 Earthquake Sequence,” in The 1980 Eruption of Mount St. Helens. Editors P. W. Lipman, and D. R. Mullineaux (Washington, U.S: Geological Survey Professional Paper 1250).
Endo, E. T., and Murray, T. (1991). Real-time Seismic Amplitude Measurement (RSAM): a Volcano Monitoring and Prediction Tool. Bull. Volcanol 53 (7), 533–545. doi:10.1007/bf00298154
Geller, R. J., and Mueller, C. S. (1980). Four Similar Earthquakes in Central California. Geophys. Res. Lett. 7 (10), 821–824. doi:10.1029/gl007i010p00821
Green, D. N., and Neuberg, J. (2006). Waveform Classification of Volcanic Low-Frequency Earthquake Swarms and its Implication at Soufrière Hills Volcano, Montserrat. J. Volcanology Geothermal Res. 153 (1–2), 51–63. doi:10.1016/j.jvolgeores.2005.08.003
Harlow, D. H., Power, J. A., Laguerta, E. P., Ambubuyog, G., White, R. A., and Hoblitt, R. P. (1996). “Precursory Seismicity and Forecasting of the June 15, 1991, Eruption of Mount Pinatubo,” in Fire and Mud: Eruptions and Lahars of Mount Pinatubo, Philippines. Editors C. G. Newhall, and R. S. Punongbayan (University of Washington Press).
Hotovec-Ellis, A. J., and Jeffries, C. (2016). Near Real-Time Detection, Clustering, and Analysis of Repeating Earthquakes: Application to Mount St. Helens and Redoubt Volcanoes. Available at: https://github.com/ahotovec/REDPy (Accessed December 31, 2019).
Iverson, R. M., Dzurisin, D., Gardner, C. A., Gerlach, T. M., LaHusen, R. G., Lisowski, M., et al. (2006). Dynamics of Seismogenic Volcanic Extrusion at Mount St Helens in 2004-05. Nature 444 (7118), 439–443. doi:10.1038/nature05322
Klein, F. W. (1984). Eruption Forecasting at Kilauea Volcano, Hawaii. J. Geophys. Res. 89, 3059-3074. doi:10.1029/JB089iB05p03059
Kusmandinata, (1964). The Eruption of the Agung Volcano in Bali in 1963. Bull. Geol.Surv. Indonesia (1.1), 12–15.
Lyons, J. J., Haney, M. M., Werner, C., Kelly, P., Patrick, M., Kern, C., et al. (2016). Long Period Seismicity and Very Long Period Infrasound Driven by Shallow Magmatic Degassing at Mount Pagan, Mariana Islands. J. Geophys. Res. Solid Earth 121 (1), 188–209. doi:10.1002/2015jb012490
Malone, S. D., Boyko, C., and Weaver, C. S. (1983). Seismic Precursors to the Mount St. Helens: Eruptions in 1981 and 1982. Science 221 (4618), 1376–1378. doi:10.1126/science.221.4618.1376
Matoza, R. S., Chouet, B. A., Dawson, P. B., Shearer, P. M., Haney, M. M., Waite, G. P., et al. (2015). Source Mechanism of Small Long-Period Events at Mount St. Helens in July 2005 Using Template Matching, Phase-Weighted Stacking, and Full-Waveform Inversion. J. Geophys. Res. Solid Earth 9 (120), 6351–6364. doi:10.1002/2015JB012279
Matoza, R. S., and Chouet, B. A. (2010). Subevents of Long-Period Seismicity: Implications for Hydrothermal Dynamics during the 2004–2008 Eruption of Mount St. Helens. J. Geophys. Res. 115 (B12), B12206. doi:10.1029/2010jb007839
McCausland, W. A., Gunawan, H., White, R. A., Indrastuti, N., Patria, C., Suparman, Y., et al. (2019). Using a Process-Based Model of Pre-eruptive Seismic Patterns to Forecast Evolving Eruptive Styles at Sinabung Volcano, Indonesia. J. Volcanology Geothermal Res. 382, 253–266. doi:10.1016/j.jvolgeores.2017.04.004
McNutt, S. R. (1996). “Seismic Monitoring and Eruption Forecasting of Volcanoes: A Review of the State-Of-The-Art and Case Histories,” in Monitoring and Mitigation of Volcano Hazards. Editors R. Scarpa, and R. I. Tilling (Berlin: Springer), 99–146. doi:10.1007/978-3-642-80087-0_3
Minakami, T. (1974). “Seismology of Volcanoes in Japan,” in Physical Volcanology. Editors L. Civetta, P. Gasparini, G. Luongo, and A. Rapolla (Berlin: Amsterdam), 6, 1–27. doi:10.1016/b978-0-444-41141-9.50007-3
Molina, I., Kumagai, H., García-Aristizábal, A., Nakano, M., and Mothes, P. (2008). Source Process of Very-Long-Period Events Accompanying Long-Period Signals at Cotopaxi Volcano, Ecuador. J. Volcanol. Geothermal Res. 176 (1), 119–133. doi:10.1016/j.jvolgeores.2007.07.019
Power, J. A., and Lalla, D. J. (2010). “Seismic Observations of Augustine Volcano, 1970-2007,” in The 2006 Eruption of Augustine Volcano, Alaska. Editors J. A. Power, M. L. Coombs, and J. T. Freymueller (U.S. Geological Survey Professional Paper 1769).Chapter 1
Rodgers, M., Roman, D. C., Geirsson, H., LaFemina, P., McNutt, S. R., Muñoz, A., et al. (2015). Stable and Unstable Phases of Elevated Seismic Activity at the Persistently Restless Telica Volcano, Nicaragua. J. Volcanol. Geothermal Res. 290, 63–74. doi:10.1016/j.jvolgeores.2014.11.012
Rodgers, M., Roman, D. C., Geirsson, H., LaFemina, P., Muñoz, A., Guzman, C., et al. (2013). Seismicity Accompanying the 1999 Eruptive Episode at Telica Volcano, Nicaragua. J. Volcanol. Geothermal Res. 265, 39–51. doi:10.1016/j.jvolgeores.2013.08.010
Rowe, C., Thurber, C., and White, R. (2004). Dome Growth Behavior at Soufriere Hills Volcano, Montserrat, Revealed by Relocation of Volcanic Event Swarms, 1995–1996. J. Volcanol. Geothermal Res. 134 (3), 199–221. doi:10.1016/j.jvolgeores.2004.01.008
Ruppert, N. A., Prejean, S. G., and Hansen, R. A. (2011). Seismic Swarm Associated with the 2008 Eruption of Kasatochi Volcano, Alaska: Earthquake Locations and Source Parameters. J. Geophys. Res. Solid Earth 116 (B2), 1–8. doi:10.1029/2010JB007435@10.1002/(ISSN)2169-8996
Sahara, D. P., Rahsetyo, P. P., Nugraha, A. D., Syahbana, D. K., Widiyantoro, S., Zulfakriza, Z., et al. (2021). Use of Local Seismic Network in Analysis of Volcano-Tectonic (VT) Events Preceding the 2017 Agung Volcano Eruption. Front. Earth Sci.. This issue. 10.3389/feart.2021.619801.
Soosalu, H., Einarsson, P., and Porbjarnardóttir, B. S. (2005). Seismic Activity Related to the 2000 Eruption of the Hekla Volcano, Iceland. Bull. Volcanol. 68 (1), 21–36. doi:10.1007/s00445-005-0417-7
Stephens, C. D., and Chouet, B. A. (2001). Evolution of the December 14, 1989 Precursory Long-Period Event Swarm at Redoubt Volcano, Alaska. J. Volcanol. Geothermal Res. 109 (1–3), 133–148. doi:10.1016/s0377-0273(00)00308-5
Supendi, P., Nugraha, A. D., Widiyantoro, S., Pesicek, J. D., Thurber, C. H., Abdullah, C. I., et al. (2020). Relocated Aftershocks and Background Seismicity in Eastern Indonesia Shed Light on the 2018 Lombok and Palu Earthquake Sequences. Geophys. J. Int. 221 (3), 1845–1855. doi:10.1093/gji/ggaa118
Swanson, D. A., Casadevall, T. J., Dzurisin, D., Holcomb, R. T., Newhall, C. G., Malone, S. D., et al. (1985). Forecasts and Predictions of Eruptive Activity at Mount St. Helens, USA: 1975-1984. J. Geodynamics 3 (3–4), 397–423. doi:10.1016/0264-3707(85)90044-4
Syahbana, D. K., Kasbani, K., Suantika, G., Prambada, O., Andreas, A. S., Saing, U. B., et al. (2019). The 2017–19 Activity at Mount Agung in Bali (Indonesia): Intense Unrest, Monitoring, Crisis Response, Evacuation, and Eruption. Sci. Rep. 9 (1), 8848. doi:10.1038/s41598-019-45295-9
Thelen, W., Malone, S., and West, M. (2011). Multiplets: Their Behavior and Utility at Dacitic and Andesitic Volcanic Centers. J. Geophys. Res. 116 (B8), B08210. doi:10.1029/2010jb007924
Townend, J., and Zoback, M. D. (2000). How Faulting Keeps the Crust Strong. Geology 28 (5), 399. doi:10.1130/0091-7613(2000)28<399:HFKTCS>2.0.CO;2
Umakoshi, K., Takamura, N., Shinzato, N., Uchida, K., Matsuwo, N., and Shimizu, H. (2008). Seismicity Associated with the 1991–1995 Dome Growth at Unzen Volcano, Japan. J. Volcanol. Geothermal Res. 175 (1–2), 91–99. doi:10.1016/j.jvolgeores.2008.03.030
Voight, B. (1988). A Method for Prediction of Volcanic Eruptions. Nature 332 (6160), 125–130. doi:10.1038/332125a0
Waite, G. P., Chouet, B. A., and Dawson, P. B. (2008). Eruption Dynamics at Mount St. Helens Imaged from Broadband Seismic Waveforms: Interaction of the Shallow Magmatic and Hydrothermal Systems. J. Geophys. Res. 113 (B2), B02305. doi:10.1029/2007jb005259
White, R. A., and McCausland, W. A. (2019). A Process-Based Model of Pre-eruption Seismicity Patterns and its Use for Eruption Forecasting at Dormant Stratovolcanoes. J. Volcanol. Geothermal Res. 382, 267–297. doi:10.1016/j.jvolgeores.2019.03.004
White, R. A., and McCausland, W. A. (2016). Volcano-tectonic Earthquakes: A New Tool for Estimating Intrusive Volumes and Forecasting Eruptions. J. Volcanol. Geothermal Res. 309, 139–155. doi:10.1016/j.jvolgeores.2015.10.020
Keywords: volcano seismology, repeating earthquakes, cross-correlaion, eruption forecasting, intrusion seismogenesis, seismic precursor, agung volcano
Citation: Wellik JJ, Prejean SG and Syahbana DK (2021) Repeating Earthquakes During Multiple Phases of Unrest and Eruption at Mount Agung, Bali, Indonesia, 2017. Front. Earth Sci. 9:653164. doi: 10.3389/feart.2021.653164
Received: 13 January 2021; Accepted: 29 April 2021;
Published: 17 May 2021.
Edited by:
Jessica Helen Johnson, University of East Anglia, United KingdomReviewed by:
Patrick J Smith, Dublin Institute for Advanced Studies (DIAS), IrelandCopyright © 2021 Wellik, Prejean and Syahbana. This is an open-access article distributed under the terms of the Creative Commons Attribution License (CC BY). The use, distribution or reproduction in other forums is permitted, provided the original author(s) and the copyright owner(s) are credited and that the original publication in this journal is cited, in accordance with accepted academic practice. No use, distribution or reproduction is permitted which does not comply with these terms.
*Correspondence: John J. Wellik, andlbGxpa0B1c2dzLmdvdg==
Disclaimer: All claims expressed in this article are solely those of the authors and do not necessarily represent those of their affiliated organizations, or those of the publisher, the editors and the reviewers. Any product that may be evaluated in this article or claim that may be made by its manufacturer is not guaranteed or endorsed by the publisher.
Research integrity at Frontiers
Learn more about the work of our research integrity team to safeguard the quality of each article we publish.