 Alcides Nóbrega Sial1*
 Jiubin Chen2*
 Christoph Korte3
 Manoj Kumar Pandit4
 Jorge E. Spangenberg5
 Juan Carlos Silva-Tamayo6
 Luiz Drude de Lacerda7Valderez Pinto Ferreira1José Antônio Barbosa1Claudio Gaucher8Natan Silva Pereira9Paulo Ricardo Riedel1
- 1Department of Geology, NEG–LABISE, UFPE, Recife, Brazil
- 2School of Earth System Science, Tianjin University, Nankai, China
- 3Nordic Center for Earth Evolution (NordCEE), Department Geosciences and Natural Resource Management, University of Copenhagen, Copenhagen, Denmark
- 4Department of Geology, University of Rajasthan, Jaipur, India
- 5Institute of Earth Surface Dynamics, University of Lausanne, Lausanne, Switzerland
- 6One-Health Research Group, Testlab Laboratorio Analisis Alimentos y Aguas SAS, Medellin, Colombia
- 7LABOMAR, Institute of Marine Sciences, UFC, Fortaleza, Brazil
- 8Instituto de Ciencias Geológicas, Facultad de Ciencias, Universidad de La República, Montevideo, Uruguay
- 9Department of Biology, State University of Bahia, Campus VIII, Paulo Afonso, Brazil
High-resolution organic carbon isotope (δ13C), Hg concentration and Hg isotopes curves are presented for the Permian-Triassic boundary (PTB) sections at Guryul Ravine (India) and Meishan D (China). The total organic carbon (TOC)-normalized Hg concentrations reveal more intense environmental changes at the Latest Permian Mass Extinction (LPME) and the earliest Triassic Mass Extinction (ETME) horizons coinciding with major δ13C shifts. To highlight palaeoredox conditions we used redox-sensitive elements and Rare Earth Element distribution. At Meishan, three Hg/TOC spikes (I, II, and III) are observed. Spike I remains after normalization by total aluminum (Al), but disappears when normalized by total sulfur (TS). Spike III, at the base of Bed 26, corresponds with excursions in the Hg/TS and Hg/Al curves, indicating a change in paleoredox conditions from anoxic/euxinic in the framboidal pyrite-bearing sediments (Bed 26) to oxygenated sediments (Bed 27). At Guryul Ravine, four Hg/TOC spikes were observed: a clear spike I in Bed 46, spike II at the base of the framboidal pyrite-rich Bed 49, spike III at the PTB, and spike IV at the LPME horizon. Some of these Hg/TOC spikes disappear when TS or Al normalization is applied. The spike I remains in the Hg/TS and Hg/Al curves (oxic conditions), spike II only in the Hg/TS curve (anoxic/euxinic), and spikes III and IV only in Hg/Al curves (oxic). In both sections, Hg deposition was organic-matter bound, the role of sulfides being minor and locally restricted to framboidal pyrite-bearing horizons. Positive mass-independent fractionation (MIF) for Hg odd isotopes (odd-MIF) was observed in pre-LPME samples, negative values in the LPME–PTB interval, and positive values above the ETME horizon. Most Hg-isotope patterns are probably controlled by the bathymetry of atmospheric Hg-bearing deposits. The source of Hg can be attributed to the Siberian Traps Large Igneous Province (STLIP). In the LPME-PTB interval, a complex of STLIP sills (Stage 2) intruded coal-bearing sediments. The negative δ202Hg, the mercury odd-MIF Δ201Hg patterns, and the Δ199Hg–Hg plot in both sections are compatible with volcanic mercury deposition. Our study shows the strength of Hg/TOC ratios as paleoenvironmental proxy and as a tool for stratigraphic correlation.
Introduction
Major Phanerozoic mass extinctions seem to be coeval with the volcanic activity of Large Igneous Provinces (LIPs; e.g., Courtillot, 1994), a correlation that was observed in several studies (e.g., Courtillot et al., 1999; Wignall, 2001; Courtillot and Renne, 2003; Kravchinsky, 2012; Bond and Wignall, 2014; Bond and Grasby, 2017). The major challenges in demonstrating the linkage between the five major Phanerozoic mass extinctions (Raup and Sepkoski, 1982) and LIP eruptions reside in the lack of accurate radiometric dating of LIP volcanic rocks and of sedimentary rocks, which recorded abrupt biological and environmental changes leading to mass extinctions (Grasby et al., 2019). However, recent advances on the radiometric dating of LIP volcanism (e.g., Burgess et al., 2014; Burgess and Bowring, 2015; Renne et al., 2015; Schoene et al., 2015; Schoene et al., 2019; Sprain et al., 2019) have strengthened the connection between LIP volcanism and mass extinction.
Recent studies show that Mercury (Hg) in sedimentary successions is a robust proxy of massive volcanism in periods of extreme environmental turnover (e.g., Sial et al., 2010, Sial et al., 2013, Sial et al., 2014, Sial et al., 2016, Sial et al., 2019, Sial et al., 2020a, Sial et al., 2020b; Nascimento-Silva et al., 2011; Nascimento-Silva et al., 2013; Sanei et al., 2012; Grasby et al., 2015a; Grasby et al., 2017; Grasby et al., 2019; Grasby et al., 2020; Percival et al., 2015; Percival et al., 2017; Percival et al., 2018; Adatte et al., 2015; Font et al., 2016; Jones et al., 2017; Gong et al., 2017; Thibodeau et al., 2016; Thibodeau and Bergquist, 2017; Charbonnier et al., 2017; Sabatino et al., 2018; Burger et al., 2019; Meyer et al., 2019; Shen et al., 2019a,b,c, Shen et al., 2020; Them et al., 2019; Keller et al., 2020; Georgiev et al., 2020). Mercury enrichments across some chronological boundaries, expressed as an increase in the Hg to total organic carbon ratio (Hg/TOC), may represent true volcanogenic Hg loading to the environment (e.g., Sanei et al., 2012; Grasby et al., 2013; Percival et al., 2015; references therein). Therefore, the search for Hg/TOC spikes across major chronostratigraphic boundaries has been expanded to the whole Phanerozoic Eon (e.g., Grasby et al., 2013; Grasby et al., 2015b; Grasby et al., 2017; Grasby et al., 2019; Grasby et al., 2020; Bond and Grasby, 2017; Gong et al., 2017; Jones et al., 2017; Percival et al., 2015, 2017, 2018; Burger et al., 2019; Korte et al., 2019; Shen et al., 2019a,b,c, 2020; Sial et al., 2016; Sial et al., 2019; Sial et al., 2020a; Sial et al., 2020b; Faggetter et al., 2019; Kwon et al., 2019). Despite the growing application of Hg chemostratigraphy as a proxy for LIP activity in sedimentary successions, only a few studies have used Hg isotopes as an additional tool to demonstrate the volcanogenic origin of Hg enrichments (e.g., Sial et al., 2014; Sial et al., 2016; Sial et al., 2019; Sial et al., 2020a; Sial et al., 2020b; Thibodeau et al., 2016; Thibodeau and Bergquist, 2017; Grasby et al., 2017; Grasby et al., 2019; Gong et al., 2017; Wang et al., 2018; Them et al., 2019; Shen et al., 2019a,b,c; Shen et al., 2020).
Causes of the Permian–Triassic Mass Extinction
The most severe biodiversity decline of the eukaryotic biota in Earth history took place at 251.9 Ma (e.g., Erwin et al., 2002; Benton, 2003; Chen and Benton, 2012; Burgess et al., 2014; Burgess and Bowring, 2015; Renne et al., 2015). This mass extinction caused the death of over 90% of all marine and about 70% of all terrestrial species (e.g., Erwin, 2006). The event is known as the P–Tr extinction, the P–T extinction, End-Permian Mass Extinction (EPME), Latest Permian Mass Extinction (LPME), and informally the “Great Dying”. Several causes have been invoked to explain this mass extinction and, among them, shallow oceanic water anoxia, bolide impact, and volcanism seem to be the main ones.
A widespread episode of oceanic photic-zone anoxia has been widely documented in PTB sections through the presence of framboidal pyrite, regarded as evidence of anoxia/euxinia (Bond and Wignall, 2010). Notable among these are the sections in Greenland and Sosio Valley (Wignall and Twitchett, 2002), southwestern Japan (Isozaki, 1997), Italy and Slovenia (Wignall and Twitchett, 1996), Kashmir in northern India (Wignall et al., 2005; Huang Y. et al., 2019) and British Columbia, Canada (Wignall and Newton, 2003; Bond and Wignall, 2010). A worldwide dysoxic marine event during the P–Tr transition, suggested by Shen et al. (2007) in a study of the size/distribution of framboidal pyrite at the Meishan section, seems to reinforce a close relationship between oxygen availability and the marine LPME. This episode of oceanic photic anoxia may have lasted 10 Myr, and is regarded as one prime cause of the P–Tr marine biotic crisis (Wignall and Hallam, 1992; Isozaki, 1997; Krystyn et al., 2003; Lehrmann et al., 2003; Wignall et al., 2005; Shen et al., 2007; Song et al., 2014; Kaiho et al., 2016; Kumar et al., 2017; Huang Y. et al., 2019) and named “superanoxic event” (Isozaki, 1997; Grice et al., 2005).
Wignall and Newton (2003) proposed that the LPME is diachronous by ≥ 0.5 Myr with the late Changxingian extinction in Panthalassa, coinciding with the diversity increase that led to the migration of warm-water taxa into the high southerly paleolatitudinal regions of the Neotethys Ocean. These authors suggest that during the Changxingian extinction in Panthalassa, there was a decline in the seafloor oxygen availability (absence of bioturbation and presence of framboidal pyrite), followed by euxinic conditions in the latest Changxingian and Early Triassic (e.g., Ursula Creek, British Columbia). However, in the Selong PTB section in South Tibet, a recorded regression and erosion in the mid-Changxingian was followed by a deepening in the late Changxingian and across the P–Tr transition. The latter is marked by an increase in faunal diversity, suggesting warming conditions without suffering marine extinction. Permian remnants perished only in the disoxic, thinly bedded and pyrite-rich limestone level of the late Griesbachian (Wignall and Newton, 2003).
During the P–Tr transition, equatorial and higher-paleolatitude settings displayed a zonation with severe anoxia prevailing in the former setting and less intense and short-lived anoxia recorded in the latter (Bond and Wignall, 2010). These authors inferred from the analysis of the size of framboidal pyrite that: a) intense anoxia with euxinia developed throughout the P–Tr interval from the Boreal and the Neotethys oceans, and dysoxia, in relatively shallow-water settings above the storm wave base; b) dysoxic conditions with rare euxinia, in contrast, widely developed over a range of water depths (including shallow ones), at equatorial paleolatitudes; c) a complex and unstable redox history was recorded in western and eastern Tethyan locations, with the ventilation of anoxic environments (Hindeodus praeparvus Zone) during the P–Tr interval (H. changxingensis to H. parvus zones), returning later to oxygen-poor environments (Isarcicella isarcica Zone). The extent and timing of anoxia in Gondwana during the P–Tr transition is poorly documented (Huang Y. et al., 2019). Kaiho et al. (2016) proposed that at low latitudes, an increase in temperature triggered soil erosion and a gradual change from a well-mixed oxic to a stratified euxinic ocean before the LPME. At the ETME, about 60 kyr later, anoxia in nearshore surface waters and anoxia/euxinia in shallow-intermediate waters lasted for almost 1 Myr. In a marine PTB section at Nhi Tao, Vietnam, a series of pyritic horizons characterized by low pyrite sulfur isotope ratios (δ34S) and low carbon isotope ratios of carbonates (δ13Ccarb), with the first pyritic horizon coinciding with the LPME, suggest upwelling of toxic deep waters as a major process at the P–Tr transition (Algeo et al., 2008).
Anoxia responsible for the global PTB biodiversity crisis may have been caused by global warming linked to LIP eruptions (Bond et al., 2020). The toxic effect of volatile-rich mafic lavas or sill-type intrusions depends on the size of the igneous province, geological setting of the host region, magma plumbing system, and eruption dynamics that control the magnitude and composition of the thermogenic outgassing (Racki, 2020). Therefore, it was suggested that the extensive volcanism of the Siberian Traps Large Igneous Province (STLIP) was likely the main trigger of the PTB biodiversity crisis (e.g., Campbell et al., 1992; Yin et al., 1992, 2007; Renne et al., 1995; Bowring et al., 1998; Courtillot et al., 1999; Lo et al., 2002; Kamo et al., 2003; Grard et al., 2005; Reichow et al., 2009; Korte et al., 2010; Burger et al., 2019). Mercury anomalies have been described globally from several Permian-Triassic sections, implying extensive volcanism during the Permian-Triassic transition (Grasby et al., 2017; Shen et al., 2019b; Sial et al., 2020a; Sial et al., 2020b).
The atmospheric CO2 partial pressure largely increased during STLIP eruptions at the end-Permian (252 Ma ago). This increase may have triggered ocean acidification across the LPME, as suggested by calcium and boron isotopes (Payne et al., 2010; Hinojosa et al., 2012; Clarkson et al., 2015; Silva-Tamayo et al., 2018) and U isotopes (Lau et al., 2016), stressing the ocean biota. This possibility was evaluated by Kershaw et al. (2012) by comparing past and modern ocean acidifications, the latter one raised by the rapid current increase in atmospheric CO2. However, these authors concluded that large increases in CO2 in the past may have occurred over sufficient time to allow assimilation into the oceans, and acidification may not have stressed ocean biota to the present extent.
Studies on LPME sites suggest that the mass extinction occurred rather abruptly. Similar to the mass extinction recorded at the Cretaceous–Paleogene (K/Pg) boundary, one or multiple asteroid or comet impacts were invoked as potential triggers of the LPME (Retallack et al., 1998). The Tethyan realm was the main focus of investigation of this hypothesis which was based on the following observations: a) iridium enrichment and occurrence of microspherules near the Permian–Triassic Boundary (PTB) (Xu and Zheng, 1993), b) shocked quartz (Retallack et al., 1998), c) fullerenes with trapped helium and argon with isotope ratios identical to carbonaceous chondrites (Becker et al., 2001), d) gigantic release of sulfur from the mantle by a bolide impact at the end-Permian (Kaiho et al., 2001, 2006), e) chondritic meteorite detritus (Basu et al., 2003), and f) a supposed 250 Ma impact crater (Becker et al., 2004). Altogether, this set of evidence has been questioned and discredited to a certain point (e.g., Glikson, 2004; Koeberl et al., 2004; Farley et al., 2005; Müller et al., 2005).
Finally, the P-Tr extinction entailed a substantial degradation of marine benthic communities and extreme reduction of sediment bioturbation, eradicating the sedimentary mixed layer at an interregional scale (Hofmann et al., 2015). The extinction of the infauna enhanced anoxia at the sediment-water interface and was probably one of the causes of the delayed recovery from the mass extinction during the Early Triassic.
Aims of the Study
This study aims to contribute toward a better understanding of the relationship between δ13C and Hg chemostratigraphy, reinforcing the use of the latter as a reliable proxy in global correlations, especially in the case of sedimentary sequences deposited coevally with LIP volcanism. It also contributes to the discussion on the normalization of Hg to Total Organic Carbon (TOC), total S (TS as a surrogate of pyrite content), or Al (i.e., surrogate of clay content) by providing valuable data regarding situations when marine deposition witnessed, besides coeval volcanism, a marine transgression accompanied by a redox change from oxic to anoxic-euxinic conditions. High-resolution δ13C and Hg chemostratigraphic patterns from the stratigraphically expanded, siliciclastic-dominated Guryul Ravine succession were compared with the trends from the Meishan GSSP limestone-dominated, condensed section. Concentrations of major, trace, and Rare Earth Elements (REE) and elemental ratios were used as paleoredox proxies and to evaluate the detrital input. Hg stratigraphic patterns were also contrasted with those from widely separated, classical PTB sections and Hg isotope ratios were used to unravel the source of the preserved Hg in the Guryul Ravine and Meishan sections.
Geological Settings
Meishan Succession Global Stratotype Section Point, China
The global stratotype section and point (GSSP) of the PTB has been defined at the base of the Hindeodus parvus horizon of the Meishan succession (base of bed 27c of the Meishan section) (Yin et al., 2001). This succession in Changxing County, Zhejiang Province, South China (Figure 1), has been subdivided into 115 beds (Li and Jones, 2017) and the PTB has an estimated radiometric age of 251.902 ± 0.024 Ma, according to Burgess et al. (2014). This condensed Tethyan carbonate-dominated section in which the GSSP was defined renders correlation between PTB sections difficult in high-resolution proxy studies, as the extinction interval (Beds 25–28) is only 0.36 m-thick (e. g., Baresel et al., 2017; Zuchuat et al., 2020).
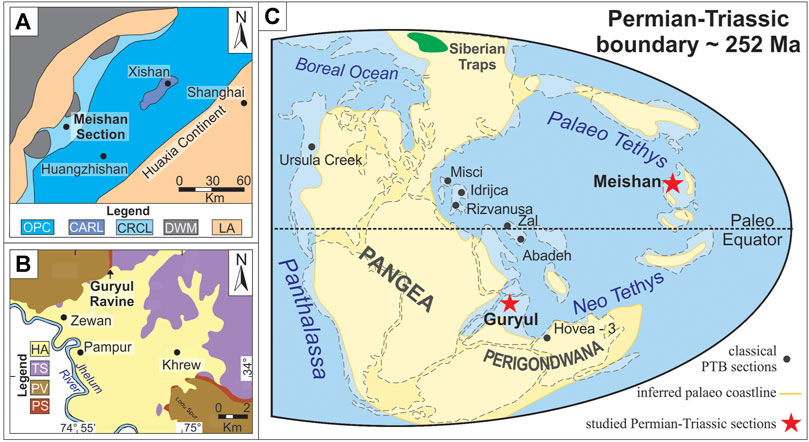
FIGURE 1. (A) Late Permian paleogeographic map for the Meishan D (GSSP) section, China (based on Wu et al., 1983; Cao et al., 2010; Li and Jones, 2017). (B) Guryul Ravine section, Kashmir (modified from Tewari et al., 2015) and (C) global palaeogeographical reconstruction for the Permian–Triassic transition and geographical location of Meishan GSSP and Guryul Ravine sections (modified from Sial et al., 2020a). (A) OPC = open platform carbonate, CARL = calcareous algal reef limestone, CRCL = carbonate ramp cherty limestone, DWM = deep-water mudstone, LA = land area. (B) HA = Holocene alluvium, TS = Triassic strata, PS = Permian strata, PV = Panjal Volcanics.
At Meishan, the biodiversity crisis which marked the LPME is marked just below Bed 25 by a significant loss of most fusulinids, ammonoids and many brachiopods (Jin et al., 2000; Yin et al., 2001; Erwin, 2006; Yin et al., 2007). The onset of biodiversity reduction started during the deposition of bed 22 (Jin et al., 2000; Yin et al., 2001; Yin et al., 2007) and coincides with a negative shift in conodonts δ44/40Ca values in this section. This shift was also observed in marine carbonates from several P–Tr sections elsewhere (Payne et al., 2010; Silva-Tamayo et al., 2018) and may reflect a major perturbation of the marine Ca cycle caused by ocean acidification (Hinojosa et al., 2012). The perturbation of the Ca isotope composition of seawater was probably a consequence of massive emission of volcanic CO2 into the P–Tr atmosphere by LIPs (e.g., Silva-Tamayo et al., 2018). The negative shift in conodont δ44/40Ca values was recorded up to the LPME (beds 25–26), and an additional one at the earliest Triassic Bed 28 concomitant with the ETME (Xie et al., 2005). A third ocean acidification event probably postdated the LPME by 60 kyr (Silva-Tamayo et al., 2018). These negative shifts of δ44/40Ca coincide with a major perturbation of the marine U isotope cycle, probably related to volcanism, ocean acidification and anoxia (Lau et al., 2016).
The extinction interval at the P–Tr transition may contain depositional hiatuses at the PTB or below (Cao and Zheng, 2007; 2009; Zheng et al., 2013; Shen et al., 2018), and corresponds to a maximum of 61 ± 48 kyr according to Burgess and Bowring (2015). The STLIP lava flows, sills, and explosively erupted rocks yielded U-Pb ages (Burgess and Bowring, 2015) that, coupled with biostratigraphic evidence, point to a single, brief catastrophic LPME event, confirming previous suggestions (Jin et al., 2000; Rampino et al., 2000; Shen et al., 2011; Wang et al., 2014). These results suggest that about 65% of the total lava/pyroclastic volume was erupted in about 300 kyr before and concurrent with the LPME, and eruptions continued for at least 500 kyr after the mass extinction ceased. Voluminous STLIP sills intruded into a shallow crust with huge amounts of carbon-rich sediments, probably inducing the most important killing mechanism in the LPME (stage 2, extrusive hiatus; Burgess et al., 2017).
Sulfur content and isotopic composition in pyrite near the PTB in the Meishan section have been determined by Jiang et al. (2006). Shen et al. (2007) were the first to report abundant pyrite framboids from the upper part of bed 24 and from beds 25, 26, and 29 (they are absent in bed 27), implying a dramatic decline in benthic oxygen levels during the LPME. Framboids from the Meishan succession display a narrow size distribution, with average diameters from 4.6 to 8.7 μm, typical of pyrite framboids formed under anoxic/dysoxic conditions. According to these authors, based on the abundance and size of these framboids, the redox conditions of deposition changed from upper dysoxia (bed 24e, uppermost Changhsing Formation) and lower dysoxia (pyrite lamina, beds 25 and 26, Yinkeng Formation) to oxygenation (bed 27), and again to upper dysoxia (Bed 28) and lower dysoxia (bed 29). A later study reported negative δ34S values and negative Δ33S in pyrites from Meishan, hinting at an origin from sulfate-deficient waters, probably related to a near-shutdown of bioturbation, due to shoaling of anoxic water during the LPME (Shen et al., 2011). Recently, Wei et al. (2020) reported two gradual, negative δ13Ccarb shifts before and after the PTB. These authors suggest that the Late Permian ocean redox conditions varied through three successive oxic–dysoxic, dysoxic–euxinic, and high-frequency euxinic stages. Oxic and high-frequency euxinic events occurred in the early Griesbachian and middle Griesbachian, respectively. The short-term euxinic events were not associated with the negative δ13Ccarb excursions. The secular trends of aromatic hydrocarbons diagnostic of anoxygenic green sulfur bacteria point to periods when euxinic conditions extended into the photic zone during the entire Changhsingian stage (Cao et al., 2009).
Guryul Ravine Succession, India
The PTB Guryul Ravine section near Srinagar in the Kashmir region in north India (Figure 1) was a candidate for the GSSP before the selection of Meishan D (e.g., Kapoor, 1996; Yin et al., 2001). Kashmir was once a part of the Gondwana supercontinent at the southern side of the Paleotethys Ocean and adjacent to Oman during the late Paleozoic (Brookfield et al., 2013). Widespread marine transgression in northern India (e.g., Kapoor, 1992; Garzanti et al., 1998) followed the rapid subsidence of the northern Gondwana margin with separation of tectonic blocks and opening of the Neotethys Ocean (e.g., Brookfield, 1993; Garzanti et al., 1996; Brookfield et al., 2013, 2019). The Guryul Ravine section and the Spiti Valley, another remnant of the peri-Gondwanan shelf in India (Ghosh et al., 2016), are probably the two best geologically documented Neotethys Ocean PTB sections in India. Geological and paleoredox aspects of the Guryul Ravine and the Spiti sections are well documented (e.g., Murata, 1981; Matsuda, 1981, 1982, 1983, 1984; Brookfield et al., 2003, 2013, 2019; Wignall et al., 2005; Algeo et al., 2007; Korte et al., 2010; Tewari et al., 2015; Ghosh et al., 2016; Kumar et al., 2017; Huang Y. et al., 2019), resulting in significant advances in the sedimentological and biostratigraphical understanding of these two sections. These Tethyan sedimentary successions in Kashmir have experienced greenschist-facies metamorphism (Herren, 1987; Dèzes, 1999; Algeo et al., 2007).
The deposition of the Guryul Ravine succession occurred at moderate sedimentation rates (∼10–20 m Myr−1: Algeo et al., 2007) in an outer-shelf or deep-ramp setting in the Neotethys (Brookfield et al., 2003; Wignall et al., 2005; Algeo et al., 2007; Baud and Bhat, 2014). About 15 m-thick siliceous shales of the Gangamopteris-beds cover flood basalts of the 289 Ma-old Panjal Traps (Shellnutt et al., 2011, 2014) and are covered, in turn, by the 100 m-thick Zewan Formation. Based on the variation in carbonate content, this formation was subdivided into four members (A–D) and the overlying Khunamuh Formation, into six members (E–J) according to Nakazawa et al. (1975). The Guryul Ravine section exhibits gradual faunal changes across the PTB, similar to the other Neotethys P–Tr sections (e.g., Nakazawa et al., 1970; Teichert et al., 1970; Nakazawa and Kapoor, 1981; Sheng et al., 1984; Brookfield et al., 2013, 2019; Baud and Bhat, 2014). Conodont biostratigraphy of this section can be found in Murata (1981), Matsuda (1981, 1982, 1983, 1984), and Wignall et al. (1996). Tewari et al. (2015) found evidence of depauperate pollen and spore assemblages in the uppermost Zewan Formation and a rich palynoflora in the basal Khunamuh Formation. Whereas in the GSSP Meishan section the LPME and the PTB horizons are separated by 0.36 m, in the Guryul Ravine there is a stratigraphically expanded P–Tr transition with the two horizons separated by ∼2.60 m (Algeo et al., 2007) or 3.10 m (Shen et al., 2011; Brookfield et al., 2013). Therefore, the study of different events within the P–Tr transition is considerably easier at Guryul Ravine section. The LPME horizon encompasses the top of the Zewan Formation (bed 46) and the base of the Khunamuh Formation (bed 47). The PTB, in turn, is recorded at the top of bed 51 and the base of bed 52, within the Khunamuh Formation (Algeo et al., 2007).
Correlation Between Guryul Ravine and Meishan Sections
Correlations between biostratigraphic patterns of the Guryul Ravine and Meishan sections were reported previously (Chen et al., 2005; Algeo et al., 2007; Brookfield et al., 2013). The Guryul Ravine beds D43–D46-1 correlate with bed 24 at the Meishan section, and Guryul Ravine beds D46-3–E51 match beds 25–27 at Meishan (Chen et al., 2005). The Guryul Ravine section displays, similar to the Meishan section, an extinction pattern with the largest extinction rate between the LPME and the PTB and a less intense rate at the ETME (Algeo et al., 2007). The main extinction event in this section is recorded in Unit E1 (bed 47) and the less intense ETME at the base of Unit E2 (bed 52; Shen et al., 2006). A continuous sea-level rise across the LPME, i.e., from the base of bed 46 up to the base of bed 52 (PTB horizon), was reported by Algeo et al. (2007). This transgression was caused either by a eustatic sea-level rise or active vertical tectonics at the northern Gondwanan margin (Hallam and Wignall, 1999). Its maximum flooding seems to have been characterized by an anoxic event (Shen et al., 2006).
Geochemical paleoredox proxies (i.e., Mo/U, V/Cr, Mn/Fe, Ce/Ce*, Eu/Eu*) suggest that the environment in the Guryul Ravine section was oxic or suboxic across the PTB, but marine anoxia with increasing clay content was probably developed during the LPME event, as documented in several investigations (e.g., Algeo et al., 2007; Brookfield et al., 2013). Wignall et al. (2005) observed a change from non-laminated, pyrite-poor mudstones to laminated, pyrite framboid-rich shales in bed E49 of the Khunamuh Formation, 1 m above the LPME horizon. Additionally, the TOC to total phosphorus molar ratio (TOC/P) is < 10 in the late Permian and >10 in the early Triassic, suggesting a transition from suboxic to anoxic conditions at the PTB (Kumar et al., 2017).
Two pronounced stages of oceanic oxygen deficiency at the Guryul Ravine section were documented by pyrite framboid size and morphology (Huang Y. et al., 2019): i) during the latest Permian Hindeodus praeparvus–Clarkina meishanensis biozone and ii) during the earliest Triassic Isarcicella staeschei biozone. Huang Q. et al. (2019) proposed that these two anoxic events correlate with anoxic events at the Meishan GSSP and should be considered as global characteristics of the P–Tr transition. Wignall et al. (2005) recognized a possible connection between the LPME and deep-water anoxia at the Guryul Ravine section. Besides, framboidal pyrite and phosphatic nodules in the Late Permian shales of the Gungri Formation in the Spiti Valley (India) also suggest anoxic to euxinic bottom water conditions (Singh, 2012; Ghosh et al., 2016). These paleoredox conditions contrast with those observed in other peri-Gondwanan sections in which shallow-water anoxia took place at the ETME. The Guryul Ravine and the Spiti Valley PTB sections are the only ones in the Neothethys Ocean that record deep-water anoxia at the P–Tr transition (Wignall et al., 2005). Therefore, these can be regarded as key sections for unraveling the redox history of the Neothethys Ocean across the PTB.
Reliable biostratigraphic correlations have been established between the Guryul Ravine and Meishan sections (e.g., Chen et al., 2005; Algeo et al., 2007; Brookfield et al., 2013). However, seismites and tsunamites present at the Guryul Ravine seem to be absent in the Meishan GSSP. Identical structures have not been observed in any other PTB section in India, except for Mandakpal. Those described at Guryul Ravine have been rejected as such by Krystyn et al. (2014).
Material and Methods
Samples
The Meishan D section is located in the Meishan quarry, Zhejiang Province, SE China, with coordinates 31°4′55″ N and 119°42′22.9″ E (see Jin et al., 2006). From the Meishan D section, 33 samples were analyzed for C and Hg isotopes, organic C, S, Al, and Hg concentrations. Out of these, 19 samples were also analyzed for REE + Y and redox-sensitive trace elements.
The samples (n = 109) from the Guryul Ravine section were collected along a traverse perpendicular to the strata of the Zewan Formation, starting at about 71 m above basalts of the Panjal Traps, at the southeast side of the Guryul Ravine (coordinates of the start point: 34° 04′ 24.13″ N and 74° 56′ 43.42″ E, and end point: 34° 04′ 6.66″ N and 74° 56’ 48.20” E).
Analytical Methods
Major, Trace and Rare-Earth Elements
Major, trace and Rare-Earth Element (ME, TE, REE) concentrations were determined in solution using inductively coupled plasma mass spectrometer (ICP-MS) at the Geological Survey of Denmark and Greenland (GEUS) in Copenhagen, following the protocol of Holland et al. (2003). Aliquots of pulverized samples were treated with HF and HNO3 in a PTFE (Savillex) bottle at 130°C. A sample of the resulting solution was dried on a hotplate (100°C, 24 h). The residue was dissolved twice in HNO3 and dried (100°C, 24 h). Then HNO3, internal standard solution (containing Ge, Rh, Re), and distilled water (DIW) were added and allowed to react in a closed PTFE bottle (130°C, 12 h). The resulting solution was diluted (10 × DIW to 50 ml) and analyzed for TE and REE using a Perkin Elmer Elan 6100 DRC ICP-MS instrument. Instrumental calibration was performed using solutions containing certified concentrations of REEs and other elements. The reproducibility of the measurement of the element concentrations, assessed by two relative standards deviations (2RSD), were typically lower than 3% as determined from multiple analyses (n = 4) of in-house standards Disko-1 and international reference materials BHVO-2 and BCR-2. The elements Ni, Mo, Cs, and Eu have higher analytical uncertainties, but were consistently determined with 2RSD better than 10%. Detection limits of the method are listed and were on average six times lower than the lowest concentration measured in any sample. For some elements, in particular Sc, Zn, Ga, Nb, Eu, Ho, Tm, Yb, Lu, Hf, Ta, Pb, and Th, the detection limit was relatively higher (5% percentile of measured values in the samples).
Total Carbon and Total Sufur
Total carbon (TC) and total sulfur (TS) analyses were performed on whole-rock powdered samples using a LECO CS230 induction furnace at GEUS, Copenhagen. The analytical reproducibility was better than ±0.5% for both TC and TS.
Total Organic Matter
Organic matter analyses were performed using a HAWK pyrolysis equipment (a Rock-Eval 6 equivalent instrument from Wildcat instruments and services, Humble, TX) at GEUS, Copenhagen. Calibration was done with the IFP 150,000 standard and in-house standard. The analytical error for the total organic carbon (TOC, wt%) measurements with a HAWK instrument is similar to that obtained by Rock-Eval 6 pyrolysis and oxidation, and generally lower than 2%.
Organic Carbon Isotopes
The organic carbon isotope ratios (δ13Corg, ‰ VPDB) were determined on decarbonated (10% HCl, 60°C) samples by elemental analysis and isotope ratio mass spectrometry (EA/IRMS), using an IsoPrime triple collector isotope ratio mass spectrometer at the Department of Geosciences and Natural Resource Management, University of Copenhagen. The carbon stable isotope ratios were reported in the delta (δ) notation as the per mil (‰) deviation relative to the Vienna Pee Dee Belemnite standard (VPDB). The measured δ13C values were normalized to the VPDB scale using the in-house AKsill-9 standard (δ13C: −25.30‰). The reproducibility of the δ13Corg values was better than 0.1‰.
Carbonate Carbon and Oxygen Isotopes
The carbonate carbon and oxygen isotope ratios (δ13Ccarb and δ18Ocarb ‰ VPDB) of whole-rock samples from the Guryul Ravine section were determined at the Stable Isotope Laboratory (LABISE) at the Department of Geology, Federal University of Pernambuco, Brazil. Extraction of CO2 gas was performed using a conventional high vacuum extraction line after reaction with 100% orthophosphoric acid (25°C, 24 h). The CO2 gas recovered from the samples was analyzed in a Delta V Advantage isotope ratio mass spectrometer (Thermo Fisher Scientific, Bremen, Germany). The measured δ13Ccarb values were normalized by calibrating with the reference CO2 gas with international carbonate isotope reference materials (NBS-18 and NBS-19). Analytical uncertainty (1 sigma) monitored by replicate analyses of NBS-19 and the in-house laboratory standard BSC (Borborema skarn calcite) was not greater than ±0.05‰ for δ13Ccarb and ±0.1‰ for δ18Ocarb.
Mercury Concentration
In this study, 15 new analyses of Hg concentration for the Meishan section were performed at the laboratories of the School of Earth System Science of Tianjin University (China). Additionally, 19 analyses of Hg concentration in samples from this section, available in Grasby et al. (2017) were also used for the present study. For the Guryul Ravine section, Hg concentration analyses for 35 samples were performed at LABOMAR (Institute of Marine Sciences, Fortaleza, Brazil) following the protocol detailed previously (Sial et al., 2020a). Shortly, Mercury concentrations were determined in well homogenized powdered samples. To avoid cross-contamination and ensure low blanks, all the glass and plastic labware were decontaminated (24 h immersion in 10% v/v Extran solution of Merck; 24 h immersion in 5% v/HCl solution; final rinse with purified water using a Milli-Q system). The chemical reagents were of analytical grade purity or higher (Moynier et al., 2020). At LABOMAR, the Mercury extracted (BrCl/HCl oxidant/acid solution) as Hg2+ was reduced to volatile Hg0 with SnCl2 and detected by cold vapor atomic fluorescence spectrometry (Millennium Merlin PSA instrument). The analyses were done in duplicates, and the results reproducibility was <10%. The Hg determination accuracy was assessed by replicate analysis of reference material NIST 1646a (Sigma Aldrich); the reproducibility and accuracy were <5%. The limit of Hg detection (LOD) was 0.02 ng g−1 Hg and the limit of quantification was 0.06 ng g−1 Hg. Blank signals were lower than 0.5% of the average sample signal.
At Tianjin University, the Mercury concentrations were determined using a Lumex Hg analyzer RA 915F equipped with a pyrolysis attachment (PYRO-915+). The reference materials CRM GBW07311 (stream sediments) and GBW07405 (yellow red-soil) from the National Center for Standard Materials (Beijing, China) were analyzed for every five unknown samples for quality control, with the determined Hg concentration within ±10% of the certified values. The instrumental LOD was of 0.5 ng g−1 Hg. The dual-stage combustion system and trapping method described by Huang et al. (2015) have been adopted for purification and pre-concentration of Hg. Briefly, each weighed sample was step-combusted in a quartz tube in the first combustion furnace, then the combustion products (Hg0) were carried by Hg-free O2 gas through the second decomposition furnace of temperature set at 950°C, finally trapped by a 3 ml 40% (v/v, 2HNO3/1HCl) acid solution (Huang et al., 2015). This method was validated with reference materials (CRM) GBW07311 (Hg = 72 ± 9 ng/g) and GBW07405 (Hg = 290 ± 30 ng/g), which yielded recoveries of 98 ± 5% (2SD, n = 8) and 105 ± 7% (2SD, n = 20), respectively. The detectable Hg in the procedural blank (<0.05 ng, n = 2) of this protocol method was negligible compared to the amount of total Hg (>3 ng) in samples. To assess eventual systematic differences in Hg concentrations between analytical procedures, a few samples were analyzed at both labotaories (Tianjin and LABOMR), and the obtained Hg concentration differences were within the analytical uncertainty.
Mercury Isotopes
The Hg isotope compositions were determined using a multi-collector ICP-MS (MC-ICP-MS, Nu Plasma 3D, Nu Instruments, United Kingdom) equipped with a home-made continuous flow cold vapor generation system at the Institute of Surface-Earth System Science, Tianjin University, following the same setup as described in previous studies (Chen et al., 2010; Huang et al., 2015; Zhang et al., 2020). Briefly, the Hg(0) vapor was generated via online reduction by SnCl2 (3%) solution. The Tl aerosol was produced from Aridus II nebulizer and simultaneously introduced into the plasma with Hg(0). The instrumental mass bias was corrected by an internal NIST-997 Tl standard and NIST-3133 Hg standard-sample bracketing method. The samples were introduced at 0.75 ml/min, which gave an instrumental sensitivity of 2.8 V on 202Hg for 1 ng mL−1 Hg solution. Hg concentrations of bracketing standards NIST-3133 and secondary standard UM-Almadén were matched to the sample solutions within 10%. All samples were analyzed in three blocks with 33 cycles for each and with 10 min washout between samples to ensure that the blank levels were <2‰ of the preceding sample signals.
The mass-dependent fractionation (MDF) of Hg isotopes is represented as delta (δ) notation, the per mil deviation of the xHg/198Hg ratio relative to the NIST-3133 standard, and is defined as:
where x refers to the mass of each isotope between 199 and 202 amu.
Hg isotopes can also undergo mass-independent fractionation (MIF), which are defined as the deviation of a measured delta value from the theoretical MDF value, according to the equation:
where the mass-dependent scaling factor βx is 0.252, 0.502, and 0.752 for 199Hg, 200Hg, and 201Hg, respectively.
For quality assurance and control, replicate analyses of the UM-Almadén Hg standard yielded average values of −0.55 ± 0.09‰, −0.01 ± 0.07‰, 0.02 ± 0.07‰, and −0.03 ± 0.10‰ for δ202Hg, Δ199Hg, Δ200Hg, and Δ201Hg, and −1.75 ± 0.05‰, -0.35 ± 0.03‰, 0.00 ± 0.05‰, and −0.32 ± 0.04‰ for those of CRM GBW07405 (2 SD, n = 5), respectively. These values are consistent with previous results (Chen et al., 2010; Huang Q. et al., 2019). The two SD values of the replicate UM-Almadén δ202Hg, Δ199Hg, Δ200Hg, and Δ201Hg determinations represent the analytical uncertainties, which were 0.08, 0.03, 0.03, and 0.05‰, respectively. Errors are reported as two SD from the replicate (generally duplicate) measurements of the same sample solution.
Results and Discussion
Trace Elements Chemostratigraphy
A safe interpretation of the trace element and REE concentration patterns and derived paleoproxies (i.e., Ce/Ce*, Eu/Eu*) would require the knowledge of the hosting phases, and the diagenetic history of the studied sediments and sedimentary rocks. This is because these materials may have undergone multiple stages and styles of post-depositional diagenetic (and probably also hydrothermal) transformations, including dissolution, recrystallization, neomorphism, and phase changes during which the (local) redox conditions and fluid compositions may have varied widely from the overlying seawater (e.g., Tribovillard et al., 2006; Hood et al., 2018; Liu et al., 2019; Algeo and Liu, 2020). Having this in mind, we present in Table 1 the abundances of selected trace element (TE) of 19 samples from the Meishan D section and 35 samples from the Guryul Ravine section. The TE ratios used as paleoproxies are shown in Figure 2, along with REE ratios (Ce/Ce*, Eu/Eu*, Pr/Pr*) and ΣREE + Y (Table 1). The element enrichment factors (EFs) relative to PAAS were used to compare the concentrations of authigenic V, Mo, and U in both sections (Algeo and Tribovillard, 2009). A detectable authigenic enrichment of element X corresponds to XEF > 3, and a substantial one, to XEF > 10. The Mo and U concentrations are shown as MoEF and UEF profiles in Figure 2 and MoEF vs. UEF plots in Figures 3A,B. The seawater Mo/U molar ratio is shown to guide interpreting relative enrichments of authigenic Mo vs. authigenic U. The MoEF and UEF values {i.e., MoEF = [(Mo/Al)sample/(Mo/Al)PAAS] and UEF = [(U/Al)sample/(U/Al)PAAS]} are based on Tribovillard et al. (2012) and Sosa-Montes et al. (2017), using the PAAS composition from Taylor and McLennan (1985). The MoEF and UEF covariations have been used as indicators of paleoredox conditions in marine systems (e.g., Algeo and Lyons, 2006; Tribovillard et al., 2006; Algeo and Tribovillard, 2009; Algeo and Rowe, 2012; Tribovillard et al., 2012; Zhou et al., 2012; Azrieli-Tal et al., 2014; Algeo and Liu, 2020). Algeo and Tribovillard (2009) recognized multiple controls in the MoEF−UEF covariation, mainly i) the concomitant increase of sedimentary Mo and U accumulation with decreasing benthic dissolved oxygen concentration in open-ocean upwelling regions and ii) preferential uptake of Mo over U in weakly restricted basins with a particulate shuttle in the water column. Therefore, as the accumulation of Mo and U have conjoint hydrographic and redox controls, the use of their concentrations and derived proxies (i.e., Mo/U ratios, MoEF−UEF covariations) as a paleoredox proxy needs to be supported by (Eq. 1) comparison with other paleoredox proxies based on redox-sensitive/sulfide-forming elements (e.g., V, Ni, Cu, Zn) and (Eq. 2) consideration of the hydrographic settings of the studied paleoenvironment (Algeo and Lyons, 2006; Tribovillard et al., 2006; Tribovillard et al., 2012). These authors recognized the difficulty of such assessments (e.g., basin configuration, circulation patterns) due to the incomplete knowledge of the paleogeographic dimensions of many anoxic paleoenvironments.
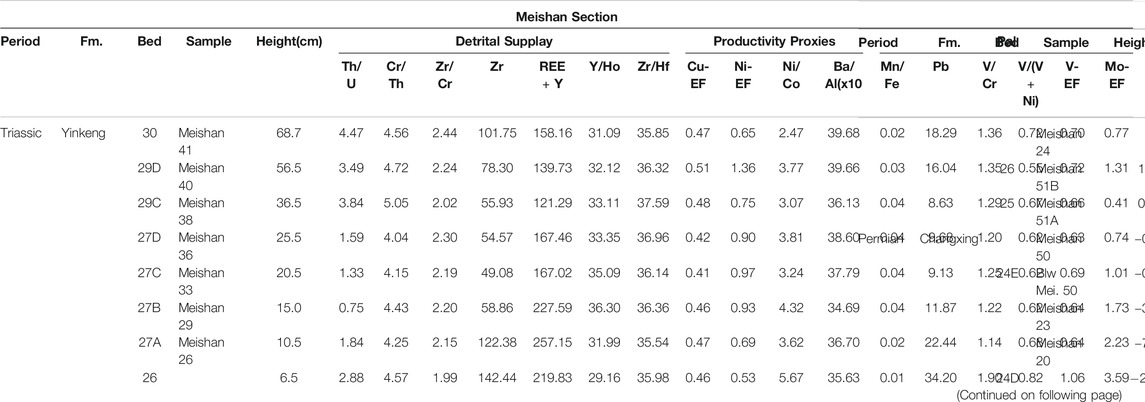
TABLE 1. Trace element (ppm) and elemental ratios (including rare-earth elements) for the Meishan and Guryul Ravine sections.
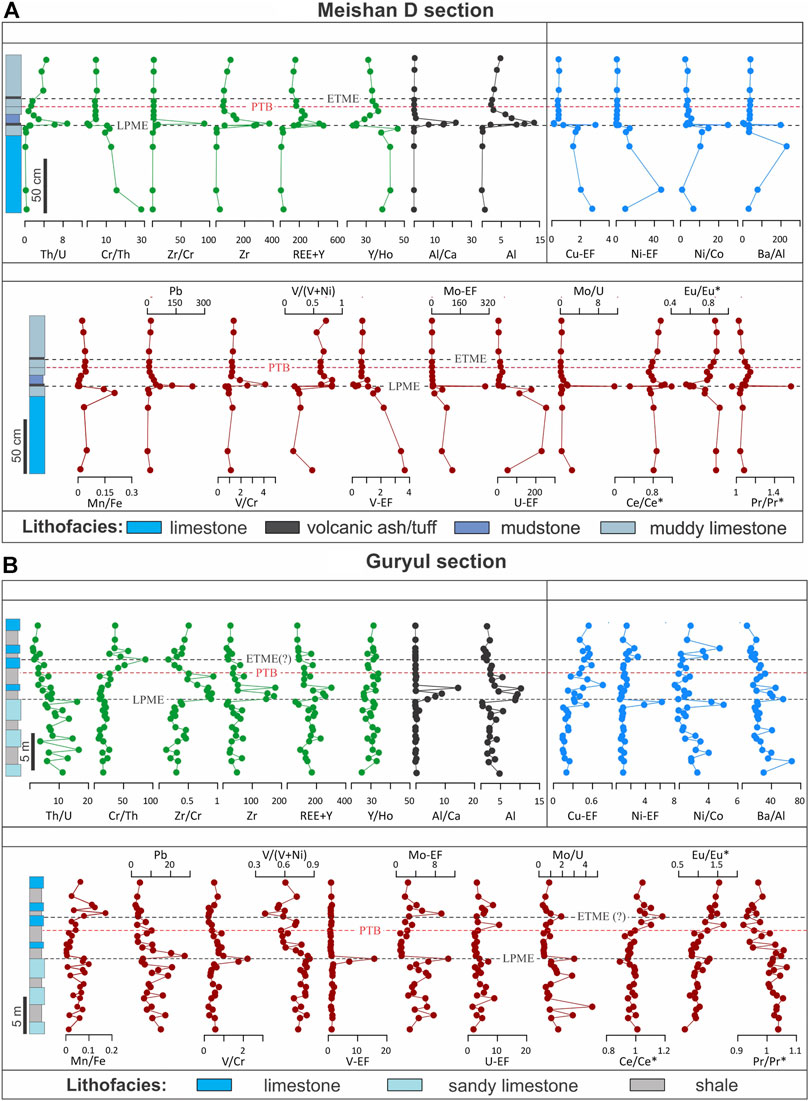
FIGURE 2. Trace-element and elemental-ratio chemostratigraphy encompassing: Th/U, Cr/Th, Zr/Cr (Zr) in ppm, ƩREE + Y, Y/Ho, Al/Ca and (Al) in wt%, Cu-EF, Ni-EF, Ni/Co, Ba/Al, Mn/Fe (Pb) in ppm, V/Cr, V/(V + Ni), V-EF, Mo-EF, U-EF, Mo/U, Ce/Ce*, Eu/Eu* and Pr/Pr* for the (A) Meishan D (GSSP) and (B) Guryul Ravine sections.
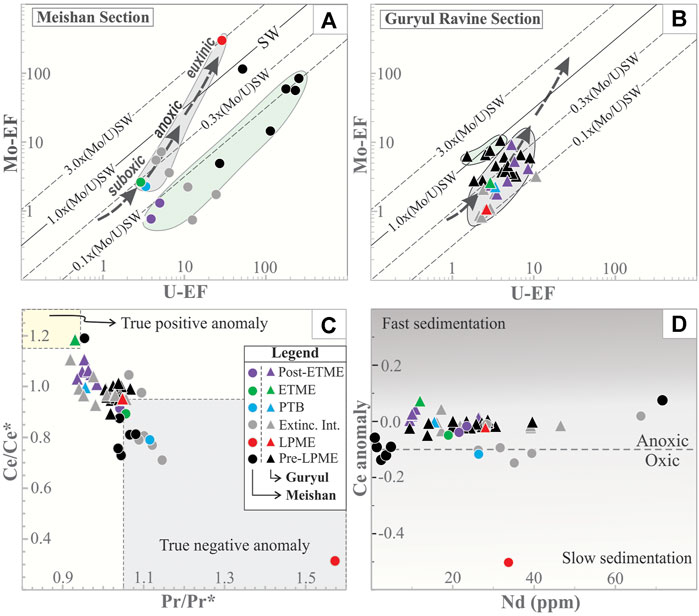
FIGURE 3. (A–B) MoEF vs. UEF covariation for the Meishan D and Guryul Ravine sections (based on Tribovillard et al., 2012; Sosa-Montes et al., 2017), in which MoEF = [(Mo/Al)sample/(Mo/Al)PAAS] and UEF = [(U/Al)sample/(U/Al)PAAS]. The PAAS composition used is from Taylor and McLennan (1985). The diagonal lines represent multiples of the Mo/U ratio of present-day seawater. The general pattern of MoEF vs. UEF covariation in unrestricted marine trend for modern eastern tropical Pacific is from Tribovillard et al. (2012), modified by Sosa-Montes et al. (2017)(C) Crossplot of Ce/Ce* vs. Pr/Pr* for the Meishan and Guryul Ravine sections (after Bau and Dulski, 1996) (D) log(Ce/Ce*) vs. Nd (ppm) plot for both sections (modified from Wang et al., 2014).
The Meishan and Guryul Ravine sections display distinct Mo/U and MoEF−UEF covariation trends across the PTB transition (Figure 3). The diagonal lines in Figures 3A,B represent multiples (between 0.1 and 3.0) of the Mo/U ratio of present-day seawater (SW) and the general pattern of MoEF−UEF covariation in unrestricted marine trend for modern eastern tropical Pacific (Tribovillard et al., 2012, modified by; Sosa-Montes et al., 2017). Two trends result from this plot: a) a number of pre-LPME, extinction interval and post-ETME samples from the Meishan section (Figure 3A) plot roughly along the 0.1 × (Mo/U) present-day SW line; b) samples from the PTB and ETME horizons (suboxic) and three samples from the extinction interval (suboxic-anoxic) plot along the 0.3 × (Mo/U) of the present-day SW line and the LPME (euxinic), on the 3.0 × (Mo/U) SW diagonal line. The second trend follows approximately the covariation in unrestricted marine trend for modern eastern tropical Pacific. In the Guryul Ravine section (Figure 3B), two trends are observed: a) most samples plot along the 0.3 × (Mo/U) SW line (suboxic to anoxic) and b) four pre-LPME samples plot along the 1.0 × (Mo/U) SW line. The samples from the LPME horizon at Guryul Ravine and at Meishan exhibit contrasting behavior, oxic and anoxic, respectively.
At Meishan, Mo/U, V/Cr, Ce/Ce*, Eu/Eu*, and Pr/Pr* ratios and Pb concentration show little variation in the Changhsing Formation (bed 24), while VEF, MoEF, UEF, andV/(V + Ni) exhibit strong fluctuations (Figure 2A; stratigraphic location of beds in Meishan and Guryul Ravine sections are shown in Figures 4, 5). All paleoredox ratios from this section (including Mo/U) display a peak in the LPME horizon, followed upsection by a relatively discrete variation in the Yinkeng Formation, except for the Ce/Ce*, which increases towards the PTB horizon, and the Eu/Eu* and Pr/Pr* ratios that undergo slight decrease (beds 26 and 27). The slightly negative Eu anomaly in the LPME samples could suggest precipitation from either fluids with lower temperature than pre-LPME horizons, or chemical complexation reactions which extended the stability of Eu3+ to lower oxygen concentrations, preventing the reduction to Eu2+, and therefore decreasing the Eu/Eu* values (e.g., Bau, 1991; Hood et al., 2018).
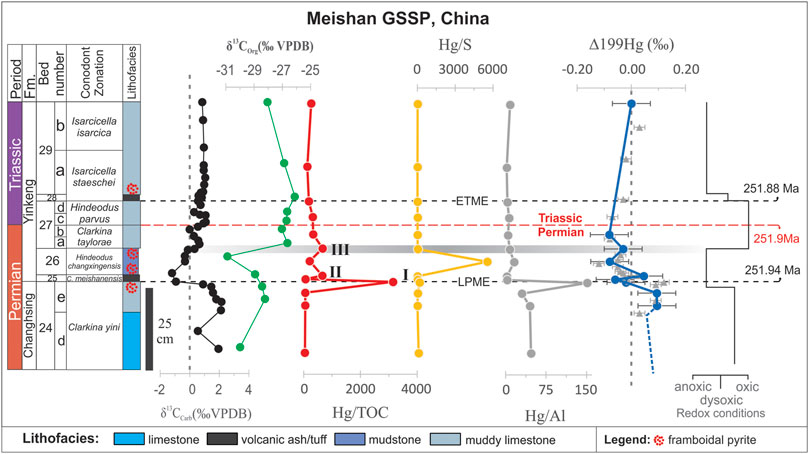
FIGURE 4. Lithostratigraphy and conodont biozones for the Meishan D (GSSP) section, according to Chen et al. (2015); δ13Ccarb curve is from Chen et al. (2005) and this study; δ13Corg and Hg/TOC chemostratigraphic pathways were modified from Sial et al. (2020a); Hg/S (=Hg/Total sulfur, TS), Hg/Al and Δ199Hg‰ (MIF) variation patterns are from this study. Gray stars along the Δ199Hg‰ (MIF) variation curve represent samples from Grasby et al. (2017). Variations in redox conditions are according to Shen et al. (2007), based on the size distribution of framboidal pyrite.
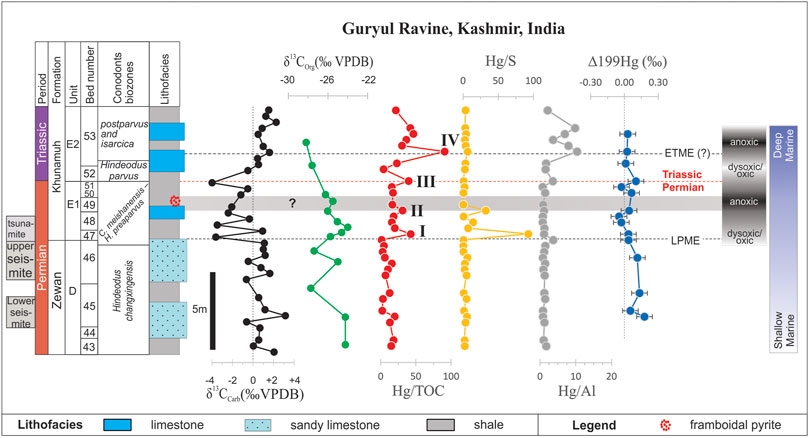
FIGURE 5. Lithostratigraphy and conodont biozones for the Guryul Ravine section according to Brookfield et al. (2019); δ13Corg curve from Algeo et al. (2007); δ13Ccarb pathway is from Sial et al. (2020b), Δ199Hg‰ (MIF), Hg/TOC, Hg/S (=Hg/TS), Hg/Al chemostratigraphic curves are from this study; variations in the redox conditions are based on Huang Y. et al. (2019), two-marine anoxic events based on the distribution of framboidal pyrite. Relative depth of deposition (shallow, deep) is from Singh et al. (2015).
In general, all of these paloredox ratios tend to show little systematic variation towards the ETME horizon. The V/(V + Ni) values, used as a redox paleoproxy (Arthur and Sageman, 1994), are uniformly high (>0.60 on average) and suggest deposition under anoxic conditions in the extinction interval (Figure 2). Mn/Fe ratios >0.1 in the pre-LPME Bed 24 (Figure 2A) favor oxic conditions, while values <0.1 at the top of Bed 24 and in beds 25 and 26 across the LPME suggest low redox conditions, according to Arthur and Sageman (1994). At Meishan, the detrital proxies Th/U, Zr/Cr, Zr, Al, Al/Ca, and also ΣREE + Y display a marked positive excursion defined by several samples at the LPME horizon (Figure 2). Apart from this, the detrital supply proxies (i.e., Th/U, Zr/Cr, Al/Ca) show a little systematic trend in the Changhsing Formation, while Cr/Th and Y/Ho exhibit more pronounced variation. Some detrital input proxies show a strong negative (Th/U, Z, and ΣREE + Y) or positive (Y/Ho) excursion in the LPME–PTB interval in the Yinkeng Formation (beds 26 and 27) and little variation from the ETME upsection. The low Y/Ho ratios suggest a diagenetic lithogenous geochemical signature (e.g., Zhang et al., 2016). The productivity proxies Cu-EF, Ni/Co, and Ba/Al show strong variation in the Changhsing Formation, with a positive peak at the LPME horizon and slight variation within the extinction interval (Figure 2A).
At Guryul Ravine, the element ratios show more pronounced fluctuations than in the Meishan section (Figure 2B). Except for VEF, all paleoredox proxies show strong pre-LPME changes (bed 46, Zewan Formation). Upsection, they follow a pattern similar to Meishan, punctuated by a marked increase in most redox-sensitive element ratios at the LPME horizon, except for Ce/Ce*, which shows a slight decrease. Most paleoredox ratios [V/(V + Ni), MoEF, UEF, Ce/Ce*, Eu/Eu*] and Pb are enriched within the PTB–ETME interval and the Pr/Pr* ratio exhibits more erratic fluctuations toward lower values. The Mn/Fe > 0.1 in Bed 46 suggests pre-LPME oxic conditions, while Mn/Fe < 0.1 in bed 49 points to reducing conditions (Figure 2B). The Mn/Fe > 0.1 in beds 51, 52, and at the base of Bed 53 suggest a return to oxic conditions upsection, and the Mn/Fe < 0.1 values before the ETME to more reducing conditions. The detrital input proxies Th/U, Zr/Cr, Zr, and ΣREE + Y show some fluctuations in the pre-LPME interval (bed 46) and a strong positive shift at the LPME horizon. The increases in Zr and ΣREE + Y are in line with Algeo et al. (2007). The productivity proxies (NiEF, Ni/Co and Ba/Al) show strong variations and a positive peak at the LPME, except for the CuEF with a discrete negative shift.
The ΣREE + Y concentrations vary from 10 ppm (Bed 24 D) to 143 ppm (Bed 24E) in the analyzed samples from the Changhsing Formation and from 121 ppm (Bed 29C) to 430 ppm (Bed 26) in samples from the Yinkeng Formation in Meishan (Table 1). In Guryul Ravine, ΣREE + Y varies from 56 to 260 ppm (Bed 46) in the Zewan Formation and from 78 (Bed 53) to 302 ppm (Bed 48) in the Kunamuh Formation (Table 1). Sea-level oscillations across the LPME horizon in the Guryul Ravine section have probably allowed an important continental detrital influx and subsequent ΣREE + Y enrichment. The strong co-variation between Zr and ΣREE + Y in both sections (Figure 2) suggests the presence of heavy minerals, especially zircon (e.g., Hoskin and Ireland, 2000; Bouch et al., 2002). The REE- and likely Zr-enriched detrital phases were responsible for the REE in these two sedimentary successions.
The Ce/Ce* values can shed some light on post-depositional mobility of REE, as positive Ce/Ce* values indicate reducing conditions, and negative values argue in favor of the presence of oxidized surface waters during deposition (e.g., Towe, 1991; Bau and Dulski, 1996; Shields and Stille, 2001; Pi et al., 2013). The Ce/Ce* values are <1.0 in all Meishan samples, with a slight increase in the LPME horizon. In Guryul Ravine, Ce/Ce* values are <1.0 in pre-LPME samples and show a discrete negative shift at the LPME horizon. However, it undergoes an increase across the PTB horizon and a more pronounced one at the ETME horizon. These patterns suggest that anoxic conditions prevailed across the LPME and dysoxic to oxic conditions across the PTB and ETME in Meishan. In Guryul Ravine, dysoxic to oxic conditions dominated across the LPME horizon and changed to anoxic around Bed 49 and across the ETME horizon. The Eu/Eu* values <1.0 in all Meishan samples show a marked negative peak at the LPME. The Pr/Pr* values are >1.0 with a positive peak at the LPME horizon. In the Guryul Ravine section, Eu/Eu* > 1.0 at the LPME horizon and Pr/Pr* > 1.0 in beds 43 through 46. Positive Eu/Eu* values dominate above the PTB horizon and probably reflect clay mineral provenance rather than a hydrogenous signal, according to Bhandari et al. (1992).
To better visualize the Ce behavior by eliminating the influence of La, the Ce/Ce* and Pr/Pr* ratios were plotted against each other (Figure 3C), following Bau and Dulski (1996). The Meishan section displays a slightly different pattern as compared to the Guryul Ravine section (Figure 3C). Several pre-LPME samples and those from the extinction interval and the PTB and ETME horizons plot within the “true negative Ce anomaly” box. Instead, all samples from the Guryul Ravine section plot between the negative and positive anomaly boxes, except a sample from the ETME horizon, which plots within the “true positive anomaly” box. In a Ce anomaly [log(Ce/Ce*)] vs. Nd (ppm) plot (Figure 3D), following (Wang et al., 2014; modified from Elderfield and Pagett, 1986; Wright et al., 1987), all samples from the Guryul Ravine section and most samples from Meishan plot within the anoxic field. Five samples from Meishan plot in the oxic field very close to the oxic-anoxic field boundary (0.0 and –0.1).
The highest Nd values from the Meishan section are >60 ppm and all in the anoxic field (bed 26) in Figure 3D, while the lowest Ce anomaly value is observed in the LPME horizon, which falls within the oxic field. This argues in favor of an abrupt change from oxic to anoxic redox conditions across the LPME horizon in Meishan. At Guryul Ravine, the two highest Nd values (46 and 39 ppm) are observed in samples from the top of bed 46 and top of bed 48. The occurrence of framboidal pyrite in bed 49 supports the transition from oxic to anoxic conditions in beds 48–49.
Carbon Isotope Chemostratigraphy
Meishan Section
The δ13Ccarb and δ13Corg patterns for Meishan section are shown in Figure 4. Forty samples (Table 2) from a previous study (Jin et al., 2000; Sial et al., 2020a) have also been used to complete the δ13Ccarb profile. Further data from the extinction interval (Chen et al., 2005) have been added to enhance the resolution of the δ13Ccarb curve across the PTB.
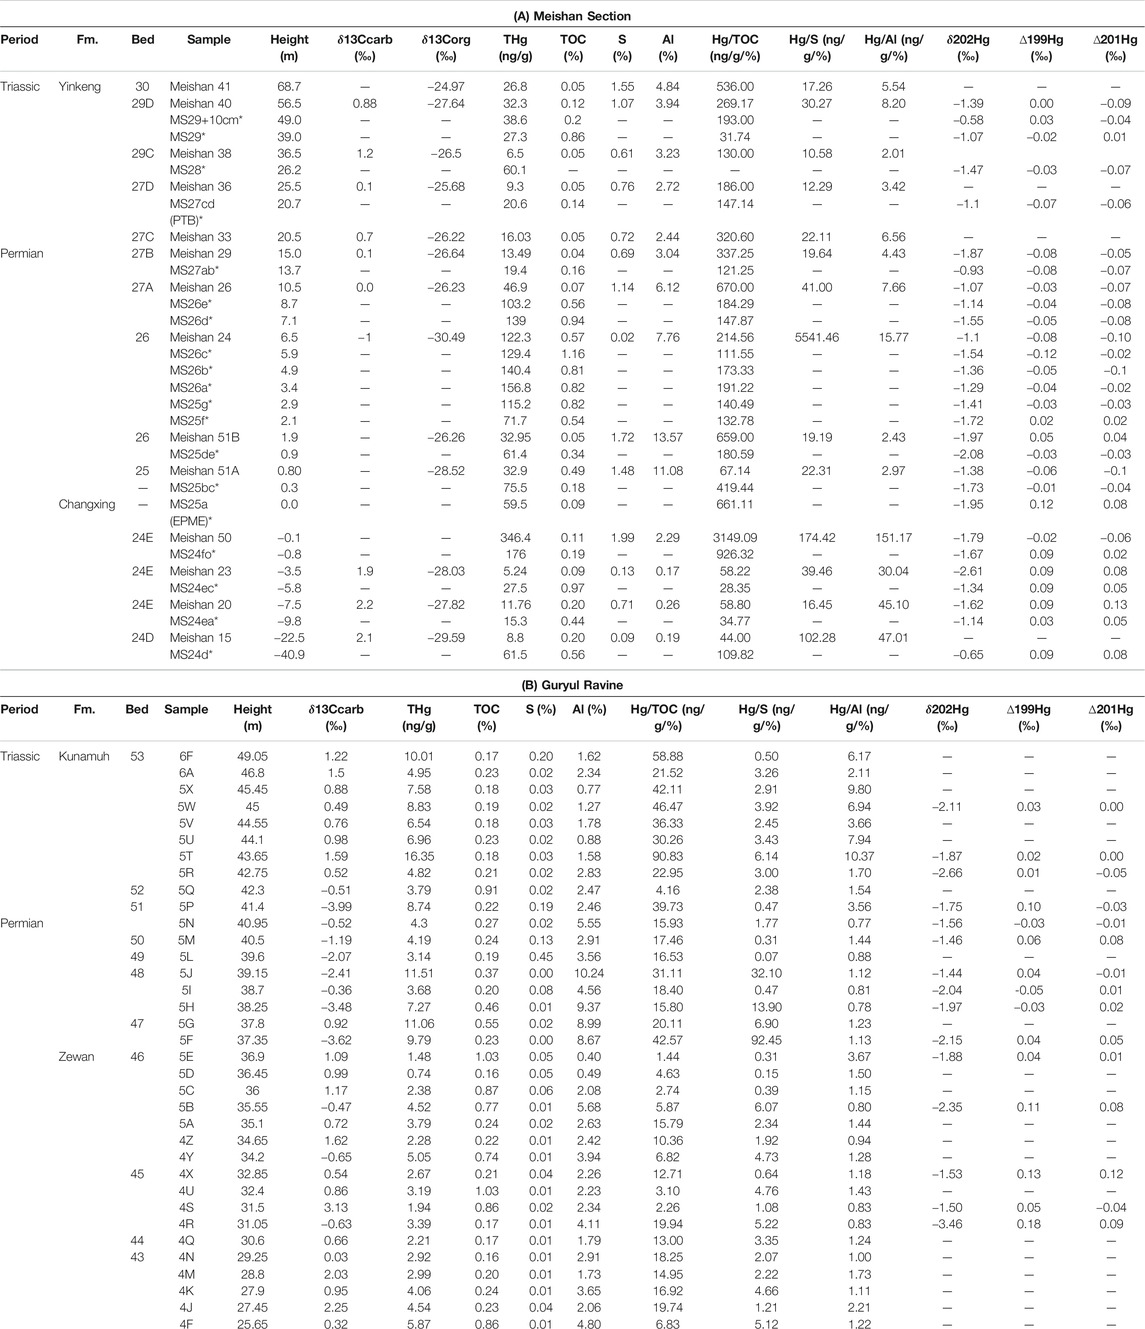
TABLE 2. δ13Ccarb (‰), δ13Corg (‰), total Hg [(ng/g), S (%) and Al (%) concentrations; Hg isotopes (‰) (Meishan Section].
The δ13Ccarb values in the 24–29 bed interval varied from −1.2 to +4.7‰, prevailing positive values. All samples from the Changhsing Formation yielded positive δ13Ccarb values, except the topmost beds 24 and 25 (LPME) with a value of −1.1‰. A positive shift >1‰ in bed 27a (Clarkina taylorae Zone) coincides with a change from anoxic to dysoxic/oxic conditions. At the PTB horizon (bed 27c) a δ13Ccarb value of +1.1‰ was measured, and +0.9‰ at the base of bed 28 (ETME horizon). In bed 29, all δ13Ccarb values are positive and gradually increase upwards (beds 30–40 are not shown).
The δ13Corg curve in Figure 4 is from Sial et al. (2020a) with additional 12 samples analyzed in this study, showing δ13Corg varying between −30.5 and −25.7‰. Covariation of δ13Ccarb and δ13Corg is observed at Meishan (Figure 4). A discrete positive shift of δ13Ccarb in bed 27 matches a more marked positive shift of the δ13Corg values, coinciding with a change from anoxic to dysoxic/oxic conditions.
A careful examination of the geochemistry, mineralogy, and cathodoluminescence of beds 24–62, spanning the PTB in the Meishan D section, led Li and Jones (2017) to conclude that the δ13C signals were a mixture of primary and diagenetic signals. They cautioned that in dolomite-bearing samples, diagenesis might have contributed ∼1.7‰ to the negative δ13C shift. Besides this diagenetic overprint, Kaiho et al. (2006) explained a −1‰ shift of δ13C in the Meishan section, within ∼13 ka before the LPME, by possible thermal dissociation of methane hydrates. Subsequent mixing of an anoxic stratified ocean led to another –1‰ δ13C shift within ∼5 kyr of the extinction. According to these authors, low ∆13C (∆13C = δ13Ccarb − δ13Corg) values in beds 27–29 indicate that phototrophic sulfur bacteria may have flourished and lasted over 150 ka after the LPME in the low-latitude Paleotethys.
Coeval sections may allow testing the authenticity of major δ13C shifts, yet diagenetic signals may be globally synchronous (Fantle et al., 2020). In any case, absolute values of major δ13C changes at Meishan, Guryul Ravine, or any other section need to be considered cautiously.
Guryul Ravine Section
The first δ13Ccarb curves for the Guryul Ravine section were reported by Baud and Magaritz (1988) and Baud et al. (1989, 1996).
Baud et al. (1989, 1996) reported the first δ13Ccarb curves for the Guryul Ravine section. Korte et al. (2010) provided a new δ13Ccarb chemostratigraphy for this section. These authors examined the role of massive volcanism on the isotopic composition of the ocean and atmosphere at the PTB. The high-resolution δ13Ccarb curve in Figure 5 is from Sial et al. (2020b). The high-resolution δ13Ccarb variation curve starts from bed 25 (the topmost bed of the Member B, Zewan Formation) and ends in bed 53 (Member E3, Khunamuh Formation) and has an overall similarity with the δ13Ccarb curve of Korte et al. (2010). However, the extinction interval being our main target, only δ13Ccarb values from beds 43 through 46 (part of Member D of the Zewan Formation) and beds 47 through 53 (Members E1 and part of Member E2 of the Khunamuh Formation) are listed in Table 1 and displayed in Figure 5.
Whereas Member D yielded ∼0.0‰ to moderately positive δ13Ccarb values (+0.1–+3.1‰), the LPME and PTB horizons are characterized by strong negative excursions (−4‰). A positive δ13Ccarb shift is observed at the transition from bed 50 to 51 and another one at the base of bed 53 (praeparvus and isarcica zones) that, according to Huang Q. et al. (2019), was deposited during a stage of widespread oceanic oxygen deficiency. This δ13Ccarb shift is, perhaps, the record of the ETME event at Guryul Ravine. In bed 53 and upsection, positive δ13Ccarb values dominate and progressively rise to +3‰ (Member E3, not shown in Figure 5).
The δ13Corg curve (Figure 5) shows values between –28 and –24‰ for samples from the Zewan Formation, consistent with organic matter of both marine and terrestrial sources. Algeo et al. (2007) argued in favor of a dominantly marine origin based on low molar C/N ratios (5:1–10:1) and δ15N values reported by White (2020). The first negative excursion in both the δ13Ccarb and δ13Corg curves is observed in bed D45, ∼6 m below the PTB and ∼3.3 m below the contact between the Zewan and Khunamuh formations. A positive δ13Corg shift at the LPME horizon coincides with a positive excursion in the δ13Ccarb values (base of bed 47). A discrete positive δ13Corg shift in bed 49 (Member E1) is within the LPME–PTB interval (C. meishanensis–H. praeparvus Zone). Framboidal pyrite in this horizon was first mentioned by Brookfield et al. (2013).
In summary, the C-isotope curves from Meishan and Guryul Ravine highlight the following features: a) a pronounced negative δ13C excursion at the LPME horizon in both sections b) a negative δ13C excursion at the PTB horizon, c) a discrete positive δ13Ccarb and δ13Corg shift (of unclear origin) in the LPME–PTB interval, d) at Guryul Ravine the δ13Ccarb return to positive values above the PTB, while at Meishan they tend to stay steady, e) a modest response of δ13C values to environmental effects associated with the ETME as compared to those observed at the LPME, and f) a sharp increase in δ13Ccarb values, a few meters above the ETME (e.g., Song et al., 2013).
Mercury Chemostratigraphy
Mercury (Hg) enrichments across some chronological boundaries can be the result of volcanogenic Hg loading onto the environment (e.g., Sanei et al., 2012; Sial et al., 2013; Sial et al., 2016; Sial et al., 2019; Sial et al., 2020a; Sial et al., 2020b; Grasby et al., 2015a; Grasby et al., 2017; Grasby et al., 2019; Grasby et al., 2020; Percival et al., 2015; Percival et al., 2017; Percival et al., 2018; Font et al., 2016; Thibodeau et al., 2016; Thibodeau and Bergquist, 2017; Charbonnier et al., 2017; Meyer et al., 2019; Shen et al., 2019a,b,c; Them et al., 2019; Kwon et al., 2019, and references therein). This framework allows examining the relationship between LIP activity and periods of extreme environmental turnover. The application of Hg for this purpose requires its normalization to an element representing the dominant host phase of Hg―generally total organic carbon (TOC) for the organic fraction, but occasionally total sulfur (TS) or aluminum (Al) for the sulfide or clay fractions, respectively (e.g., Shen et al., 2020).
The Hg/TOC stratigraphic curve (Figure 4) in Meishan shows three peaks, a prominent one around the LPME (peak I, top of Bed 24), a second one (peak II, Bed 25), and a third one (peak III) at the top of Bed 26. The Hg/TS curve, on the contrary, is very monotonous and characterized by only a single peak in Bed 26 (Hindeodus changxingensis biozone), in an interval with framboidal pyrite (i.e., anoxic/euxinic conditions). The Hg/Al curve shows higher values in pre-LPME samples (Bed 24), lower values in the extinction interval, and a prominent peak at the LPME horizon, coinciding with the Hg/TOC peak I and the negative δ13Ccarb shift. The Hg/TOC, Hg/S, and Hg/Al curves and correlation coefficients between Hg and TOC (∼0.50), S (0.11), and Al (0.25) suggest that organic matter was probably the main Hg-host phase. Only in the anoxic interval of bed 26 the role of framboidal pyrite is evidenced as an additional Hg-host phase. Aluminum concentrations are higher in the extinction interval samples (2.4–13.57%, in beds 25–29) than those from the pre-LPME (0.11–0.4%, bed 24). Although total Hg is higher in samples from the extinction interval, Hg/Al behaves oppositely, with higher values in pre-LPME samples, except for the Bed 24 sample with anomalously high Hg, which causes a prominent Hg/Al peak.
The Hg/TOC curve for Guryul Ravine section (Figure 5) shows lower values in pre-LPME samples (beds 43–46, Zewan Formation), the peak I at the LPME horizon, peak II in bed 49 (Khunamuh Formation), peak III at the PTB horizon (base of Bed 52) and a larger peak IV at Bed 53 (ETME horizon). The Hg/S curve shows a monotonous behavior, except for two peaks at the base of Bed 47 (at the contact of Zewan and Khunamuh formations), and in the framboidal pyrite-bearing Bed 49. The Hg/Al curve is also monotonous as a whole, with three discrete peaks, at the LPME, PTB and ETME horizons.
The behavior of Hg/TOC, Hg/TS and Hg/Al stratigraphic curves and the calculated correlation coefficients of Hg vs. TOC (0.27), Al (0.20), and TS (∼0.01) suggest that TOC has been the main Hg-host phase. Aluminum concentrations increase slightly beween the top of Bed 46 and Bed 51 where shales were deposited at the PTB in Guryul Ravine during a transgressive event. A discrete Hg/Al peak records the change to more Al-enriched cabonate rocks or shales, but on the whole, clays played a less significant role as the Hg-host phase, as compared to the organic matter.
It is clear from Figure 4 and the above discussion that Hg/TOC ratios show more intense environmental changes across the PTB than the carbon isotope (δ13Ccarb, δ13Corg) chemostratigraphy. These differences may be related to the geochemistry of Mercury and carbon. In short, Mercury is a chalcophile (sulfur-loving) element and biologically highly active. Due to its relatively high vapor pressure, it may be mobilized tectonically and in the gas phase (e.g., Fitzgerald and Lamborg, 2005). In the surface environment, Hg is a very active element (i.e., biologically active, redox-active, volatile) and has a strong affinity to organic matter. Mercury is therefore more easily impacted by source input changes (volcanic, tectonic) and environmental and climate changes as compared to carbon. As such, the Hg/TOC ratio can be regarded as a sensitive and promising proxy for environmental and ecological changes. Carbon isotope chemostratigraphy may show indistinct patterns as compared to Mercury. Both δ13Ccarb and δ13Corg values are affected by several primary factors (e.g., atmospheric CO2 concentration and δ13C value, pH and salinity of the seawater, biomass productivity, organic matter type) as well as post-depositional processes (e.g., recrystallization and neoformation of carbonate phases during early and burial diagenesis, rock interaction with hydrothermal and metamorphic fluids, preferential preservation of organic matter during diagenesis, organic matter thermal maturity).
To underline the application of Hg/TOC profile as a tool for stratigraphic correlation, Figure 6 depicts a Hg/TOC NW-SE transect diagonally across the Pangea supercontinent at 252 Ma, passing through seven well-known PTB sections (from Ursula Creek, Canada, to Hovea-3, Australia) plus Meishan and Guryul Ravine (based on Sial et al., 2020a). The LPME and ETME horizons were kept as they appear in the original figures, and the PTB was used as a datum. The largest Hg/TOC spike is observed at the LPME horizon in most of these sections, a smaller one at the PTB and a more discrete one at the ETME horizon. This transect reveals that, except for the Idrijca section, all the other sections exhibit a discrete Hg/TOC peak of unknown origin between the LPME and the PTB. This peak may record a global event as it is also observed outside of the Tethyan realm. More importantly, Figure 6 clearly shows how powerful the Hg/TOC ratios are as a stratigraphic correlation tool, mainly when a time-defined level had Hg input from LIP activity.
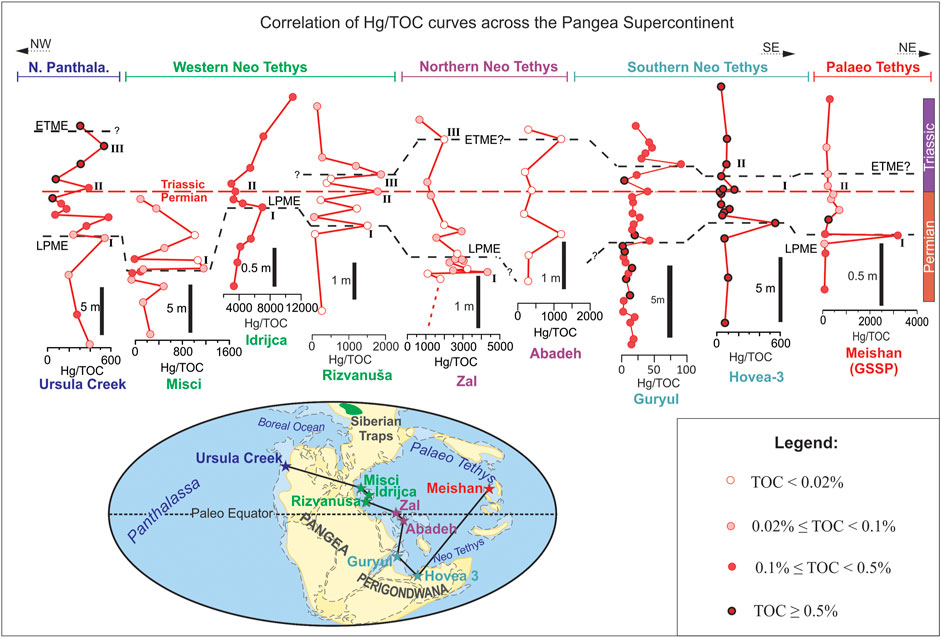
FIGURE 6. A NW–SE Hg/TOC transect across the Pangea supercontinent (252 Ma ago) encompassing nine PTB sections, from Ursula Creek (Canada) through Hovea-3 (Australia), including Meishan D and Guryul sections based on Sial et al. (2020a). In building this transect, the position of the LPME and ETME horizons have been kept as shown in their original Figures and the PTB datum was used for correlation.
Mercury Isotopes
The Mercury source can be potentially traced with the help of Hg isotopes as they can undergo large mass-dependent (MDF) and mass-independent (MIF) fractionations in nature (Blum et al., 2014). These isotopes can also help interpret Hg and Hg/TOC trends (e.g., Thibodeau et al., 2016; Gong et al., 2017; Grasby et al., 2017; Wang et al., 2018). It is necessary to consider that the Hg isotopes MDF (hereafter Hg-MDF) can be triggered or modified by physical, chemical, or biological reactions. These parameters need to be considered when tracing Hg in the environment. As Thibodeau et al. (2016) pointed out, the Hg isotopes MIF (hereafter Hg-MIF) are more useful for source identification as they are not affected by post-depositional processes. The near-zero Hg-MDF values indicate direct volcanic input, while more negative values indicate terrestrial sources related to organic matter heating or enhanced erosion (Yin et al., 2016). According to Wang et al. (2018), Hg-MIF (Δ199Hg) with sustained positive values indicates a predominant atmospheric-derived signature of volcanic Hg in deep-shelf settings, while nearshore environments display a negative Δ199Hg signature, interpreted to be linked to terrestrial Hg sources.
Twenty-four samples were analyzed for the Hg isotopes, nine from the Meishan D section and 15 from the Guryul Ravine section (Table 2). The samples are predominantly from the extinction interval (LPME–ETME) and yielded high Hg/TOC values. Besides, 20 Hg-isotope analyses from the Meishan D section reported by Grasby et al. (2017) were plotted together with our results in Figures 7A, 8A. All the Hg-MDF values, reported here as δ202Hg, are negative in both sections. In Meishan D, almost all the δ202Hg values are in the −2.00–−0.50‰ range, amongst which two samples are between −1.00 and −0.50‰ (Table 2) and only two values are lower than −2.00‰. Almost all pre-LPME samples of this section display positive Δ201Hg (MIF) values and tend to be negative at the extinction interval. In the Guryul Ravine section, 60% of the samples have δ202Hg values between −2.00 and −1.50‰, and six of them are below −2.00‰. The pre-LPME samples generally have positive Δ201Hg values, while negative values prevail in the extinction interval.
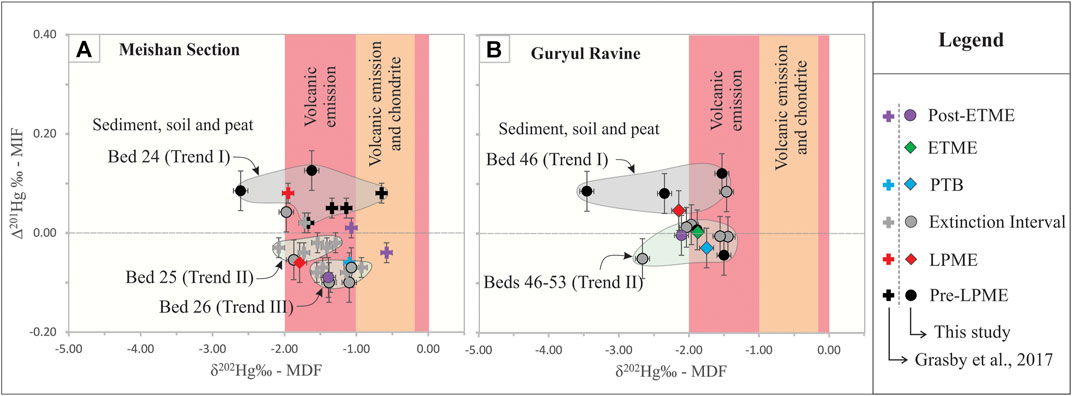
FIGURE 7. δ202Hg ‰ (MDF)–Δ201Hg (MIF) crossplot for (A) Meishan D section (analyses are partially from this study and partially from Grasby et al., 2015a), and (B) Guryul Ravine section (this study). See text for explanation.
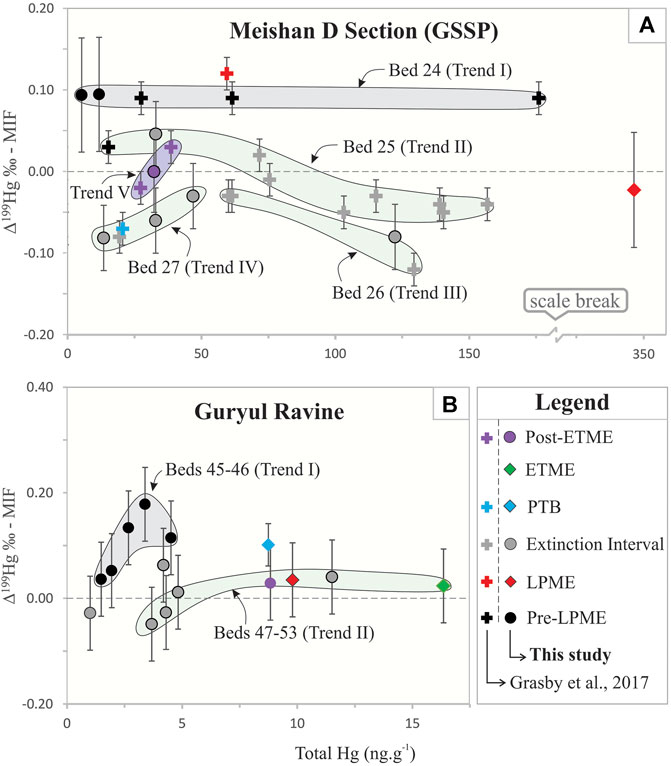
FIGURE 8. (A) The Δ199Hg‰ (MIF) vs. (B) Hg (ng.g−1) crossplot for the two studied sections. See text for explanation.
In the Meishan D section, over 85% of the samples plot in the “volcanic-emission box” in the δ202Hg vs. Δ201Hg diagram (Figure 7A; Sial et al., 2016). Two samples fall in the “volcanic emission and chondrite box” and one (top of Bed 24E) in the “sediment, soil and peat” box. Three horizontal trends are shown in Figure 7A: trend I formed by Pre-LPME samples, trends II and III by samples from the extinction interval. With positive Δ201Hg values, trend I is delineated by samples from Bed 24 (data from Grasby et al., 2017, and from the present study) in which one sample from the top of Bed 24E falls within the “sediment, soil and peat” box. Trend II (samples from Bed 25) and trend III (Bed 26) show negative Δ201Hg values. Only one sample from the LPME horizon plots in trend I and a sample from the ETME horizon in trend II.
Most probably, Hg in the samples from Meishan right below the LPME (Bed 24) and within the LPME–PTB (beds 25 and 26) originated from the same volcanic source, with negligible or no Δ201Hg (MIF) fractionation during atmospheric transport. The range of measured Δ199Hg values (−0.10–0.00) within this interval is within experimental error of zero, supporting a significant influx of volcanic Hg in this time interval. Moreover, small positive Δ201Hg values observed in bed 24 favors long-term atmospheric transport and Hg loading to the environment by the STLIP magmatism. MDF of Hg isotopes seem to have been affected by local fractionation in trend I, pushing δ202Hg values towards more negative values (e.g., sample from the top of the Bed 24E) and, to a lesser extent, in trend II (sample MS 25de from Bed 25; Table 2) due to terrestrial Hg influx. Alternatively, a coal seam intruded by a contemporary sill complex during Stage 2 of the STLIP magmatic activities (Burgess et al., 2017) could also explain this feature. It is unlikely that post-depositional processes had any effect on the Hg-MIF signatures. Therefore, we can safely assume that the Δ201Hg values in the three observed trends in Figure 7A represent primary signals, originated by the Δ201Hg STLIP signatures.
The Δ199Hg curve for Meishan is characterized by positive values in pre-LPME samples (bed 24), a marked negative shift at the LPME horizon, and predominantly negative values over the extinction interval (beds 26 and 27) returning to positive values at the top of bed 29 (Figure 4). A similar pattern has been reported by Wang et al. (2018) using samples from Grasby et al. (2017), shown in Figure 4 as gray triangles along the Δ199Hg curve. The Δ199Hg (odd-MIF) curve of Guryul Ravine section displays positive values in pre-LPME samples (beds 45 and 46) and at the LPME horizon. A negative shift is observed in the extinction interval (beds 48 and 51) with a positive shift in beds 49 and 50. A discrete peak is present at the PTB horizon, and positive values predominate upsection.
In the Δ199Hg (MIF) vs. total Hg plot of the Meishan D section five trends are observed (Figure 8A). The trend I is defined by pre-LPME samples (Bed 24), while samples from the extinction interval (beds 25 and 26) represent the curved trends II and III. The trend I is consistent with Hg deposition before the sea-level fall recognized in several studies (Wu et al., 2014 and references therein) at about 0.8 m below the PTB at Xiushui PTB section, Jiangxi Province, South China. This level corresponds to the beginning of the Hindeodus changxingensis zone, correlatable to Hindeodus typicalis zone in the Meishan section. It is possible that the trend I reflects a deep-shelf setting deposition of atmospheric volcanic Hg deposition just before the above-mentioned sea-level drop. Trend II (beds 25 and 26) is consistent with a two-component mixing between terrigenous and volcanic-source Hg deposition in progressively shallower shelf settings during sea-level drop. This trend is formed by samples with both positive and negative Δ199Hg (MIF) values, while trend II (Bed 26) includes only samples with negative Δ199Hg (MIF) values. Up section, samples from bed 27 with negative Δ199Hg (MIF) values depict trend IV, and three aligned samples from bed 29 (positive, zero, and negative Δ199Hg values) suggest an additional trend (trend V).
The δ202Hg vs. Δ201Hg plot shows two trends for the Guryul Ravine section (Figure 7B). Pre-LPME samples from Bed 46 define the trend I, and samples from the extinction interval in beds 46 through 53 form trend II. In trend I, all samples display positive Δ201Hg values, and two of them fall in the “volcanic emission box” and three within the “sediment, soil and peat” box. In trend II, Δ201Hg varies from zero to slightly negative values and concentrates in the “volcanic emission box.” It is likely that these two trends have been influenced by a major eustatic event initiated at the base of Bed 46. This event, according to Brookfield et al. (2003), was characterized by an initial regression (Bed 46) before a transgression (beds 47–50). Algeo et al. (2007) have favored transgression alone, with sea-level rise initiated at the base of Bed 46 and reaching maximum flooding conditions around the PTB horizon. The sea-level changes probably influenced the shape of the Hg-isotope trends in Figure 7B: trend I (Bed 46) during the regression suggested by Brookfield et al. (2003), and trend II (beds 47–52, extinction interval) by the subsequent sea-level rise during the transgression.
The Δ199Hg vs. total Hg plot shows two trends for the Guryul Ravine section (Figure 8B). Trend I, defined by pre-LPME samples (bed 46) with positive Δ199Hg values and an almost horizontal trend II defined by samples from beds 47–53 (extinction interval) with slightly positive Δ199Hg values, except for two samples. It is possible that in trend I, the Δ199Hg values in Bed 46 samples represent mixing of terrigenous and volcanic sources of Hg, during a major eustatic sea-level variation. It is important to note that in a study of Hg anomalies from shallow and deep-water depositional environments across the LPME in South China, Wang et al. (2018) observed that: a) positive Δ199Hg values predominate in deep shelf settings, as atmosphere-derived signature of volcanic Hg (e.g., Daxiakou and Shangsi sections), and b) negative Δ199Hg values predominate in nearshore environments at Meishan D and are likely associated with the terrestrial Hg sources. Samples in trend I (Figure 8A) probably mark the time interval when atmospheric-derived Hg was deposited in a deepening-upward sequence from shallow (negative Δ199Hg) into a deep environment (positive Δ199Hg). This stage was followed by a gradual deepening of the basin as transgression progressed, and Δ199Hg values in trend II are all positive. Besides, the PTB horizon displays a positive value, higher than values in trend II, as it represents the maximum flooding in this transgression.
Conclusion
The main conclusions of this study are listed below:
1. Selected trace elements, elemental ratios, and REE + Y confirm varying paleoredox conditions in the Meishan D and Guryul Ravine sections.
2. Sea-level fluctuations across the PTB transition in these two sections controlled the detrital supply, as shown by several detrital input proxies.
3. Both sections recorded more intense environmental changes at the LPME and ETME horizons, reflected in C-isotope and Hg chemostratigraphic curves.
4. The Hg/TOC spikes coincide with a strong negative δ13C shift at the LPME horizon in both sections, probably synchronously with the initiation of the STLIP intrusive stage of magmatism (stage 2).
5. The main Hg/TOC spike in Meishan occurs at the LPME horizon; in Guryul Ravine it is at the ETME horizon, with less pronounced spikes at the PTB and LPME horizons.
6. A discrete Hg/TOC peak in Meishan (peak III) marks the change from anoxic to oxic paleoredox conditions (base of bed 27). An identical discrete spike (peak II) in Guryul Ravine at the base of bed 49 marks a change from dysoxic/oxic to anoxic conditions. The origin of this spike within the LPME–PTB interval, also observed in other PTB sections, remains an open question.
7. Normalization of Hg concentration to TOC, total sulfur or total aluminum in the studied samples allowed to infer that organic matter is the main Hg-host phase, compared to Hg hosted in sulfides or adsorbed on clay minerals.
8. Hg chemostratigraphy reveals more intense environmental changes at PTB than carbon isotope chemostratigraphy.
9. In particular, the Hg/TOC values represent a robust tool in stratigraphic correlation, as shown here for PTB sections in a transect across the Pangea Supercontinent.
Finally, Hg isotopes serve to refine the potential Hg source and associated paeoenvironmental processes. The pre-LPME samples from Meishan and Guryul Ravine exhibit positive Δ199Hg (MIF) values. In the LPME–PTB interval, negative values dominate and positive values are seen again above the ETME. These Δ199Hg patterns and correlation with total Hg reflect the influence of water depth in the deposition of atmospheric volcanic Hg at both sections, in turn, dependent upon sea-level variations (regression-transgression). Alternatively, these patterns may represent the three main stages of the dominant style of STLIP magmatism relative to the timing of mass extinction across the PTB. In stage 2 (LPME–PTB interval), a complex of sills intruded coal-bearing strata. Pre-LPME samples have positive Δ201Hg (MIF) values, but negative values dominate in the extinction interval. Most samples from Meishan and Guryul Ravine fall within the “volcanic-emission box” in the Δ202Hg (MDF) vs. Δ201Hg (MIF) plot. The Δ 201Hg (MIF) values suggest primary signals controlled by STLIP Δ201Hg signatures.
Data Availability Statement
The original contributions presented in the study are included in the article/Supplementary Material, further inquiries can be directed to the corresponding authors.
Author Contributions
AS: writing and interpretations. JC: analyses of Hg and Hg isotopes. CK: sampling collection, trace elements, Total Organic Carbon (TOC), and Rare Earth Elements (REE) analyses. LL: Hg geochemistry interpretation. MP: field work and sample collecting. JS: trace element chemostratigraphy. JS-T: samples from PTB sections. CG: text writing. VF: sample preparation and text writing. JB: figures and interpretation. NP: figures and interpretation. PR: figures and interpretation.
Funding
The study was partially supported by grants to AS (CNPq 407171/2018-5; FACEPE APQ-1073-1.07/15), to LL (CNPq INCT-TMCOcean 573.601/2008-9, CNPq576.601/2009-1), to VF (FACEPE APQ1738-1.07/12) and NSFC grants to JC (No. 41625012, U1612442, 4196114028, 41830647). MP thanks Ahsan Wani for the support and assistance during fieldwork and sampling at the Guryul Ravine and CK thanks the Danish Natural Science Research Council for providing financial support for sampling in China and to QuanFeng Zheng for leading him in the field in Meishan (Grant Number 11-103378).
Conflict of Interest
The authors declare that the research was conducted in the absence of any commercial or financial relationships that could be construed as a potential conflict of interest.
Acknowledgments
We are grateful to Olga Nielsen of De Nationale Geologiske Undersøgelser for Danmark og Grønland—GEUS. We acknowledge also J. Bojesen-Koefoed and GEUS for TOC, TC and Rock-Eval pyrolysis measurements, as well as O. Nielsen (GEUS) and B. Petersen (IGN) for running ICP-MS and carbon isotope analyses, respectively. We thank Clemens Ullmann (University of Exeter, United Kingdom) for evaluating the statistics of the ICP-MS analyses. Comments from two anonymous reviewers have helped in improving the manuscript. This is the NEG–LABISE scientific contribution n. 300.
References
Adatte, T., Keller, G., Schoene, B., Samperton, K. M., Font, E., Sial, A. N., et al. (2015). Paleoenvironmental influence of Deccan volcanism relative to the KT extinction. Geol. Soc. Am. Abstr. Programs 47 (7), 210.
Algeo, T. J., Hannigan, R., Rowe, H., Brookfield, M., Baud, A., Krystyn, L., et al. (2007). Sequencing Events across the Permian-Triassic Boundary, Guryul Ravine (Kashmir, India). Palaeogeogr. Palaeoclimatol. Palaeoecol. 252, 328–346. doi:10.1016/j.palaeo.2006.11.050
Algeo, T. J., and Liu, J. (2020). A Re-assessment of Elemental Proxies for Paleoredox Analysis. Chem. Geology. 540, 119549. doi:10.1016/j.chemgeo.2020.119549
Algeo, T. J., and Lyons, T. W. (2006). Mo-total Organic Carbon Covariation in Modern Anoxic marine Environments: Implications for Analysis of Paleoredox and Paleohydrographic Conditions. Paleooceanography 21, PA101623. doi:10.1029/2004pa001112
Algeo, T. J., and Rowe, H. (2012). Paleoceanographic Applications of Trace-Metal Concentration Data. Chem. Geology. 324-325, 6–18. doi:10.1016/j.chemgeo.2011.09.002
Algeo, T. J., and Tribovillard, N. (2009). Environmental Analysis of Paleoceanographic Systems Based on Molybdenum-Uranium Covariation. Chem. Geol. 268, 211–225. doi:10.1016/j.chemgeo.2009.09.001
Algeo, T., Shen, Y., Zhang, T., Lyons, T., Bates, S., Rowe, H., et al. (2008). Association of34S-Depleted Pyrite Layers with Negative carbonateδ13C Excursions at the Permian-Triassic Boundary: Evidence for Upwelling of Sulfidic Deep-Ocean Water Masses. Geochem. Geophys. Geosyst. 9, a–n. doi:10.1029/2007GC001823
Arthur, M. A., and Sageman, B. B. (1994). Marine Black Shales: Depositional Mechanisms and Environments of Ancient Deposits. Annu. Rev. Earth Planet. Sci. 22, 499–551. doi:10.1146/annurev.ea.22.050194.002435
Azrieli-Tal, I., Matthews, A., Bar-Matthews, M., Almogi-Labin, A., Vance, D., Archer, C., et al. (2014). Evidence from Molybdenum and Iron Isotopes and Molybdenum-Uranium Covariation for Sulphidic Bottom Waters during Eastern Mediterranean Sapropel S1 Formation. Earth Planet. Sci. Lett. 393, 231–242. doi:10.1016/j.epsl.2014.02.054
Baresel, B., Bucher, H., Brosse, M., Cordey, F., Guodun, K., and Schaltegger, U. (2017). Precise Age for the Permian-Triassic Boundary in South China from High-Precision U-Pb Geochronology and Bayesian Age-Depth Modeling. Solid Earth 8, 361–378. doi:10.5194/se-8-361-2017
Basu, A. R., Petaev, M. I., Poreda, R. J., Jacobsen, S. B., and Becker, L. (2003). Chondritic meteorite fragments associated with the Permian–Triassic boundary in Antarctica. Science 302, 1388–1392.
Bau, M., and Dulski, P. (1996). Distribution of Yttrium and Rare-Earth Elements in the Penge and Kuruman Iron-Formations, Transvaal Supergroup, South Africa. Precambrian Res. 79, 37–55. doi:10.1016/0301-9268(95)00087-9
Bau, M. (1991). Rare-earth Element Mobility during Hydrothermal and Metamorphic Fluid-Rock Interaction and the Significance of the Oxidation State of Europium. Chem. Geology. 93, 219–230. doi:10.1016/0009-2541(91)90115-8
Baud, A., Atudorei, V., and Sharp, Z. (1996). Late Permian and Early Triassic Evolution of the Northern Indian Margin: Carbon Isotope and Sequence Stratigraphy. Geodinamica Acta 9, 57–77. doi:10.1080/09853111.1996.11105278
Baud, A., and Bhat, G. (2014). “IGCP 630 Field Guide Book 1―The Permian–Triassic Transition in the Kashmir Valley,” in IGCP 630 Field Workshop in Kashmir, Kashmir, India, November 17–22, 2014, 36.
Baud, A., and Magaritz, M. (1988). Carbon Isotope Profile in the Permian–Triassic of the Central Tethys: The Kashmir Sections (India). Berichte der Geologisch. Bundesanst, Band 1, 2.
Baud, A., Magaritz, M., and Holser, W. T. (1989). Permian-Triassic of the Tethys: Carbon Isotope Studies. Geol. Rundsch 78, 649–677. doi:10.1007/bf01776196
Becker, L., Poreda, R., Basu, A., Pope, K. O., Harrison, T. M., Nicholson, C., et al. (2004). Bedout: a Possible End-Permian Impact Crater Offshore of Northwestern Australia. Science 304 (5676), 1469–1476. doi:10.1126/science.1093925
Becker, L., Poreda, R. J., Hunt, A. G., Bunch, T. E., and Rampino, M. (2001). Impact Event at the Permian-Triassic Boundary: Evidence from Extraterrestrial Noble Gases in Fullerenes. Science 291, 1530–1533. doi:10.1126/science.1057243
Benton, M. J. (2003). When Life Nearly Died – the Greatest Mass Extinction of All Time. London: Thames & Hudson, 352.
Bhandari, N., Shukla, P. N., and Azmi, R. J. (1992). Positive Europium Anomaly at the Permo-Triassic Boundary, Spiti, India. Geophys. Res. Lett. 19, 1531–1534. doi:10.1029/92gl01071
Blum, J. D., Sherman, L. S., and Johnson, M. W. (2014). Mercury Isotopes in Earth and Environmental Sciences. Annu. Rev. Earth Planet. Sci. 42, 249–269. doi:10.1146/annurev-earth-050212-124107
Bond, D. P. G., and Grasby, S. E. (2017). On the Causes of Mass Extinctions. Palaeogeogr. Palaeoclimatol. Palaeoecol. 478, 3–29. doi:10.1016/j.palaeo.2016.11.005
Bond, D. P. G., Wignall, P. B., and Grasby, S. E. (2020). The Capitanian (Guadalupian, Middle Permian) Mass Extinction in NW Pangea (Borup Fiord, Arctic Canada): A Global Crisis Driven by Volcanism and Anoxia. Geol. Soc. America Bull. 132, 931–942. doi:10.1130/B35281.1
Bond, D. P. G., and Wignall, P. B. (2010). Pyrite Framboid Study of marine Permian-Triassic Boundary Sections: A Complex Anoxic Event and its Relationship to Contemporaneous Mass Extinction. Geol. Soc. America Bull. 122, 1265–1279. doi:10.1130/b30042.1
Bond, D. P., and Wignall, P. B. (2014). Large Igneous Provinces and Mass Extinctions: an Update. Volcanism, impacts, and mass extinctions: causes and effects 505, 29–55. doi:10.1130/2014.2505(02)
Bouch, J. E., Hole, M. J., Trewin, N. H., Chenery, S., and Morton, A. C. (2002). Authigenic Apatite in a Fluvial sandstone Sequence: Evidence for Rare-Earth Element Mobility during Diagenesis and a Tool for Diagenetic Correlation. J. Sediment. Res. 72, 59–67. doi:10.1306/040301720059
Bowring, S. A., Erwin, D. H., Jin, Y. G., Martin, M. W., Davidek, K., and Wang, W. (1998). U/Pb Zircon Geochronology and Tempo of the End-Permian Mass Extinction. Science 280 (5366), 1039–1045. doi:10.1126/science.280.5366.1039
Brookfield, M. E., Algeo, T. J., Hannigan, R., Williams, J., and Bhat, G. M. (2013). Shaken and Stirred: Seismites and Tsunamites at the Permian-Triassic Boundary, Guryul Ravine, Kashmir, India. Palaios 28, 568–582. doi:10.2110/palo.2012.p12-070r
Brookfield, M. E., Stebbins, A. G., Williams, J. C., Wolbach, W. S., Hannigan, R., and Bhat, G. M. (2019). Palaeoenvironments and Elemental Geochemistry across the marine Permo‐Triassic Boundary Section, Guryul Ravine (Kashmir, India) and a Comparison with Other North Indian Passive Margin Sections. Depositional Rec. 6, 75–116. doi:10.1002/dep2.96
Brookfield, M. E. (1993). The Himalayan Passive Margin from Precambrian to Cretaceous Times. Sediment. Geol. 84, 1–35. doi:10.1016/0037-0738(93)90042-4
Brookfield, M. E., Twitchett, R. J., and Goodings, C. (2003). Palaeoenvironments of the Permian-Triassic Transition Sections in Kashmir, India. Palaeogeogr. Palaeoclimatol. Palaeoecol. 198, 353–371. doi:10.1016/s0031-0182(03)00476-0
Burger, B. J., Vargas Estrada, M., and Gustin, M. S. (2019). What Caused Earth's Largest Mass Extinction Event? New Evidence from the Permian-Triassic Boundary in Northeastern Utah. Glob. Planet. Change 177, 81–100. doi:10.1016/j.gloplacha.2019.03.013
Burgess, S. D., and Bowring, S. A. (2015). High-precision Geochronology Confirms Voluminous Magmatism before, during, and after Earth's Most Severe Extinction. Sci. Adv. 1 (7), e1500470. doi:10.1126/sciadv.1500470
Burgess, S. D., Bowring, S., and Shen, S.-z. (2014). High-precision Timeline for Earth's Most Severe Extinction. Proc. Natl. Acad. Sci. USA 111, 3316–3321. doi:10.1073/pnas.1317692111
Burgess, S. D., Muirhead, J. D., and Bowring, S. A. (2017). Initial Pulse of Siberian Traps Sills as the Trigger of the End-Permian Mass Extinction. Nat. Commun. 8, 164. doi:10.1038/s41467-017-00083-9
Campbell, I. H., Czamanske, G. K., Fedorenko, V. A., Hill, R. I., and Stepanov, V. (1992). Synchronism of the Siberian Traps and the Permian-Triassic Boundary. Science 258, 1760–1763. doi:10.1126/science.258.5089.1760
Cao, C., Love, G. D., Hays, L. E., Wang, W., Shen, S., and Summons, R. E. (2009). Biogeochemical Evidence for Euxinic Oceans and Ecological Disturbance Presaging the End-Permian Mass Extinction Event. Earth Planet. Sci. Lett. 281, 188–201. doi:10.1016/j.epsl.2009.02.012
Cao, C. Q., Yang, Y. C., Shen, S. Z., Wang, W., Zheng, Q. F., and Summons, R. E. (2010). Pattern of δ13Ccarb and Implications for Geological Events during the Permian-Triassic Transition in South China. Geol. J. 45, 186–194. doi:10.1002/gj.1220
Cao, C. Q., and Zheng, Q. F. (2007). High-resolution Lithostratigraphy of the Changhsingian Stage in Meishan Section D, Zhejiang. J. Stratigr. 31, 14–22.
Cao, C., and Zheng, Q. (2009). Geological Event Sequences of the Permian-Triassic Transition Recorded in the Microfacies in Meishan Section. Sci. China Ser. D-Earth Sci. 52 (10), 1529–1536. doi:10.1007/s11430-009-0113-0
Charbonnier, G., Morales, C., Duchamp-Alphonse, S., Westermann, S., Adatte, T., and Föllmi, K. B. (2017). Mercury Enrichment Indicates Volcanic Triggering of Valanginian Environmental Change. Sci. Rep. 7. doi:10.1038/srep40808
Chen, J., Hintelmann, H., and Dimock, B. (2010). Chromatographic Pre-concentration of Hg from Dilute Aqueous Solutions for Isotopic Measurement by MC-ICP-MS. J. Anal. Spectrom. 25, 1402–1409. doi:10.1039/c0ja00014k
Chen, Z.-Q., and Benton, M. J. (2012). The Timing and Pattern of Biotic Recovery Following the End-Permian Mass Extinction. Nat. Geosci 5, 375–383. doi:10.1038/ngeo1475
Chen, Z.-Q., Kaiho, K., and George, A. D. (2005). Survival Strategies of Brachiopod Faunas from the End-Permian Mass Extinction. Palaeogeogr. Palaeoclimatol. Palaeoecol. 224, 232–269. doi:10.1016/j.palaeo.2005.04.014
Chen, Z. Q., Yang, H., Luo, M., Benton, J. J., Kaiho, K., and Zhao, L. (2015). Complete biotic and sedimentary records of the Permian–Triassic transition from Meishan section, South China: ecologically assessing mass extinction and its aftermath. Earth Sci. Rev. 149, 67–107.
Clarkson, M. O., Kasemann, S. A., Wood, R. A., Lenton, T. M., Daines, S. J., Richoz, S., et al. (2015). Ocean Acidification and the Permo-Triassic Mass Extinction. Science 348 (8), 229–232. doi:10.1126/science.aaa0193
Courtillot, V. E., and Renne, P. R. (2003). On the Ages of Flood basalt Events. Comptes Rendus Geosci. 335 (1), 113–140. doi:10.1016/s1631-0713(03)00006-3
Courtillot, V., Jaupart, C., Manighetti, I., Tapponnier, P., and Besse, J. (1999). On Causal Links between Flood Basalts and continental Breakup. Earth Planet. Sci. Lett. 166, 177–195. doi:10.1016/s0012-821x(98)00282-9
Courtillot, V. (1994). Mass Extinctions in the Last 300 Million Years: One Impact and Seven Flood Basalts? Isr. J. Earth Sci. 43, 255–266.
Dèzes, P. (1999). Tectonic and Metamorphic Evolution of the Central Himalayan Domain in Southeast Zanskar (Kashmir India). Mémoires de Géologie 32, 1–149.
Elderfield, H., and Pagett, R. (1986). Rare Earth Elements in Ichthyoliths: Variations with Redox Conditions and Depositional Environment. Sci. Total Environ. 49, 175–197. doi:10.1016/0048-9697(86)90239-1
Erwin, D. H., Bowring, S. A., and Yugan, J. (2002). “End-Permian Mass Extinctions: a Review,” in Catastrophic Events and Mass Extinctions: Impacts and beyond. Editors C. Koeberl, and K. G. MacLeod (Boulder: Geological Society of America Special Paper), 356, 363–383. doi:10.1130/0-8137-2356-6.363
Erwin, D. H. (2006). Extinction: How Life on Earth Nearly Ended 250 Million Years Ago. New Jersey: Princeton University Press, 296.
Faggetter, L. E., Wignall, P. B., Pruss, S. B., Jones, D. S., Grasby, S., Widdowson, M., et al. (2019). Mercury Chemostratigraphy across the Cambrian Series 2 - Series 3 Boundary: Evidence for Increased Volcanic Activity Coincident with Extinction? Chem. Geol. 510, 188–199. doi:10.1016/j.chemgeo.2019.02.006
Fantle, M. S., Barnes, B. D., and Lau, K. V. (2020). The Role of Diagenesis in Shaping the Geochemistry of the Marine Carbonate Record. Annu. Rev. Earth Planet. Sci. 48, 549–583. doi:10.1146/annurev-earth-073019-060021
Farley, K., Ward, P., Garrison, G., and Mukhopadhyay, S. (2005). Absence of Extraterrestrial 3He in Permian-Triassic Age Sedimentary Rocks. Earth Planet. Sci. Lett. 240, 265–275. doi:10.1016/j.epsl.2005.09.054
Fitzgerald, W. F., and Lamborg, C. H. (2005). “Geochemistry of Mercury in the Environment,” in Environmental Geochemistry, Treatise on Geochemistry, V9. Editor B. Sherwood Lollar (Elsevier), 107–148.
Font, E., Adatte, T., Sial, A. N., Drude de Lacerda, L., Keller, G., and Punekar, J. (2016). Mercury Anomaly, Deccan Volcanism, and the End-Cretaceous Mass Extinction. Geology 44, 171–174. doi:10.1130/g37451.1
Garzanti, E., Angiolini, L., and Sciunnach, D. (1996). The Permian Kuling Group (Spiti, Lahaul and Zanskar; NW Himalaya): Sedimentary Evolution during Rift/drift Transition and Initial Opening of Neo-Tethys. Rivista Italiana di Paleontologia e Stratigrafia 102, 175–200.
Garzanti, E., Nicora, A., and Rettori, R. (1998). Permo-Triassic Boundary and Lower to Middle Triassic in South Tibet. J. Asian Earth Sci. 16, 143–157. doi:10.1016/s0743-9547(98)00007-5
Georgiev, S. V., Stein, H. J., Yang, G., Hannah, J. L., Böttcher, M. E., Grice, K., et al. (2020). Late Permian-Early Triassic Environmental Changes Recorded by Multi-Isotope (Re-os-N-Hg) Data and Trace Metal Distribution from the Hovea-3 Section, Western Australia. Gondwana Res. 88, 353–372. doi:10.1016/j.gr.2020.07.007
Ghosh, N., Basu, A. R., Bhargava, O. N., Shukla, U. K., Ghatak, A., Garzione, C. N., et al. (2016). Catastrophic Environmental Transition at the Permian-Triassic Neo-Tethyan Margin of Gondwanaland: Geochemical, Isotopic and Sedimentological Evidence in the Spiti Valley, India. Gondwana Res. 34, 324–345. doi:10.1016/j.gr.2015.04.006
Glikson, A. (2004). Comment on "Bedout: A Possible End-Permian Impact Crater Offshore of Northwestern Australia". Science 306, 613b. doi:10.1126/science.1100404
Gong, Q., Wang, X., Zhao, L., Grasby, S. E., Chen, Z.-Q., Zhang, L., et al. (2017). Mercury Spikes Suggest Volcanic Driver of the Ordovician-Silurian Mass Extinction. Sci. Rep. 7, 5304. doi:10.1038/s41598-017-05524-5
Grard, A., Francois, L., Dessert, C., Dupre, B., and Godderis, Y. (2005). Basaltic Volcanism and Mass Extinction at the Permo-Triassic Boundary: Environmental Impact and Modeling of the Global Carbon Cycle. Earth Planet. Sci. Lett. 234, 207–221. doi:10.1016/j.epsl.2005.02.027
Grasby, S. E., Beauchamp, B., Bond, D. P. G., Wignall, P. B., and Sanei, H. (2015a). Mercury Anomalies Associated with Three Extinction Events (Capitanian Crisis, Latest Permian Extinction and the Smithian/Spathian Extinction) in NW Pangea. Geol. Mag. 153, 285–297. doi:10.1017/S0016756815000436
Grasby, S. E., Beauchamp, B., Bond, D. P. G., Wignall, P., and Talavera, C. (2015b). Progressive environmental deterioration in northwestern Pangea leading to the latest Permian extinction. Geol. Soc. Am. Bull. 127, 1311–1347.
Grasby, S. E., Liu, X., Yin, R., Ernst, R. E., and Chen, Z. (2020). Toxic Mercury Pulses into Late Permian Terrestrial and marine Environments. Geology 48, 830–833. doi:10.1130/G47295.1
Grasby, S. E., Sanei, H., Beauchamp, B., and Chen, Z. (2013). Mercury deposition through the Permo–Triassic Biotic Crisis. Chem. Geol. 351, 209–216. doi:10.1130/G38487.1
Grasby, S. E., Shen, W., Yin, R., Gleason, J. D., Blum, J. D., Lepak, R. F., et al. (2017). Isotopic Signatures of Mercury Contamination in Latest Permian Oceans. Geology 45, 55–58. doi:10.1130/G38487.1
Grasby, S. E., Them, T. R., Chen, Z., Yin, R., and Ardakani, O. H. (2019). Mercury as a Proxy for Volcanic Emissions in the Geologic Record. Earth-Science Rev. 196, 102880. doi:10.1016/j.earscirev.2019.102880
Grice, K., Cao, C., Love, G. D., Bottcher, M. E., Twitchett, R. J., Grosjean, E., et al. (2005). Photic Zone Euxinia during the Permian-Triassic Superanoxic Event. Science 307, 706–709. doi:10.1126/science.1104323
Hallam, A., and Wignall, P. B. (1999). Mass Extinctions and Sea-Level Changes. Earth-Science Rev. 48, 217–250. doi:10.1016/s0012-8252(99)00055-0
Herren, E. (1987). Zanskar Shear Zone: Northeast-Southwest Extension within the Higher Himalayas (Ladakh, India). Geol 15, 409–413. doi:10.1130/0091-7613(1987)15<409:zsznew>2.0.co;2
Hinojosa, J. L., Brown, S. T., Chen, J., DePaolo, D. J., Paytan, A., Shen, S.-z., et al. (2012). Evidence for End-Permian Ocean Acidification from Calcium Isotopes in Biogenic Apatite. Geology 40, 743–746. doi:10.1130/G33048.1
Hofmann, R., Buatois, L. A., MacNaughton, R. B., and Mángano, M. G. (2015). Loss of the Sedimentary Mixed Layer as a Result of the End-Permian Extinction. Palaeogeogr. Palaeoclimatol. Palaeoecol. 428, 1–11. doi:10.1016/j.palaeo.2015.03.036
Holland, G., Tanner, S. D., Ottley, C. J., Pearson, D. G., and Irvine, G. J. (2003). “A routine method for the dissolution of geological samples for the analysis of REE and trace elements via ICP-MS,” in Plasma Source Mass Spectrometry, Applications and Emerging Technologies. Editors G. Holland, and S D. Tanner (Cambridge: Royal Society of Chemistry), 221–230.
Hood, A. v. S., Planavsky, N. J., Wallace, M. W., and Wang, X. (2018). The Effects of Diagenesis on Geochemical Paleoredox Proxies in Sedimentary Carbonates. Geochimica et Cosmochimica Acta 232, 265–287. doi:10.1016/j.gca.2018.04.022
Hoskin, P. W. O., and Ireland, T. R. (2000). Rare Earth Element Chemistry of Zircon and its Use as a Provenance Indicator. Geology 28, 627–630. doi:10.1130/0091-7613(2000)028<0627:reecoz>2.3.co;2
Huang, Q., Chen, J., Huang, W., Reinfelder, J. R., Fu, P., Yuan, S., et al. (2019). Diel Variation in Mercury Stable Isotope Ratios Records Photoreduction of PM2.5-bound Mercury. Atmos. Chem. Phys. 19, 315–325. doi:10.5194/acp-19-315-2019
Huang, Q., Liu, Y., Chen, J., Feng, X., Huang, W., Yuan, S., et al. (2015). An Improved Dual-Stage Protocol to Pre-concentrate Mercury from Airborne Particles for Precise Isotopic Measurement. J. Anal. Spectrom. 30, 957–966. doi:10.1039/c4ja00438h
Huang, Y., Chen, Z.-Q., Algeo, T. J., Zhao, L., Baud, A., Bhat, G. M., et al. (2019). Two-stage marine Anoxia and Biotic Response during the Permian-Triassic Transition in Kashmir, Northern India: Pyrite Framboid Evidence. Glob. Planet. Change 172, 124–139. doi:10.1016/j.gloplacha.2018.10.002
Isozaki, Y. (1997). Permo-Triassic Boundary Superanoxia and Stratified Superocean: Records from Lost Deep Sea. Science 276, 235–238. doi:10.1126/science.276.5310.235
Jiang, Y., Tang, Y., and Chou, C. (2006). Research on Genesis of Pyrite near the Permian-Triassic Boundary in Meishan, Zhejiang, China. J. China Univ. Min. Technol. 16, 457–460. doi:10.1016/S1006-1266(07)60047-9
Jin, Y. G., Wang, Y., Wang, W., Shang, Q. H., Cao, C. Q., and Erwin, D. H. (2000). Pattern of Marine Mass Extinction Near the Permian-Triassic Boundary in South China. Science 289, 432–436. doi:10.1126/science.289.5478.432
Jin, Y., Wang, Y., Henderson, C., Wardlaw, B. R., Shen, S., and Cao, C. (2006). The Global Boundary Stratotype Section and point (GSSP) for the Base of Changhsingian Stage (Upper Permian). Episodes 29, 175–182. doi:10.18814/epiiugs/2006/v29i3/003
Jones, D. S., Martini, A. M., Fike, A., and Kaiho, K. (2017). A volcanic trigger for the Late Ordovician mass extinction? Mercury data from south China and Laurentia. Geology. doi:10.1130/G38940.1
Kaiho, K., Kajiwara, Y., Chen, Z.-Q., and Gorjan, P. (2006). A Sulfur Isotope Event at the End of the Permian. Chem. Geology. 235, 33–47. doi:10.1016/j.chemgeo.2006.06.001
Kaiho, K., Kajiwara, Y., Nakano, T., Miura, Y., Kawahata, H., Tazaki, K., et al. (2001). End-Permian Catastrophe by a Bolide Impact: Evidence of a Gigantic Release of Sulfur from the Mantle. Geol 29, 815–818. doi:10.1130/0091-7613(2001)029<0815:epcbab>2.0.co;2
Kaiho, K., Saito, R., Ito, K., Miyaji, T., Biswas, R., Tian, L., et al. (2016). Effects of Soil Erosion and Anoxic-Euxinic Ocean in the Permian-Triassic marine Crisis. Heliyon 2, e00137. doi:10.1016/j.heliyon.2016.e00137
Kamo, S. L., Czamanske, G. K., Amelin, Y., Fedorenko, V. A., Davis, D. W., and Trofimov, V. R. (2003). Rapid Eruption of Siberian Flood-Volcanic Rocks and Evidence for Coincidence with the Permian-Triassic Boundary and Mass Extinction at 251 Ma. Earth Planet. Sci. Lett. 214, 75–91. doi:10.1016/s0012-821x(03)00347-9
Kapoor, H. M. (1992). “Permo-Triassic boundary of the Indian subcontinent and its intercontinental correlation,” in Permo-Triassic events in the eastern Tethys. Editor W. C. Sweet, Z. Yang, J. M. Dickins, and H. Yin (Cambridge: Cambridge University Press), 21–36.
Kapoor, H. M. (1996). “The Guryul Ravine Section, Candidate of the Global Stratotype and point (GSSP) of the Permian–Triassic Boundary (PTB),” in The Paleozoic–Mesozoic Boundary: Candidates of the Global Stratotype Section and Point of the Permian–Triassic Boundary. Editor H. Yin (Wuhan: China University Geoscience Press), 99–110.
Keller, G., Mateo, P., Monkenbusch, J., Thibault, N., Punekard, J., Spangenberg, J. E., et al. (2020). Mercury Linked to Deccan Traps Volcanism, Climate Change and the End-Cretaceous Mass Extinction. Volume 194, 103312. Glob. Planet. Change 198, 103388. doi:10.1016/j.gloplacha.2020.103388
Kershaw, S., Crasquin, S., Li, Y., Collin, P.-Y., and Forel, M.-B. (2012). Ocean Acidification and the End-Permian Mass Extinction: To what Extent Does Evidence Support Hypothesis? Geosciences 2, 221–234. doi:10.3390/geosciences2040221
Koeberl, C., Farley, K. A., Peucker-Ehrenbrink, B., and Sephton, M. A. (2004). Geochemistry of the End-Permian Extinction Event in Austria and Italy: No Evidence for an Extraterrestrial Component. Geol 32, 1053–1056. doi:10.1130/g20907.1
Korte, C., Pande, P., Kalia, P., Kozur, H. W., Joachimski, M. M., and Oberhänsli, H. (2010). Massive Volcanism at the Permian-Triassic Boundary and its Impact on the Isotopic Composition of the Ocean and Atmosphere. J. Asian Earth Sci. 37, 293–311. doi:10.1016/j.jseaes.2009.08.012
Korte, C., Ruh, M., Palfy, J., Ullmann, C. V., and Hesselbo, S. P. (2019). “Chemostratigraphy across the Triassic–Jurassic Boundary,” in Chemostratigraphy across Major Chronological Boundaries, AGU/Geophysical Monograph 240. Editors A.N. Sial, C. Gaucher, M. Ramkumar, and V.P. Ferreira (John Wiley & Sons), 185–210.
Kravchinsky, V. A. (2012). Paleozoic Large Igneous Provinces of Northern Eurasia: Correlation with Mass Extinction Events. Glob. Planet. Change 86-87, 31–36. doi:10.1016/j.gloplacha.2012.01.007
Krystyn, L., Horacek, M., Brandner, R., and Suraj, P. (2014). Late Permian Tsunamites in Guryul Ravine (Kashmir, India) – Revisited and Rejected. Geophys. Res. Abstr. 16. EGU2014-15312.
Krystyn, L., Richoz, S., Baud, A., and Twitchett, R. J. (2003). A Unique Permian-Triassic Boundary Section from the Neotethyan Hawasina Basin, Central Oman Mountains. Palaeogeogr. Palaeoclimatol. Palaeoecol. 191, 329–344. doi:10.1016/s0031-0182(02)00670-3
Kumar, K., Tewari, R., Agnihotri, D., Sharma, A., Pandita, S. K., Pillai, S. S. K., et al. (2017). Geochemistry of the Permian-Triassic Sequences of the Guryul Ravine Section, Jammu and Kashmir, India: Implications for Oceanic Redox Conditions. GeoResJ 13, 114–125. doi:10.1016/j.grj.2017.02.006
Kwon, H., Kim, M. G., and Lee, Y. I. (2019). Mercury Evidence from the Sino-Korean Block for Emeishan Volcanism during the Capitanian Mass Extinction. Geol. Mag. 156, 1105–1110. doi:10.1017/s0016756818000481
Lau, K. V., Maher, K., Altiner, D., Kelley, B. M., Kump, L. R., Lehrmann, D. J., et al. (2016). Marine Anoxia and Delayed Earth System Recovery after the End-Permian Extinction. Proc. Natl. Acad. Sci. USA 113 (9), 2360–2365. doi:10.1073/pnas.1515080113
Lehrmann, D. J., Payne, J. L., Felix, S. V., Dillett, P. M., Wang, H., Yu, Y., et al. (2003). Permian-Triassic Boundary Sections from Shallow-Marine Carbonate Platforms of the Nanpanjiang Basin, South China: Implications for Oceanic Conditions Associated with the End-Permian Extinction and its Aftermath. Palaios 18, 138–152. doi:10.1669/0883-1351(2003)18<138:pbsfsc>2.0.co;2
Li, R., and Jones, B. (2017). Diagenetic Overprint on Negative δ13C Excursions across the Permian/Triassic Boundary: A Case Study from Meishan Section, China. Palaeogeogr. Palaeoclimatol. Palaeoecol. 468, 18–33. doi:10.1016/j.palaeo.2016.11.044
Liu, X.-M., Hardisty, D. S., Lyons, T. W., and Swart, P. K. (2019). Evaluating the Fidelity of the Cerium Paleoredox Tracer during Variable Carbonate Diagenesis on the Great Bahamas Bank. Geochim. Cosmochim. Acta 248, 25–42. doi:10.1016/j.gca.2018.12.028
Lo, C.-H., Chung, S.-L., Lee, T.-Y., and Wu, G. (2002). Age of the Emeishan Flood Magmatism and Relations to Permian-Triassic Boundary Events. Earth Planet. Sci. Lett. 198, 449–458. doi:10.1016/s0012-821x(02)00535-6
Matsuda, H., and Egami, T. (1983). Atomic Structure of Zero-Magnetostrictive Amorphous Fe4.7Co70.3Si15B10 alloy. Mater. Sci. Eng. 60, 87–93. doi:10.1016/0025-5416(83)90081-2
Matsuda, T. (1981). Early Triassic Conodonts from Kashmir, India; Part 1, Hindeodus and Isarcicella. J. Geosci., Osaka City Univ. 23, 75–100.
Matsuda, T. (1982). Early Triassic Conodonts from Kashmir, India; Part 2, Neospathodus. J. Geosci., Osaka City Univ. 25, 87–102.
Matsuda, T. (1984). Early Triassic Conodonts from Kashmir, India, Part 4: Gondolella and Platyvillosus. J. Geosci. Osaka City Univ. 27, 119–141.
Meyer, K. W., Petersen, S. V., Lohmann, K. C., Blum, J. D., Washburn, S. J., Johnson, M. W., et al. (2019). Biogenic Carbonate Mercury and marine Temperature Records Reveal Global Influence of Late Cretaceous Deccan Traps. Nat. Commun. 10, 5356. doi:10.1038/s41467-019-13366-0
Moynier, F., Chen, J., Zhang, K., Cai, H., Wang, Z., Jackson, M. G., et al. (2020). Chondritic Mercury Isotopic Composition of Earth and Evidence for Evaporative Equilibrium Degassing during the Formation of Eucrites. Earth Planet. Sci. Lett. 551, 116544. doi:10.1016/j.epsl.2020.116544
Müller, R. D., Goncharov, A., and Kritski, A. (2005). Geophysical Evaluation of the Enigmatic Bedout Basement High, Offshore Northwestern Australia. Earth Planet. Sci. Lett. 237, 264–284. doi:10.1016/j.epsl.2005.06.014
Murata, M. (1981). Late Permian and Early Triassic Conodonts from Upper Permian and Lower Triassic Faunas of Kashmir. Palaeontologica Indica New Ser. 46, 179–186.
Nakazawa, K., Kapoor, H. M., Ishii, K., Bando, Y., Okimura, Y., and Tokuoka, T. (1975). The Upper Permian and Lower Triassic in Kashmir, India: Mem. Fac. Sci. Kyoto Univ. Ser. Geol. Min. v. XLII, 1–106.
Nakazawa, K., Kapoor, H. M., Ishii, Y., Bando, T., Maegoya, D., Shimizu, D., et al. (1970). Preliminary Report on the Permo–Trias of Kashmir, India. Mem. Fac. Sci. Kyoto Univ. Ser. Geology. Mineralogy 37, 163–172.
Nakazawa, K., and Kapoor, H. M. (1981). The Upper Permian and Lower Triassic Faunas of Kashmir. Palaeontologica Indica New Ser. 46, 1–191.
Nascimento-Silva, M. V., Sial, A. N., Ferreira, V. P., Barbosa, J. A., Neumann, V. H., Pimentel, M. M., et al. (2013). “Carbon Isotopes, Rare-Earth Elements and Mercury Behavior of Maastrichtian–Danian Carbonate Succession of the Paraíba Basin, Northeastern Brazil,” in Isotopic Studies in Cretaceous Research. Editors A.V. Bojar, M. C. Melinte-Dobrinescu, and J. Smit (London: Geological Society, London, Special Publications), 382, 85‒104. doi:10.1144/sp382.2
Nascimento-Silva, V. M., Sial, A. N., Ferreira, V. P., Neumann, V. H., Barbosa, J. A., Pimentel, M. M., et al. (2011). Cretaceous–Paleogene Transition at the Paraíba Basin, Northeastern, Brazil: Carbon-Isotope and Mercury Subsurface Stratigraphies. J. South Am. Earth Sci. 32, 379‒392. doi:10.1016/j.jsames.2011.02.014
Payne, J. L., Turchyn, A. V., Paytan, A., DePaolo, D. J., Lehrmann, D. J., Yu, M., et al. (2010). Calcium Isotope Constraints on the End-Permian Mass Extinction. Proc. Natl. Acad. Sci. 107, 8543–8548. doi:10.1073/pnas.0914065107
Percival, L. M. E., Jenkyns, H. C., Mather, T. A., Dickson, A. J., Batenburg, S. J., Ruhl, M., et al. (2018). Does Large Igneous Province Volcanism Always Perturb the Mercury Cycle? Comparing the Records of Oceanic Anoxic Event 2 and the End-Cretaceous to Other Mesozoic Events. Am. J. Sci. 318, 799–860. doi:10.2475/08.2018.01
Percival, L. M. E., Ruhl, M., Hesselbo, S. P., Jenkyns, H. C., Mather, T. A., and Whiteside, J. H. (2017). Mercury Evidence for Pulsed Volcanism during the End-Triassic Mass Extinction. Proc. Natl. Acad. Sci. USA 114 (30), 7929–7934. doi:10.1073/pnas.1705378114
Percival, L. M. E., Witt, M. L. I., Mather, T. A., Hermoso, M., Jenkyns, H. C., Hesselbo, S. P., et al. (2015). Globally Enhanced Mercury Deposition during the End-Pliensbachian Extinction and Toarcian OAE: A Link to the Karoo-Ferrar Large Igneous Province. Earth Planet. Sci. Lett. 428, 267–280. doi:10.1016/j.epsl.2015.06.064
Pi, D.-H., Liu, C.-Q., Shields-Zhou, G. A., and Jiang, S.-Y. (2013). Trace and Rare Earth Element Geochemistry of Black Shale and Kerogen in the Early Cambrian Niutitang Formation in Guizhou Province, South China: Constraints for Redox Environments and Origin of Metal Enrichments. Precambrian Res. 225, 218–229. doi:10.1016/j.precamres.2011.07.004
Racki, G. (2020). “Volcanism as a Prime Cause of Mass Extinctions: Retrospectives and Perspectives,” in Mass Extinctions, Volcanism, and Impacts: New Developments. Editors T. Adatte, D. P. G. Bond, and G. Keller (Boulder: Geological Society of America Special Paper), 544, 1–34. doi:10.1130/2020.2544(0110.1130/2020.2544(01)
Rampino, M. R., Prokoph, A., and Adler, A. (2000). Tempo of the End-Permian Event: High-Resolution Cyclostratigraphy at the Permian-Triassic Boundary. Geology 28, 643–646. doi:10.1130/0091-7613(2000)028<0643:totepe>2.3.co;2
Raup, D. M., and Sepkoski, J. J. (1982). Mass Extinctions in the Marine Fossil Record. Science 215 (4539), 1501–1503. doi:10.1126/science.215.4539.1501
Reichow, M. K., Pringle, M. S., Al'Mukhamedov, A. I., Allen, M. B., Andreichev, V. L., Buslov, M. M., et al. (2009). The Timing and Extent of the Eruption of the Siberian Traps Large Igneous Province: Implications for the End-Permian Environmental Crisis. Earth Planet. Sci. Lett. 277, 9–20. doi:10.1016/j.epsl.2008.09.030
Renne, P. R., Sprain, C. J., Richards, M. A., Self, S., Vanderkluysen, L., and Pande, K. (2015). State Shift in Deccan Volcanism at the Cretaceous-Paleogene Boundary, Possibly Induced by Impact. Science 350, 76–78. doi:10.1126/science.aac7549
Renne, P. R., Black, M. T., Zichao, Z., Richards, M. A., and Basu, A. R. (1995). Synchrony and Causal Relations between Permian-Triassic Boundary Crises and Siberian Flood Volcanism. Science 269, 1413–1416. doi:10.1126/science.269.5229.1413
Sabatino, N., Ferraro, S., Coccioni, R., Bonsignore, M., Del Core, M., Tancredi, V., et al. (2018). Mercury Anomalies in Upper Aptian-Lower Albian Sediments from the Tethys Realm. Palaeogeogr. Palaeoclimatol. Palaeoecol. 495, 163–170. doi:10.1016/j.palaeo.2018.01.008
Sanei, H., Grasby, S. E., and Beauchamp, B. (2012). Latest Permian Mercury Anomalies. Geology 40, 63‒66. doi:10.1130/g32596.1
Schoene, B., Eddy, M. P., Samperton, K. M., Keller, C. B., Keller, G., Adatte, T., et al. (2019). U-Pb Constraints on Pulsed Eruption of the Deccan Traps across the End-Cretaceous Mass Extinction. Science 363, 862–866. doi:10.1126/science.aau2422
Schoene, B., Samperton, K. M., Eddy, M. P., Keller, G., Adatte, T., Bowring, S. A., et al. (2015). U-Pb Geochronology of the Deccan Traps and Relation to the End-Cretaceous Mass Extinction. Science 347, 182–184. doi:10.1126/science.aaa0118
Seyedolali, G. J., Holser, W. T., Krull, E. S., Holser, W. T., Ambers, C. P., and Kyte, F. T. (1998). Search for Evidence of Impact at the Permian-Triassic Boundary in Antarctica and Australia. Geol 26, 979–982. doi:10.1130/0091-7613(1998)026<0979:sfeoia>2.3.co;2
Shellnutt, J. G., Bhat, G. M., Brookfield, M. E., and Jahn, B.-M. (2011). No Link between the Panjal Traps (Kashmir) and the Late Permian Mass Extinctions. Geophys. Res. Lett. 38, L19308. doi:10.1029/2011GL049032
Shellnutt, J. G., Bhat, G. M., Wang, K.-L., Brookfield, M. E., Jahn, B.-M., and Dostal, J. (2014). Petrogenesis of the Flood Basalts from the Early Permian Panjal Traps, Kashmir, India: Geochemical Evidence for Shallow Melting of the Mantle. Lithos 204, 159–171. doi:10.1016/j.lithos.2014.01.008
Shen, J., Algeo, T. J., Planavsky, N. J., Yu, J., Feng, Q., Song, H., et al. (2019c). Mercury Enrichments Provide Evidence of Early Triassic Volcanism Following the End-Permian Mass Extinction. Earth-Science Rev. 195, 191–212. doi:10.1016/j.earscirev.2019.05.010
Shen, J., Chen, J., Algeo, T. J., Yuan, S., Feng, Q., Yu, J., et al. (2019a). Evidence for a Prolonged Permian-Triassic Extinction Interval from Global marine Mercury Records. Nat. Commun. 10, 1563. doi:10.1038/s41467-019-09620-0
Shen, J., Feng, Q., Algeo, T. J., Liu, J., Zhou, C., Wei, W., et al. (2020). Sedimentary Host Phases of Mercury (Hg) and Implications for Use of Hg as a Volcanic Proxy. Earth Planet. Sci. Lett. 543, 1163. doi:10.1016/j.epsl.2020.116333
Shen, J., Yu, J., Chen, J., Algeo, T. J., Xu, G., Feng, Q., et al. (2019b). Mercury Evidence of Intense Volcanic Effects on Land during the Permian-Triassic Transition. Geology 47 (12), 1117–1121. doi:10.1130/g46679.1
Shen, S-Z., Ramezani, J., Chen, J., Cao, C.-Q., Erwin, D. H., Zhang, H., et al. (2018). A Sudden End-Permian Mass Extinction in South China. Geol. Soc. America Bull. 131, 205–223. doi:10.1130/B31909.1
Shen, S.-z., Crowley, J. L., Wang, Y., Bowring, S. A., Erwin, D. H., Sadler, P. M., et al. (2011). Calibrating the End-Permian Mass Extinction. Science 334, 1367–1372. doi:10.1126/science.1213454
Shen, S. Z., Cao, C.-Q., Henderson, C. M., Wang, X.-D., Shi, G. R., Wang, Y., et al. (2006). End-Permian Mass Extinction Pattern in the Northern Peri-Gondwanan Region. Palaeoworld 15, 3–30. doi:10.1016/j.palwor.2006.03.005
Shen, W., Lin, Y., Xu, L., Li, J., Wu, Y., and Sun, Y. (2007). Pyrite Framboids in the Permian-Triassic Boundary Section at Meishan, China: Evidence for Dysoxic Deposition. Palaeogeogr. Palaeoclimatol. Palaeoecol. 253, 323–331. doi:10.1016/j.palaeo.2007.06.005
Sheng, J., Chen, C., Wang, Y., Rui, L., Liao, Z., Dando, Y., et al. (1984). Permian–Triassic Boundary in Middle and Eastern Tethys. J. Fac. Sci. Hokkaido Univ. 21 (Ser. 4), 133–181.
Shields, G., and Stille, P. (2001). Diagenetic Constrains on the Use of Cerium Anomalies as Palaeoseawater Proxies: an Isotopic and REE Study of Cambrian Phosphorites. ChemGeol 175, 29–48.
Sial, A. N., Chen, J., Korte, C., Pandit, M. K., Spangenberg, J., Silva-Tamayo, J. C., et al. (2020a). “Globally Enhanced Hg Concentration and Hg and C Isotopes in Permian-Triassic Boundary Successions: Possible Linkage to Volcanism,” in Stratigraphy & Timescales. Editor M. Montenari (London: Elsevier Inc), Vol. 5, 567–628. Chapter 11. doi:10.1016/bs.sats.2020.08.011
Sial, A. N., Chen, J., Lacerda, L. D., Frei, R., Higgins, J., Tewari, V. C., et al. (2019). “Chemostratigraphy across the Cretaceous–Paleogene (K/Pg) Boundary: Testing the Impact and Volcanism Hypotheses,” in Chemostratigraphy across Major Chronological Boundaries. Geophysical Monograph Series 240. Editors A. N. Sial, C. Gaucher, M. Ramkumar, and V. P. Ferreira (Hoboken: John Wiley & Sons), 223–257.
Sial, A. N., Chen, J., Lacerda, L. D., Frei, R., Tewari, V. C., Pandit, M. K., et al. (2016). Mercury Enrichment and Hg Isotopes in Cretaceous-Paleogene Boundary Successions: Links to Volcanism and Palaeoenvironmental Impacts. Cretaceous Res. 66, 60–81. doi:10.1016/j.cretres.2016.05.006
Sial, A. N., Chen, J., Lacerda, L. D., Korte, C., Spangenberg, J. E., Silva-Tamayo, J. C., et al. (2020b). Globally Enhanced Hg Deposition and Hg Isotopes in Sections Straddling the Permian-Triassic Boundary: Link to Volcanism. Palaeogeogr. Palaeoclimatol. Palaeoecol. 540, 109537. doi:10.1016/j.palaeo.2019.109537
Sial, A. N., Chen, J., Lacerda, L. D., Peralta, S., Gaucher, C., Frei, R., et al. (2014). High-resolution Hg Chemostratigraphy: A Contribution to the Distinction of Chemical Fingerprints of the Deccan Volcanism and Cretaceous-Paleogene Boundary Impact Event. Palaeogeogr. Palaeoclimatol. Palaeoecol. 414, 98–115. doi:10.1016/j.palaeo.2014.08.013
Sial, A. N., Gaucher, C., Filho, M. A. d. S., Ferreira, V. P., Pimentel, M. M., Lacerda, L. D., et al. (2010). C-, Sr-Isotope and Hg Chemostratigraphy of Neoproterozoic Cap Carbonates of the Sergipano Belt, Northeastern Brazil. Precambrian Res. 182, 351–372. doi:10.1016/j.precamres.2010.05.008
Sial, A. N., Lacerda, L. D., Ferreira, V. P., Frei, R., Marquillas, R. A., Barbosa, J. A., et al. (2013). Mercury as a Proxy for Volcanic Activity during Extreme Environmental Turnover: The Cretaceous-Paleogene Transition. Palaeogeogr. Palaeoclimatol. Palaeoecol. 387, 153–164. doi:10.1016/j.palaeo.2013.07.019
Silva-Tamayo, J. C., Lau, K. V., Jost, A. B., Payne, J. L., Wignall, P. B., Newton, R. J., et al. (2018). Global Perturbation of the marine Calcium Cycle during the Permian-Triassic Transition. Bull. Geol. Soc. America 130, 1323–1338. doi:10.1130/b31818.1
Singh, B. P. (2012). How Deep Was the Early Himalayan Foredeep? J. Asian Earth Sci. 56, 24–32. doi:10.1016/j.jseaes.2012.04.026
Singh, V., Pandita, S. K., Tewari, R., Hengstum, P. J. V., Pillai, S. S. K., Agnihotri, D., et al. (2015). Thecamoebians (testate amoebae) straddling the Permian–Triassic boundary in the Guryul ravine section, India: evolutionary and Palaeoecological implications PLoS One 10 (8).
Song, H., Tong, J., Tian, L., Song, H., Qiu, H., Zhu, Y., et al. (2014). Paleo-redox Conditions across the Permian-Triassic Boundary in Shallow Carbonate Platform of the Nanpanjiang Basin, South China. Sci. China Earth Sci.Earth Sci. 57, 1030–1038. doi:10.1007/s11430-014-4843-2
Song, H., Wignall, P. B., Tong, J., and Yin, H. (2013). Two Pulses of Extinction during the Permian-Triassic Crisis. Nat. Geosci 6, 52–56. doi:10.1038/ngeo1649
Sosa-Montes de Oca, C., Rodríguez-Tovar, F. J., Martínez-Ruiz, F., and Monaco, P. (2017). Paleoenvironmental Conditions across the Cretaceous-Paleogene Transition at the Apennines Sections (Italy): An Integrated Geochemical and Ichnological Approach. Cretaceous Res. 71, 1–13. doi:10.1016/j.cretres.2016.11.005
Sprain, C. J., Renne, P. R., Vanderkluysen, L., Pande, K., Self, S., and Mittal, T. (2019). The Eruptive Tempo of Deccan Volcanism in Relation to the Cretaceous-Paleogene Boundary. Science 363, 866–870. doi:10.1126/science.aav1446
Taylor, S. R., and McLennan, S. M. (1985). The Continental Crust; its Composition and Evolution. London: Blackwell, 312.
Teichert, C., Kummnel, B., and Kapoor, H. M. (1970). Mixed Permian-Triassic Fauna, Guryul Ravine, Kashmir. Science 167, 174–175. doi:10.1126/science.167.3915.174
Tewari, R., Awatar, R., Pandita, S. K., McLoughlin, S., Agnihotri, D., Pillai, S. S. K., et al. (2015). The Permian-Triassic Palynological Transition in the Guryul Ravine Section, Kashmir, India: Implications for Tethyan-Gondwanan Correlations. Earth-Science Rev. 149, 53–66. doi:10.1016/j.earscirev.2014.08.018
Them, T. R., Jagoe, C. H., Caruthers, A. H., Gill, B. C., Grasby, S. E., Gröcke, D. R., et al. (2019). Terrestrial Sources as the Primary Delivery Mechanism of Mercury to the Oceans across the Toarcian Oceanic Anoxic Event (Early Jurassic). Earth Planet. Sci. Lett. 507, 62–72. doi:10.1016/j.epsl.2018.11.029
Thibodeau, A. M., Ritterbush, K., Yager, J. A., West, A. J., Ibarra, Y., Bottjer, D. J., et al. (2016). Mercury Anomalies and the Timing of Biotic Recovery Following the End-Triassic Mass Extinction. Nat. Commun. 7, 11147–11148. doi:10.1038/ncomms11147
Thibodeau, A. M., and Bergquist, B. A. (2017). Do mercury Isotopes Record the Signature of Massive Volcanism in marine Sedimentary Records? Geology 45, 95–96. doi:10.1130/focus012017.1
Towe, K. M. (1991). Aerobic Carbon Cycling and Cerium Oxidation: Significance for Archean Oxygen Levels and Banded Iron-Formation Deposition. Palaeogeogr. Palaeoclimatol. Palaeoecol. 97, 113–123. doi:10.1016/0031-0182(91)90187-v
Tribovillard, N., Algeo, T. J., Baudin, F., and Riboulleau, A. (2012). Analysis of marine Environmental Conditions Based Onmolybdenum-Uranium Covariation-Applications to Mesozoic Paleoceanography. Chem. Geology. 324-325, 46–58. doi:10.1016/j.chemgeo.2011.09.009
Tribovillard, N., Algeo, T. J., Lyons, T., and Riboulleau, A. (2006). Trace Metals as Paleoredox and Paleoproductivity Proxies: an Update. Chem. Geology. 232, 12–32. doi:10.1016/j.chemgeo.2006.02.012
Wang, X., Cawood, P. A., Zhao, H., Zhao, L., Grasby, S. E., Chen, Z.-Q., et al. (2018). Mercury Anomalies across the End Permian Mass Extinction in South China from Shallow and Deep Water Depositional Environments. Earth Planet. Sci. Lett. 496, 159–167. doi:10.1016/j.epsl.2018.05.044
Wang, Y., Sadler, P. M., Shen, S.-z., Erwin, D. H., Zhang, Y.-c., Wang, X.-d., et al. (2014). Quantifying the Process and Abruptness of the End-Permian Mass Extinction. Paleobiology 40, 113–129. doi:10.1666/13022
Wei, H., Zhang, X., and Qiu, Z. (2020). Millenial-scale Ocean Redox and δ13C Changes across the Permian–Triassic Transition at Meishan and Implications for the Biocrisis. Int. J. Earth Sci. 109, 1753–1766.
Wignall, P. B., and Hallam, A. (1992). Anoxia as a Cause of the Permian/Triassic Mass Extinction: Facies Evidence from Northern Italy and the Western United States. Palaeogeogr. Palaeoclimatol. Palaeoecol. 93, 21–46. doi:10.1016/0031-0182(92)90182-5
Wignall, P. B., Kozur, H., and Hallam, A. (1996). On the Timing of Palaeoenvironmental Changes at the Permo‐Triassic (P/TR) Boundary Using Conodont Biostratigraphy. Hist. Biol. 12, 39–62. doi:10.1080/08912969609386553
Wignall, P. B. (2001). Large Igneous Provinces and Mass Extinctions. Earth-Science Rev. 53, 1–33. doi:10.1016/s0012-8252(00)00037-4
Wignall, P. B., Newton, R., and Brookfield, M. E. (2005). Pyrite Framboid Evidence for Oxygen-Poor Deposition during the Permian-Triassic Crisis in Kashmir. Palaeogeogr. Palaeoclimatol. Palaeoecol. 216, 183–188. doi:10.1016/j.palaeo.2004.10.009
Wignall, P. B., and Newton, R. (2003). Contrasting Deep-Water Records from the Upper Permian and Lower Triassic of South Tibet and British Columbia: Evidence for a Diachronous Mass Extinction. Palaios 18, 153–167. doi:10.1669/0883-1351(2003)18<153:cdrftu>2.0.co;2
Wignall, P. B., and Twitchett, R. J. (2002). “Extent, Duration, and Nature of the Permian-Triassic Superanoxic Event,” in Catastrophic Events and Mass Extinctions: Impacts and beyond. Editors C. Koebel, and K. G. MacLeod (Boulder, Colorado: Geological Society of America Special Paper), 356, 395–413. doi:10.1130/0-8137-2356-6.395:
Wignall, P. B., and Twitchett, R. J. (1996). Oceanic Anoxia and the End Permian Mass Extinction. Science 272, 1155–1158. doi:10.1126/science.272.5265.1155
Wright, J., Schrader, H., and Holser, W. T. (1987). Paleoredox Variations in Ancient Oceans Recorded by Rare Earth Elements in Fossil Apatite. Geochim. Cosmochim. Acta 51, 631–644. doi:10.1016/0016-7037(87)90075-5
Wu, S. B., Wei, M., and Zhang, K. X. (1983). Facies Changes and Controlling Factors of the Late Permian Changxing Limestone in the Changxing Area. Geol. Rev. 32, 419–425.
Wu, Y-S., Yuan, X-H., Jiang, H-X., and Liu1, L-J. (2014). Coevality of the Sea-Level Fall and Main Mass Extinction in the Permian–Triassic Transition in Xiushui, Jiangxi Province, Southern China. J. Palaeogeogr. 3 (3), 309–322. doi:10.3724/SP.J.1261.2014.00058
Xie, S., Pancost, R. D., Yin, H., Wang, H., and Evershed, R. P. (2005). Two Episodes of Microbial Change Coupled with Permo/Triassic Faunal Mass Extinction. Nature 434, 494–497. doi:10.1038/nature03396
Xu, D. Y., and Zheng, Y. (1993). Carbon Isotope and Iridium Event Markers Near the Permian/Triassic Boundary in the Meishan Section. Palaeogeogr. Palaeoclimatol. Palaeoecol. 104, 171–176.
Yin, H., Feng, Q., Lai, X., Baud, A., and Tong, J. (2007). The Protracted Permo-Triassic Crisis and Multi-Episode Extinction Around the Permian-Triassic Boundary. Glob. Planet. Change 55, 1–20. doi:10.1016/j.gloplacha.2006.06.005
Yin, H., Huang, S., Zhang, K., Hansen, H. J., Yang, F., Ding, M., et al. (1992). “The Effects of Volcanism on the Permo-Triassic Mass Extinction in South China,” in Permo-Triassic Events in the Eastern Tethys, Stratigraphy, Classification, and Relations with the Western Tethys. Editors W. C. Sweet, Z. Yang, J. M. Dickins, and H. Yin (Cambridge: Cambridge University Press), 146–157.
Yin, H., Zhang, K., Tong, J., Yang, Z., and Wu, S. (2001). The Global Stratotype Section and point (GSSP) of the Permian–Triassic Boundary. Episodes 24, 102–114. doi:10.18814/epiiugs/2001/v24i2/004
Yin, R., Feng, X., Hurley, J. P., Krabbenhoft, D. P., Lepak, R. F., Hu, R., et al. (2016). Mercury Isotopes as Proxies to Identify Sources and Environmental Impacts of Mercury in Sphalerites. Sci. Rep. 6, 18686. doi:10.1038/srep18686
Zhang, L., Algeo, T. J., Cao, L., Zhao, L., Chen, Z.-Q., and Li, Z. (2016). Diagenetic Uptake of Rare Earth Elements by Conodont Apatite. Palaeogeogr. Palaeoclimatol. Palaeoecol. 458, 176–197. doi:10.1016/j.palaeo.2015.10.049
Zhang, Y., Chen, J., Zheng, W., Sun, R., Yuan, S., Cai, H., et al. (2020). Mercury Isotope Compositions in Large Anthropogenically Impacted Pearl River, South China. Ecotoxicol. Environ. Saf. 191, 110229. doi:10.1016/j.ecoenv.2020.110229
Zheng, Q., Cao, C., and Zhang, M. (2013). Sedimentary Features of the Permian-Triassic Boundary Sequence of the Meishan Section in Changxing County, Zhejiang Province. Sci. China Earth Sci. 56, 956–969. doi:10.1007/s11430-013-4602-9
Zhou, L., Wignall, P. B., Su, J., Feng, Q., Xie, S., Zhao, L., et al. (2012). U/Mo Ratios and δ98/95Mo as Local and Global Redox Proxies during Mass Extinction Events. Chem. Geol. 324-325, 99–107. doi:10.1016/j.chemgeo.2012.03.020
Zuchuat, V., Sleveland, A. R. N., Twitchett, R. J., Svensen, H. H., Turner, H., Augland, L. E., et al. (2020). A New High-Resolution Stratigraphic and Palaeoenvironmental Record Spanning the End-Permian Mass Extinction and its Aftermath in central Spitsbergen, Svalbard. Palaeogeogr. Palaeoclimatol. Palaeoecol. 554, 109732. doi:10.1016/j.palaeo.2020.109732
Keywords: permian, triassic boundary, meishan GSSP, Hg isotopes, chemostratigraphy, mass extinction
Citation: Sial AN, Chen J, Korte C, Pandit MK, Spangenberg JE, Silva-Tamayo JC, Lacerda LDd, Ferreira VP, Barbosa JA, Gaucher C, Pereira NS and Riedel PR (2021) Hg Isotopes and Enhanced Hg Concentration in the Meishan and Guryul Ravine Successions: Proxies for Volcanism Across the Permian-Triassic Boundary. Front. Earth Sci. 9:651224. doi: 10.3389/feart.2021.651224
Received: 08 January 2021; Accepted: 31 May 2021;
Published: 24 June 2021.
Edited by:
Jun Shen, China University of Geosciences Wuhan, ChinaReviewed by:
Hengye Wei, Southwest Petroleum University, ChinaShane Schoepfer, Western Carolina University, United States
Runsheng Yin, Institute of Geochemistry, Chinese Academy of Sciences (CAS), China
Copyright © 2021 Sial, Chen, Korte, Pandit, Spangenberg, Silva-Tamayo, Lacerda, Ferreira, Barbosa, Gaucher, Pereira and Riedel. This is an open-access article distributed under the terms of the Creative Commons Attribution License (CC BY). The use, distribution or reproduction in other forums is permitted, provided the original author(s) and the copyright owner(s) are credited and that the original publication in this journal is cited, in accordance with accepted academic practice. No use, distribution or reproduction is permitted which does not comply with these terms.
*Correspondence: Alcides Nóbrega Sial, YWxjaWRlcy5zaWFsQHVmcGUuYnI=; Jiubin Chen, Y2hlbmppdWJAaG90bWFpbC5jb20=;