 T. A. J. G. Sirisena
 Shreedhar Maskey
 Janaka Bamunawala
 Roshanka Ranasinghe1,2,3
- 1IHE Delft Institute for Water Education, Delft, Netherlands
- 2University of Twente, Enschede, Netherlands
- 3Harbour, Coastal and Offshore Engineering, Deltares, Delft, Netherlands
Reservoirs play a vital role in water resource management, while also contributing to alterations in downstream flow regimes and sediment load in the river. On the other hand, variations on streamflow and fluvial sediment loads can also result from climate change effects. Here, we assess future changes in streamflow and sediment load due to climate change and planned reservoirs in the Irrawaddy River Basin, Myanmar. The Soil Water Assessment Tool is used to project streamflow and sediment loads during 2046–2065 (mid-century), and 2081–2100 (end-century) periods under the two end-member Representative Concentration Pathways (i.e., RCP 2.6 and RCP 8.5) with and without planned reservoirs. Results show that compared to the baseline period (1991–2005), streamflow and sediment loads are projected to substantially increase during mid- and end-century periods when planned reservoirs are not considered (i.e., with climate change forcing only). Under RCP 2.6 and RCP 8.5, streamflow at the basin outlet is projected to increase by 8–17% and 9–45%, while sediment loads are projected to increase by 13–26% and 18–75%, respectively by the end-century period. When reservoirs are included, while annual streamflow at the basin outlet does not show a significant difference compared to the climate change only case (for any RCP and for both future time periods considered), annual sediment loads at the basin outlet are projected to slightly decrease (compared to the climate change only case) by 4–6% under RCP 8.5 during the end-century period. However, at seasonal time scales, streamflow and sediment loads at the basin outlet are significantly affected by upstream reservoirs. During the monsoon periods, the presence of planned reservoirs is projected to decrease streamflow at the basin outlet by 6–7%, while during non-monsoon periods, the reservoirs result in an increase of 32–38% in the streamflow at the outlet under RCP 8.5 during the end-century period. Similarly, for the same period and RCP 8.5, due to the planned reservoirs, sediment load is projected to decrease by 9–11% and increase by 32–44% in monsoonal and non-monsoonal periods, respectively.
Introduction
Rivers are crucial contributors to the dynamic interaction between catchments and coasts by transferring water and sediment from land to the oceans. During the past few decades, global river systems have undergone significant changes, particularly concerning their streamflow and fluvial sediment loads. These changes are mainly driven by changing climate (i.e., increase/decrease in rainfall intensity and volume, and increase in temperature) and a wide range of human activities, which include land-use change, deforestation, damming of rivers, water diversion and abstraction, and sand-mining from river beds and banks (Syvitski et al., 2005; Walling, 2006, 2009; Syvitski and Saito, 2007; Dunn et al., 2019; Ranasinghe et al., 2019).
Climate change is now an unequivocally accepted phenomenon (IPCC, 2014) and the future climate is uncertain. Relative to the 1986–2005 period, the global mean surface temperature is projected to increase by 0.3°C–0.7°C (medium confidence) during the 2016–2035 period, whereas extreme precipitation and heatwaves over the tropical and mid-latitudes are projected to be more severe and frequent (IPCC, 2014). Impacts of climate change (CC) are not spatially uniform, and hence the hydrological cycle at basin scale will vary not only from basin to basin but also within large river basins. Such variations can result in significant alteration of the hydrological regime of a river basin.
On the other hand, during the past decades, intensive human activities such as land clearance for agriculture, dwelling, and urbanization, different land-use practices, water diversions and abstractions, reservoirs/dams constructions, river sand-mining have intensified in many river basins (Vörösmarty and Sahagian, 2000; Saito et al., 2007; Zhao et al., 2014; Wu et al., 2017; Dunn et al., 2019). Many countries in the south and central Asian regions, Latin American countries, Canada, Turkey and Russia are increasingly investing in harnessing the unexploited hydropower potential (Akpınara et al., 2011) as it is an attractive source of renewable energy. As a result, even though, there was a relative decrease in hydropower dam construction during 1990–2010, it has increased remarkably over the last decade (Zarfl et al., 2014). Zarfl et al. (2014) reported that as of March 2014, there were 3,700 hydropower dams either planned or under construction with more than 1 MW capacity around the world.
Many studies have predicted a wide range of climate change-driven impacts on streamflow (Thompson et al., 2013; Wang et al., 2015; Shrestha and Lohpaisankrit, 2017; Ghimire et al., 2019; Xu et al., 2019), and sediment erosion and load (Maharjan et al., 2014; Azim et al., 2016; Kim et al., 2017; Zhou et al., 2017; Nilawar and Waikar, 2019). Furthermore, recent studies have reported that many large rivers (viz., Yellow River, Yangtze River, Chao Phraya River, Pearl River, and Nile River) show a considerable reduction of sediment supply to the coast due to reservoirs and land-use change (Walling, 2009; Miao et al., 2011; Yang et al., 2015; Besset et al., 2019; Ranasinghe et al., 2019). Previous studies have also investigated the combined (or relative) effects of climate change and human activities on streamflow and fluvial sediment loads of river basins. Human activities considered in many of those studies include land-use change/urbanization (Pervez and Henebry, 2015; Sayasane et al., 2016; Zuo et al., 2016; Vaighan et al., 2017; Marhaento et al., 2018), and existing (or planned) reservoirs (Piman et al., 2015; Mittal et al., 2016; Shrestha et al., 2016; Ngo et al., 2018). Notably, as a result of reservoirs, sediment volumes received by many of the world’s coasts and their delta systems have decreased substantially over the last few decades (Saito et al., 2007; Syvitski and Saito, 2007; Syvitski et al., 2009; Besset et al., 2019; Dunn et al., 2019).
Myanmar’s climate is changing (GCCA, 2012; Shrestha and Htut, 2016). The country has experienced many natural hazards, such as frequent flooding, droughts, heatwaves, cyclones, and storms (GCCA, 2012) in the past three decades. In terms of extreme weather events occurring between 1995 and 2014, Myanmar is identified as the world’s second most affected country as per the Global Climate Risk Index (CRI) (Kreft et al., 2015). However, there is only a handful of climate change and human impact assessments focusing on Myanmar to date (Aung et al., 2016; Taft and Evers, 2016). Of particular relevance to the focus of this study, Myanmar has attracted numerous foreign hydropower investors, due to its undeveloped potential for large-scale hydropower generation, resulting in accelerated socio-economic growth over the last few decades (Kattelus et al., 2015). However, compared to the major rivers in Southeast Asia (e.g., Mekong, Yangtze, Yellow, Pearl, and Chao Phraya), the Irrawaddy River, the largest river in Myanmar, is mostly unregulated (Kattelus et al., 2015). Exploiting the abundant water resources in the Irrawaddy River Basin by constructing large capacity reservoirs and other related diverse developments have interrupted the river flow and continuous sediment supply to the Irrawaddy delta and its adjacent coastal region (Hedley et al., 2010). Besset et al. (2019) showed that, compared to pre-1970s, there is approximately a 30% reduction in the sediment supplied to the Irrawaddy Delta during 1974–2014. To provide a scientific basis for river basin management and planning activities, including flood/drought mitigation and adaptation measures, design of river structures, river channel training and maintenance of inland water bodies (Zhao et al., 2014), in this nationally important waterway, it is therefore necessary to understand and evaluate the variability of streamflow and sediment load under different influencing factors (i.e., climate change and human activities).
Here, we present an assessment of the Irrawaddy River Basin’s hydrological responses (i.e., streamflow regimes and fluvial sediment supply) to climate change (RCP 2.6 and RCP 8.5) and planned reservoirs. Plausible changes in future climate (i.e., precipitation and temperature) are also discussed under climate change scenarios. Projected changes in streamflow and sediment loads at the basin outlet due to 1) climate change only, and 2) climate change and planned reservoirs in the basin are presented providing insights into the relative contributions of these two key drivers to future streamflow and sediment loads at the basin outlet.
Materials and Methods
Study Area
The Irrawaddy (Ayeyarwady) River Basin (IRB) is largely situated in Myanmar, with small parts located in Chinese (5%) and Indian (4%) territories, covering a total drainage area of about 410,000 km2 (Figure 1A). The main tributaries of the basin are Chindwin and Irrawaddy rivers. The Irrawaddy River, which is approximately 2,100 km long, originates at the confluence of the Mali and N’Mai rivers and is augmented by the Chindwin at Pakokku. The Irrawaddy River, the most important commercial waterway in Myanmar discharges into the Andaman Sea, forming one of the two largest delta systems in Southeast Asia. The delta of the river originates about 120 km south of Pyay (Figure 1A). The deltaic coastal zone is classified as a mud-silt tidal dominated system (Furuichi et al., 2009).
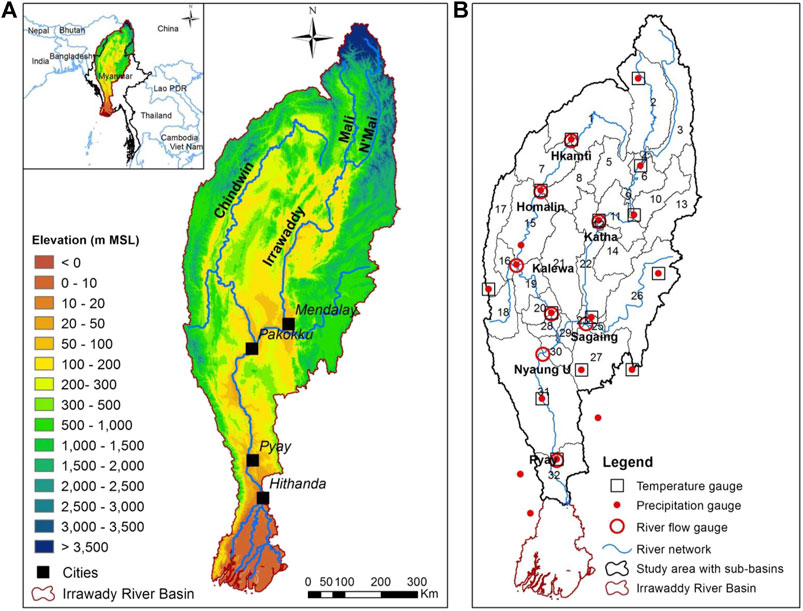
FIGURE 1. Irrawaddy River Basin in Myanmar (A), and sub-basin and hydro-meteorological station distribution within the study area (B).
The basin has diverse topographic features, ranging from high mountainous terrain in its northern part to low-lying delta systems in the south. In the middle, there are plateaus (∼500 m above mean sea level (MSL)) and floodplains (Figure 1A). Green forests and rain-fed crop cultivation comprise more than 65% of the basin area. Most of the croplands are located in the central valley and low-lying river flood plains, while dense forests are present in the northern hilly mountainous region. Acrisols, Cambisols and Gleysols are the dominant soil types in the study basin.
Myanmar has a tropical savanna climate. The basin experiences heavy rainfall from May to October and the dry season prevails from November to april. However, its mean annual rainfall is highly spatially variable, from about 500 mm in the central parts of the basin to 4,000 mm in the northern mountainous regions. The average daily temperature varies from 21–34°C in the summer and from 11–23°C in the cold season. The annual average discharge is about 12,000 m3/s at the Pyay station (Figure 1).
Data
The hydrological model (SWAT (Arnold et al., 1998; Arnold et al., 2012; Neitsch et al., 2011)), dividing the study area into 32 sub-basins (Figure 1B), that was set-up, calibrated and validated for streamflow for 1991–2010 by Sirisena et al. (2018) is exclusively used herein. Sirisena et al. (2018) also present the data used in the initial model setup, which includes: 1) geo-spatial data (DEM, land-use, soil), 2) meteorological data (precipitation, maximum and minimum temperature, relative humidity, solar radiation, and wind speed), and 3) hydrological data (streamflow). Details of these data can be found in Sirisena et al. (2018), Figure 1B and Table 1. Monthly sediment data (1991–2010) from three stations (Kalewa, Sagaing, and Pyay, Figure 1B) were obtained from previous studies (Furuichi et al., 2009; IFC, 2017; Imbulana, 2018) and used for model calibration and validation. Based on the data used in this study (Table 1), basin average annual precipitation is 2050 mm (based on interpolated data from 19 gauges), and daily maximum and minimum temperatures are 30°C and 19°C (arithmetic means of 14 gauges), respectively. Similarly, average annual streamflow and sediment load at Pyay station are 12,000 m3/s, and 325 × 106 tons/yr, respectively. Future climate projections (precipitation, minimum and maximum temperatures) were obtained from ten General Circulation Models (GCMs) via http://pcmdi9.llnl.gov/ (Table 1 and Supplementary Table S1).
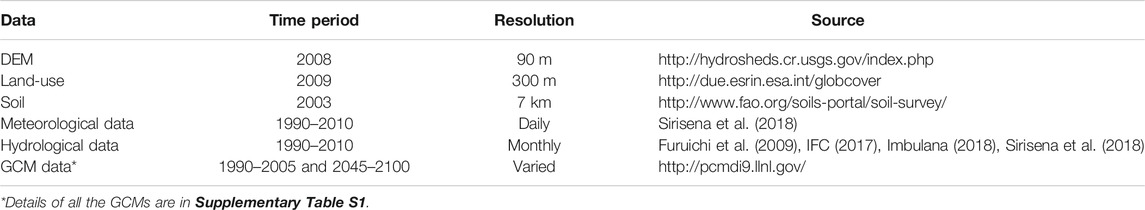
TABLE 1. Data used in this study.
Model Setup
Suspended Sediment Modeling and Model Examination
The SWAT model setup developed and calibrated for streamflow by Sirisena et al. (2018) and forced with interpolated gauge precipitation (IGP) was used to compute the sediment load at different locations in the basin with re-calibration for sediment processes (i.e., erosion and transport). Erosion and sediment transportation in river basins are mainly governed by temperature, precipitation, wind, topography, land-use, land management practices, drainage networks and streamflow (Morgan, 2005). SWAT estimates the soil erosion, caused by rainfall and runoff within each basic computational unit (called Hydrological Response Units; HRUs), using the Modified Universal Soil Loss Equation (MUSLE) (Neitsch et al., 2011). This erosion model includes parameters related to soil, land-use and management, and topography. The sediment transport model used in SWAT consists of two processes (deposition and degradation) that determine the magnitude of sediment generated within a river reach. In SWAT, some calibration parameters directly affect both streamflow and sediment processes. Hence, only the sediment related parameters were selected (Table 2) to calibrate the sediment load generated from the basin. The model parameters for monthly sediment loads were calibrated manually for the 1991–2000 period. The calibrated model was then validated for the 2001–2010 period, noting, however, the lack of continuous datasets for the 1991–2010 period for all three stations.
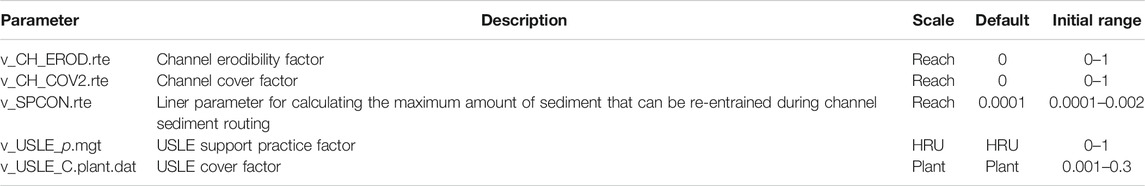
TABLE 2. Parameters used for sediment load calibration.
Model performances during calibration and validation periods were assessed by comparing observed and simulated monthly sediment loads for 1991–2010. Figure 2 shows that the model underestimates the sediment load during the high flow period (July–October) at all stations, while it overestimates the sediment load during the low flow period (December–April) at Sagaing station. These mismatches can be attributed to the uncertainties in precipitation data, streamflow simulation, parameterization, and also the observed data used in calibration. In general, simulated results at three stations preserve the temporal variability of observed data with R2 > 0.70. According to model evaluation criteria (NSE, PBIAS and R2), the model results at the three stations are sufficiently adequate for the calibration and validation periods.
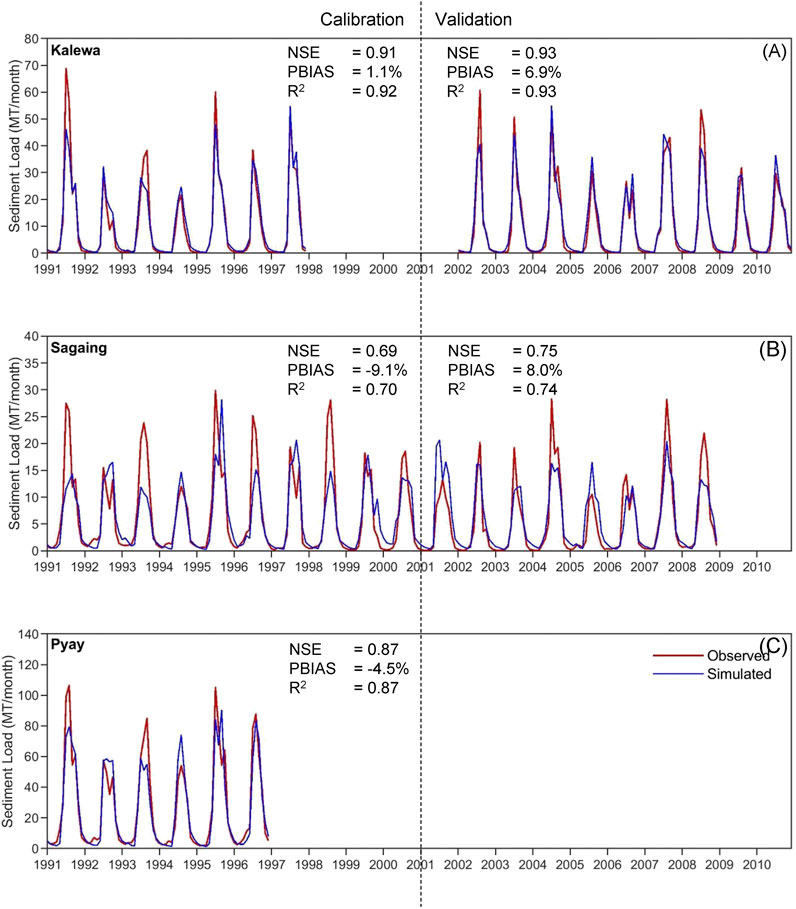
FIGURE 2. Observed and simulated monthly sediment load at the three gauging stations: Kalewa (A), Sagaing (B), and Pyay (C) for the calibration-validation period (1991–2010).
The SWAT simulation for the 1991–2010 period shows a sediment load of 269 ± 49 × 106 t/yr at the Pyay station (i.e., basin outlet, Figure 1), with an average of 265 ± 41 × 106 t/yr from 1991 to 1996. In previous studies focusing on the sediment load in this basin, Robinson et al. (2007) calculated a sediment load of 364 ± 60 × 106 t/yr at Pyay by revisiting the 19th-century sediment load estimation (261 × 106 t/yr) presented by Gordon (1885). Furuichi et al. (2009) computed a mean annual sediment load of 325 ± 57 × 106 t/yr at Pyay over the 1966–1996 period by considering 31 years of streamflow measurements and a streamflow-sediment rating curve derived from suspended sediment concentrations at Pyay. At the Magway station, located 168 km upstream of Pyay, the average sediment load determined by the Directorate of Water Resources and Improvement of River Systems (DWIR), Myanmar is 125 × 106 t/yr for the period of 1990–2010 (IFC, 2017). For the same period, sediment load at Chauk, located further 93 km upstream of Magway is 154 × 106 t/yr (IFC, 2017). Syvitski and Milliman (2007) calculated average suspended sediment load in the Irrawaddy River Basin (IRB) as 258.6 × 10⁶ t/yr (based on previous studies by Milliman and Meade (1983), Milliman and Syvitski (1992), and Syvitski (2003)). Thus, the sediment loads at Pyay simulated in this study are different from the results presented in the above-mentioned studies, although there is significant variability among the previous study results as well. This discrepancy could be due to many reasons, including different measurement locations, the variability of sediment transport in the river, seasonality effects on measurements (wet or dry seasons), cross-sectional variations (which leads to changes in water level-streamflow relationship), and differences in sampling methods (IFC, 2017).
Streamflow and sediment erosion are highly dependent on the land-use pattern within the basin. Here we assume land-use to be invariant over the study period (present and future). However, the land-use can change in the future mainly due to increase of population and development activities. The projection of future land-use is beyond the scope of our study, hence we only focused on the impacts of reservoirs on streamflow and sediment load projections.
Model Setup With Reservoirs
By 2010, there were 20 reservoirs planned to be constructed in the Irrawaddy Basin mainly for hydropower generation (Figure 3 in Kattelus et al. (2015)). The estimated power production of these planned reservoirs varies between 24 MW and 4,100 MW. For this study, six of the planned reservoirs (capacity >500 MW) were incorporated into the model to assess the future changes in streamflow and sediment loads due to reservoirs.
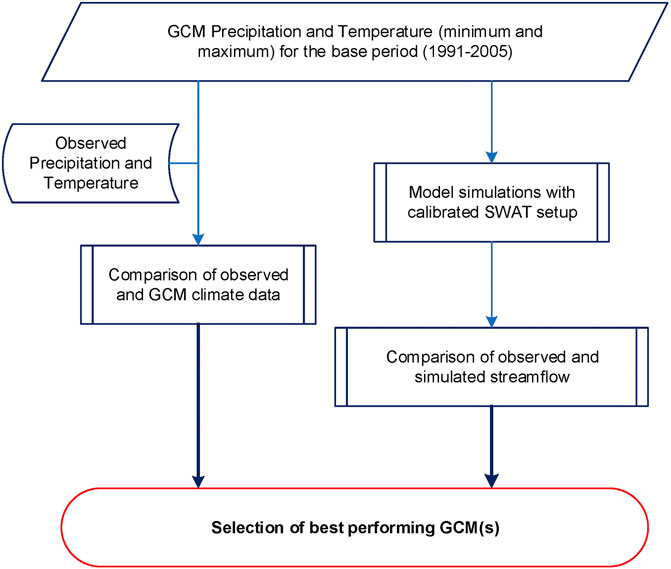
FIGURE 3. The workflow adopted in this study for GCM selection for streamflow simulation in the Irrawaddy River Basin.
The SWAT model includes a reservoir module to assess the effects of reservoir operation on streamflow and sediment load. Detailed information regarding the planned reservoirs (e.g., storage capacity, volume and surface area related to the spillway) is unknown or not available for this study. There are four main physical parameters required by SWAT to simulate reservoir operations: 1) RES_ESA (reservoir surface area when the reservoir is filled to the emergency spillway), 2) RES_EVOL (volume of water needed to fill the reservoir to the emergency spillway), 3) RES_PSA (reservoir surface area when the reservoir is filled to the principal spillway), and 4) RES_PVOL (volume of water needed to fill the reservoir to the principal spillway). The storage capacity of the reservoir was determined using monthly streamflow data of 20 years (1991–2010), assuming that over the long-term total inflow to the reservoir minus losses equals total outflow. The Sequent Peak Algorithm (SPA, Thomas and Fiering, 1963 cited in Lele, 1987) was used to determine the required reservoir capacities. The cumulative sum of the difference between inflow and water demand (withdrawals) is calculated to develop the mass curve of this net outflow (i.e., inflow–withdrawals), where withdrawal is taken as 80% of average inflow in each month. The mass curve comprises peaks (local maxima) and troughs (local minima). For a given peak (Pi), the next peak that is higher than (Pi) is identified as the sequent peak. The required reservoir capacity is then obtained by taking the maximum of the difference between the sequent peak and the lowest trough during the entire analysis period.
It was assumed that 80% of the long-term average streamflow (1991–2010) is withdrawn from the reservoir in each month, meaning that 80% of water to be used from storage requirement. If it is assumed 100% of average flow as withdrawal, the storage capacity may be unnecessarily larger. The required maximum storage capacities were derived from the model as described above and the corresponding surface areas were calculated based on Storage volume-Area-Elevation curve developed (Supplementary Figure S1) from the SRTM DEM having 90 m × 90 m spatial resolution (Figure 1A). It was assumed that RES_PVOL is 90% of RES_EVOL, and corresponding RES_PSA was calculated from the area-capacity curves. The reservoir details, thus, derived are summarized in Table 3. Here, spillway’s outflow was estimated by the ‘average annual release rate for uncontrolled reservoirs’ as this method only requires a daily maximum spillway release rate when the water volume is between emergency and maximum spill volume. In reservoir operation, reservoir release can be given as the minimum or maximum or both minimum and maximum release on a monthly basis (Neitsch et al., 2011). Here, we considered only the minimum water release by assigning a constant value for the 12 months in a year. The average annual release rate and minimum release were estimated by assuming a 10% failure of outflow from the reservoir (outflow over spillway < specified minimum release) for the entire future simulation period (2046–2100). This method of reservoir outflow estimation (average annual release rate for uncontrolled reservoirs) has been successfully applied by Vigiak et al. (2015) for streamflow and sediment simulation in the Danube River Basin. Furthermore, Brauer et al. (2015) also used this method to simulate the streamflow in the Canadian Basin, United States. However, Jalowska and Yuan (2018) recommended this method to use for sediment modeling, only if data is not available for controlled outflow with target release method.
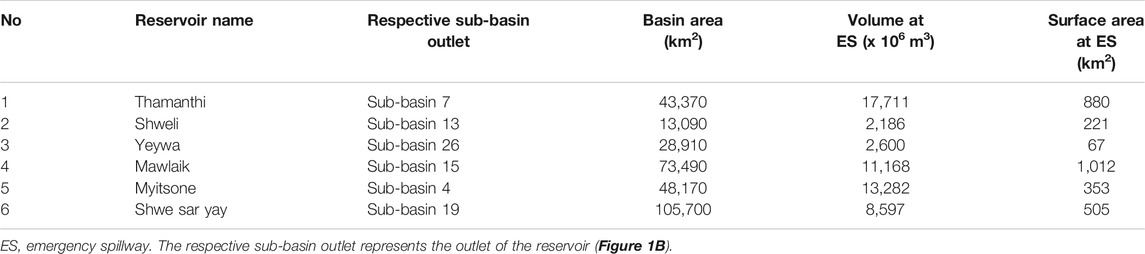
TABLE 3. Basic characteristics of the planned reservoirs considered in this study.
The median diameter of particle size (RES_D50) was set as 10.5 µm (i.e., medium size silt), which is the average suspended particle size found by Robinson et al. (2007) for the IRB. Initial and equilibrium sediment concentrations (RES_SED and RES_NSED, respectively) of the reservoir play a vital role in sedimentation as particle settling is a function of the concentration and time. Therefore, different trapping efficiencies of a reservoir were assumed to define these values (here, RES_SED and RES_NSED are equal). Trapping efficiency (TE) is the percentage of incoming sediment, which remains in the reservoir per year. Based on previous studies (Maneux et al., 2001; Kummu and Varis, 2007; Eizel-Din et al., 2010; Lewis et al., 2013; Yang et al., 2014; Shrestha et al., 2016), two TE scenarios (50%, and 95%) were assumed here to derive the equilibrium sediment concentration. In both cases, the same TE was initially assumed for all six reservoirs. Then, TE values were calculated for every year from the simulated sediment inflow and outflow from the reservoir, and subsequently, an average annual TE value was calculated for the simulation period (2046–2100). When this average annual TE of each reservoir is equal to the assumed TE (50% or 95%), simulation results were analyzed to investigate the effects of reservoir construction on sediment load and streamflow.
Selection of Suitable General Circulation Models
The climatic data obtained via different GCMs are likely to vary among models for the baseline period (1991–2005). These variabilities are mainly driven by the differences in inputs, model structure, boundary conditions, and initial conditions associated with the respective climate models (Jalota et al., 2018). The average annual precipitation over the Irrawaddy RB during the baseline period (1991–2005) varies significantly among the GCMs considered (Supplementary Figure S2). Particularly, CCSM4, GFDL-CM3, IPSL-CM5A-MR, MRI-CGCM3, and Nor-ESM1-M show less than 1,500 mm of annual precipitation over the basin for this period. Furthermore, observations from rainfall stations show that the most northern and middle parts of the basin receive more than 3,500 mm and less than 1,500 mm annual precipitation, respectively (details in Sirisena et al. (2018)). Therefore, these GCMs underestimate the precipitation in the northern parts of the IRB. Average annual maximum and minimum temperatures do not show significant difference among GCMs during the baseline period (Supplementary Figures S3, S4). All GCMs underestimate the minimum and maximum daily temperature in the entire basin. For example, in the northern parts of the basin, the observed maximum and minimum daily temperature ranges are 26–30°C and 15–19°C, respectively. However, the same temperature values obtained from the selected GCMs vary between 15–24°C and 5–13°C, respectively.
The most representative climate models were selected by following the approach shown in Figure 3, which uses GCM outputs and observations for the baseline period (1991–2005). First, the monthly and annual statistics of climate variables for each model were compared with observed data. Here, spatially interpolated gauge precipitation (IGP) (Sirisena et al., 2018) data were used as the observed data. Secondly, data from the selected ten GCMs (i.e., precipitation and temperature) were used to force the previously calibrated SWAT setup (refer to Sirisena et al. (2018)), and the model performance in terms of simulating streamflow was evaluated at eight gauging stations (Figure 1B).
Following careful statistical comparisons of climate variables (i.e., precipitation and maximum and minimum temperatures), and GCM data-driven streamflow estimations over 1991–2005, three GCMs (viz. CSIRO-Mk3.6, HadGEM2-AO, and HadGEM2-ES, details in Supplementary Table S1) were selected for further model applications (i.e., for simulating future streamflow and sediment loads) in the IRB.
Bias Correction of Climate Data and Climate Change Scenarios.
The selected GCM data (precipitation and temperature) were bias-corrected using the mean-based method (Schmidli et al., 2006; Lenderink et al., 2007; Wang et al., 2016) applied on a monthly basis. The methods adopted for precipitation and temperature are shown in Eqs. 1,2, respectively.
where,
This study investigates the impacts of both low and high radiative forcing scenarios: RCP 2.6 and RCP 8.5, respectively on the hydrological response at the basin scale. RCP 2.6 represents a GHG (Green House Gas) mitigation scenario targeting a low radiative forcing level (∼3 W/m2) peak by 2020, and start declining. RCP 8.5 represents the pathway with the highest radiative forcing (>8.5 W/m2) by 2100 and keeps increasing thereafter (IPCC, 2014). Thus, this study investigates the impacts of more optimistic and pessimistic scenarios with respect to GHG emission scenarios on the hydrological response at the basin scale. The analysis was carried out for two future periods: mid-century (2046–2065) and end-century (2081–2100). For both future periods, monthly values of
Future streamflow and sediment load projections for 2046–2065 (mid-century) and 2081–2100 (end-century) were computed under two scenarios: 1) climate change (CC) only, and 2) climate change and planned reservoirs (CC + Reservoirs). The bias-corrected climatic data and the selected planned reservoirs were used with the calibrated SWAT model setup over the full period 2045–2100.
Results and Discussion
Projected Changes in Climatic Drivers (2045–2065 and 2081–2100)
Precipitation
In general, the mean annual precipitation projections (bias-corrected) show variable changes across the IRB (Figure 4). The upper and lower parts of the basin are projected to experience more changes than the middle part (dry zone). The percentage changes of each GCM precipitation projection were calculated relative to the baseline period (1991–2005). The North-eastern part of the basin is projected to experience the highest increment in precipitation (more than 10%) for both RCP 2.6 and RCP 8.5 with HadGEM2-AO and HadGEM2-ES over mid- and end-century periods. In contrast, the highest decrease in precipitation (19%) is projected to occur over the western parts of the basin for CSIRO Mk3.6 data, particularly during the mid-century period under RCP 2.6. During the end-century period, projected precipitation values from the selected three GCMs vary between 7% and 12% for RCP 2.6 and 8%–31% for RCP 8.5 (compared to the baseline period).
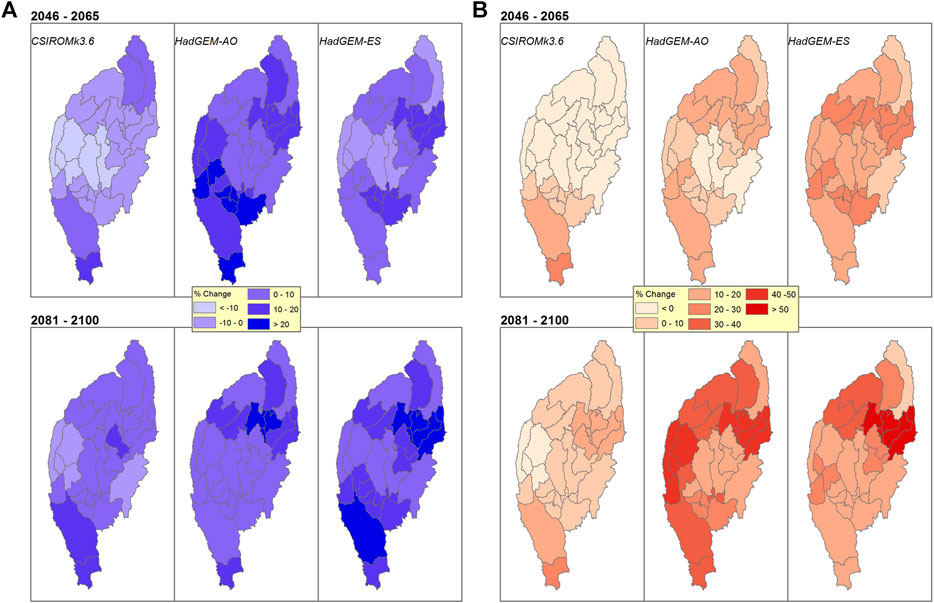
FIGURE 4. Percentage change of precipitation under two RCPs (RCP 2.6 (A) and RCP 8.5 (B)) of the three selected GCMs (from left to right CSIRO Mk3.6, HadGEM2-AO, and HadGEM2-ES), relative to the baseline period (1991 – 2005) over each sub-basin of the Irrawaddy River Basin. In each RCP plot, two future periods are presented: 2046-2065 (top) and 2081-2100 (bottom).
Similar to these findings, a recent study by Ghimire et al. (2019) also shows that north and north-eastern parts of the Irrawaddy Basin may experience 16–20% and 21–28% increments in precipitation during the 2040s and 2080s, respectively, under RCP 4.5 and RCP 8.5 (compared to their baseline period of 1975–2005). Over the Belu River Basin (a small basin adjacent to the eastern part of IRB), Myanmar, the average precipitation is projected to vary with no clear trends (−1.8–9.1%, range of values from four RCPs: RCP 2.6, 4.5, 6.0, and 8.5) (Aung et al., 2016). Considering the entirety of Myanmar, under RCP 4.5 and RCP 8.5, precipitation is projected to increase by 6–23% during the 2041–2070 period compared to a baseline period of 1980–2006 (Horton et al., 2017). IPCC AR5 projections indicate that average precipitation over Myanmar may increase by 0–10% under RCP 2.6 and 10–20% under RCP 8.5 during the end-century period (2081–2100) relative to the AR5 baseline period 1986–2005 (Figure SPM 7 in IPCC (2014)).
Temperature
In general, the selected GCMs show an increase in temperature over the basin for all RCPs. The spatial variation of the temperature increment is minimal. The bias-corrected GCM projections for RCP 2.6 show average maximum and minimum temperature increments of 0.9–2.2°C and 0.4–2.0°C, respectively (compared to the baseline period) during mid- and end-century periods. For RCP 8.5 during the same periods, both maximum and minimum temperature are projected to increase by 2.1–5.1°C and by 1.9–6.0°C, respectively. During the end-century period (2081–2100), the highest increments of maximum and minimum temperature are projected under RCP 8.5 with CSIRO Mk3.6 (an increase of 5.1°C) and HadGEM2-ES (an increase of 6.0°C) for RCP 8.5, respectively. For the same period and under RCP 8.5, the lowest increments of both temperatures are projected with HadGEM-AO (an increase of 4.2°C and 4.3°C, respectively). All increases mentioned above are relative to the baseline period of 1991–2005.
In Belu River Basin, Myanmar (an adjacent basin to the IRB from East), the minimum temperature changes are almost double compared to changes in maximum temperature (Aung et al., 2016). For example, in the 2080s, minimum (maximum) temperature increases by 5.3°C (2.82°C) for RCP 8.5 (compared to the baseline period 1976–2005). In Bago River Basin, Myanmar (an adjacent basin to the IRB from South-east), ensemble projections of six GCM models show an increase of average temperature by 1.5°C and 3°C for RCP 4.5 and RCP 8.5, respectively by 2070–2099 when compared to the baseline period (1975–2009) values (Shrestha and Htut, 2016). Similar temperature increases are projected for the entirety of Myanmar by 2041–2070, where the average annual temperature may increase by 1.3–2.7°C over Myanmar compared to the period of 1980–2006 (Horton et al., 2017). By the end of 21st century, the increase of average surface temperature in Myanmar is projected to be 1–1.5°C and 3–5°C for RCP 2.6 and RCP 8.5, respectively compared to 1986–2005 (Figure SPM 7 in IPCC (2014)).
Climate-Change Driven Variations in Future Streamflow and Sediment Loads.
All future changes in streamflow and sediment loads for the mid-century (2046–2065) and end-century (2081–2100) periods were computed relative to the baseline period (1991–2005). Here, the results are presented for the most downstream gauging point of the study area (i.e., Pyay, Basin outlet).
In general, similar to future variations in precipitation within the basin, streamflow at Pyay may also increase over 2046–2065 and 2081–2100. The mean annual precipitation and streamflow variations of IRB have a similar trend (Figure 5) over the same periods. However, the annual streamflow variation (in magnitude) is always higher than that of precipitation. During the end-century period, all simulations project annual streamflow increases of 8–17% and 9–45% for RCP 2.6 and RCP 8.5, respectively, relative to the baseline period (1991–2005). In contrast, for the mid-century period, simulations forced with CSIRO Mk3.6 project streamflow reductions of −6% and −3% (relative to 1991–2005) for RCP 2.6 and RCP 8.5, respectively, while, HadGEM2-AO and HadGEM2-ES forced simulations project increments of 6–20% (RCP 2.6) and 15–25% (RCP 8.5) for the same period. Projections reported in previous studies of the Irrawaddy RB show variations that are similar to those obtained in this study. For example, Ghimire et al. (2019)’s mean decadal streamflow projections for the Upper Irrawaddy basin indicate an increase of 21% (22.7%) during 2021–2030 and 33% (41.8%) during 2091–2100 compared to 1975–2014 under RCP 4.5 (RCP 8.5). In another study focusing on Bago River Basin in Myanmar, Shrestha and Htut (2016) projected that the annual streamflow may increase by 46.8% under RCP 8.5 during 2070–2099 compared to their baseline period (1990–2009).
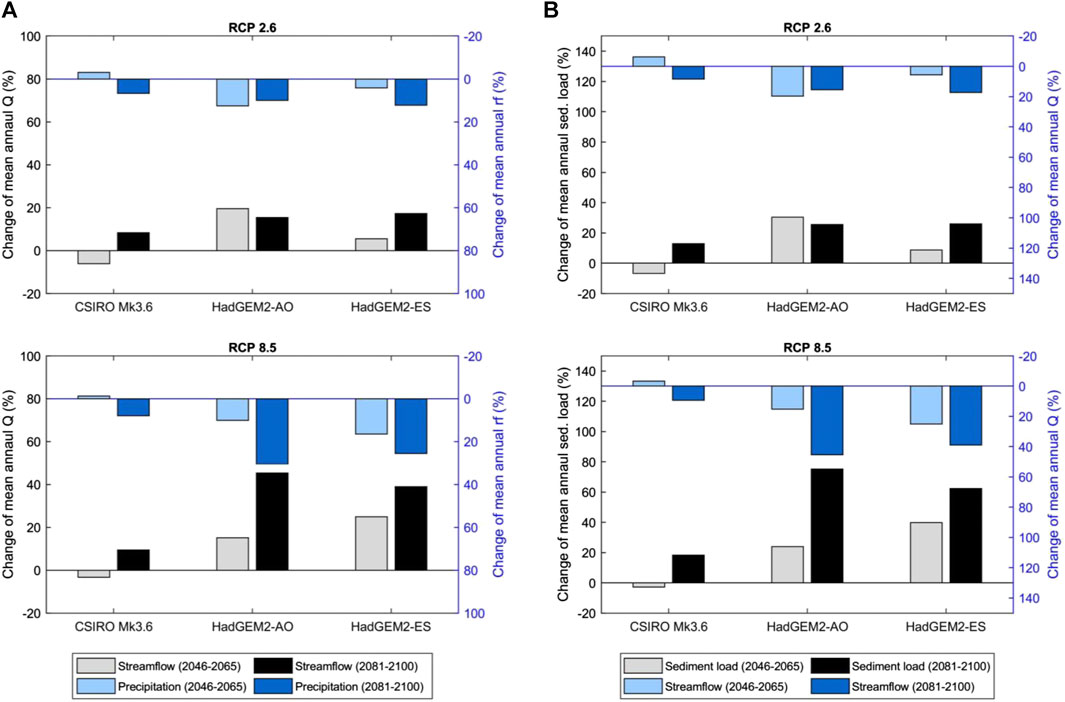
FIGURE 5. Percentage change of projected mean annual flow (A) and sediment load (B) at Pyay relative to the baseline period (1991-2005) under RCP 2.6 and RCP 8.5 computed using the three selected GCM data as forcing. Q is Streamflow and rf is precipitation. Each panel (A, B) show results for RCP 2.6 (top) and RCP 8.5 (bottom) and the three selected GCMs (CSIRO Mk3.6, HadGEM2-AO, and HadGEM2-ES). In each plot, light color bar shows results relevant to the mid-century period (2046-2065), whereas dark color bar shows results relevant to end-century (2081-2100). In the Panel (A), streamflow changes are in the primary axis (left Y-axis) and precipitation changes are in the inverse secondary axis (right Y-axis). Similarly, in the Panel (B), sediment load changes are in the primary axis and streamflow changes are in the inverse secondary axis.
The projected changes in annual sediment load at Pyay follow a similar trend to that of streamflow projections (Figure 5). The mean annual sediment load is projected to increase in all the RCPs and periods, except for the simulations forced with CSIRO Mk3.6 data during the mid-century (Figure 5). The projected changes are −7–30% (-3–40%) during the mid-century and 13–26% (18–75%) over the end-century period for RCP 2.6 (RCP 8.5).
The combined Effect of Climate Change and Reservoirs on Streamflow and Sediment Loads.
Reservoir Effect
For simulations with reservoirs, relative changes of streamflow and sediment loads were calculated for each climate scenario considered. Results show that changes in mean annual streamflow at the downstream of the reservoir is minimal (<1%, compared to the CC only case). However, changes in seasonal streamflow (mainly monsoonal and non-monsoonal flows) are considerably affected by reservoirs. For example, Table 4 shows the seasonal changes of streamflow under RCP 2.6 and RCP 8.5 from the model forced with CSIRO Mk3.6. All relative changes are computed based on the results of CC only (i.e., without reservoirs) simulations. Notably, high flow during the monsoon period (May to October considered here) has reduced and low flow during the rest of the period (November to April) has increased. These results suggest that reservoirs act as buffer storage during high flows, which in turn reduce peak flows. Furthermore, reservoirs release a minimum flow throughout the year, which results in an increase in river flow during the low flow period. These changes in streamflow are similar for both trapping efficiencies (i.e., 50% and 95%) because the streamflow computation does not depend on sediment retention/outflow.
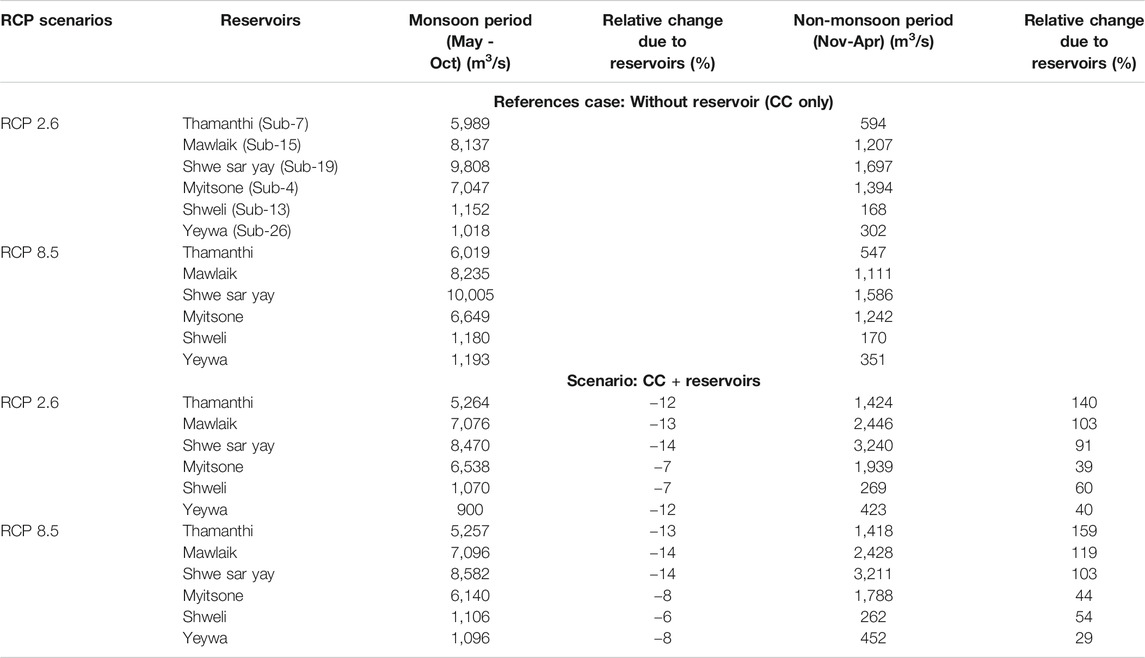
TABLE 4. Changes in projected seasonal streamflow just downstream of each reservoir during the end-century period (2081–2100) under RCP 2.6 and RCP 8.5 for the simulations forced with CSIRO Mk3.6, with and without reservoirs. The corresponding climate change forced simulation without reservoirs is considered as the reference case when computing relative changes of projections obtained with the inclusion of reservoirs. It was assumed that all the reservoirs are at their maximum water level at the beginning of all simulations.
The mean annual sediment load in the river reaches just downstream of the reservoirs was analyzed to scrutinize the individual contribution of reservoir trapping on projected sediment loads. For example, Figure 6 shows sediment load projections from simulations forced with CSIRO Mk3.6 under RCP 8.5 for 2081–2100. The percentage reduction of sediment outflow from a reservoir depends on the trapping efficiencies considered. Due to the high amount of sediment trapping within three reservoirs in the cascade system (viz., Thamanthi, Mawlaik, and Shwe Sar Yay in Chindwin Basin), a considerable reduction of sediment load at the outlet of the Chindwin Basin is expected. However, model results show only 15 MT/yr of reduction in sediment load when the TE is increased from 50% to 95% (161 MT/yr with 50% TE and 146 MT/yr with 95% TE). This limited reduction in sediment volume for a 45% increment in TE implies that the river channels would erode and generate sediment, when the river reaches are starved of sediment due to reservoir trapping. In contrast, sediment load from Upper Irrawaddy basin due to three reservoirs (viz., Myistone, Shweli, and Yeywa) does not show any difference when reservoirs are at 50% and 95% trapping efficiencies (157 MT/yr in both cases at the confluence, Figure 6). Sediment reduction due to those three planned reservoirs in the upper Irrawaddy Basin is not as high as Chindwin Basin. This reduction at the outlet of Sub-basin 29 (Figure 1B) varies only from 3.2% to 3.8% under both RCPs (compared to without reservoirs). Two of these reservoirs (out of three) are located far upstream in the basin and the Yeywa reservoir (Sub-basin 26) is located nearest to the basin outlet (Figure 6). However, it should be noted that the reservoir retention effects are neglected during the SWAT routing process to the basin outlet.
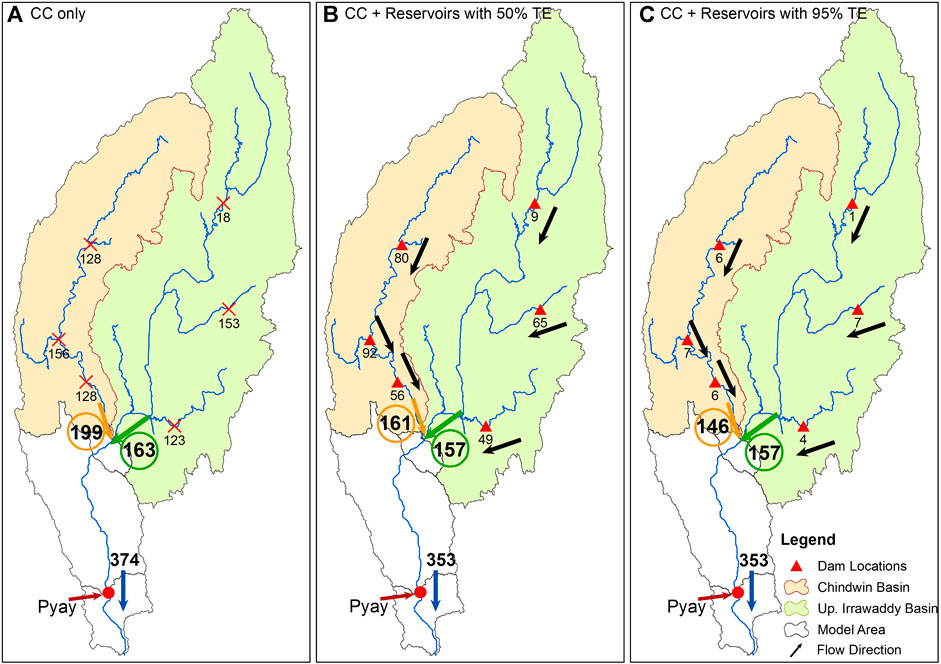
FIGURE 6. Projected mean annual sediment loads (in MT/yr) in different reservoir reaches (just downstream of reservoirs) from simulations forced with CSIRO Mk3.6 under RCP 8.5 with (A) climate change only (B) climate change and reservoirs with 50% trapping efficiency, and (C) climate change and reservoirs with 95% trapping efficiency for 2081–2100.
It is also noteworthy that an increase of trapping efficiency from 50% to 95% has no effect on the sediment load at the basin outlet, Pyay. This behavior is mainly driven by the sediment generated within the two sub-basins (number 30 and 31 (Figure 1B), 49,000 km2 of a combined area) located downstream of the Chindwin and Irrawaddy confluence. Most of this land area is utilized for agriculture, which generates a high rate of sediment erosion, and thus a very high sediment load (512 MT/yr), which completely overshadows the 15 MT/yr difference between the 50% and 95% TE cases. When the sediment carrying capacity of the river is less than the amount of sediment introduced to the river, excess sediment is deposited along the riverbed or flood plains. Thus, in both simulations shown in Figure 6, the sediment load at Pyay is governed by the sediment carrying capacity in the river reach from the Chindwin-Irrawaddy confluence to the basin outlet, which does not change in the two TE cases considered. Therefore, the computed sediment load at Pyay is identical in both the 50% and 95% TE cases.
Projected Streamflow and Sediment Loads at Basin Outlet (Pyay)
Similar to what was seen just downstream of the individual reservoirs, simulation results show that the annual streamflow at Pyay is similar for both trapping efficiencies (i.e., 50%, and 95% of TE). However, changes in seasonal streamflow at Pyay follow a similar pattern to reservoir outflows. Streamflow projections at Pyay (Supplementary Table S2) show a reduction in monsoonal flow (6–8% for RCP 2.6 and 6–7% for RCP 8.5 during end-century) compared to the corresponding CC only simulation results. In contrast, non-monsoonal streamflows are projected to increase by 32–43% and 32–38% for RCP 2.6 and RCP 8.5, respectively for the same period. The reservoirs store water during the monsoon period, which causes a reduction of the downstream flow. On the other hand, reservoir operational release plays a significant role in the non-monsoonal period, as an operational release is specified here as a constant minimum release (details in Methods). Therefore, the simulated low flow projections during the Nov-Apr period is greater with reservoirs than without (Supplementary Table S2).
Similar projections (with some variations) are also reported in other basins in the region. A similar study carried out in the Sesan River Basin (Vietnam) with seven reservoirs in operation, indicated that compared to the baseline period (2002–2012), streamflow may increase during the dry period but decreases during the wet period under both RCP 4.5 and RCP 8.5 during 2010–2100 (Ngo et al., 2018). Thus, simulation results for the Irrawaddy River Basin are consistent with results obtained for the Sesan River Basin. However, Ngo et al. (2018) show an increase of both wet and dry period flows in the Srepok River Basin (Vietnam), where five cascade reservoirs exist. The mean annual flows are projected to decrease by 2–3% (compared to the no-reservoirs situation) in the Sesan River under RCP 4.5 and RCP 8.5 during 2010–2100, and no changes are projected in the Srepok River for the same conditions. Mittal et al. (2016) also indicate that the flow variability in the Kangsabati River Basin (India) would reduce due to reservoir operations. This flow reduction is expected since high flows during flood events are buffered by the reservoirs while increasing the pre-monsoon low flows via flow regulations.
The mean seasonal and annual sediment loads follow the variations of streamflow projections. The sediment load at Pyay does not change due to different trapping efficiencies of the reservoirs. Table 5 shows the mean seasonal and annual sediment load variation at Pyay by the end-century period with 95% trapping efficiency in the reservoirs. During the monsoon period, the sediment load is projected to reduce (relative to CC only case) by 10–12% and 9–11% for RCP 2.6 and RCP 8.5, respectively, due to reservoirs. On the other hand, during the non-monsoon period, the sediment load is projected to increase by 36–52% under RCP 2.6 and 32–44% under RCP 8.5 (relative to CC only case). The relative changes in seasonal sediment load are always higher than that for streamflow. For example, the mean monsoon sediment load is more than five times that during the non-monsoon period during 2081–2100, whereas the monsoon streamflow is about three times than non-monsoon streamflow.
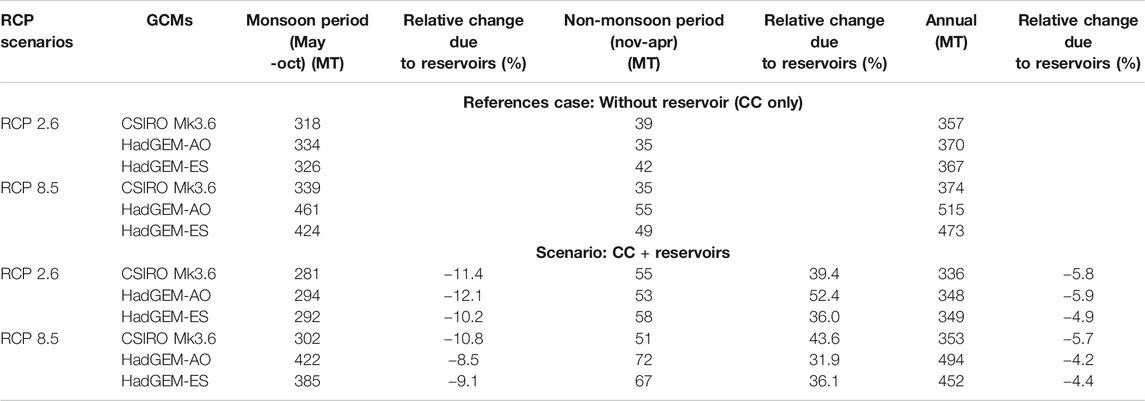
TABLE 5. Changes in projected seasonal and annual sediment load at the basin outlet, Pyay during the end-century period (2081–2100) under RCP 2.6 and RCP 8.5 with and without reservoirs. Results related to reservoirs scenarios are with 95% trapping efficiency at all reservoirs. The simulation without reservoirs is considered as the reference case to compute relative changes of projections obtained with reservoirs.
The ranges of projected reductions in annual sediment load at Pyay under RCP 8.5 for the end-century period (2081–2100), even with a 95% TE, is significantly lower (5–6% compared to CC only situation, Table 5) than those projected for other large basins in the region. For example, Shrestha et al. (2016) indicated that the sediment outflow from the Nam Ou Basin, Lao PDR (drainage area of 26,181 km2) would reduce considerably as the number of reservoirs increases. That study indicates a decrease of sediment outflow by 44%–80% only with the most upstream reservoir (capacity of 1,469 MCM) and by 66%–89% with five reservoirs (cumulative capacity of 2,400 MCM) within the cascade system at Nam Ou Basin. Yang et al. (2015) indicated that the mean sediment flux (mean discharge) in the Yangtze River Basin, China (drainage area of 1.8 million km2) has reduced by 71% (7%) during 2003–2012 (post-dam period) compared with the 1950–2002 (pre-dam period, where the three-gorges dams (TGDs with a capacity of 39,300 MCM) were completed in 2003). The total sediment reduction is attributed to the TGDs (65%), other dams of 64,000 MCM cumulative capacity (10%), precipitation decline (14%), soil conservation (10%), and water abstraction (1%). Ranasinghe et al. (2019) showed that in Pearl River, China (drainage area of 450,000 km2), fluvial sediment supply to the coast has reduced by 71% (compared to natural condition) during 1954–2013 due to excessive human activities such as dam constructions, river flow diversions and deforestation, while climate change driven increase in streamflow during the 21st century would only reduce 1% of this sediment deficit by 2100. According to the global sediment fluxes estimation by Syvitski et al. (2005), the sediment supplied to the world’s coast has reduced by 1.4 ± 0.3 billion tons per year because of anthropogenic retention during 1960–1995.
A recent study by Besset et al. (2019) showed that in 38 world rivers (out of 54 rivers reviewed), sediment supply to the associated deltas has decreased by more than 20% between pre- and post-1970 periods. In their assessment, approximately 30% reduction in sediment supply is shown for the Irrawaddy delta during 1974–2014 compared to pre-1970. In contrast, based on data collected during 1871–1879 and 1966–1996, it has been suggested that significant change in sediment transport to the Irrawaddy delta over nearly 100 years is unlikely (Furuichi et al., 2009). Due to changes in climate and anthropogenic activities (i.e., reservoirs) in the basin, this study shows an increase of sediment supply to the coast during mid- and end-century periods compared to the baseline period (1991–2005) except simulations with CSIRO Mk3.6 data under RCP 2.6 and RCP 8.5 for the mid-century period (Tables 6,7). The results of the present study suggest that future climate and reservoirs affect the streamflow regime and sediment out flux of the basin.
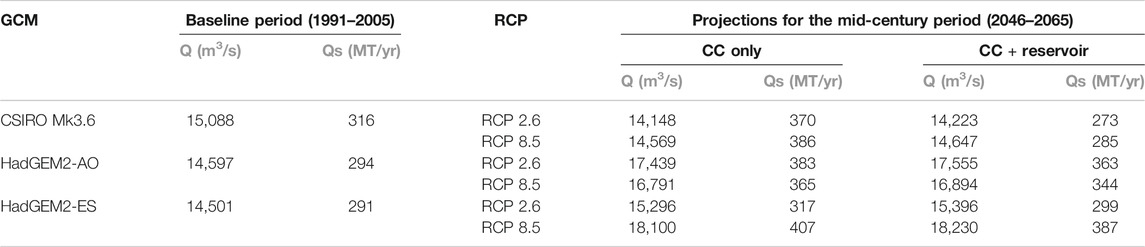
TABLE 6. Projected mean annual streamflow and sediment loads at Pyay from the three GCMs for the baseline period (1991–2005) and mid-century period (2046–2065). Q is streamflow and Qs is sediment load. CC denotes climate change.
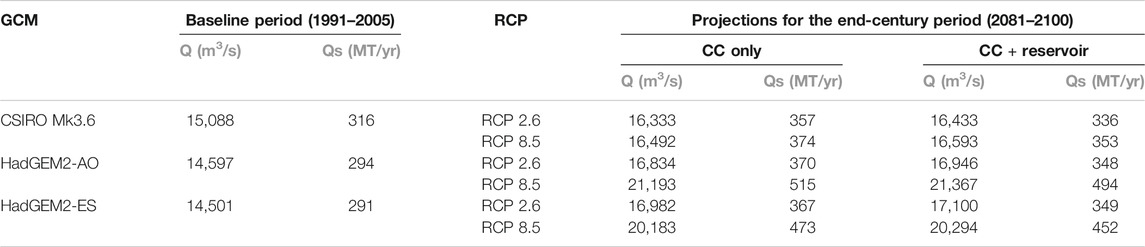
TABLE 7. Projected mean annual streamflow and sediment loads at Pyay from the three GCMs for the baseline period (1991–2005) and end-century period (2081–2100). Q is streamflow and Qs is sediment load. CC denotes climate change.
Conclusion
This study assesses the impact of climate change and reservoirs on 21st-century streamflow and sediment load in the Irrawaddy River Basin, Myanmar, through the application of a calibrated and validated SWAT model for a baseline period (1991–2005), and two future periods: mid-century (2046–2065) and end-century (2081–2100). Climatic data from the three selected GCMs (out of 10) were corrected for biases using the mean bias correction method and used to force a series of SWAT simulations. SWAT was here set-up for sediment and reservoir simulations, taking into account six planned reservoirs in the basin. Model simulations were undertaken with (a) only climate change forcing, and (b) with climate change forcing together with planned reservoirs.
Results show that, with climate change forcing only, streamflows and sediment loads at the basin outlet will increase substantially, relative to the baseline period. Under RCP 2.6 and RCP 8.5, streamflow at Pyay is projected to increase by 8–17% and 9–45% while sediment load is projected to increase by 13–26% and 18–75%, respectively, by the end-century period. In general, streamflows and sediment loads are projected to increase during the monsoon period compared to non-monsoonal months, with changes in sediment loads always being greater than that in streamflows.
Projections obtained with both climate forcing and planned reservoirs show that, while the impact of reservoirs on annual streamflow and sediment load at the basin outlet is minimal, both seasonal streamflow and sediment load are substantially affected by the presence of reservoirs. Annual streamflow at the basin outlet does not differ significantly compared to the climate change only case, for any RCP and for both future time periods considered, while the presence of reservoirs results in a small decrease of 4–6% in annual sediment loads at Pyay under RCP 8.5 during the end-century period. At seasonal time scales however, under RCP 8.5 during the end-century period, the presence of planned reservoirs is projected to decrease streamflow at the basin outlet by 6–7% during monsoon periods, while during non-monsoon periods, the reservoirs result in an increase of 32–38% in the streamflow at the outlet. Similarly, the presence of reservoirs is projected to decrease the sediment load by 9–11% during the monsoonal period and increase it by 32–44% during the non-monsoonal periods under RCP 8.5 by the end-century period.
Sediment load at the basin outlet may depend on factors other than climate change and reservoirs. One such factor, which is not considered in the present study, is changes in future land-use. Different land-use practices can affect the rate and magnitude of soil erosion and sediment yield of a basin and the streamflow (Rodriguez-Lloveras et al., 2016; Pokhrel, 2018). Therefore, as a future direction, a study combining the potential effects of climate, land-use and other human activities (i.e., water diversions and damming) is recommended.
Data Availability Statement
The raw data supporting the conclusions of this article will be made available by the authors, without undue reservation.
Author Contributions
TS carried out the design, model simulations, and drafting the manuscript. SM and RR provided the guidance on methodology. JB assisted with GCM data collection and analysis. All authors provided feedback on the manuscript.
Funding
This study is a part of TAJGS’s PhD research, which is supported by the EPP Myanmar project and Netherlands Fellowship Program (NFP). RR is supported by the AXA Research Fund and the Deltares Strategic Research Program ‘Coastal and Offshore Engineering’.
Conflict of Interest
The authors declare that the research was conducted in the absence of any commercial or financial relationships that could be construed as a potential conflict of interest.
Supplementary Material
The Supplementary Material for this article can be found online at: https://www.frontiersin.org/articles/10.3389/feart.2021.644527/full#supplementary-material.
References
Akpınara, A., Kömürcüb, M. I., and Kankal, M. (2011). Development of hydropower energy in Turkey : the case of Coruh river basin. Renew. Sustain. Energy Rev. 15, 1201–1209. doi:10.1016/j.rser.2010.10.001
Arnold, J. G., Kiniry, J. R., Srinivasan, R., Williams, J. R., Haney, E. B., and Neitsch, S. L. (2012). Soil & water assessment tool: input/output documentation, version 2012. texas water resour. institute, TR-439-650. Available at: http://swat.tamu.edu/media/69296/SWAT-IO-Documentation-2012.pdf
Arnold, J. G., Srinivasan, R., Muttiah, R. S., and Williams, J. R. (1998). Large area hydrologic modeling and assessment part I: model development. J. Am. Water Resour. Assoc 34, 73–89. doi:10.1111/j.1752-1688.1998.tb05961.x
Aung, M. T., Shrestha, S., Weesakul, S., and Shrestha, P. K. (2016). Multi-model climate change projections for Belu River basin , myanmar under representative concentration pathways. J. Earth Sci. Clim. Chang 7, 0–13. doi:10.4172/2157-7617.1000323
Azim, F., Shakir, A. S., Habib-ur-Rehman, M., and Kanwal, A. (2016). Impact of climate change on sediment yield for Naran watershed, Pakistan. Int. J. Sediment Res. 31, 212–219. doi:10.1016/j.ijsrc.2015.08.002
Besset, M., Anthony, E. J., and Bouchette, F. (2019). Multi-decadal variations in delta shorelines and their relationship to river sediment supply: an assessment and review. Earth-Science Rev. 193, 199–219. doi:10.1016/j.earscirev.2019.04.018
Brauer, D., Baumhardt, R. L., Gitz, D., Gowda, P., Mahan, J., Baumhardt, R. L., et al. (2015). Characterization of trends in reservoir storage, streamflow, and precipitation in the Canadian River watershed in New Mexico and Texas. Lake Reservoir Management 31, 64–79. doi:10.1080/10402381.2015.1006348
Dunn, F. E., Darby, S. E., Nicholls, R. J., Cohen, S., Zarfl, C., and Fekete, B. M. (2019). Projections of declining fluvial sediment delivery to major deltas worldwide in response to climate change and anthropogenic stress. Environ. Res. Lett. 14, 084034. doi:10.1088/1748-9326/ab304e
Eizel-Din, M. A., Bui, M. D., Rutschmann, P., Failer, E., Grass, C., Kramer, K., et al. (2010). Trap efficiency of reservoirs on the Nile River. River flow, 1111–1117. Available at: http://vzb.baw.de/digitale_bib/riverflow2010/PDF/B3/B3_03.pdf
Furuichi, T., Win, Z., and Wasson, R. J. (2009). Discharge and suspended sediment transport in the Ayeyarwady River, Myanmar: centennial and decadal changes. Hydrol. Process. 23, 1631–1641. doi:10.1002/hyp10.1002/hyp.7295
GCCA (2012). Myanmar climate chnage alliance. Available at: http://www.gcca.eu/national-programmes/asia/gcca-myanmar (Accessed June 13, 2016).
Ghimire, U., Babel, M. S., Shrestha, S., and Srinivasan, G. (2019). A multi-temporal analysis of streamflow using multiple CMIP5 GCMs in the Upper Ayerawaddy Basin, Myanmar. Climatic Change 155, 59. doi:10.1007/s10584-019-02444-3
Gordon, R. (1885). The Irawadi riverpoc. R. Geographical Soc. Monthly Rec. Geogr. 7, 292–331. doi:10.2307/1800379
Hedley, P. J., Bird, M. I., and Robinson, R. A. J. (2010). Evolution of the irrawaddy delta region since 1850. Geogr. J. 176, 138–149. doi:10.1111/j.1475-4959.2009.00346.x
Horton, R., Mel, M. De., Peters, D., Lesk, C., Bartlett, R., Helsingen, H., et al. (2017). Assessing climate risk in Myanmar. New York, NY, USA.
Imbulana, K. A. N. D. (2018). Assessment of climate change impacts on river hydrology and morphology and resulting socio-economic Vulnerability : a case study of the Chindwin river basin in Myanmar.
Jalota, S. K., Vashisht, B. B., Sharma, S., and Kaur, S. (2018). “Climate change projections,” in Understanding climate change Impacts on crop Productivity and water balance. Editors S. K. Jalota, B. B. Vashisht, S. Sharma, and S. Kaur (London, UK: Elsevier), 55–83. 10.1016/C2015-0-05656-8
Jalowska, A. M., and Yuan, Y. (2018). Evaluation of SWAT impoundment modeling methods in water and sediment simulations. J. Am. Water Resour. Assoc. 55, 209. doi:10.1111/1752-1688.12715
Kattelus, M., Rahaman, M. M., and Varis, O. (2015). Hydropower development in myanmar and its implications on regional energy cooperation. Ijssoc 7, 42–66. doi:10.1504/IJSSOC.2015.068071
Kim, Y. D., Kim, J. M., and Kang, B. (2017). Projection of runoff and sediment yield under coordinated climate change and urbanization scenarios in doam dam watershed, Korea. J. Water Clim. Chang. 8, 235–253. doi:10.2166/wcc.2016.068
Kreft, S., Eckstein, D., Dorsch, L., and Fischer, L. (2015). Global climate risk index 2016 who suffers most from extreme weather Events ? Weather-related Loss events in 2014 and 1995 to 2014. Bonn, Germany: Germanwatch e.V.
Kummu, M., and Varis, O. (2007). Sediment-related impacts due to upstream reservoir trapping, the lower Mekong River. Geomorphology 85, 275–293. doi:10.1016/j.geomorph.2006.03.024
Lele, S. M. (1987). Improved algorithms for reservoir capacity calculation incorporating storage-dependent losses and reliability norm. Water Resour. Res. 23, 1819–1823. doi:10.1029/wr023i010p01819
Lenderink, G., Buishand, A., and Van Deursen, W. (2007). Estimates of future discharges of the river rhine using two scenario methodologies: direct versus delta approach. Hydrol. Earth Syst. Sci. 11, 1145–1159. doi:10.5194/hess-11-1145-2007
Lewis, S. E., Bainbridge, Z. T., Kuhnert, P. M., Sherman, B. S., Henderson, B., Dougall, C., et al. (2013). Calculating sediment trapping efficiencies for reservoirs in tropical settings: a case study from the burdekin falls dam, NE Australia. Water Resour. Res. 49, 1017–1029. doi:10.1002/wrcr.20117
Maharjan, M., Babel, M. S., and Maskey, S. (2014). Reducing the basin vulnerability by land management practices under past and future climate: a case study of the Nam Ou River Basin, Lao PDR. Lao PDR. Hydrol. Earth Syst. Sci. Discuss. 11, 9863–9905. doi:10.5194/hessd-11-9863-2014
Maneux, E., Probst, J. L., Veyssy, E., and Etcheber, H. (2001). Assessment of dam trapping efficiency from water residence time: application to fluvial sediment transport in the adour, dordogne, and garonne River basins (France). Water Resour. Res. 37, 801–811. doi:10.1029/2000WR900195
Marhaento, H., Booij, M. J., and Hoekstra, A. Y. (2018). Hydrological response to future land-use change and climate change in a tropical catchment. Hydrological Sci. J. 63, 1368–1385. doi:10.1080/02626667.2018.1511054
Miao, C., Ni, J., Borthwick, A. G. L., and Yang, L. (2011). A preliminary estimate of human and natural contributions to the changes in water discharge and sediment load in the Yellow River. Glob. Planet. Change 76, 196–205. doi:10.1016/j.gloplacha.2011.01.008
Milliman, J. D., and Meade, R. H. (1983). World-wide delivery of river sediment to the oceans. J. Geology. 91, 1–21. doi:10.1086/69030910.1086/628741
Milliman, J. D., and Syvitski, J. P. M. (1992). Geomorphic/tectonic control of sediment discharge to the ocean: the importance of small mountainous rivers. J. Geology. 100, 525–544. doi:10.1086/629606
Mittal, N., Bhave, A. G., Mishra, A., and Singh, R. (2016). Impact of human intervention and climate change on natural flow regime. Water Resour. Manage. 30, 685–699. doi:10.1007/s11269-015-1185-6
Neitsch, S. L., Arnold, J. G., Kiniry, J. R., and Williams, J. R. (2011). Soil & water assessment Tool theoretical documentation version 2009. Texas, USA.
Ngo, L. A., Masih, I., Jiang, Y., and Douven, W. (2018). Impact of reservoir operation and climate change on the hydrological regime of the sesan and Srepok rivers in the lower mekong basin. Climatic Change 149, 107–119. doi:10.1007/s10584-016-1875-y
Nilawar, A. P., and Waikar, M. L. (2019). Impacts of climate change on streamflow and sediment concentration under RCP 4.5 and 8.5: a case study in Purna river basin, India. Sci. Total Environ. 650, 2685–2696. doi:10.1016/j.scitotenv.2018.09.334
Pervez, M. S., and Henebry, G. M. (2015). Assessing the impacts of climate and land use and land cover change on the freshwater availability in the Brahmaputra River basin. J. Hydrol. Reg. Stud. 3, 285. doi:10.1016/j.ejrh.2014.09.003
Piman, T., Cochrane, T. A., Arias, M. E., Dat, N. D., and Vonnarart, O. (2015). “Managing hydropower under climate change in the Mekong tributaries,” in Managing water resources under climate uncertainty: examples from Asia, europe, Latin America, and Australia. Editors V. M. S. van derShrestha, A. Anal, and P. Salam (Springer), 223–248.
Pokhrel, B. (2018). Impact of land use change on flow and sediment yields in the khokana outlet of the bagmati river, kathmandu, Nepal. Hydrology 5, 22. doi:10.3390/hydrology5020022
Ranasinghe, R., Wu, C. S., Conallin, J., Duong, T. M., and Anthony, E. J. (2019). Disentangling the relative impacts of climate change and human activities on fluvial sediment supply to the coast by the world’s large rivers: Pearl River Basin, China. Sci. Rep. 9, 9236–9310. doi:10.1038/s41598-019-45442-2
IPCC (2014). in Climate change 2014: synthesis report. Contribution of working groups I, II and III to the fifth assessment report of the intergovernmental panel on climate change core writing team. Editors R. K. Pachauri, and L. A. Meyer (Geneva, Switzerland: IPCC), 151.
Robinson, R. A. J., Bird, M. I., Oo, N. W., Hoey, T. B., Aye, M. M., Higgitt, D. L., et al. (2007). The Irrawaddy River sediment flux to the Indian ocean: the original nineteenth‐century data revisited. J. Geology. 115, 629–640. doi:10.1086/521607
Rodriguez-Lloveras, X., Buytaert, W., and Benito, G. (2016). Land use can offset climate change induced increases in erosion in mediterranean watersheds. Catena 143, 244–255. doi:10.1016/j.catena.2016.04.012
Saito, Y., Chaimanee, N., Thanawat, J., and Syvitski, J. P. M. (2007). Shrinking megadeltas in Asia : sea-level rise and sediment reduction impacts from case study of the chao phraya delta. LOICZ Inprint 3–9
Sayasane, R., Kawasaki, A., Shrestha, S., and Takamatsu, M. (2016). Assessment of potential impacts of climate and land use changes on stream flow: a case study of the Nam Xong watershed in Lao PDR. J. Water Clim. Chang. 7, 184–197. doi:10.2166/wcc.2015.050
Schmidli, J., Frei, C., and Vidale, P. L. (2006). Downscaling from GCM precipitation: a benchmark for dynamical and statistical downscaling methods. Int. J. Climatol. 26, 679–689. doi:10.1002/joc.1287
Shrestha, B., Babel, M. S., Maskey, S., van Griensven, A., Uhlenbrook, S., Green, A., et al. (2016). Impact of climate change on sediment yield in the mekong river basin: a case study of the Nam Ou Basin, Lao PDR. Clim. Chang. 9, 3339–3384. doi:10.5194/hessd-9-3339-2012
Shrestha, S., and Htut, A. Y. (2016). Modelling the potential impacts of climate change on hydrology of the Bago River Basin, Myanmar. Int. J. River Basin Management 14, 287. doi:10.1080/15715124.2016.1164177
Shrestha, S., and Lohpaisankrit, W. (2017). Flood hazard assessment under climate change scenarios in the Yang River Basin, Thailand. Int. J. Sustainable Built Environ. 6, 285–298. doi:10.1016/j.ijsbe.2016.09.006
Sirisena, T. A. J. G., Maskey, S., Ranasinghe, R., and Babel, M. S. (2018). Effects of different precipitation inputs on streamflow simulation in the Irrawaddy River Basin, Myanmar. J. Hydrol. Reg. Stud. 19, 265–278. doi:10.1016/j.ejrh.2018.10.005
Syvitski, J. P., Vörösmarty, C. J., Kettner, A. J., and Green, P. (2005). Impact of humans on the flux of terrestrial sediment to the global coastal ocean. Science 308, 376–380. doi:10.1126/science.1109454
Syvitski, J. P. M., Kettner, A. J., Overeem, I., Hutton, E. W. H., Hannon, M. T., Brakenridge, G. R., et al. (2009). Sinking deltas due to human activities. Nat. Geosci 2, 681. doi:10.1038/ngeo629
Syvitski, J. P. M., and Milliman, J. D. (2007). Geology, geography, and humans battle for dominance over the delivery of fluvial sediment to the coastal ocean. J. Geology. 115, 1–19. doi:10.1086/509246
Syvitski, J. P. M., and Saito, Y. (2007). Morphodynamics of deltas under the influence of humans. Glob. Planet. Change 57, 261–282. doi:10.1016/j.gloplacha.2006.12.001
Syvitski, J. P. M. (2003). Supply and flux of sediment along hydrological pathways: research for the 21st century. Glob. Planet. Change 39, 1–11. doi:10.1016/S0921-8181(03)00008-0
Taft, L., and Evers, M. (2016). A review of current and possible future human-water interactions in Myanmar ’ s river basins.
Thomas, H. A., and Fiering, M. B. (1963). Operations research in water quality management. Cambridge, Mass: Harvard Water Resources Group.
Thompson, J. R., Green, A. J., Kingston, D. G., and Gosling, S. N. (2013). Assessment of uncertainty in river flow projections for the Mekong River using multiple GCMs and hydrological models. J. Hydrol. 486, 1–30. doi:10.1016/j.jhydrol.2013.01.029
Vaighan, A. A., Talebbeydokhti, N., and Bavani, A. M. (2017). Assessing the impacts of climate and land use change on streamflow, water quality and suspended sediment in the Kor River Basin, Southwest of Iran. Environ. Earth Sci. 76. doi:10.1007/s12665-017-6880-6
Vigiak, O., Malagó, A., Bouraoui, F., Vanmaercke, M., and Poesen, J. (2015). Adapting SWAT hillslope erosion model to predict sediment concentrations and yields in large Basins. Sci. Total Environ. 538, 855–875. doi:10.1016/j.scitotenv.2015.08.095
Vörösmarty, C. J., and Sahagian, D. (2000). Anthropogenic disturbance of the terrestrial water cycle, Bioscience 50, 753. doi:10.1641/0006-3568(2000)050[0753:adottw]2.0.co;2
Walling, D. E. (2006). Human impact on land-ocean sediment transfer by the world's rivers. Geomorphology 79, 192–216. doi:10.1016/j.geomorph.2006.06.019
Walling, D. E. (2009). The impact of global change on erosion and sediment transport by rivers:Paris, France. Current Progress and Future Challenges.
Wang, C., Jiang, R., Mao, X., Sauvage, S., Sánchez-Pérez, J.-M., Woli, K. P., et al. (2015). Estimating sediment and particulate organic nitrogen and particulate organic phosphorous yields from a volcanic watershed characterized by forest and agriculture using SWAT model. Ann. Limnol. Int. J. Lim. 51, 23–35. doi:10.1051/limn/2014031
Wang, L., Ranasinghe, R., Maskey, S., van Gelder, P. H. A. J. M., and Vrijling, J. K. (2016). Comparison of empirical statistical methods for downscaling daily climate projections from CMIP5 GCMs: a case study of the Huai River Basin, China. Int. J. Climatol. 36, 145–164. doi:10.1002/joc.4334
Wu, J., Miao, C., Zhang, X., Yang, T., and Duan, Q. (2017). Detecting the quantitative hydrological response to changes in climate and human activities. Sci. Total Environ. 586, 328–337. doi:10.1016/j.scitotenv.2017.02.010
Xu, R., Hu, H., Tian, F., Li, C., and Khan, M. Y. A. (2019). Projected climate change impacts on future streamflow of the Yarlung Tsangpo-Brahmaputra River. Glob. Planet. Change 175, 144–159. doi:10.1016/j.gloplacha.2019.01.012
Yang, S. L., Xu, K. H., Milliman, J. D., Yang, H. F., and Wu, C. S. (2015). Decline of Yangtze River water and sediment discharge: impact from natural and anthropogenic changes. Sci. Rep. 5, 12581. doi:10.1038/srep12581
Yang, S. L., Milliman, J. D., Xu, K. H., Deng, B., Zhang, X. Y., and Luo, X. X. (2014). Downstream sedimentary and geomorphic impacts of the three gorges dam on the Yangtze River. Earth-Science Rev. 138, 469–486. doi:10.1016/j.earscirev.2014.07.006
Zarfl, C., Lumsdon, A. E., Berlekamp, J., Tydecks, L., and Tockner, K. (2014). A global boom in hydropower dam construction. Aquat. Sci. 77, 161–170. doi:10.1007/s00027-014-0377-0
Zhao, G., Mu, X., Strehmel, A., and Tian, P. (2014). Temporal variation of streamflow, sediment load and their relationship in the Yellow River Basin, China. PLoS One 9, e91048–13. doi:10.1371/journal.pone.0091048
Zhou, Y., Xu, Y., Xiao, W., Wang, J., Huang, Y., and Yang, H. (2017). Climate change impacts on flow and suspended sediment yield in headwaters of high-latitude regions-A case study in China's far northeast. Water 9, 966–982. doi:10.3390/w9120966
Keywords: climate change, Irrawaddy river, reservoirs, sediment load, streamflow
Citation: Sirisena TAJG, Maskey S, Bamunawala J and Ranasinghe R (2021) Climate Change and Reservoir Impacts on 21st-Century Streamflow and Fluvial Sediment Loads in the Irrawaddy River, Myanmar. Front. Earth Sci. 9:644527. doi: 10.3389/feart.2021.644527
Received: 21 December 2020; Accepted: 08 February 2021;
Published: 23 March 2021.
Edited by:
Daniele Ganora, Politecnico Di Torino, ItalyReviewed by:
Francesca Berteni, University of Brescia, ItalyGuoqing Zhang, Institute of Tibetan Plateau Research (CAS), China
Copyright © 2021 Sirisena, Maskey, Bamunawala and Ranasinghe. This is an open-access article distributed under the terms of the Creative Commons Attribution License (CC BY). The use, distribution or reproduction in other forums is permitted, provided the original author(s) and the copyright owner(s) are credited and that the original publication in this journal is cited, in accordance with accepted academic practice. No use, distribution or reproduction is permitted which does not comply with these terms.
*Correspondence: T. A. J. G. Sirisena, ai5nLnMudGhvdGFwaXRpeWFhcmFjaGNoaWxsYWdlQHV0d2VudGUubmw=