
94% of researchers rate our articles as excellent or good
Learn more about the work of our research integrity team to safeguard the quality of each article we publish.
Find out more
ORIGINAL RESEARCH article
Front. Earth Sci. , 23 June 2021
Sec. Structural Geology and Tectonics
Volume 9 - 2021 | https://doi.org/10.3389/feart.2021.642243
This article is part of the Research Topic Unveiling Active Faults: Multiscale Perspectives and Alternative Approaches Addressing the Seismic Hazard Challenge View all 17 articles
 Federica Ferrarini1,2*
 Rita de Nardis1,2
 Francesco Brozzetti1,2
 Daniele Cirillo1,2
 J Ramón Arrowsmith3
 Giusy Lavecchia1,2
The Apenninic chain, in central Italy, has been recently struck by the Norcia 2016 seismic sequence. Three mainshocks, in 2016, occurred on August 24 (MW6.0), October 26 (MW 5.9) and October 30 (MW6.5) along well-known late Quaternary active WSW-dipping normal faults. Coseismic fractures and hypocentral seismicity distribution are mostly associated with failure along the Mt Vettore-Mt Bove (VBF) fault. Nevertheless, following the October 26 shock, the aftershock spatial distribution suggests the activation of a source not previously mapped beyond the northern tip of the VBF system. In this area, a remarkable seismicity rate was observed also during 2017 and 2018, the most energetic event being the April 10, 2018 (MW4.6) normal fault earthquake. In this paper, we advance the hypothesis that the Norcia seismic sequence activated a previously unknown seismogenic source. We constrain its geometry and seismogenic behavior by exploiting: 1) morphometric analysis of high-resolution topographic data; 2) field geologic- and morphotectonic evidence within the context of long-term deformation constraints; 3) 3D seismological validation of fault activity, and 4) Coulomb stress transfer modeling. Our results support the existence of distributed and subtle deformation along normal fault segments related to an immature structure, the Pievebovigliana fault (PBF). The fault strikes in NNW-SSE direction, dips to SW and is in right-lateral en echelon setting with the VBF system. Its activation has been highlighted by most of the seismicity observed in the sector. The geometry and location are compatible with volumes of enhanced stress identified by Coulomb stress-transfer computations. Its reconstructed length (at least 13 km) is compatible with the occurrence of MW≥6.0 earthquakes in a sector heretofore characterized by low seismic activity. The evidence for PBF is a new observation associated with the Norcia 2016 seismic sequence and is consistent with the overall tectonic setting of the area. Its existence implies a northward extent of the intra-Apennine extensional domain and should be considered to address seismic hazard assessments in central Italy.
Identification and geometric reconstruction of active faults are one of the major concerns in Italy given the evident earthquake hazard (MPS, Gruppo di Lavoro, 2004; DISS Working Group, 2018) and the occurrence of several earthquakes among the most energetic (MW≥6.5) in the Mediterranean region (Figure 1A). The majority of the hypocentral distribution (Chiarabba et al., 2005) concentrates at upper crustal depths along the intra-Apennine Quaternary active extensional belt which, in central Italy (Figure 1B), is mostly represented by W-dipping high-angle- and E-dipping low-angle normal faults (Boncio and Lavecchia, 2000; Collettini et al., 2006; Mirabella et al., 2011; Lavecchia et al., 2017; Lavecchia et al., 2020). The west-dipping faults are considered as responsible for the most energetic earthquakes (stars in Figure 1B, macroseismic epicentres from Rovida et al., 2021) occurring both historically and in the last decades (Galadini and Galli, 2000; Boncio et al., 2004; Roberts and Michetti, 2004; Chiaraluce et al., 2011; Lavecchia et al., 2011; Lavecchia et al., 2012; Valoroso et al., 2013; Chiaraluce et al., 2017).
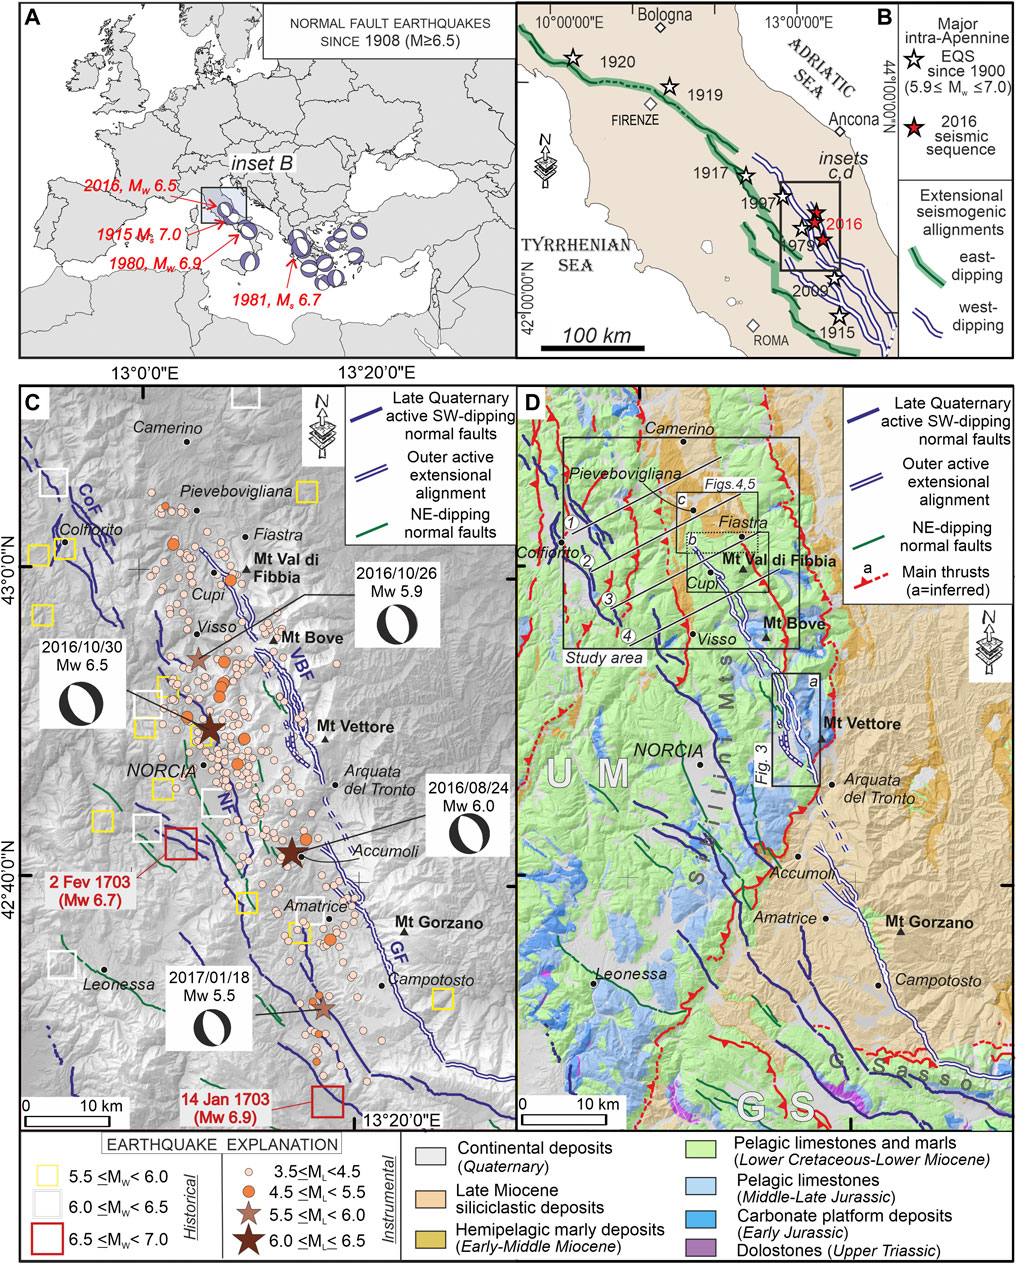
FIGURE 1. Regional- and seismological background of the 2016 Mw6.5 Norcia earthquake. (A) Map of the most energetic normal fault earthquakes (M ≥ 6.5) occurred in the Mediterranean region since 1908 (focal mechanisms are from Heidbach et al., 2018). (B) structural sketch of the main west- and east-dipping extensional alignments known in central Italy (from Lavecchia et al., 2017) with the occurrence, starting from 1900, of the most energetic (M ≥ 5.9) historical earthquakes (from Rovida et al., 2021). (C) epicentral distribution of the historical- and instrumental events occurred in the Norcia 2016 seismic sequence epicentral area. Historical seismicity is from Rovida et al., 2021 (Mw ≥ 5.0–from 1005 AD to 2016/08/23) while instrumental seismicity is from Chiaraluce et al., 2017 (ML≥3.5–from 2016/08/24 to 2018/12/31). Focal mechanisms of the four major events are also reported. The main tectonic lineaments belonging to the SW- and NE-dipping normal fault systems are from the literature (Lavecchia et al., 2016; Pizzi et al., 2017; Brozzetti et al., 2019). Normal fault legend as in panel 1D. Fault key: CoF = Colfiorito fault; GF = Gorzano fault; NF = Norcia fault; VBF = Mt Vettore-Mt Bove fault. (D) Structural-geological sketch of the Umbria-Marche Apennines with the study area of Figure 2 and the traces (1–4) of the geological cross-sections reported in Figure 7. Insets bound the sectors investigated in this study: a) Mt Vettore; b) Cupi-Mt Val di Fibbia; c) Pievebovigliana-Fiastra. The geological boundaries rely on the Carta Geologica d’Italia at scale 1:100,000 (Regio Ufficio Geologico, 1941; Servizio Geologico d’Italia, 1959; Servizio Geologico d’Italia, 1967; Servizio Geologico d’Italia, 1968a; Servizio Geologico d’Italia, 1968b; Servizio Geologico d’Italia, 1969). Structural lineaments as in Figure 1C. Key: UM = Umbria-Marche domain, GS = Gran Sasso domain.
Central Italy was recently struck by the Norcia 2016 seismic sequence. Three normal fault earthquakes on 24 August (MW6.0, 01:36:32 UTC), 26 October (MW5.9, 19:18:07 UTC) and 30 October (MW6.5, 06:40:18 UTC) (hereinafter EQ1, EQ2, EQ3, respectively) nucleated along two late Quaternary active WSW-dipping faults belonging to the outer extensional alignment (Figure 1C): the northern strand of the Mt Gorzano (GF) fault and the Mt Vettore-Mt Bove (VBF) (Lavecchia et al., 2016; Pizzi et al., 2017; Brozzetti et al., 2019). Surface coseismic displacements, associated with both the August- and 30 October events, were extensively observed along the VBF (Emergeo Working Group, 2017; Pizzi et al., 2017; Pucci et al., 2017; Civico et al., 2018; Villani et al., 2018; Brozzetti et al., 2019).
The epicentral distribution of ML≥3.5 events is consistent with failure along the VBF (Figure 1C–from Chiaraluce et al., 2017 in the period 2016/08/24–2016/11/30 and from ISIDe Working group, 2007 in the period 2016/12/01–2018/12/31). Nevertheless, they show that the GF southern strand was activated with the January 18, 2017 (MW5.5) shock (hereinafter EQ4), extending the fault alignment activated by the sequence to ∼70 km along strike (Figure 1C).
The focal mechanisms of the main events (Figure 1C) (TDMT solutions from Scognamiglio et al., 2006) show predominantly normal-fault sense of motion consistently with the extensional tectonic regime in central Italy (Ferrarini et al., 2015; Carafa and Bird, 2016; Montone and Mariucci, 2016; Devoti et al., 2017; Carafa et al., 2020; Mariucci and Montone, 2020).
Several tectonic models for the earthquake sources have been proposed in the literature. Authors agree on the almost exclusive activation of the two main seismogenic sources related to the VBF and GF. In Lavecchia et al., 2016 the nucleation of the August 24 MW6.0 event at the linkage zone between the VBF and GF, has been advanced. On the other hand, the two sources are considered to be mechanically separated (Chiarabba et al., 2018; Suteanu et al., 2018) and/or also reactivating preexisting compressional/transpressional structures (Falcucci et al., 2018; Bonini et al., 2019). In Pizzi et al. (2017), the relay zones distributed along the main fault segments would have exerted a strong control on both the earthquakes nucleation and rupture propagation. A complex interaction between the main WSW-dipping sources with inherited primary- (Puliti et al., 2020) and/or secondary/antithetic structures (Scognamiglio et al., 2018; Cheloni et al., 2019) has been proposed to control extent and termination of the ruptures, while fluid diffusion may have had a significant role in the earthquake preparatory phase (Chiarabba et al., 2020), in their timing and reinitiation (Walters et al., 2018). Hangingwall gravity-driven processes along the main fault planes (Valerio et al., 2018; Bignami et al., 2019; Delorme et al., 2020) have been also considered to explain the whole deformation field observed in the area. However, notwithstanding the tectonic model complexity, all data even including remote sensing (InSAR, strong motion and GPS velocity data) (Lavecchia et al., 2016; Tinti et al., 2016; Cheloni et al., 2017; Chiaraluce et al., 2017; Huang et al., 2017; Liu et al., 2017; Xu et al., 2017; Cheloni et al., 2019; Brozzetti et al., 2020) confirmed that deformation is concentrated along and at the hanging wall of the VBF system.
The Norcia 2016 seismic sequence occurred after a long interseismic period (∼1,500 and 800 years for VBF and the GF, respectively) as estimated in trenching investigations (Galadini and Galli, 2003; Galli et al., 2019). The historical catalog provided in Rovida et al., 2021 also confirms as the most energetic earthquakes occurring in the sector date back to 1703 with two events on 14 January and 2 February, the former (MW6.9) involving the Norcia fault (Galli et al., 2019), the latter (MW6.7) the Upper Aterno Valley (Moro et al., 2002). The nearly total VBF and GF quiescence during more than 1ky before the 2016 sequence onset, combined with obvious geomorphic imprints on the landscape and considerable geological offsets (Calamita et al., 1992; Festa, 2005; Pierantoni et al., 2013; Porreca et al., 2018; Brozzetti et al., 2019), made clear the seismic hazard of the area.
In this paper, we first focus on an unexpected and not yet investigated outcome associated with the Norcia seismic sequence. We first provide evidence for the existence of a previously unmapped normal fault (hereinafter Pievebovigliana fault, PBF), which strikes beyond the northern tip of the VBF system. The sector (study area in Figure 1D) experienced a seismic activity during all 2017 and 2018, with an event up to MW4.6, on april 10, 2018 (Figure 2A, focal mechanism solution from TDMT, Scognamiglio et al., 2006).
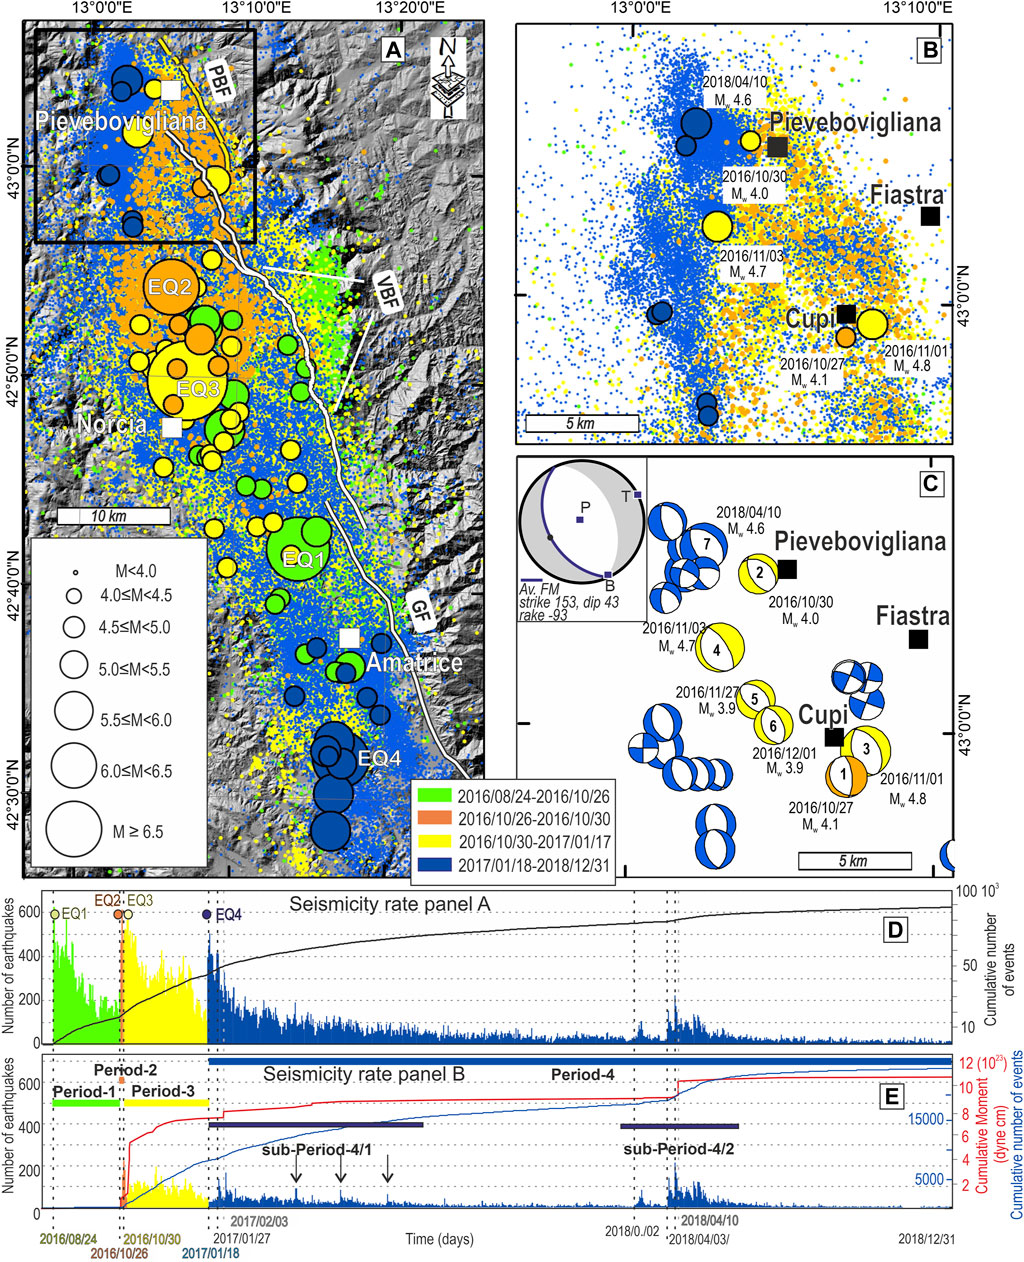
FIGURE 2. Spatio-temporal evolution of seismicity from August 24, 2016 to December 31, 2018. (A) Epicentral distribution of earthquakes occurred during the Norcia seismic sequence with ML≥1.0 and depth<20 km reported by the Italian seismological Instrumental and Parametric database (ISIDe Working group, 2007). The colors of epicentres indicate four different time intervals following the main seismic events: August 24, 2016, Mw= 6.0 (EQ1; green); October 26, 2016, Mw=5.9 (EQ2; orange); October 30, 2016, Mw6.5 (EQ3; yellow); January 18, 2017, Mw5.5 (EQ4; blue). M refers to moment magnitude for the larger events and local magnitude for small earthquakes as reported by the cited catalog (B) Focus on the seismicity distribution in the study area (C) Focal mechanisms of significant earthquakes of the study area, divided into four sub-groups in accordance with the defined time intervals. The focal solution labels point out the temporal occurrence of the most significant event Mw ≥ ∼ 4.0. Source of data: TDMT database (Scognamiglio et al., 2006). The left upper inset represents the average focal mechanism, with T, P and B axes, computed by using the Bingham statistical procedure (FaultKin 8 software, Allmendinger, et al., 2012). (D) Number of earthquakes vs time and the corresponding cumulative curve for seismicity from August 24, 2016 to December 31, 2018 and shown in panel (A). (E) Number of earthquakes vs. time, cumulative curve and cumulative seismic moment release referred to seismicity spanning from August 24, 2016 to December 31, 2018 in the study area.
We present a multiscale-multidisciplinary analysis aimed at identifying the PBF and constrain its geometry, kinematics and seismogenic nature. Our approach combines: 1) morphometric analysis of high resolution topography (HRT) data; 2) field geology and long-term deformation constraints; 3) seismological validation of fault activity; and 4) Coulomb Stress modeling.
We develop evidence supporting the existence of the late Quaternary active PBF. We discuss the results in the light of the observed distributed deformation. We argue the hypothesis that PBF is the result of an immature stage of faulting and that it strikes along the continuation of the well-developed and adjacent active normal faults (VBF and GF). This can have significant implications in terms of seismic hazard assessment in central Italy.
The stratigraphic setting of the area containing 2016 Norcia seismic sequence is mostly represented by the successions belonging to the Umbria-Marche and (only marginally) Gran Sasso domains (UM and GS, respectively in Figure 1D). They reflect the evolution, starting from the late Triassic, of a passive continental margin characterized by platform-to-deep-water environments (Pierantoni et al., 2005; Cosentino et al., 2010; Barchi et al., 2012; Pierantoni et al., 2013 and references therein).
The units cropping out in the UM domain (Figure 1D) are represented, from the bottom to the top, by: Upper Triassic-Early Jurassic platform dolostones and limestones evolving to middle-late Jurassic basinal limestones and cherty limestones; Lower Cretaceous-Eocene (p.p) pelagic units marked by a significant increase of the pelitic content; early-middle Miocene hemipelagic successions (for a more detailed description we relate the reader to the focus provided in the next subsection).
In the Gran Sasso domain (GS in Figure 1D) the pre-orogenic stratigraphy is characterized by deposits settled along the transitional zone connecting the UM basinal domain and the carbonatic platform realm (Vezzani and Ghisetti, 1998; Cosentino et al., 2010; Adamoli et al., 2012; and references therein). The pelagic succession bears frequent calcareous-clastic turbidites interbeds. Levels of macroforaminifera-bearing breccias are also frequent in the middle Eocene p.p.-lower Miocene p.p. terms. Glauconitic limestones, calcareous marls alternating with calcareous-clastic gravity flows and by a late Miocene (p.p) clay interval rich in planktonic foraminifera predate the onset of the siliciclastic foredeep deposits. Typical Jurassic-Cretaceous carbonate platform succession crops out only in the GS westernmost sector.
The uppermost Miocene stratigraphy is mostly represented by the foreland basin deposits corresponding to the ‘Laga Flysch’ auctorum. The formation shows a complex internal architecture characterized by several vertical and horizontal transitions marked by changes in sandstone/pelite ratio and turbidite facies, by the presence of gypsum–arenite horizons (middle Messinian) and a volcaniclastic layer settled during the uppermost (5.5 Ma) Messinian (Scarsella, 1953; Crescenti, 1966; Ricci Lucchi, 1973; Ricci Lucchi, 1975; Centamore et al., 1991; Centamore et al., 1992; Odin et al., 1997).
The structural evolution of the area is the result of a late Miocene-early Pliocene compressional phase which originated the two arcuate regional thrusts (Figure 1D) of the Sibillini Mts (Koopman, 1983; Lavecchia, 1985; Barchi et al., 1988; Calamita and Deiana, 1988; Lavecchia et al., 1988) and the Gran Sasso Mt (Ghisetti and Vezzani, 1991). This phase was also responsible for doubling the UM sedimentary sequence, to the north, and for overthrusting of the UM succession on the GS, to the south (Olevano-Antrodoco line - Salvini and Vittori, 1982; Cipollari et al., 1997; Deiana et al., 2003). Folds and thrusts consequent to this phase define structural trends which are roughly N-S and E-W trending, in the Sibillini Mts- and Gran Sasso sectors, respectively.
The last tectonic phase recognizable in the area relates to the late Pliocene-Quaternary extensional tectonics (Brozzetti and Lavecchia, 1994; Lavecchia et al., 1994; Cavinato and and De Celles, 1999; Galadini and Galli, 2000).
Normal faults cross-cut the Mio-Pliocene folds and thrusts along NNW-SSE (to the North) to E-W (to the South) trending alignments with a prevalent western and southern dip, respectively. Their activity started in Lower Pleistocene (Calamita et al., 1994; Lavecchia et al., 1994; Cavinato and and De Celles, 1999) and promoted the formation of continental basins (e.g., the Norcia and Castelluccio basins) filled by hundreds of meters of lacustrine and fluvial deposits (Blumetti et al., 1993; Boncio et al., 1998; Boncio et al., 2004; Villani et al., 2019). Middle-Upper Pleistocene and Holocene successions (slope debris, alluvial fans interlayered with fluvial deposits, glacial- and fluvioglacial deposits) also occur within the continental basins and along the slopes of the main reliefs (Figure 1D).
In this section, we briefly describe (Figure 1D) the stratigraphic succession cropping out in the study area (see location in Figure 1D) and reported in the geological sections discussed later (Methods and Materials and Discussion and Conclusions).
As highlighted in the available literature maps (e.g., Barchi et al., 2012; Pierantoni et al., 2013), here the basinal Umbria Marche succession includes, from the bottom: 1) Early Jurassic carbonate platform deposits (Calcare Massiccio Fm), 2) Early to-Late Jurassic pelagic limestones, marls and cherty limestones (Corniola Fm, Rosso Ammonitico Fm/Marne del Serrone Fm - Calcari e Marne a Posidonia Fm, Calcari Diasprigni Fm) and 3) Lower Cretaceous-Lower Miocene p.p. limestones, marly limestones and marls (Maiolica Fm, Marne a Fucoidi Fm, and the FMs of the “Scaglia group”).
The aforementioned stratigraphy refers to the so-called “complete” succession, which was settled in most of the subsiding sectors of the Umbria-Marche basin. Conversely, the Jurassic palaeo-highs, which suffered a very slow drowning, are characterized by “condensed” or “reduced” successions, in which the Bugarone Fm replaces the whole -or part of- Jurassic pelagites.
Upward, the early-middle Miocene hemipelagic succession (Bisciaro Fm, Schlier Fm) consisting of marly siliceous limestones and clayey-silty marls with calcarenitic intercalations, predate the siliciclastic sin-orogenic deposition which is locally represented by the Arenarie di Camerino Fm (Serravallian p.p.-Messinian p.p.; Calamita et al., 1979).
Several logs of deep wells for oil exploration (e.g. Trevi 1, Antrodoco 1, Perugia 2, ViDEPI, 2020) highlight that the succession described above lies above Upper Triassic evaporites (Anidriti di Burano) which pass below to continental metapelites and quartzite (Verrucano Fm., Late Triassic- Permian (?)).
As recorded by instrumental seismicity, the Mt Vettore-Mt Gorzano area was characterized, by small earthquakes with magnitude ML≤4.0 and very low seismicity rate (1981–2016) (Supplementary Figure S1) while neighboring active fault systems generated intense and important seismic sequences as the Norcia, 1979, MW5.9, Colfiorito 1997, MW6.0, and L’Aquila 2009, MW6.3. The modern observations of such seismic sequences highlighted their multi-phase spatial-temporal evolution which progressively activated adjacent master faults, synthetic and antithetic segments and illuminates complex normal fault systems.
The Norcia 2016 seismic sequence showed similar characteristics. In fact, starting from EQ1, which occurred nearly 8 km NNW from the town of Amatrice, the seismicity migrated toward Cupi and Pievebovigliana towns, to the north, and to about 20 km south to Amatrice (see sect. Introduction).
The time-space analysis of the seismic sequence is shown in Figure 2. Here, we compare the seismicity, mainly associated with the VBF and GF (Figure 2A) with the ones of the study area (black inset in Figures 2A,B). The seismic sequence mostly occurred from August 2016 to the ending of June 2017 (75% of events, see Figure 2). An accelerated seismic release has been also later observed in April-May 2018 (about 10% of the total number of analyzed earthquakes).
The 2016–2018 seismicity vs time highlights that four significant periods (Figure 2D), in terms of number of earthquakes per day and seismic moment release, can be detected: 2016/08/24–2016/10/26, 2016/10/26-/10/30, 2016/10/30–2017/01/17 and 2017/01/18–2018/12/31, hereinafter called periods 1–4.
During period-1 (green circles), after the occurrence of EQ1, aftershocks migrated bilaterally. The study area (inset in Figures 1D, 2A) was not affected by seismicity (Figures 2A,B,D,E). For two months, the intense seismic activity (Figure 2D) remained confined between Mt Gorzano and the southern segment of VBF (Vettoretto-Redentore segment in Brozzetti et al. (2019)). After the occurrence of EQ2, the seismicity migrated to the northern segment of the VBF system and mainly concentrated in between Norcia and Pievebovigliana towns for about 30 km (Figure 2A). As shown in Figures 2B,E, only after EQ2, the Pievebovigliana sector became involved in the seismic sequence (period-2, orange circles). The major event (MW4.1) of this period occurred on 2016/10/27 in the southern part of the study area (focal mechanism n°1 in Figure 2C) and produced the first increase of the cumulative moment release (red curve in Figure 2E). The number of events per day was over 200 (Figure 2E), about one third of the total events (Figure 2D), with a noteworthy increase of seismicity with respect to the seismic activity that had previously characterized the study area (maximum number of events per day = 10, Supplementary Figure S1 - lower inset). After EQ3 (MW6.5), the VBF system was involved for about 65 km (period-3, yellow circles). During period 3, the study area was affected by more than 100 events/day and the seismicity extended to about 4 km north and west to Pievebovigliana (Figure 2B). This period was characterized by a significant increase of seismic moment release (red line in Figure 2E) with the occurrence of five earthquakes with MW≥3.9 (yellow beachballs in Figure 2C), never observed before the 2016 Norcia seismic sequence. In fact, in the instrumental period (1985–2016) the Pievebovigliana sector was mainly struck by earthquakes with ML≤3.5 (Supplementary Figure S1). The major event of the period-3 had a magnitude of MW4.8 and occurred on November 1, 2016. During the period-2 and -3, the study area was uniformly affected by aftershocks and the map distribution of earthquakes well correlate with the average trend highlighted by focal solutions (average focal mechanism in the inset of Figure 2C).
On January 18, 2017, period-4 began with the occurrence of EQ4 that involved the southern portion of Gorzano fault. The increase of seismic activity of the study area started on 2017/01/27, 9 days after the occurrence of EQ4 (Figure 2A). The number of events/day and cumulative seismic moment release highlight two main sub-periods, some minor peaks (black arrows in Figure 2E) and the average number of earthquakes that remained ten times over the one observed before the occurrence of the Norcia seismic sequence. It is very interesting to note that, in this phase, the seismicity was characterized by additional westward and northward migration from Pievebovigliana. During the sub-Period-4/2, the seismicity was mainly concentrated in the study area (compare Figures 2D,E). The most significant earthquake (MW4.6) of this period occurred on April 10, 2018 during the sub-period 4/2 (Figure 2E). This event represents the last significant increase in term of moment release.
All the focal mechanisms (TDMT solutions in Scognamiglio et al., 2006) in Figure 2C, show normal-normal oblique sense of motion with a SW-NE trending T axis, apart from a strike-slip cluster of small events MW≤3.5 located between Cupi and Fiastra with T axis compatible with the average one (inset in Figure 2C).
Morphometric parameters derived by terrain analysis can be used to address different topics (see Wilson and Gallant., 2000 for a review). Among the primary topographic attributes, the profile curvature (second derivative of the elevation raster) indicates vigor of surface processes including flow acceleration/deceleration, aggradation/degradation processes, erosion/deposition rates (Zevenbergen and Thorne, 1987; Moore et al., 1991; Dietrich, et al., 2003; Hilley, et al., 2010) or can help in quantifying the spatial distribution of morphological features (scarps, linear valleys, oversteepened stream channels) able to provide details on complex fault zone deformation (DeLong et al., 2010). Analogously, we exploited this derivative to address a tectonic topic and to search for potential fault scarps (relative to other lithologically controlled slope breaks).
Given the successful results of using HRT data in assessing active tectonics topics (Hilley and Arrowsmith, 2008; Arrowsmith and Zielke, 2009; Zielke, et al., 2012; Langridge et al., 2014; Ferrater et al., 2015; Zielke, et al., 2015; Civico et al., 2016; Cirillo, 2020; Bello et al., 2021), we computed this derivative starting from the HRT data available in the 10m-px resolution Digital Elevation Model (hereinafter DEM) by Tarquini et al. (2007a). This DEM derives from the homogenization of heterogeneous vector datasets (elevation contour lines from technical cartography, airborne laser-scanner altimetry data, sparse GPS data) available for the Italian territory. Thus, it is particularly useful to investigate wide areas with relatively high accuracy (for details about the data processing and vertical accuracy we relate the reader to Tarquini et al. (2007b), Tarquini et al. (2012)).
Using the DEM, we tested in advance the effectiveness of the profile curvature metric in a key area represented by the sector belonging to the western slope of the Mt Vettore (Figures 1D, 3A–C) where the fault is topographically well exposed and has been newly (and recently) mapped following EQ1 and EQ2 (see sect. Introduction). Then, to help in directing our field survey around the PBF, we applied the methodology in the study area (Figures 1D and 4) where the increment of the seismic activity has been observed during period-4 (Figure 2E).
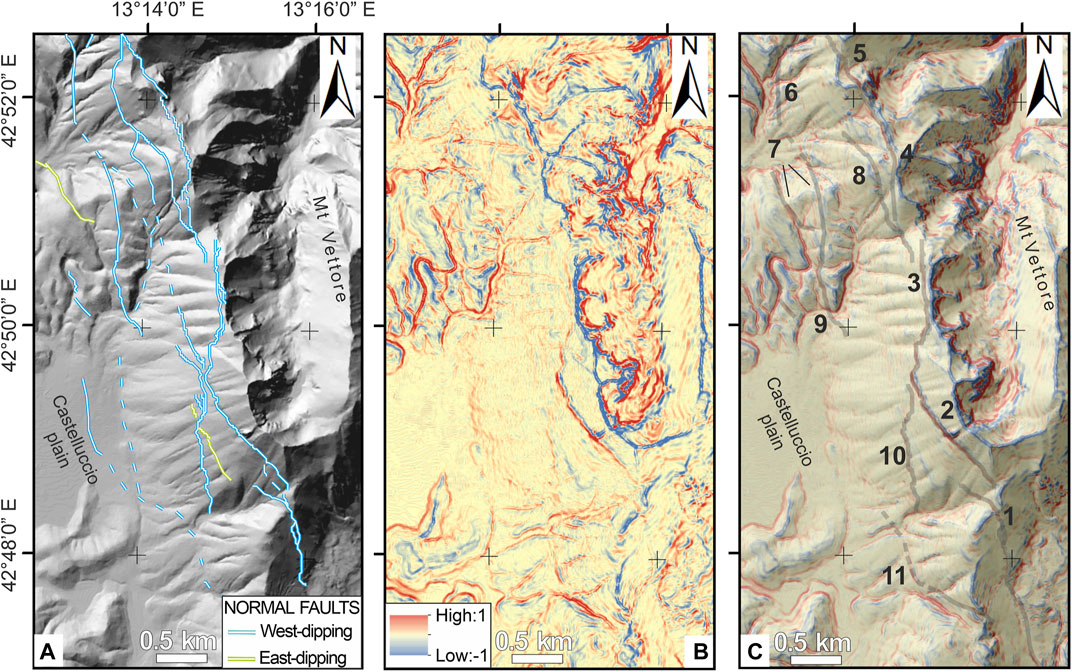
FIGURE 3. Mt Vettore western slope (inset a in Figure 1B) with topographic curvature analysis and comparison of results with the late-Quaternary active normal faults known for the sector. (A) hillshade from the 10 m-px resolution Digital Elevation Model of the area (Tarquini et al., 2007a) with superposition of the west- and east-dipping normal faults outcropping along the Mt Vettore western slope (from Brozzetti et al., 2019). Numbers refer to fault segments that match with the tectonic lineaments as inferred by the curvature analysis (panel (B)) and reported in panel (C). (B) Profile curvature map (derivative computed parallel to the slope) with positive (red) and negative (blue) values corresponding to concave and convex features in the landscape, respectively (C) match between the inferred tectonic lineaments from the curvature analysis (transparent light gray) and the fault segments reported in (A). Numbers correspond to the points discussed in the text.
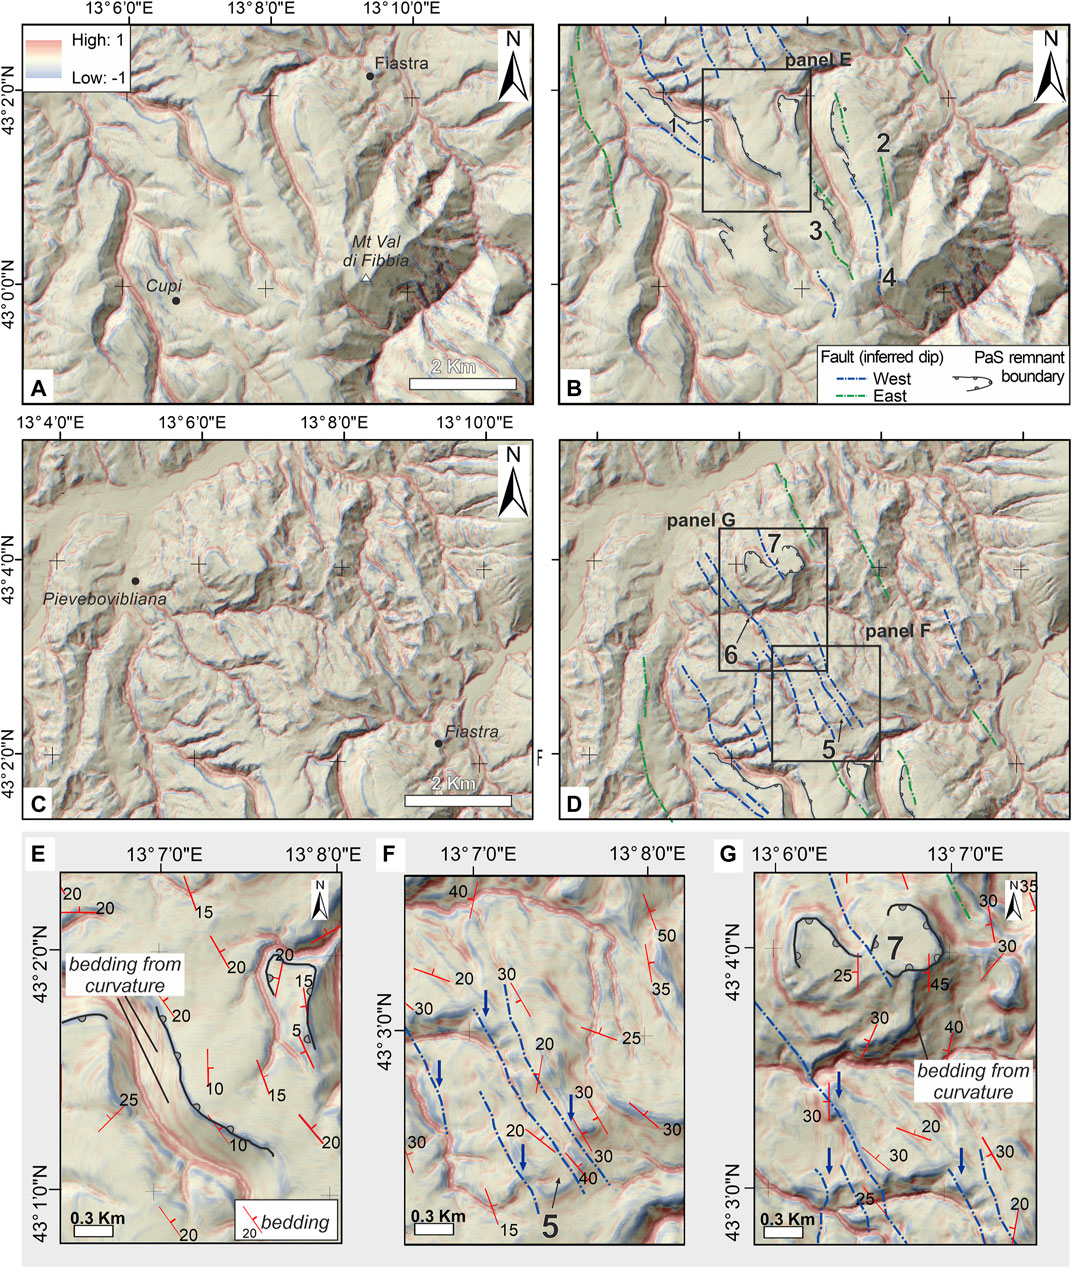
FIGURE 4. Results of the curvature analysis in the study areas discussed in the text (insets b and c in Figure 1B) with interpreted lineaments and key criteria used in interpreting the maps. (A) Profile curvature map in the Cupi-Mt Val di Fibbia sector. (B) Profile curvature map (same as in A) with the overlapping interpreted lineaments. (C) Profile curvature map in the Pievebovigliana-Fiastra. (D) Profile curvature map (same as in (C)) with overlapping interpreted lineaments. Numbers 1 to 7 refer to the lineaments discussed in the text. (E) Detail on the palaeosurface remnant (PaS) as inferred by the (negative) curvature values defining a surface boundary cutting the stratigraphy (see positive–red–pseudo-linear curvature values coinciding with the bedding. (F,G) Details on the breaks of rock bedding suggesting possible tectonic lineaments. Note in (G) also the offset of a flat surface similar to PaS (point 7).
We also combined the derivative approach with slope- and aspect derivative analysis to point out offsets in geomorphic markers. In fact, evidence of a major planation surface (PaS hereinafter), younger than late Lower Pliocene and likely developed during climatic conditions favourable to areal erosion, has been reported across the Italian peninsula (Coltorti and Pieruccini, 2000 and references therein). In central Italy (with reference to the study area) this low-energy ‘summit surface’ stands mostly on calcareous reliefs, often cuts the stratigraphy and gently dips toward E-NE. In addition, besides being deformed by limited thrust re-activation, it has been displaced by high-angle normal faults since the Lower Pleistocene (Ciccacci et al., 1985; Dramis, 1992; Calamita et al., 1999). We pointed out remnants of PaS, and their displacement (Figure 5 and Supplementary Figure S2), and described a morphotectonic setting consistent with the late Quaternary extensional tectonics affecting the whole sector.
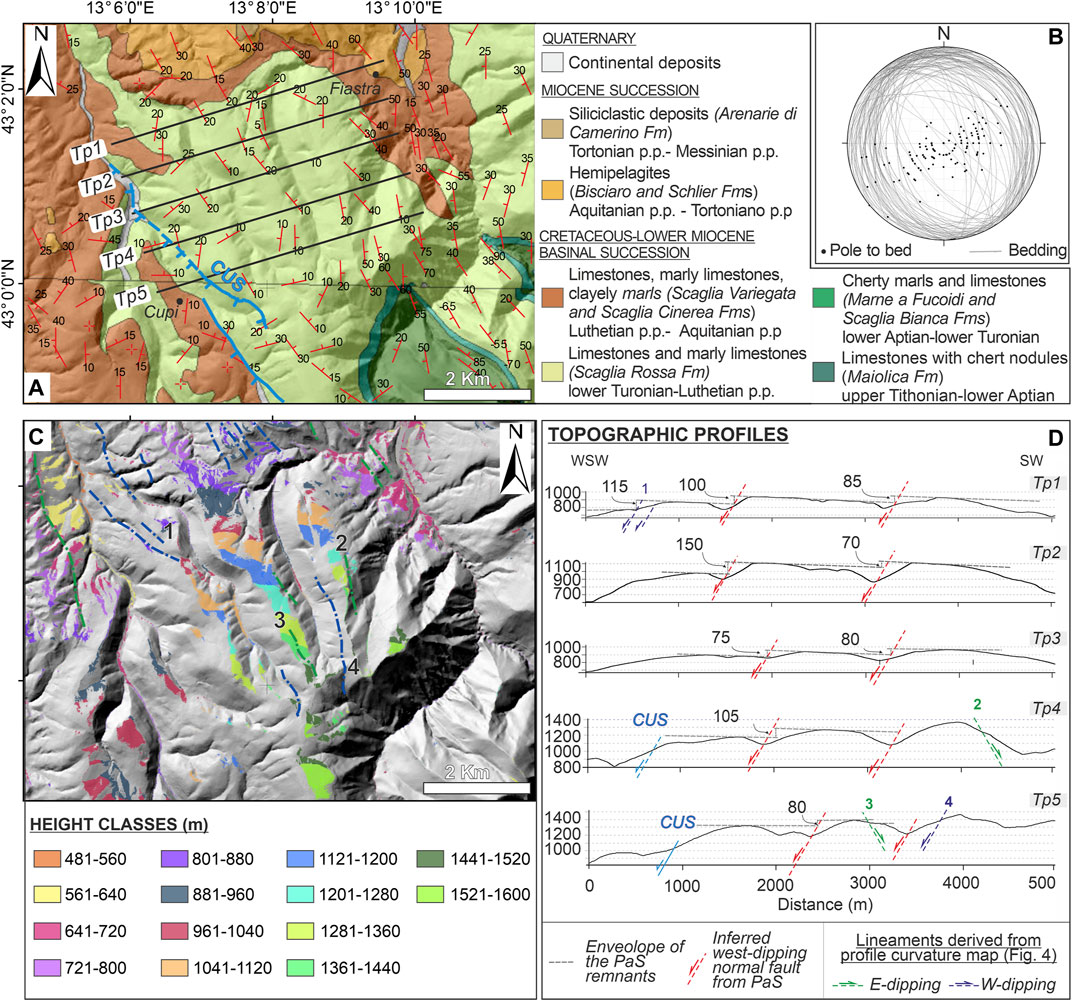
FIGURE 5. Morphometric- and morphotectonic analysis of the Cupi-Mt Val di Fibbia sector (inset b in Figure 1B). (A) Geological map of the sector with the main outcropping stratigraphic units as derived from the Carta Geologica d’Italia at scale 1:100,000 (Regio Ufficio Geologico, 1941; Servizio Geologico d’Italia, 1967). The profile traces from 1 to 5 refer to the topographic profiles (Tp1 to Tp5) shown in the panel (D). (B) Lower-hemisphere Schmidt projection of the bedding as reported for the sector, with poles. (C) Map the of height-classes showing colour-coded elevation ranges computed combining slope- and aspect derivative analysis (see text for detail). (D) Topographic profiles (along the traces in panel (A)) showing the top of the paleosurface remnants (PaS) and their lowering toward the south-west. Black numbers refer to the possible vertical offsets (in meters) of the morphological marker. Bold colored numbers refer to the interpreted lineaments from the curvature analysis as in Figure 4B. CUS = Cupi-Ussita sections of the VBF (as in Brozzetti et al., 2019).
We integrated the evidence gathered with the previous approaches with field survey (Figure 6) and we merged all the results into four new geological cross-sections (Figure 7) drawn starting from more detailed geological maps (1:25,000 and 1:40,000, from Barchi et al. (2012) and Pierantoni et al. (2013), respectively). We used them to relate the surface evidence of possible fault activity with the long-term deformation retraced for the area.
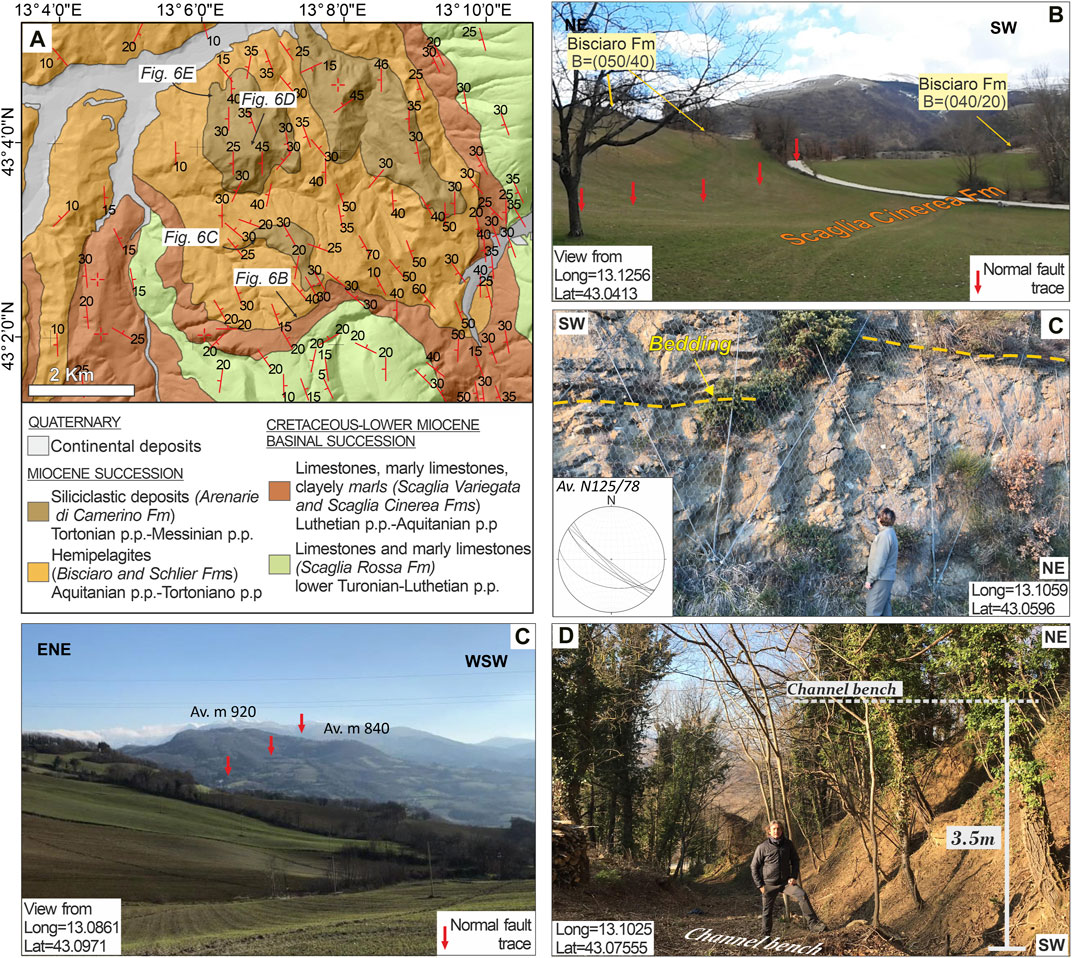
FIGURE 6. Field survey and evidence of normal faulting collected in the Pievebovigliana-Fiastra sector (inset c in Figure 1B). (A) Geological map of the sector with the main outcropping stratigraphic units as derived from Carta Geologica d’Italia at scale 1:100,000 (Regio Ufficio Geologico, 1941; Servizio Geologico d’Italia, 1967). Labels point to the photographs shown in panels (B–E). (B) Evidence of normal faulting showing the offset toward the south-west of the Bisciaro formation. (C) Meso-faults affecting the Arenarie di Camerino Fm causing discontinuities of the layers and juxtaposing intervals characterized by different sandstone/pelite ratio. (D) Lowering to SW (view from NNW) of the flat surface standing on the Arenarie di Camerino Fm (see details in the text). (E) Metric offset affecting channel-bordering benches. The location in longitude and latitude (projection WGS84/UTM 33N) is also reported for each outcrop. Notice the absence of the new-surveyed fault evidence in the available map from the literature–(A)).
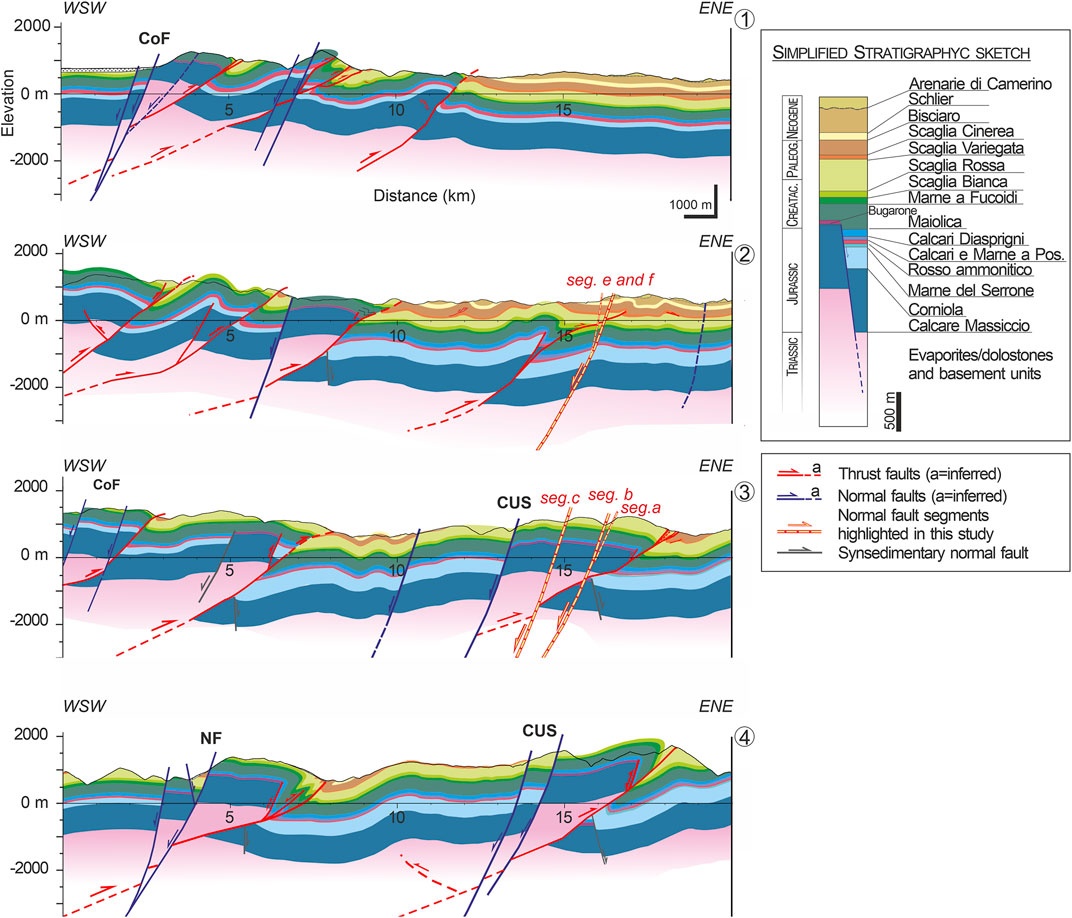
FIGURE 7. New interpretative geological cross-section across the study area (traces in Figure 1B). drawn starting from published geological maps (1:25,000 and 1:40,000, from Barchi et al. (2012) and Pierantoni et al. (2013), respectively) and integrated with the evidence of faulting highlighted in this study. Segments (seg) are labeled as in Figure 9A.
Seismological validation of fault activity is crucial to point out earthquake/fault association (Plesch et al., 2007; Lavecchia et al., 2012; Valoroso et al., 2013; Hubbard et al., 2016; Walters et al., 2018) or to undoubtedly constraint the existence of buried/unknown seismic sources when no coseismic surface displacements occur (Govoni et al., 2014; Lavecchia et al., 2012; Lavecchia et al., 2017). Hence, we compared the structural and geological 2D features pointed out along the four cross-sections with the in-depth distribution of relocalized seismicity (Figure 8) made available in Chiaraluce et al. (2017). To this aim, we exploited the Move suite software by Petex-Petroleum Expert Ltd. (vers. 2019.1). We attempted to build a 3D block model associating the surface- and in-depth evidence of faulting deriving from the earthquake hypocentral distributions. A summary of the evidence pointed out with the different approaches and supporting the PBF existence and activity (at the surface and depth) is reported in Figure 9A and Table 1.
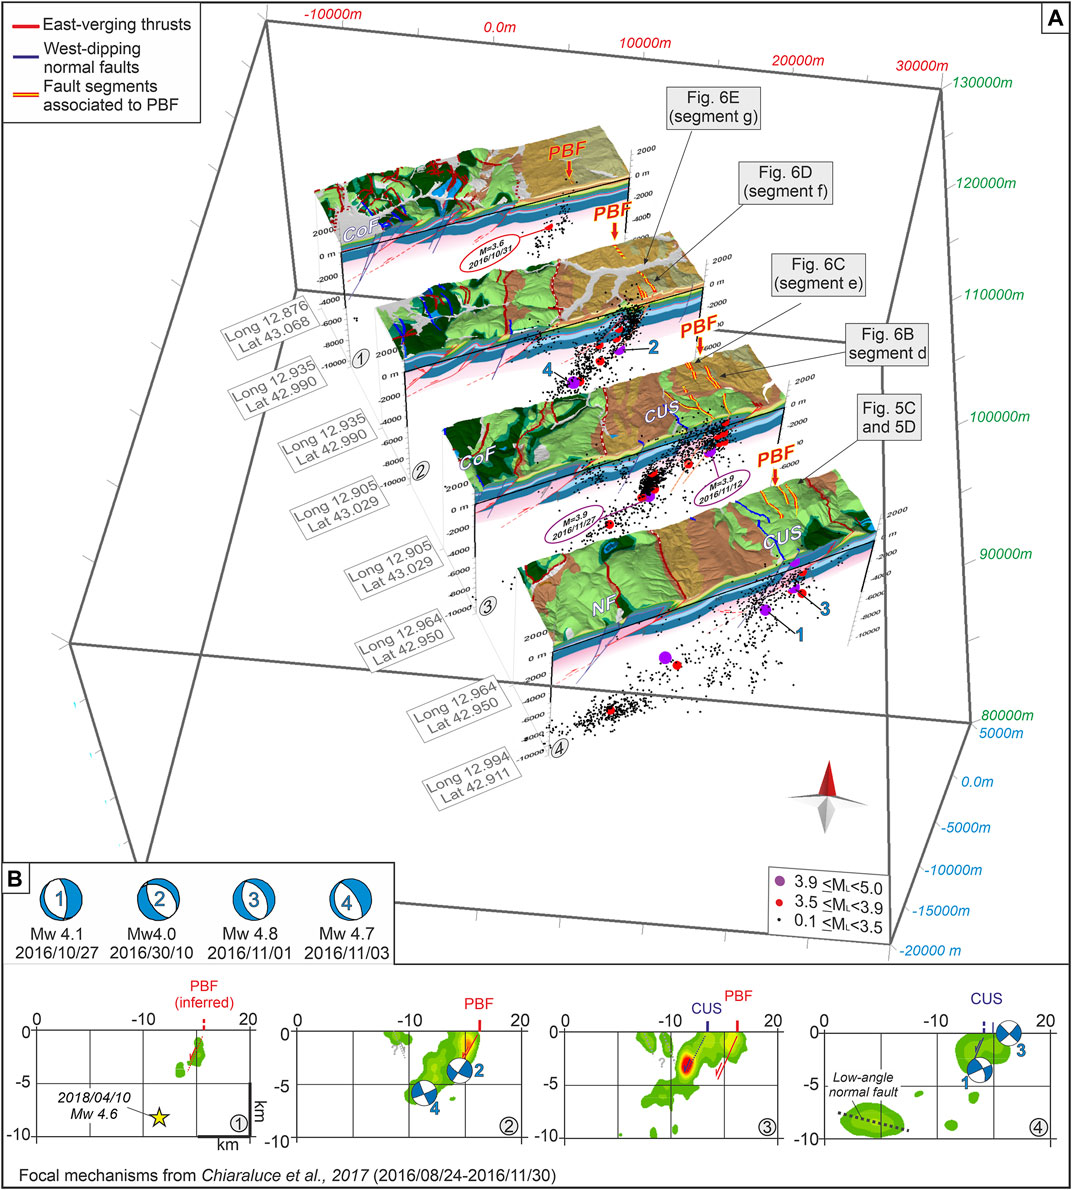
FIGURE 8. Block-diagram of earthquake/fault association and density contours of the seismicity along the cross-sections (1–4, traces in Figure 1B) drawn for the investigated area (hypocenters are from Chiaraluce et al. (2017)). (A) 3D block model showing the main stratigraphic units (at the surface) and the hypocentral distribution of the seismicity within a half-width of 2.5 km along the cross-sections reported in Figure 7. Stratigraphic information coming from the maps at different scales (see text for details) has been synthesized. Fault key as in Figure 1C. The normal fault segments highlighted in this study and ascribed to the Pievebovigliana fault (PBF) are presented and compared with the in-depth distribution of the most energetic events falling in the sector (the data frame reference system is WGS84/UTM 33N). (B) density contours along cross-sections 1 to 4 showing the seismicity density around the PBF and CUS (Cupi-Ussita sections of the VBF, as in Brozzetti et al. (2019)). The focal mechanisms with Mw≥3.9 falling within the considered buffer have been also projected. The hypocenter of the April 10, 2018 event (yellow stars) is from Scognamiglio et al. (2006). Numbers are the same as in Figure 2C.
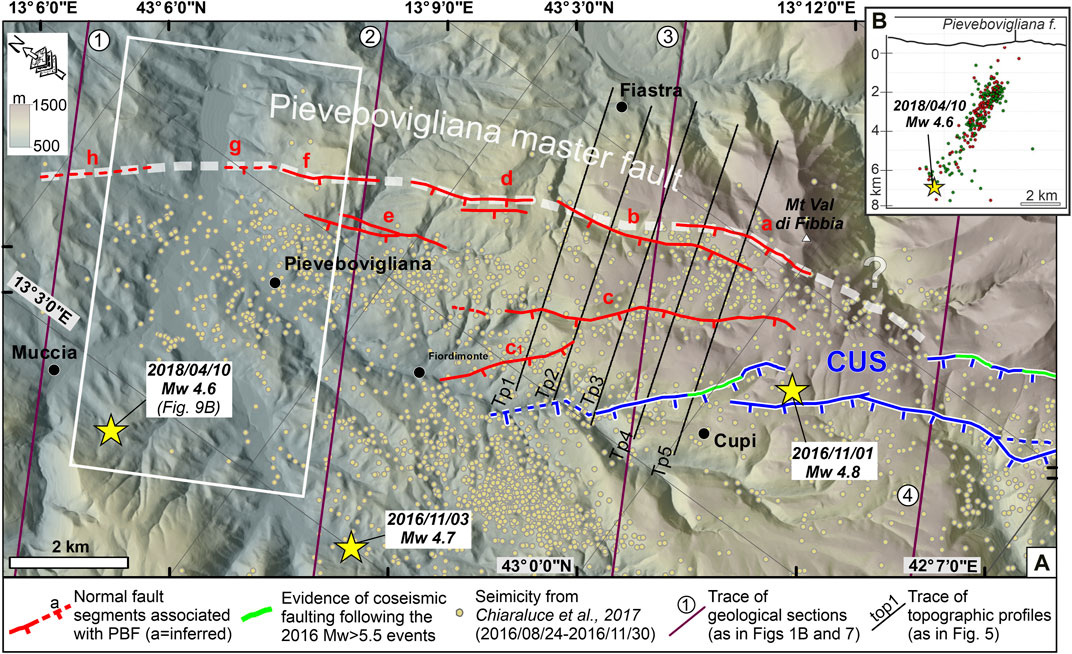
FIGURE 9. Summary of the geological and morphotectonic evidence of the PBF with detail on its association with the main earthquakes that occurred in the sector. (A) Map (DEM overlaying the hillshade) with the normal fault segments (a to h) highlighted in this study and ascribed to the Pievebovigliana master fault (PBF–dashed gray line) activity. Evidence related to each segment is reported in Table 1. Possible (soft) linkage (question mark label) of the PBF with the CUS (Cupi-Ussita section of the VBF, as in Brozzetti et al. (2019)) is discussed in the text. The epicentral distribution of the seismicity (from Chiaraluce et al. (2017)), as well as the most energetic events (yellow stars) falling in the sector and occurred in the period 2016–2018 (Mw≥4.5 from Scognamiglio et al. (2006)), have been also projected on the map. (B) Early aftershock hypocenters for events with ML≥1.0 from high-quality automatic relocations of the 2016–2017 Central Italy seismic sequence (Michele et al., 2020), located within the boundary of the white rectangle in map view (see text for details). Key: Green and red hypocenters are the first 72 h after the 26 October (MW5.9) and 30 October (MW6.5) major events, respectively.
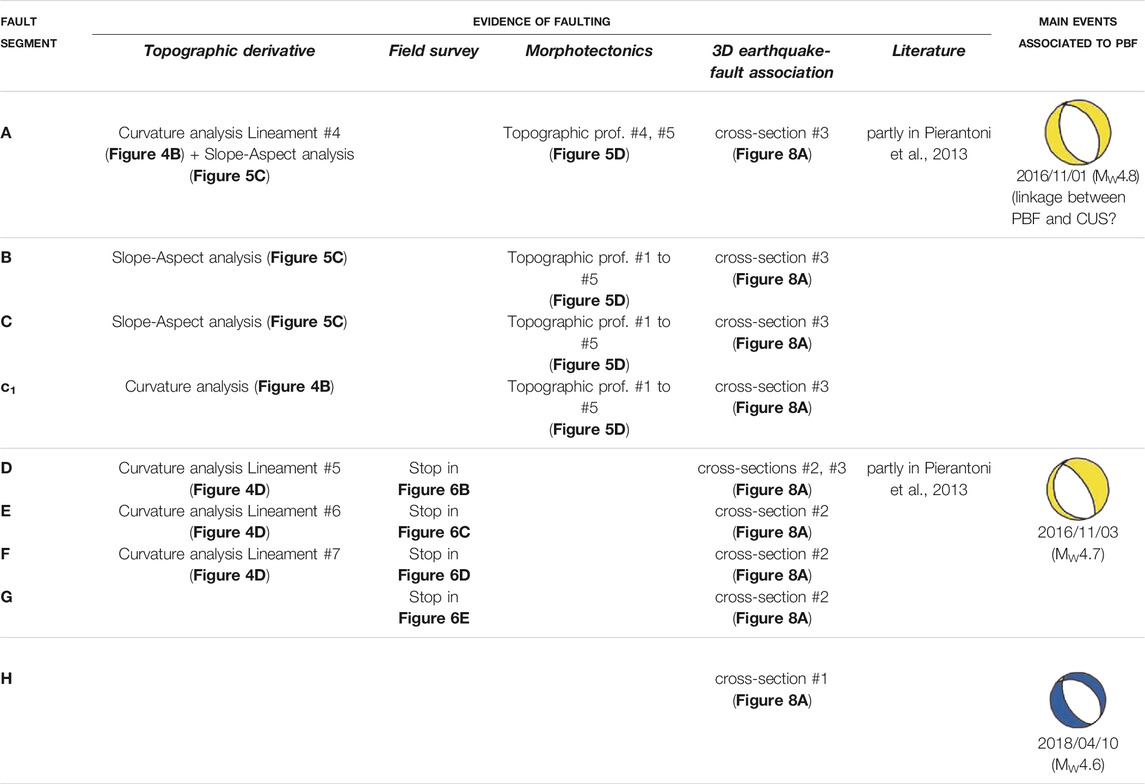
TABLE 1. synoptic table summarizing the evidence collected along different segments associated with the PBF, according to the different approaches discussed in the text and previous hints from the literature. The focal mechanisms of the main events (MW≥4.5, from Scognamiglio et al. (2006)) possibly associated with the different segments are also reported. The color of the focal mechanism relates to the periods (seismicity vs time) shown in Figure 2 (yellow and blue – periods 3 and 4, respectively).
Finally, we performed Coulomb stress-transfer calculations (King et al., 1994; Stein et al., 1997) to test the favourable orientation of the PBF with respect to the stress redistribution induced by EQ1, EQ2, EQ3. We first computed Coulomb stress changes on optimally oriented normal faults, starting from EQ1-3 variable slip fault source models (Chiaraluce et al., 2017), along the cross-sections corresponding to the geological profiles and detected volumes undergoing increasing Coulomb stress. Then, we computed the stress induced on the reconstructed PBF model, both analyzing the contribution of the single seismic source and then the cumulative one. To these aims, we used the Coulomb 3.4 code (Lin and Stein 2004; Toda et al., 2005) considering as receiver source the ‘true’ fault geometry with variable trend of PBF and subdividing the fault with rectangular patches following the methodology proposed in Mildon et al., 2017 (Figures 10, 11 and Supplementary Figures S3–S9).
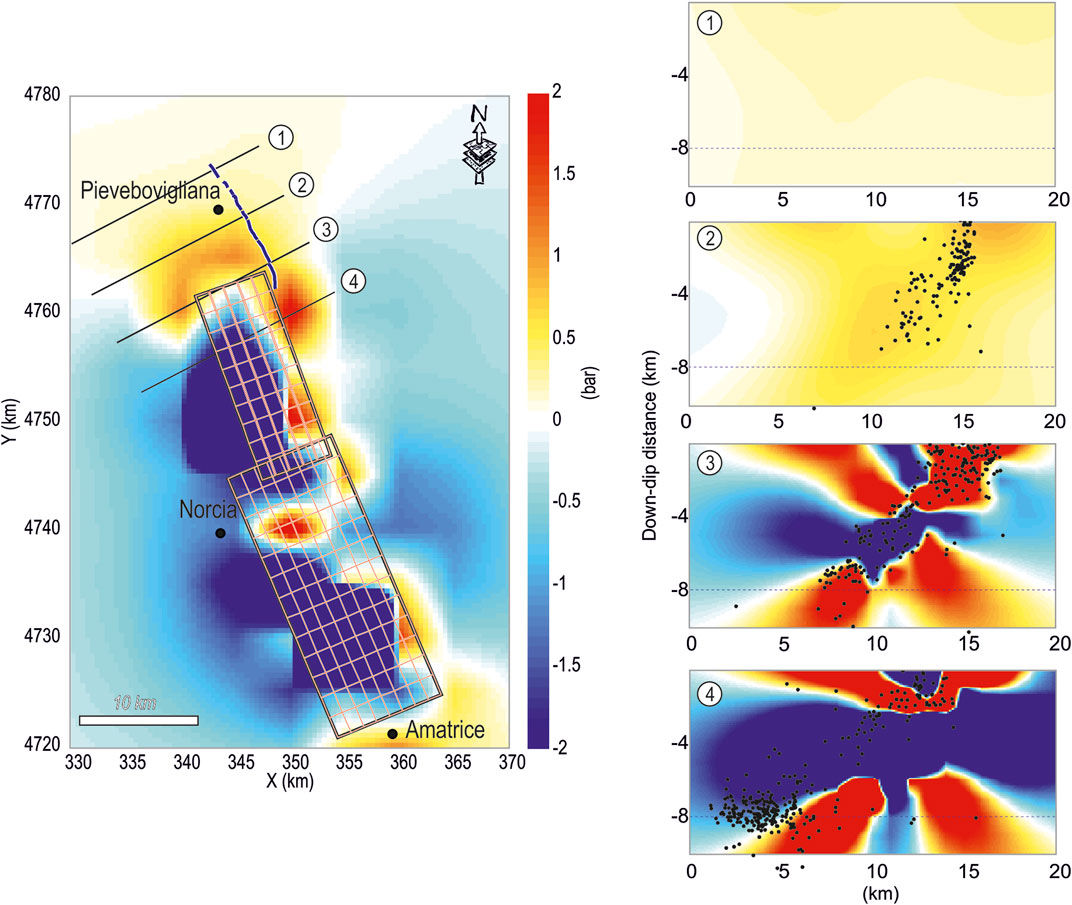
FIGURE 10. Map and cross-sections of Coulomb stress changes (see color bar), induced by EQ1 and EQ2, on a generic plane compatible with the main fault alignment, computed with heterogeneous slip models (Chiaraluce et al., 2017) at a depth of 8 km and along the geological cross-sections. On the map, the black rectangles represent the modeled fault planes and the red ones the sub-faults. The numbers 1–4 refer to geological cross-sections. The blue line on the map represents the fault trace of the reconstructed Pievebovigliana fault. The black dots along the cross-sections are the locations of aftershocks computed by Chiaraluce et al. (2017) occurring from 2016/08/24 to 2016/10/30 and projected on the cross-sections considering a half-width of 2.5 km.
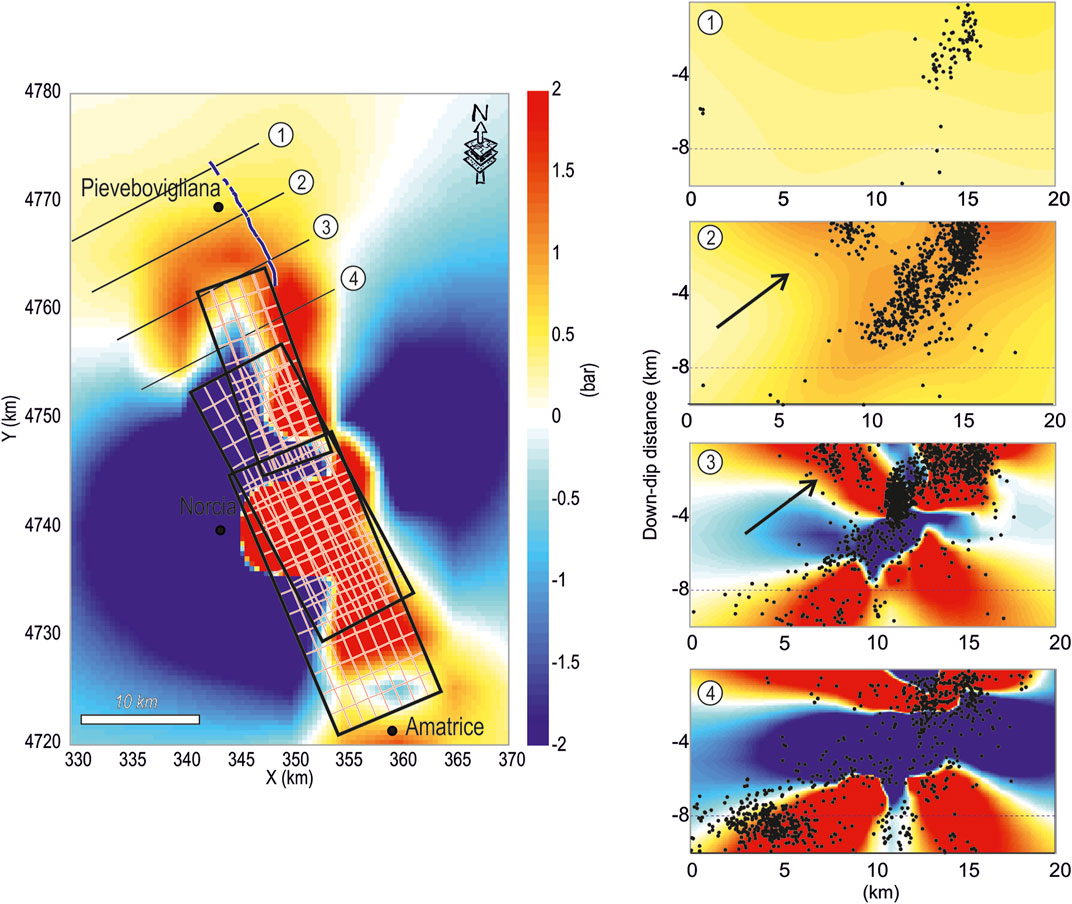
FIGURE 11. Map and cross-sections of cumulative Coulomb stress changes, imparted by EQ1, EQ2 and EQ3, on a generic plane compatible with the main fault alignment, computed with heterogeneous slip models (Chiaraluce et al., 2017) at a depth of 8 km and along the geological cross-sections. On the map, the black rectangles represent the modeled fault planes and the red ones the sub-faults. The number 1–4 refer to geological cross-sections. The blue line on the map represents the fault trace of the reconstructed Pievebovigliana fault. The black arrows indicate the volume into which seismicity migrated during April-May 2018. The black dots along the cross-sections are the locations of aftershocks computed by Chiaraluce et al. (2017) occurring from 2016/08/24 to 2016/11/30 and projected on the cross-sections considering a half-width of 2.5 km.
We tested the effectiveness of the topographic derivative first along the western slope of the Mt Vettore fault system (inset a in Figure 1D) where we explored the coherence between the curvature values with (already) mapped fault segments. In this study, we used those reported in Brozzetti et al. (2019). The workflow includes the following steps:
1) Apply a low-pass filter on DEM, to remove roughness in the surface (and/or local anthropic artifacts). We used the Focal Statistics tool and a Rectangular cell (50×50m) Neighborhood–Mean statistic setting;
2) Compute the Profile Curvature on the raster resulting from the first step. We used the Curvature tool and produced the resulting Profile Curvature map. To increase the ability to see differences in values throughout the dataset, we also applied a color map stretch (minimum-maximum) considering that in moderately steep mountainous areas the curvature values vary between -1 (upward convexity) and +1 (upward concavity) (blue and red values, respectively, in Figure 3B).
3) Combine the hillshade of the DEM with the profile curvature map (according to Kennelly, 2008), to enhance the continuity of naturally occurring tonal breaks (Figure 3C). Because the profile curvature is computed parallel to the slope (thus indicating the direction of maximum slope) a negative value corresponds to surface upwardly convex (at a cell) while a positive value indicates that the surface is upwardly concave; a value of zero indicates that a surface is planar. We interpreted the presence of faults on the curvature map pointing at:
− coupled pseudo-linear alignments of maximum- and minimum values. These would correspond to concave and convex edges (on the hanging- and footwall blocks, respectively) located at the intersection between an outcropping fault plane and the slope;
− breaks in the alignments of minimum- or maximum values that could correspond to offsets of mountain crests, geomorphic features, strata bedding, etc.
The interpreted lineaments are reported in Figure 3C. For ease of understanding, we refer to each fault segment to its number (from n°1 to 11)
Following the test along the Mt Vettore fault, we computed a curvature map also in the sector immediately ahead of the VBF northern tip, i.e., between the Pievebovigliana village and the Mt Val di Fibbia area (insets b and c in Figures 1D, 4A–D), where the seismicity did not correlate to any relevant discontinuity. We applied the same methodology and we interpreted the map according to the following criteria:
− comparing continuous (well evident) pseudo-linear tonal edges with the rock bedding and lithological boundaries as reported in available maps at scale 1:100,000 (Regio Ufficio Geologico, 1941; Servizio Geologico d’Italia, 1967) and 1:25,000 (Pierantoni et al., 2013), to ease the distinction between the latter and possible tectonic lineaments (Figure 4E–G);
− identifying pseudo-linear tonal edges corresponding to the rock bedding, boundaries of geomorphic markers, mountain crests, and looking for breaks in the signal (Figures 4E–G).
We mapped lineaments (1–7 in Figures 4B,D,F,G) and we also provided a preliminary dip direction of the inferred faults exploiting, locally, the ArcMap ‘Profile Graph’ tool to indicate the inferred raised and lowered blocks. Based on the trend and dip of the VBF system, our first attempt was to highlight possible W-dipping normal faults (NW-SE striking) considering the prevailing geometry of the active fault system in the epicentral area. Nevertheless, the existence of possible antithetic (E-dipping) structures was not ruled out from our map interpretation.
In the sector between the Cupi village and Mt Val di Fibbia (inset b in Figure 1D), resistant rock types crop out and flat surfaces on top of the Meso-Cenozoic carbonates appear to be offset (Figure 5A). The only mapped structural element is represented by the north-western tip of the VBF (Cupi-Ussita fault section–CUS in Brozzetti et al. (2019)) which affects partially the carbonates, and only toward the west.
According to the prevalent dip of the normal fault system responsible for the entire seismic sequence, we investigated the role that west-dipping (unmapped) normal faults may have in displacing possible PaS remnants in the sector. We integrated the previous analysis with the computation of combined slope and aspect maps to enhance the morphostructural setting. We computed the derivatives (in ArcMap environment) according to the following steps:
1) slope map - to isolate (flat) sub-areas dipping less than 15°;
2) aspect map - to isolate sub-areas dipping from NW to ENE (from N335° to N65°); the quadrants were chosen to take into account for the inherited dip of PaS and the possible effect of normal faulting on the morphostructural surfaces set over the general dome structure observable in the sector (see the strata bedding and their poles in Figure 5B);
3) we required that the computed raster had to satisfy both the conditions (steps 1 and 2);
4) we associated again (via ‘Extract by Value’ tool from the DEM) the heights to the final raster;
5) we color-coded the different height-classes to highlight discontinuities and/or shifts in the strips (Figure 5C).
Moreover, we drew five NE-SW oriented topographic profiles (labels Tp1 to Tp5 in Figure 1D). The profiles were drawn perpendicularly to the trend of the neighbor VBF system assuming, by analogy, that faults active in the late Quaternary should form within the same stress field acting along the central Italy extensional alignment. We computed a possible vertical offset (Figure 5C) and discuss them also by the light of the stratigraphic setting of the limestones.
A new geological field survey at scale 1:10,000 was carried out in the sectors neighboring the village of Pievebovigliana and the Mt Val di Fibbia (see insets b, c in Figure 1D). The survey was directed in the area where most of the interpreted lineaments concentrated and where topographic anomalies suggested the possible interference of active tectonic structures with the landscape evolution. The survey allowed us to differentiate between possible tectonic- or lithologic control on the curvature value outcomes.
We compared the survey outcomes with the long-term deformation reconstructed for the sector. In this perspective, we drew four 20 km-long interpretative geological cross-sections along transects perpendicular (N60°E) to the trend of the main tectonic structures (traces in Figure 1D, n°1 to 4). The cross-sections were drawn starting from available geological maps at scale 1:40,000 (Pierantoni et al., 2013) and 1:25,000 (Barchi et al., 2012). Where the coverage was not attempted by the previous cartography, available maps at scale 1:100,000 (Regio Ufficio Geologico, 1941; Servizio Geologico d’Italia, 1967) were used. Evidence of normal faulting as deduced from the previous approaches were also incorporated into the new geological cross-sections (Figure 7). For the in-depth interpretation of the cross-sections, we relied on the deformation style proposed in specific papers on the topic (Lavecchia, 1985; Barchi, 1991; Barchi et al., 1998; Lavecchia et al., 2016).
To validate the seismogenic nature of the PBF and to find evidence of an association between the PBF fault (at the surface) and the seismicity (at depth) during the evolution of the seismic sequence, we examined the relocated earthquake dataset available in Chiaraluce et al. (2017). We investigated the in depth-distribution of the hypocenters available for the study area in the time interval 2016/08/24–2016/11/30 and we compared the seismicity clustering with the collected geological and geomorphological evidence. We performed the analysis collecting the events with depth 10 km, within a half-width of 2.5 km starting from four transects (coinciding with the geological cross-sections reported in Figure 7) and moving northwestward. We imported all the layers (e.g., surface geology, geological cross-sections and earthquakes) in the Move Suite (see sect. Methods and Materials) to compare the data in a 3D environment (see the 3D block model in Figure 8).
We investigate the location and geometry of the highest stress changes within the study area and assess if they were compatible with the PBF activation, computing the stress transfer induced by the largest subsequent earthquakes of Norcia 2016 seismic sequence EQ1, EQ2 and EQ3 on the study area. EQ4 was not considered because the interactions acting on volumes are proportional to the rupture dimension (e.g., Hardebeck et al., 1998). Hence, EQ4 being the least energetic (MW5.5) and the most distant event with respect to the study area, we considered the possible interaction negligible. The imparted stress was computed both considering the single events and their cumulative effects. We used the Coulomb code 3.4 (Lin and Stein 2004; Toda et al., 2005) and we analyzed the results considering the stress changes along a specific plane having the main geometric characteristic of the Mt Vettore-Gorzano fault System (method 1- M1), inserting into the calculations the influence of the regional stress (method 2- M2), and projecting the stress changes on the reconstructed PBF (method 3- M3).
To achieve our aims, we considered the EQ1, EQ2 and EQ3 source models, with variable slip, proposed by Chiaraluce et al. (2017), and a friction coefficient (μ) of 0.4 generally reported in the literature (Sibson, 2000) and previously used for central-southern Apennines studies (Troise et al., 1998; De Natale et al., 2011).
In M1, we choose to project stress changes on generical receiver faults having a 156° strike, 50° dip and –90° rake, that is the average geometry of the main active fault alignments constrained from the EQ1–3 source models (Chiaraluce et al., 2017).
To compute the stress imparted on the surrounding crust volume with optimally oriented stress calculations (M2) we considered the background regional stress field evaluated for central Italy by Ferrarini et al. (2015) (σ1 = 292/85, σ2 = 139/04, σ3 = 048/02).
We iteratively ran the stress changes considering the temporal evolution of seismic sequence and comparing, in map and cross-sections, the redistribution of stress after each significant event Specifically, the map and cross-sections represent the maximum value of Coulomb stress changes over the considered depth range (0–10 km, with an incremental step of 1 km). Figures 10, 11 show the map of cumulative stress changes (EQ1-EQ2 and EQ1-EQ3 respectively), computed at 8 km of depth, based on the hypocentral depth of the EQ1 and EQ2 main events, and the related in-depth sections spaced 5 km, distributed along the study area in correspondence of the four geological ones.
We overlaid to such stress cross-sections the aftershock locations made available in Chiaraluce et al. (2017) to verify the correspondence between the occurrence of earthquakes and the positive Coulomb stress lobes. In the Supplementary Figures S3–S9 are reported all the maps and related cross-sections obtained considering the consecutive occurrence of EQ1–3 and the single events.
We, then, focus on the stress imparted on Pievebovigliana geological structure defining a 3D fault model. To this aim, we used the Mildon et al. (2017) code, which allows variable strike faults, and we used the results obtained combining geological and seismological data (field data, geomorphological analysis, seismicity depth distribution and focal mechanisms). We used the same parameters of the previous calculations) and ran several tests varying the dip of receiver source model (50°–60°) and analyzed the stress imparted on PBF by the single-source models and by their cumulative effects. Figure 12 and the Supplementary Figure S9 synthesize the obtained results.
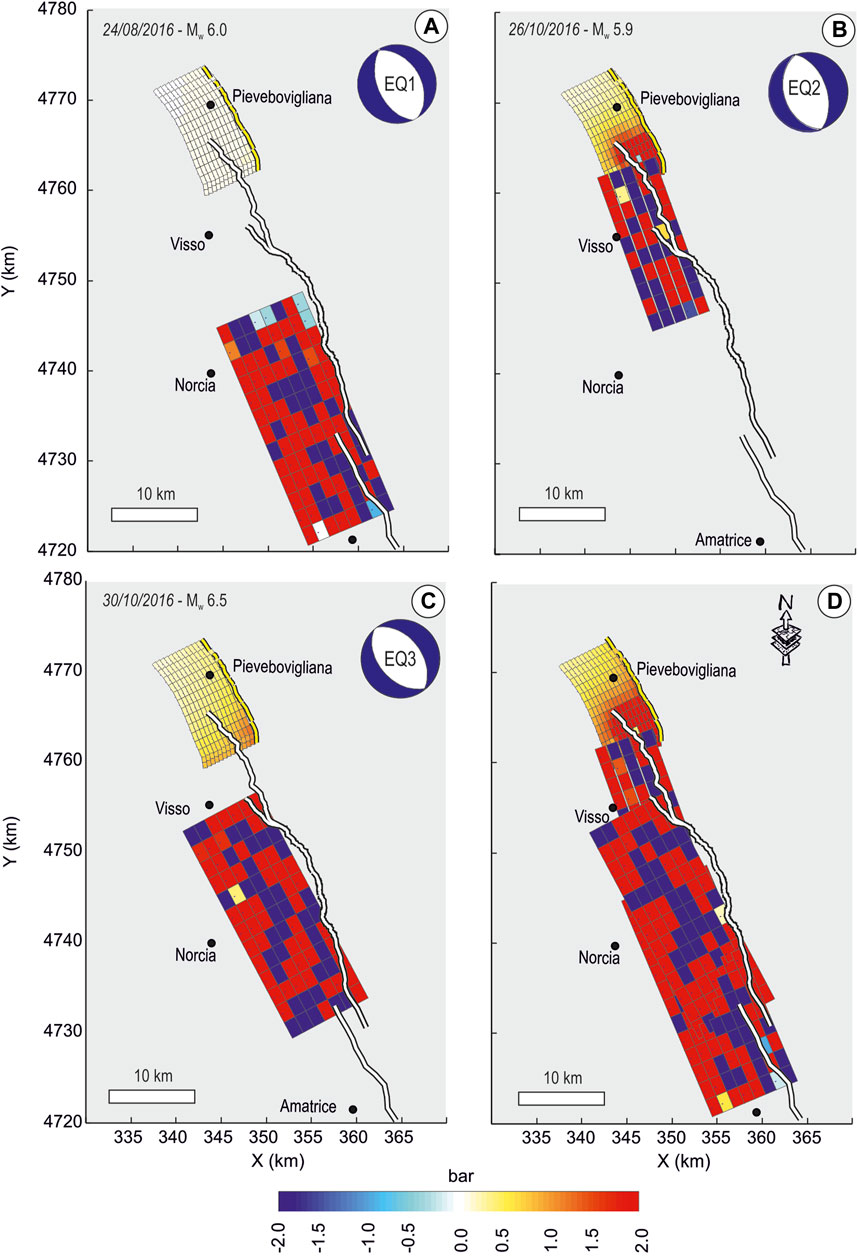
FIGURE 12. Coulomb stress transfer on Pievebovigliana (PBF) fault induced by the occurrence of the main events of the Norcia seismic sequence EQ1, EQ2, EQ3. Source parameters and the distribution of variable slip are from Chiaraluce et al. (2017). The yellow and white lines represent the traces of Gorzano-Vettore-Pievebovigliana fault systems. (A) EQ1 seismic source vs PBF (B) EQ2 seismic source on PBF (C) EQ3 on PBF (D) Cumulative stress transfer induced by EQ1–3 on PBF.
Along the western slope of the Mt Vettore fault system (Figures 1, 3), the analysis of the curvature derivative successfully identified most of the active faults recently mapped in the literature. With the exclusion of the mountain topographic crests, the comparison between the fault segments reported in Figure 3A and the curvature value distribution pointed out that most of the outcropping fault traces correspond to (Figure 3B):
- intermediate curvature values between two pseudo-linear- and coupled maximum (red) and minimum (blue) ones. These latter have been found related to the concave and convex shapes (on the hanging- and footwall blocks, respectively) resulting from the intersection of the outcropping fault plane and the slope. Evident examples (transparent gray lines in Figure 3C) relate to the points n°2, 4 and 9;
- breaks in the minimum (blue) values (points n°1, the northern tip of the n°5, 6, 7 and 8), related to the fault offset affecting locally the pseudo-linear ridges of the mountain crests;
- breaks in the maximum (red) values widely outcropping in the sector even if with a weak “derivative signal” (points n°3, 10 and 11). These latter have been found related to fault planes often located along the mountain slopes and bearing slope deposits on the hanging wall blocks; and/or in the Castelluccio plain, thus often totally buried (see for detail the geological map provided in Figure 4 Brozzetti et al. (2019)). Most of the fault segments belonging to the VBF system with a length >1.5–2 km showed a good match with the anomalies observed in the profile curvature map. The results supported the effectiveness of this DEM derivative as a useful tool at least in the perspective to direct field survey where no other information is available from the literature background.
In the sector between Cupi and Mt Val di Fibbia (inset b in Figure 1D), the curvature higher (red) values define the fluvial network. Mountain crests, strata top’s edges with different strength or erodibility, and the borders of the morphostructural surfaces are indeed represented by the lowest values (blue). In a few cases, their interruption was useful to address the existence of tectonic lineaments. We observed the clear interruption of these features along the segments reported in Figure 4B (n°1–4) (blue and green are west- and east-dipping inferred normal faults, respectively).
Pseudo-linear negative curvature values are evident in the central part of the sector where they bound the Upper Cretaceous-Eocene limestones along with morphologically flat surfaces, cut by NW-SE trending valleys (Figures 4A, 5A). In addition, the different height-class strips reported on the map in Figure 5C depict the presence of the surfaces (see in detail the classes between 1440 and 960 m) which gently dip (<15°) from NNW to NE, according to the dome structure observed in the sector (Figure 5B). The height-class strips also result in a lateral offset.
The surfaces as depicted above cut the stratigraphy as the general dip of the Scaglia Rossa Fm is 10°–20°, and prevailingly toward E-NE (see in Figure 4E the bedding from the literature and from the positive (red) pseudo-linear curvature values). Following the remarks reported in Coltorti and Pieruccini, 2000, we ascribe these observed flat surfaces to the PaS remnants.
The topographic profiles (Tp1 to Tp5 in Figure 5D) highlight as the blocks of limestones (over which PaS remnants stand) appear lowered toward the southwest and the PaS morphotectonic setting has also obvious evidence in the field (Supplementary Figure S2). The offsets, computed measuring the vertical displacement affecting the surface envelopes, are estimated between 70 and 150 m (Figure 5D). This evidence also accounts for the (apparent) lateral offset of the height-class strips (Figure 5C), the latter coherent with normal faulting (planes dipping toward southwest) overprinting the geomorphic markers.
The profiles also confirm for some of the interpreted lineaments (n°1 to 4 in Figures 4B, 5D) the topographic offset, according to the east- and west-dipping inferred normal faulting. In particular, segment n°4 corresponds to the normal fault that puts in contact the Meso-Cenozoic marls with the older limestones (Scaglia Cinerea and Scaglia Rossa Fm in Perantoni et al., 2013).
We have to remark that most of the relevant displacements (and the related lineaments potentially affecting the planation surface remnants) have not been detected by the curvature analysis. We infer that the west-dipping normal fault segments (dashed red lines in Figure 5D) responsible for the surface lowering locate in the bottom valleys (under the slope debris), in-between the carbonatic blocks. Thus, possible curvature signals have been superimposed by the positive values related to the fluvial network. The topographic profiles confirm this hypothesis.
We advance that these fault segments represent part of the long-term localized deformation related to a major fault, hereinafter the Pievebovigliana fault (PBF) (Figure 9A and Table 1), whose evidence has been found also north-west (see next section).
Between the villages of Pievebovigliana and Fiastra (inset c in Figure 1D) the curvature analysis highlighted anomalies mainly corresponding to interruptions of the strata tops’ edges (blue arrows in Figures 4E–G). The relevant part of the lineaments was preliminarily interpreted as possible west-dipping normal faults (Figures 4C,D).
We also found interesting matches in the field between our interpretation and evidence of normal faulting along some of them (labeled n°5 to 7 in Figure 4D). All the evidence were located within the Miocene hemipelagic sequences and siliciclastic deposits (Figure 6A).
In the south of the sector (location on the picture in Figure 6B), we observed within a general NE-dipping succession anomalous contacts between the Scaglia Cinerea Fm and the Bisciaro Fm that have a general NE-dipping (15°–40°) bedding attitude. The contacts well agree with the interpreted lineaments on the curvature map (n°5 in Figure 4D) and also coincide with the location of small normal fault segments already reported in Pierantoni et al. (2013).
Hints of normal faulting, at the mesoscale, have been observed within the Arenarie di Camerino Fm (location on the picture in Figure 6C). Here, the normal fault sense of motion has been inferred from the south-westward offset of layers having a different sandstone/pelite ratio achieved by high angle planes (see lower left stereographic plot). The average fault attitude is N125/78 and field observation agrees with the lineaments interpreted on the curvature map (n°6 in Figure 4D).
In correspondence to the stop of the picture in Figure 6D a flat morphology (again within the Arenarie di Camerino Fm) is lowered to SW of ∼80 m (view from NNW). Even if no evident fault planes have been observed in the field, the bedding attitude (30°–40° dip toward NW) supports the tectonic nature of the offset. The difference in height of this surface, similarly to the PaS remnants observed in the ‘Cupi-Mt Val di Fibbia’ sector, can be ascribed in our opinion to the activity of a SW-dipping normal fault whose location, in the field, coincides with the interpreted lineament n°7 in the curvature map (Figure 4D and detail in Figure 4G).
Finally, in the stop shown in Figure 6E, suspicious metric offset (∼3.5 m) in channel-bordering benches have been observed. Here, the derivative analysis did not highlight anomalies in the topography, the maximum values corresponding with the stream channel bed. Nevertheless, we remark that the scale of the feature is lower than the DEM px-resolution. In addition, this evidence in the field (even if weak) aligns with the offset discussed in the previous stop (Figures 6D, 9A) and is consistent with the fault prosecution to the north as derived from the 3D spatial distribution of the seismicity (see next section).
In the interpretative geological cross-sections (Figure 7), it is possible to recognize the different deformation phases related to both the Neogene and Quaternary tectonics.
The pre-Quaternary deformation is overall recognizable in the compressional structures rooted in the Upper Triassic evaporites (see subsect. Structural-Geological Setting) and in the deeper basement (Lavecchia et al., 1988; Coward et al., 1999; Speranza and Chiappini, 2002; Porreca et al., 2018). They deform mostly the basinal succession giving rise to both cylindrical- and box anticlines, the latter localized in correspondence to the main thrust planes.
The Plio-Quaternary change of the tectonic regime is evident from the superposition of the normal faults which offset the pre-existing structures and led to the formation of the intra-mountain basins. Along the geological cross-sections, the Quaternary extensional system is recognizable (from SW to NE) in the Colfiorito (CoF, cross-sections n°1 and n°3), Norcia (NF in cross-sections n°4) and Cupi-Ussita (CUS) faults (cross-sections n°3 and n°4). The latter bears the northernmost evidence of coseismic displacements (Figure 9A, according to Brozzetti et al., 2019).
We also introduced the evidence of the PBF normal faulting as we deduced from the field survey and morphotectonic analysis. Our findings suggest that the deformation does not manifest at the surface as a single lineament but, rather, as distributed segments evident in the field as far as to the Pievebovigliana village (segments a to g Figure 9A and Table 1).
In fact, the earthquake-fault association along cross-section n°1 suggest the activation of a structure up to a depth of ∼5 km (Figure 8A), even where no surface evidence was observed. The source was illuminated starting from October 26 and the subsequent seismic activity, in the time window covered by the catalog (up to November 30, 2016) well aligned, also in map view, with the PBF strike and its suggested position (Figures 2A, 9A). No significant events fall within the buffer of cross-section n°1 (only one ML3.6 event on October 31, 2016, Figure 8A) and considering the time window explored. Nevertheless, if we also project the most energetic event (April 10, 2018, MW4.6) reported in Scognamiglio et al. (2006) (star in Figure 9A and Table 1) which felt in the study area and the buffer of the cross-section (see also Figures 1C,D, 2A) we could infer its association with the PBF at depth (Figure 8) and in correspondence of the inferred segment h, at the surface. For this reason, we suggest that the seismicity projected along cross-section n°1 intercepts the PBF northwestern tip.
Along cross-section n°2, we reported the evidence from stops discussed in sects. 4.2.2 (Figure 6B,E) while, along the section n°3, we considered the offsets affecting PaS remnants (see subsection Sector ‘Cupi-Mt Val Di Fibbia’ and Figures 5C,D). The deformation we depicted at the surface, along these cross-sections, found also confirmation in the 3D analysis of the hypocenter distribution (Figure 8). The seismicity projected shows clustering in correspondence of the PBF along both cross-sections n°2 and n°3.
In detail, along cross-sections n°2, the seismicity illuminates the suggested fault plane up to ∼7 km depth. The October 30 MW4.0 earthquake (event 2 in Figures 8A,B) locates along the PBF down-dip prolongation crossing the cross-section (segments d, e, f, g in Figure 9A and Table 1), while the November 3 (MW4.7) locates at greater depth (event 4 in Figure 8, star in Figure 9 and Table 1). This event could be associated to a deeper PBF patch (Figure 8B), even considering the low (24°) dip angle of the west-dipping plane, or being the result of the activation (at the PBF hanging wall) of minor discontinuities (e.g., ENE-dipping faults) whose existence and attitude are suggested also along the adjacent section n°3. The activation of antithetic structures in the study area has been recently highlighted also by the dataset Michele et al., 2020 (provided in Spallarossa et al. (2021)) and elsewhere in the epicentral area of the Norcia 2016 seismic sequence. Even if not outcropping, they have been associated also with energetic events (e.g., August 24, 2016, MW5.4), at the hanging wall of the VBF system (Porreca et al., 2018).
Along cross-section n°3, two clusters of hypocentres are evident in the first 5 km depth: the easternmost ones coincide with the segments associated to the PBF (b, c, d in Figure 9A), and the other with the CUS. Both PBF and CUS host M3.9 events (e.g., November 12 and 27) (Figures 2C, 8A). Most of the seismicity clusters around the CUS even if several M>3.5 earthquakes fall around the PBF. Minor antithetic discontinuities are also illuminated by the contours (Figure 8B) as well as an ENE-dipping low-angle (∼15°) plane possibly coinciding with a regional low-angle normal fault (see Chiaraluce, et al., 2017 and references therein).
Finally, along cross-section n°4, some scattered seismicity is observable around the CUS. Two moderately energetic events are reported (October 27 MW4.4 earthquake (event 1) and the November 1 MW4.8 one (event 3) (Figure 8, stars in Figure 9 and Table 1). Nevertheless, the location of the event 1 does not fit well the fault plane position and the event 3 has a very shallow location (Figures 8B), tentatively associable with the CUS inner splay (Figures 8, 9A) or suggesting possible linkage (at depth) of the PBF with CUS. In this sector, we did not find other evidence of normal faulting aside from an anomalous syncline at the hanging wall of the thrust T3. The back-limb fold reconstructed from the strata attitudes (Figure 7) could be explained with an ‘incipient’ (and/or distributed deformation) lowering of the PBF hanging wall, along the fault south-eastern tip. On the other side, the scattered seismicity located east of the CUS, including some M>3.5 earthquakes at a depth between 2 and 3 km, could be related to minor discontinuities activated during the sequence. We are not able to discriminate among these different hypotheses and we associated the southern tip of localized deformation to the last evidence found along segment a (Figure 9A and Table 1).
Considering all the collected results and imaging a single master structure responsible for observed distributed deformation, we propose as reliable geometry for the PBF that of at least ∼13 km-long master normal fault which strikes ∼ N155°E, dips SW and is arranged in right-lateral en echelon setting with respect to the VBF system (blue line in Figures 9, 10).
The average west-dipping focal plane we computed in the study area, where the PBF strikes within (Figure 2A), has a dip of 43°. On the other side, the fault attitude measurements reported in Figure 6C show an average dip of 78°. Besides, data collected in the surroundings of the CUS (Testa et al., 2019) show average dip of 65° while all along the central- and southern sections of VBF the structural data in Brozzetti et al., 2019 highlighted average dip values from 65° to 71° (associated to long-term- and coseismic planes, respectively). Considering the heterogeneity of the data source we used a PBF theoretical dip value of 60° to model this fault as input data for the Coulomb stress computation.
The model calculations of the elastic stress change generated by EQ1 suggest that the stress imparted on the study area is negligible (<0.1 bar; see map and cross-sections 1–4, Supplementary Figures S3, S4). This result is also consistent with the lack of seismicity in the area during the period-1 (Figure 2).
On the contrary, the occurrence of EQ2 was important for the redistribution of stress. The largest Coulomb stress changes along a generic receiver fault (M1, subsect. Coulomb Stress Change) identify a well-defined volume of stress changes in the area where the PBF has been suggested (Figure 10). Along the cross-sections 2 to 4, it is possible to identify positive maximum Coulomb stress changes (0.5 bar) greater than the minimum (0.1 bar) commonly required to contribute to the triggering process (Reasenberg and Simpson 1992; Hardebeck et al., 1998). This result is also confirmed by M2 analysis performed along optimally oriented normal faults (Supplementary Figure S5). The negative stress changes on the cross-sections 3-4 are probably due to the high slip values of the causative source EQ2 (see also Figure 12). Moreover, selecting the seismicity of the relocated dataset (Chiaraluce et al., 2017) in the time interval 2016/10/26–2016/10/30, we note the high correlation of the aftershocks and the volumes undergoing increasing Coulomb stress.
The cumulative Coulomb stress changes imparted by EQ1, EQ2, EQ3 are shown in Figure 11 (Supplementary Figure S6) and depict a similar pattern of positive and negative lobes although with higher stress magnitudes. Additionally investigating the contribution of each large event on stress redistribution and modeling only the EQ3 occurrence, it is possible to observe (Supplementary Figures S7, S8) that the resulting cross-sections show evenly distributed stress changes and it is not possible to identify well defined positive stress volumes (cross-section 4 apart). Hence, we can argue that absolute values stress changes induced by EQ3 are added to the previous one enhancing and minimally perturbing the stress pattern induced by EQ2. Overlaying the seismicity, it is possible to observe that a high percentage of events occur on positive stress changes (Hardebeck et al., 1998).
Moreover, comparing the cross-section of Figures 10, 11, it is interesting to point out the westward enhanced stress, along a volume antithetic to the main one (black arrows in the cross-sections 2-3 of Figure 11) where the seismicity migrated and accelerated seismic release was observed in April-May 2018 (period-4 in Figure 2).
The results of stress changes modeling induced by EQ1, EQ2, EQ3 on the reconstructed Pievebovigliana fault (Figure 12) are fully consistent with the ones obtained with M1 and M2. The analysis indicates that the positive stress changes were transferred to the active Pievebovigliana receiver fault, after EQ1-EQ3, with different levels. The EQ1 minimally perturbed the fault while EQ2 and EQ3 imparted significant stress values greater than 0.5 bar along the southern portion of the fault. EQ2 was the crucial event in favouring the activation of PBF. EQ3 induced high-stress values around the southern tip of the PBF, and this result is particularly important because the tips of faults are typically the weakest zones. The cumulative effect enhanced the positive stress perturbation and made PBF a good candidate to accommodate this stress as demonstrated by the significant occurrence of seismicity in the study area until the end of 2018.
Characterizing the seismic hazard of a region could represent a challenge when the location and geometry of the active faults are unknown. The study area investigated in this paper (Figure 1D) fits in this scenario. In fact, while the most energetic events of the Norcia 2016 seismic sequence (EQ1 and EQ3, and related aftershocks) nucleated along VBF and GF (whose associated seismic hazard have been longtime pointed out - Galadini and Galli, 2000), the northwestern tip of the active normal fault system has been illuminated only following one of the most energetic events, the October 26, 2016 (EQ2). Here, noticeable seismic activity was observed throughout the 2017 and 2018 (Figure 2) and no seismogenic source is reported in the literature, thus opening the question about the northward extent of the outer extensional fault alignment in central Italy (Figures 1C,D).
The multidisciplinary approach we exploited to address this question presents evidence, in the sector between the Mt Val di Fibbia and Pievebovigliana village (Figure 1D), of distributed normal faulting along a ∼2 km wide and (at least) 13 km-long deformation band. The deformation displays, at the surface, discrete segments giving rise to different types of evidence and markers in the landscape.
The analysis of the topographic profile curvature (Figure 4) had different results across the surveyed sectors, even within the same rock types. On one hand, the breaks in positive and negative values fit with many of the faults offsetting the south-western carbonate-rock slope and the crests falling in the test area of the Mt Vettore-Mt Bove (Figures 3B,C). On the other, in the Cupi-Mt Val di Fibbia sector (insets b in Figure 1B) they only highlighted a few small potential traces within the Meso-Cenozoic limestones (Figure 4B) and with no prevailing dip direction. Nonetheless, the negative values well defined the pseudo-linear border of PaS standing over the Scaglia Rossa Fm (Figures 5A,B). The integration of the curvature analysis with the map of height-classes (Figure 5C), the topographic profiles intercepting the morphological markers (Figure 5D), and their comparison with the general stratigraphic setting of the sector, suggest synthetic normal fault segments displacing PaS remnants toward the south-west. A prevailing west-dip along a distance of ∼4 km (segments a, b, c and c1 in Figure 9A and Table 1) is thus recognized in the sector.
The clues of deformation observed in the Cupi-Mt Val di Fibbia sector are consistent (in a north-westwardly direction) with those collected in the Pievebovigliana-Fiastra area (insets a in Figure 1B). Here, the curvature analysis (Figure 4D) highlighted hints of deformation along a prevailing set of (inferred) west-dipping fault planes. The field survey (Figures 6B–E) pointed out, along some of them, the existence of west-dipping lowering of stratigraphic- and morphological features along a distance of ∼5 km (segments d to g in Figure 9A and Table 1).
The long-term analysis of the deformation (Figure 7) and the earthquake-fault association confirmed not only the activation of some of the late Quaternary normal faults already known in the study area (i.e., the CUS) but also helped to confirm the existence of the new discontinuities whose evidence we collected in the field and/or inferred from the morphotectonic analysis. These discontinuities have been activated during the Norcia seismic sequence, in 2016 and beyond (Figures 2, 8) and were associated to some low-to-moderately energetic events, i.e., October 30, 2016 (MW4.0) and April 10, 2018 (MW4.6).
The PBF was involved in the seismic release since the early few hours after the nucleation of the 26 October (MW5.9) and 30 October (MW6.5) main events. In Figure 9B we show further detail on the down-dip distribution of high-quality seismic location for events with ML≥1.0 released in the early 72 h after each of the two events (location within the boundary of the white rectangle). The early aftershock data are extracted from a high-quality automatic catalog built on empirical criterion illustrated in Spallarossa et al., 2021. The events, located at the hanging-wall of the northern segment of the PBF depict a well clusterized hypocentral volume from about 8 km (at depth) to near surface, in correspondence with segments f, g, h. By this relocation, the hypocenter of the April 10, 2018 (MW4.6) aftershock (yellow star in map view and cross-section - Figure 9) is just located at the bottom of such a volume, opening to the hypothesis of a possible seismogenic role of the Pievebovigliana fault.
The distributed deformation we observed in the study area, at the surface and depth, is not uncommon in active tectonic contexts and has been observed elsewhere in the world, even associated with segments belonging to major active fault system (Arrowsmith and Zielke, 2009; Gold et al., 2013). In some cases, diffuse regions of deformation associated to an immature fault system (in an early stage of development) have been documented for energetic seismic sequences in different tectonic environments (Hino et al., 2009; Goldberg et al., 2020 and references therein).
The subtle evidence on the landscape of the PBF, the diffuse segmentation as well as the observed small (and not uniform) offset values affecting PaS (Figure 5D and Supplementary Figure S2) suggest that the PBF is an immature (incipient) structure. Its formation can be ascribed to a period as younger than the onset of the adjacent (and collinear) VBF and GF (Early and Middle-Late Pleistocene, respectively - Galadini and Galli 2003; Puliti et al., 2020 and references therein).
The absence of obvious fault scarps offsetting Quaternary deposits as well as of a developed Quaternary basin, at the fault hanging wall, could represent a counter-argument of the main statement of this work, i.e., the recognition of the PBF as a Late Quaternary active fault. Nevertheless, the presence of well-clustered seismicity (i.e., continuously for ∼13 km along the PBF) depicting a clear fault geometry at depth, represents one of the constraining factors in the identification and recognition of active structures in existing fault databases (e.g., Plesch et al., 2007; DISS Working Group, 2018).
In addition, similar geologic (and seismogenic) contexts are not uncommon along the Apennines extensional belt and even in areas adjacent to the investigated one. As an example, we mention the area locus of the April 3, 1998 MW5.1 earthquake, the latter being the last significant event in the 6-months-long Umbria–Marche 1997–98 seismic crisis (for a detailed analysis of this sequence we related the reader to Chiaraluce et al., 2003). The event and its aftershocks occurred in the area of Gualdo Tadino (light blue polygon n°3 in Figure 13B), where the absence of an outcropping normal fault, as well as of a Quaternary basin at the fault hanging wall, have been confirmed by recent, detailed geological mapping (Ciaccio et al., 2005 and reference therein). Nevertheless, the hypocentral location of the (MW5.1) mainshock and of the aftershocks, and the seismic reflection profile interpretation, support the existence of a (hidden) SW-dipping normal fault whose kinematics and seismogenic attitude is in agreement with the regional stress field active in the central-northern Apennines.
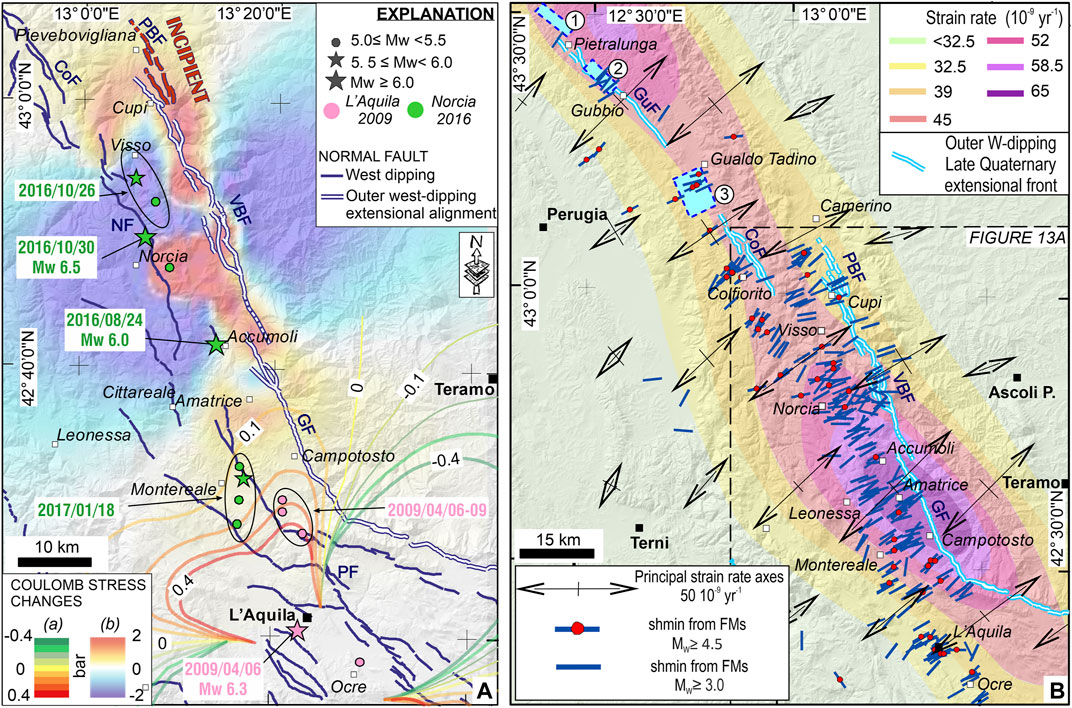
FIGURE 13. Tectonic sketch map and deformation field in central Italy showing the newly proposed Pievebovigliana (incipient) fault along the outer W-dipping Late Quaternary extensional front. (A) Tectonic sketch map reporting the Pievebovigliana (incipient) fault along the northward extent of the outer extensional alignment in the locus of the Norcia 2016 and L’Aquila 2009 seismic sequences. The events (M ≥5.0, from ISIDe Working group (2007)) related to the main seismic sequences striking the sector (i.e., the L’Aquila 2009 and Norcia 2016) are reported and compared with the distribution of the positive Coulomb stress changes as redrawn from (a) Falcucci et al., 2011 (see text for details) and computed in (b) this study (Figure 11). (B) Deformation field observable in central Italy and showing the velocity field from GPS data (black arrows) and the geodetic strain rate values as redrawn from Barani et al. (2017). In the map are also reported the Shmin (blue bars) trajectories from the focal mechanisms (FMs) of events (depth 12 km, MW≥ 3.0) occurred from 1981 to 2018 reported in RCMT (Pondrelli et al., 2006) and TDMT (Scognamiglio et al., 2006). Fault key: CoF = Colfiorito fault; GF = Gorzano fault; GuF = Gubbio fault; PBF = Pievebovigliana fault; VBF = Mt Vettore-Mt Bove fault.
Also, the seismicity analysis provided in Valoroso et al., 2017 and carried out starting from high-resolution earthquake catalog (TABOO seismic network - Chiaraluce et al., 2014), pointed out the existence of a (concealed) NE-dipping normal fault in the surroundings of Pietralunga (Figure 13B). The fault, neither associated with geomorphic markers on the landscape nor hosting Quaternary deposits at the hanging wall, was the locus of ∼four-years long seismic activity (light blue polygon n°1 in Figure 13B) in the period 2010–2014 and released a MW3.6 event on April 15, 2010 (Valoroso et al., 2017). In the neighbor area, similar (unknown) structures were illuminated by the hypocentres distribution during 2013–2014, at the footwall of the well-known W-dipping Gubbio normal fault (light blue polygon n°2 - in Figure 13B).
The above structures share analogies with the PBF, in terms of both structural location and seismogenic behavior. They locate along the (outcropping) outer W-dipping Quaternary extensional front in the central Apennines (Figure 13B), they nucleate often at the tip of well-known active faults and their existence has been advanced only by the onset of a seismic sequence. This evidence reconciles in our opinion with the subtle and distributed deformation we ascribe to the PBF. The duration of its activity has apparently not been sufficient for a coherent single fault or associated sedimentary basin to develop.
The ensemble of evidence pointed out can be explained by a newly identified master PBF which strikes for a total length of at least 13 km beyond the VBF north-western tip (Figures 9A, 13A). The PBF trend (∼N155°E) is similar to the adjacent active faults (VBF, GF) with which it is in a right-lateral en echelon setting.
The various approaches discussed in this work did not support a hard-linkage between the PBF and the VBF northwestern tip (CUS). We cannot exclude a priori soft-linkage. The easterly position of the most energetic earthquakes projected along the cross-sections (events n°3 and 4 in Figure 8) and the epicentral location of event n°3 (star in Figure 9A) could suggest such a hypothesis. In this case, the ∼13 km length estimated for the PBF could rise to ∼18 km, thus having important implications in terms of source dimension and expected magnitude. In fact, the surface rupture length (SRL) and the hypocentral depth of the April 10, 2018 MW4.6 event (Figures 8B, 9B) would be consistent with ∼MW6.0 (SRL = 13 km) to ∼ MW6.5 (SRL = 18 km) (Wells and Coppersmith, 1994). Even though the latter can be considered moderately energetic earthquakes they proved, in the Italian recent past, to be deadly and destructive (e.g., Molise 2002; ML5.4 - Di Luccio et al., 2005; L’Aquila 2009; MW6.3–Chiarabba et al., 2009; Emilia 2012, MW6.0 Govoni et al., 2014) as a consequence of the high vulnerability of the building heritage (Augenti et al., 2004; Ceci et al., 2010; Savoia et al., 2017). Consequently, even if during the period 2016–2018 the most energetic event nucleated on the PBF has been MW4.6, more energetic events cannot be ruled out.
The PBF, in fact, belongs to a sector of the Apennines extensional belt where both seismic and geodetic data agree in defining a homogeneous region characterized by a rate of deformation of approximately 40 nstrain/yr (Figure 13B- velocity field from GPS data and geodetic strain rates redrawn from Barani et al., 2017). The PBF fault trend and kinematics are consistent with the trend of the T-axes computed from focal mechanisms made available for the area, including those with MW≥4.5 (Figure 13B), the latter showing an active extension oriented normal to the Apennines chain axis (NE–SW). PBF is hence suitable for activation within the regional stress field (Ferrarini et al., 2015; Montone and Mariucci, 2016; Mariucci and Montone, 2020).
The Coulomb stress transfer computations support the previous inference. They agree, on the one hand, with the estimate of the modification in the stress field on the Mt Vettore fault, as proposed in Pino et al. (2019); on the other hand, they identify a well-defined volume following EQ2 and EQ3 compatible with the location and geometry of the PBF (map and cross-sections in Figures 10, 11).
Specifically, considering Pievebovigliana as receiver fault, the results highlighted an evident stress accumulation along its south-eastern tip (Figures 12, 13), providing a stress-transfer scenario common with other step-over fault settings, elsewhere in the world. In fact, as the fault step between the CUS and PBF (Figure 9A) is lower than the threshold (3–4 km) suggested to inhibit the earthquake rupture propagation Wesnousky, 2006), the discontinuities were able (already during the 2016–2018 seismic sequence) to enable the stress transfer northwards.
The step of the seismic activity along faults arranged in en echelon setting has been highlighted also during the most recent (and adjacent to the Norcia 2016) seismic sequence that occurred in central Italy, i.e., the L’Aquila 2009 (Lavecchia et al., 2011, 2012). Energetic events, soon after the mainshock, concentrated in areas of enhanced Coulomb stress (Falcucci et al., 2011, see Figure 13; De Natale et al., 2011), i.e. south-east of the Paganica fault (PF in Figure 13), in the Ocre area, and on the parallel GF. In the latter case, the seismicity stepped toward NE and several MW≥5.0 located along the GF southern strand from April 6 to April 9, 2009 (Figure 13, epicentres from ISIDe Working Group, 2007).
Analogously, for the Norcia 2016 seismic sequence, the Coulomb stress transfer computations (Figures 10, 11) highlight volumes of increased stress soon after the EQ1, toward the VBF and the Amatrice sector (Supplementary Figures S3, S4) and the GF. The Coulomb stress changes, induced by EQ1 and EQ2 (Supplementary Figure S5) highlighted the area locus of the ‘future’ October 30 MW6.5 mainshock as well as increased stress in the study area, between the villages of Cupi and Pievebovigliana. As even the GF northern strand has been already activated, on January 18, 2017, with four events with 5.0≤MW≤5.5, it cannot be excluded that the total stress accumulation (EQ1+EQ2+EQ3 - Figures 11, 13) on the distributed deformation ascribed to the PBF will induce a better localization along a plane capable of hosting larger-magnitude earthquakes (Manighetti et al., 2007; Thomas et al., 2013; Perrin et al., 2016).
Although the characterization of the PBF seismogenic potential needs additional investigations, even in the light of the different implications that hard-vs. soft-linkage (with the VBF) could entail, the multidisciplinary approach proposed in this study turned out successful in revealing the existence and the complexity of an immature fault zone.
Since the area surrounding the PBF has been seismically illuminated only following the Norcia 2016 seismic sequence, the fault is not reported in available databases of seismogenic/capable faults (DISS Working Group, 2018; ITHACA Working Group, 2019). Hence, our findings provide improvements in the knowledge of the seismotectonic setting of the area and emphasize the need to integrate multiple lines of investigations when addressing the identification and mapping of active faults. This being of practical importance to seismic hazard (in particular rupture hazard) analysis.
The original contributions presented in the study are included in the article/Supplementary Material, further inquiries can be directed to the corresponding author.
Written informed consent was obtained from the individual(s) for the publication of any potentially identifiable images or data included in this article.
FF conceived and wrote the draft of most of the manuscript and of the figures. RdN carried out the analysis of the seismicity and of the Coulomb stress, drafted the related cross-sections and figures. JRA critically revised the topographic-, morphometric- and morphotectonic analyses, and all the manuscript. FF and FB carried out the field survey in the key areas. FB and GL critically revised the structural-geological setting of the sector and the geological sections. DC contributed to the GIS (geological) database building and helped with the data management in the Move software environment. GL supervised the work plan. All authors participated in the editing of the manuscript and approved the submitted version.
This study has been financed by DiSPUTer- and G.d’Annunzio University research funds.
The authors declare that the research was conducted in the absence of any commercial or financial relationships that could be construed as a potential conflict of interest.
We wish to thank Editor YA and reviewers for their comments and suggestions which helped us to greatly improve the first version of the manuscript. The authors wish to thank “Petroleum Experts” which granted the license of Move suite software (version 2019.1).
The Supplementary Material for this article can be found online at: https://www.frontiersin.org/articles/10.3389/feart.2021.642243/full#supplementary-material
Adamoli, L., Calamita, F., and Pizzi, A. (2012). Note Illustrative del Foglio 349 “Gran Sasso” della Carta Geologica d’Italia alla scala 1: 50.000. Rome: ISPRA. Available at: https://www.isprambiente.gov.it/Media/carg/note_illustrative/349_Gran_Sasso.pdf
Allmendinger, R. W., Cardozo, N. C., and Fisher, D. (2012). Structural Geology Algorithms: Vectors and Tensors. Cambridge, England: Cambridge University Press, 289
Arrowsmith, J. R., and Zielke, O. (2009). Tectonic Geomorphology of the San Andreas Fault Zone from High Resolution Topography: An Example from the Cholame Segment. Geomorphology 113 (1-2), 70–81. doi:10.1016/j.geomorph.2009.01.002
Augenti, N., Cosenza, E., Dolce, M., Manfredi, G., Masi, A., and Samela, L. (2004). Performance of School Buildings during the 2002 Molise, Italy, Earthquake. Earthquake Spectra 20, 257–270. doi:10.1193/1.1769374
Barani, S., Mascandola, C., Serpelloni, E., Ferretti, G., Massa, M., and Spallarossa, D. (2017). Time-Space Evolution of Seismic Strain Release in the Area Shocked by the August 24-October 30 Central Italy Seismic Sequence. Pure Appl. Geophys. 174, 1875–1887. doi:10.1007/s00024-017-1547-5
Barchi, M. (1991). Integration of a Seismic Profile with Surface and Subsurface Geology in a Cross Section through the Umbria-Marche Apennines. Bollettino della Societa Geologica Italiana 110, 469–479.
Barchi, M. R., Boscherini, A., Collettini, C., Deiana, G., De Paola, N., and Mirabella, F. (2012). Geological Map of the Colfiorito Area (Umbria-Marche Apennines, Italy), Scale 1:25.000. Firenze: Litografia artistica Cartografica.
Barchi, M. R., De Feyter, A., Magnani, M. B., Minelli, G., Pialli, G., and Sotera, M. (1998). The Structural Style of the Umbria-Marche Fold and Thrust belt. Memorie della Societa Geologica Italiana 52, 557–578.
Bello, S., Scott, C. P., Ferrarini, F., Brozzetti, F., Brozzetti, F., Scott, T., and Cirillo, D. (2021). High-Resolution Surface Faulting From the 1983 Idaho Lost River Fault Mw6.9 Earthquake and Previous Events. Sci. Data. 8 68, 1–20. doi:10.1038/s41597-021-00838-6
Bignami, C., Valerio, E., Carminati, E., Doglioni, C., Tizzani, P., and Lanari, R. (2019). Volume Unbalance on the 2016 Amatrice - Norcia (Central Italy) Seismic Sequence and Insights on normal Fault Earthquake Mechanism. Sci. Rep. 9, 4250. doi:10.1038/s41598-019-40958-z
Blumetti, A. M., Dramis, F., and Michetti, A. M. (1993). Fault-generated Mountain Fronts in the central Apennines (Central Italy): Geomorphological Features and Seismotectonic Implications. Earth Surf. Process. Landforms 18 (3), 203–223. doi:10.1002/esp.3290180304
Boncio, P., Brozzetti, F., Ponziani, F., Barchi, M., Lavecchia, G., and Pialli, G. (1998). Seismicity and Extensional Tectonics in the Northern Umbria–Marche Apennines. Memorie della Società Geologica Italiana 52, 539–555.
Boncio, P., and Lavecchia, G. (2000). A Structural Model for Active Extension in Central Italy. J. Geodynamics 29 (3-5), 233–244. doi:10.1016/S0264-3707(99)00050-2
Boncio, P., Lavecchia, G., and Pace, B. (2004). Defining a Model of 3D Seismogenic Sources for Seismic Hazard Assessment Applications: The Case of central Apennines (Italy). J. Seismology 8 (3), 407–425. doi:10.1023/b:jose.0000038449.78801.05
Bonini, L., Basili, R., Burrato, P., Cannelli, V., Fracassi, U., and Maesano, F. E. (2019). Testing Different Tectonic Models for the Source of the Mw6.5, 30 October 2016, Norcia Earthquake (Central Italy): A Youthful Normal Fault, or Negative Inversion of an Old Thrust? Tectonics 38 (3), 990–1017. doi:10.1029/2018TC005185
Brozzetti, F., Boncio, P., Cirillo, D., Ferrarini, F., Nardis, R., and Testa, A. (2019). High‐Resolution Field Mapping and Analysis of the August-October 2016 Coseismic Surface Faulting (Central Italy Earthquakes): Slip Distribution, Parameterization, and Comparison with Global Earthquakes. Tectonics 38 (2), 417–439. doi:10.1029/2018TC005305
Brozzetti, F., and Lavecchia, G. (1994). Seismicity and Related Extensional Stress Field: the Case of the Norcia Seismic Zone (Central Italy). Ann. tectonicae 3, 36–57.
Brozzetti, F., Mondini, A. C., Pauselli, C., Mancinelli, P., Cirillo, D., and Guzzetti, F. (2020). Mainshock Anticipated by Intra-sequence Ground Deformations: Insights from Multiscale Field and SAR Interferometric Measurements. Geosciences 10 (5), 186. doi:10.3390/geosciences10050186
Calamita, F., Centamore, E., Chiocchini, U., Deiana, G., Micarelli, A., and Potetti, M. (1979). Analisi dell’evoluzione tettonicosidimentaria dei “bacini minori” del Miocene medio-superiore nell’Appennino umbro-marchigiano e laziale-abruzzese: 7) Il bacino di Camerino. Studi Geol. Camerti 5, 67–81.
Calamita, F., Coltorti, M., Farabollini, P., and Pizzi, A. (1994). Le faglie normali quaternarie nella Dorsale appenninica umbro-marchigiana. Proposta di un modello di tettonica d’inversione. Studi Geologici Camerti Spec. 1994/1, 211–225. doi:10.15165/studgeocam1164
Calamita, F., Coltorti, M., Pieruccini, P., and Pizzi, A. (1999). Evoluzione strutturale e morfogenesi plio-quaternaria dell'Appennino umbro-marchigiano tra il pedappennino umbro e la costa adriatica. Bollettino Società Geologica Italiana 118, 125–139.
Calamita, F., and Deiana, G. (1988). The Arcuate Shape of the Umbria Marche Sabina Apennines (Central Italy). Tectonophysics 146 (1-4), 139–147. doi:10.1016/0040-1951(88)90087-X
Calamita, F., Pizzi, A., and Roscioni, M. (1992). I “fasci” di faglie recenti ed attive di M. Vettore-M. Bove e di M. Castello-M. Cardosa (Appennino Umbro-Marchigiano). Studi Geologici Camerti, Spec 1992, 81–95.
Carafa, M. M. C., and Bird, P. (2016). Improving Deformation Models by Discounting Transient Signals in Geodetic Data: 2. Geodetic Data, Stress Directions, and Long-Term Strain Rates in Italy. J. Geophys. Res. Solid Earth 121 (7), 5557–5575. doi:10.1002/2016jb013038
Carafa, M. M. C., Galvani, A., Di Naccio, D., Kastelic, V., Di Lorenzo, C., and Miccolis, S. (2020). Partitioning the Ongoing Extension of the central Apennines (Italy): Fault Slip Rates and Bulk Deformation Rates from Geodetic and Stress Data. J. Geophys. Res. Solid Earth 125, e2019JB018956. doi:10.1029/2019JB018956
Cavinato, G. P., and De Celles, P. G. (1999). Extensional Basins in the Tectonically Bimodal central Apennines Fold-Thrust belt, Italy: Response to Corner Flow above a Subducting Slab in Retrograde Motion. Geology 27 (10), 955–958. doi:10.1130/0091-7613(1999)027%3C0955:EBITTB%3E2.3.CO;2
Ceci, A. M., Contento, A., Fanale, L., Galeota, D., Gattulli, V., and Lepidi, M. (2010). Structural Performance of the Historic and Modern Buildings of the University of L'Aquila during the Seismic Events of April 2009. Eng. Structures 32, 1899–1924. doi:10.1016/j.engstruct.2009.12.023
Centamore, E., Adamoli, L., Berti, D., Bigi, G., Bigi, S., and Casnedi, R. (1992). Carta Geologica dei Bacini Della Laga e del Cellino e dei rilievi carbonatici circostanti (Marche meridionali, Lazio nord-orientale, Abruzzo settentrionale) Studi Geologici Camerti SELCA. 1991/2. doi:10.15165/studgeocam-1409
Centamore, E., Cantalamessa, G., Micarelli, A., Potetti, M., Berti, D., and Bigi, S. (1991). Stratigrafia e analisi di facies dei depositi del miocene e del pliocene inferiore dell'avanfossa marchigiano-abruzzese e delle zone limitrofe. Studi Geologici Camerti Spec 1991-2, 125–131.
Cheloni, D., De Novellis, V., Albano, M., Antonioli, A., Anzidei, M., and Atzori, S. (2017). Geodetic Model of the 2016 Central Italy Earthquake Sequence Inferred from InSAR and GPS Data. Geophys. Res. Lett. 44 (13), 6778–6787. doi:10.1002/2017GL073580
Cheloni, D., Falcucci, E., and Gori, S. (2019). Half‐Graben Rupture Geometry of the 30 October 2016 MW6.6 Mt. Vettore‐Mt. Bove Earthquake, Central Italy. J. Geophys. Res. Solid Earth 124 (4), 4091–4118. doi:10.1029/2018jb015851
Chiarabba, C., Amato, A., Anselmi, M., Baccheschi, P., Bianchi, I., and Cattaneo, M. (2009). The 2009 L'Aquila (central Italy) MW6.3 Earthquake: Main Shock and Aftershocks. Geophys. Res. Lett. 36, L18308. doi:10.1029/2009GL039627
Chiarabba, C., Buttinelli, M., Cattaneo, M., and De Gori, P. (2020). Large Earthquakes Driven by Fluid Overpressure: The Apennines Normal Faulting System Case. Tectonics 39 (4), 1–13. doi:10.1029/2019TC006014
Chiarabba, C., De Gori, P., Cattaneo, M., Spallarossa, D., and Segou, M. (2018). Faults Geometry and the Role of Fluids in the 2016-2017 Central Italy Seismic Sequence. Geophys. Res. Lett. 45 (14), 6963–6971. doi:10.1029/2018GL077485
Chiarabba, C., Jovane, L., and Di Stefano, R. (2005). A New View of Italian Seismicity Using 20 Years of Instrumental Recordings. Tectonophysics 395 (3-4), 251–268. doi:10.1016/j.tecto.2004.09.013
Chiaraluce, L., Amato, A., Carannante, S., Castelli, S., Cattaneo, M., and Cocco, M. (2014). The Alto Tiberina Near Fault Observatory (Northern Apennines, Italy). Ann. de Geophysique 57, S0327. doi:10.4401/ag-6426
Chiaraluce, L., Di Stefano, R., Tinti, E., Scognamiglio, L., Michele, M., and Casarotti, E. (2017). The 2016 Central Italy Seismic Sequence: A First Look at the Mainshocks, Aftershocks, and Source Models. Seismological Res. Lett. 88 (3), 757–771. doi:10.1785/0220160221
Chiaraluce, L., Ellsworth, W. L., Chiarabba, C., and Cocco, M. (2003). Imaging the Complexity of an Active normal Fault System: The 1997 Colfiorito (central Italy) Case Study. J. Geophys. Res. 108 (B6), 2294. doi:10.1029/2002JB002166
Chiaraluce, L., Valoroso, L., Piccinini, D., Di Stefano, R., and De Gori, P. (2011). The Anatomy of the 2009 L'Aquila normal Fault System (central Italy) Imaged by High Resolution Foreshock and Aftershock Locations. J. Geophys. Res. 116, 1–25. doi:10.1029/2011JB008352
Ciaccio, M. G., Barchi, M. R., Chiarabba, C., Mirabella, F., and Stucchi, E. (2005). Seismological, Geological and Geophysical Constraints for the Gualdo Tadino Fault, Umbria-Marche Apennines (central Italy). Tectonophysics 406 (3–4), 233–247. doi:10.1016/j.tecto.2005.05.027
Ciccacci, S., D’Alessandro, L., Dramis, F., Fredi, P., and Pambianchi, G. (1985). Geomorphological and Neotectonic Evolution of the Umbria-Marche Ridge, Northern Sector. Studi Geologici Camerti 10, 7–15.
Cirillo, D. (2020). Digital Field Mapping and Drone-Aided Survey for Structural Geological Data Collection and Seismic Hazard Assessment: Case of the 2016 Central Italy Earthquakes. Appl. Sci. 10, 5233. doi:10.3390/app10155233
Cipollari, P., Cosentino, D., and Parotto, M. (1997). Modello Cinematico-Strutturale dell’Italia Centrale. Studi Geologici Camerti Spec 1995/2, 135–143.
Civico, R., Blumetti, A. M., Chiarini, E., Cinti, F. R., La Posta, E., and Papasodaro, F. (2016). Traces of the Active Capitignano and San Giovanni Faults (Abruzzi Apennines, Italy). J. Maps 12, 453–459. doi:10.1080/17445647.2016.1239229
Civico, R., Pucci, S., Villani, F., Pizzimenti, L., De Martini, P. M., and Nappi, R. (2018). Surface Ruptures Following the 30 October 2016 Mw6.5 Norcia Earthquake, central Italy. J. Maps 14 (2), 151–160. doi:10.1080/17445647.2018.1441756
Collettini, C., De Paola, N., Holdsworth, R. E., and Barchi, M. R. (2006). The Development and Behaviour of Low-Angle normal Faults during Cenozoic Asymmetric Extension in the Northern Apennines, Italy. J. Struct. Geology. 28 (2), 333–352. doi:10.1016/j.jsg.2005.10.003
Coltorti, M., and Pieruccini, P. (2000). A Late Lower Pliocene Planation Surface across the Italian Peninsula: a Key Tool in Neotectonic Studies. J. Geodynamics 29 (3-5), 323–328. doi:10.1016/s0264-3707(99)00049-6
Cosentino, D., Cipollari, P., Marsili, P., and Scrocca, D. (2010). Geology of the central Apennines: A Regional Review. J. Virtual Explorer 36, 11. doi:10.3809/jvirtex.2010.00223
Coward, M. P., De Donatis, M., Mazzoli, S., Paltrinieri, W., and Wezel, F.-C. (1999). Frontal Part of the Northern Apennines Fold and Thrust belt in the Romagna-Marche Area (Italy): Shallow and Deep Structural Styles. Tectonics 18, 559–574. doi:10.1029/1999tc900003
Crescenti, U. (1966). Sulla biostratigrafia del Miocene affiorante al confine marchigiano-abruzzese. Geologica Romana 5, 1–54.
De Natale, G., Crippa, B., Troise, C., and Pingue, F. (2011). Abruzzo, Italy, Earthquakes of April 2009: Heterogeneous Fault-Slip Models and Stress Transfer from Accurate Inversion of ENVISAT-InSAR Data. Bull. Seismological Soc. America 101 (5), 2340–2354. doi:10.1785/0120100220
Deiana, G., Mazzoli, S., Paltrinieri, W., Pierantoni, P. P., and Romano, A. (2003). Struttura del fronte montuoso umbro-marchigiano-sabino. Speci, 2003, 15–36. Studi Geologici Camerti. doi:10.15165/studgeocam-1452
DeLong, S. B., Hilley, G. E., Rymer, M. J., and Prentice, C. (2010). Fault zone structure from topography: Signatures of en echelon fault slip at Mustang Ridge on the San Andreas Fault, Monterey County, California. Tectonics 29, a–n. doi:10.1029/2010tc002673
Delorme, A., Grandin, R., Klinger, Y., Pierrot-Deseilligny, M., Feuillet, N., and Jacques, E. (2020). Complex Deformation at Shallow Depth during the 30 October 2016 Mw6.5 Norcia Earthquake: Interference between Tectonic and Gravity Processes? Tectonics 39, e2019TC005596. doi:10.1029/2019tc005596 Available at: https://doi-org.ezproxy1.lib.asu.edu/10.1029/2019TC005596.
Devoti, R., D'Agostino, N., Serpelloni, E., Pietrantonio, G., Riguzzi, F., and Avallone, A. (2017). A Combined Velocity Field of the Mediterranean Region. Ann. Geophys. 60 (2), 1–6. doi:10.4401/Ag-7059
Di Luccio, F., Fukuyama, E., and Pino, N. A. (2005). The 2002 Molise Earthquake Sequence: What Can We Learn about the Tectonics of Southern Italy? Tectonophysics 405, 141–154. doi:10.1016/j.tecto.2005.05.024
Dietrich, W. E., Bellugi, D. G., Sklar, L. S., Stock, J. D., Heimsath, A. M., and Roering, J. J. (2003). Geomorphic Transport Laws for Predicting Landscape Form and Dynamics. Prediction in Geomorphology, Geophysical Monograph 135, 103–132. doi:10.1029/135GM09 Copyright 2003 by the American Geophysical Union.
DISS Working Group (2018). Database of Individual Seismogenic Sources (DISS), Version 3.2.1: A Compilation of Potential Sources for Earthquakes Larger Than M 5.5 in Italy and Surrounding Areas. Available at: http://diss.rm.ingv.it/diss/, Istituto Nazionale di Geofisica e Vulcanologia.
Dramis, F. (1992). Il ruolo dei sollevamenti tettonici a largo raggio nella genesi del rilievo appenninico. Studi Geologici Camerti Spec 1992/1, 9–15.
Emergeo Working Group (2017). A New Photographic Dataset of the Coseismic Geological Effects Originated by the Mw5.9 Visso and Mw6.5 Norcia Earthquakes (26th and 30th October 2016, Central Italy). Miscellanea INGV 38, 1–114. Available at: http://editoria.rm.ingv.it/miscellanea/2017/miscellanea38/.
Falcucci, E., Gori, S., Bignami, C., Pietrantonio, G., Melini, D., and Moro, M. (2018). The Campotosto Seismic Gap in between the 2009 and 2016-2017 Seismic Sequences of Central Italy and the Role of Inherited Lithospheric Faults in Regional Seismotectonic Settings. Tectonics 37 (8), 2425–2445. doi:10.1029/2017TC004844
Falcucci, E., Gori, S., Moro, M., Pisani, A. R., Melini, D., and Galadini, F. (2011). The 2009 L'Aquila Earthquake (Italy): What's Next in the Region? Hints from Stress Diffusion Analysis and normal Fault Activity. Earth Planet. Sci. Lett. 305 (3-4), 350–358. doi:10.1016/j.epsl.2011.03.016
Ferrarini, F., Lavecchia, G., de Nardis, R., and Brozzetti, F. (2015). Fault Geometry and Active Stress from Earthquakes and Field Geology Data Analysis: The Colfiorito 1997 and L'Aquila 2009 Cases (Central Italy). Pure Appl. Geophys. 172 (5), 1079–1103. doi:10.1007/s00024-014-0931-7
Ferrater, M., Arrowsmith, R., and Masana, E. (2015). Lateral Offset Quality Rating along Low Slip Rate Faults: Application to the Alhama de Murcia Fault (SE Iberian Peninsula). Remote Sensing 7 (11), 14827–14852. doi:10.3390/rs71114827
Festa, A. (2005). Geometrie e meccanismi di raccorciamento nel settore meridionale del Bacino marchigiano (Monte Gorzano, Appennino Centrale). Bollettino della Società Geologica Italiana 124, 41–51.
Galadini, F., and Galli, P. (2000). Active Tectonics in the central Apennines (Italy) - Input Data for Seismic hazard Assessment. Nat. Hazards 22 (3), 225–268. doi:10.1023/A:1008149531980
Galadini, F., and Galli, P. (2003). Paleoseismology of Silent Faults in the central Apennines (Italy): the Mt. Vettore and Laga Mts. Faults. Ann. Geophys. 46 (5), 815–836. doi:10.4401/ag-3457
Galli, P., Galderisi, A., Peronace, E., Giaccio, B., Hajdas, I., and Messina, P. (2019). The Awakening of the Dormant Mount Vettore Fault (2016 Central Italy Earthquake, M W 6.6): Paleoseismic Clues on its Millennial Silences. Tectonics 38, 687–705. doi:10.1029/2018TC005326
Ghisetti, F., and Vezzani, L. (1991). Thrust belt Development in the central Apennines (Italy): Northward Polarity of Thrusting and Out-Of-Sequence Deformations in the Gran Sasso Chain. Tectonics 10 (5), 904–919. doi:10.1029/91tc00902
Gold, R. D., Stephenson, W. J., Odum, J. K., Briggs, R. W., Crone, A. J., and Angster, S. J. (2013). Concealed Quaternary Strike-Slip Fault Resolved with Airborne Lidar and Seismic Reflection: The Grizzly Valley Fault System, Northern Walker Lane, California. J. Geophys. Res. Solid Earth 118, 3753–3766. doi:10.1002/jgrb.50238
Goldberg, D. E., Melgar, D., Sahakian, V. J., Thomas, A. M., Xu, X., and Crowell, B. W. (2020). Complex Rupture of an Immature Fault Zone: A Simultaneous Kinematic Model of the 2019 Ridgecrest, CA Earthquakes. Geophys. Res. Lett. 47 (3). doi:10.1029/2019GL086382
Govoni, A., Marchetti, A., De Gori, P., Di Bona, M., Lucente, F. P., and Improta, L. (2014). The 2012 Emilia Seismic Sequence (Northern Italy): Imaging the Thrust Fault System by Accurate Aftershock Location. Tectonophysics 622, 44–55. doi:10.1016/j.tecto.2014.02.013
Gruppo di Lavoro, M. P. S. (2004). Redazione della mappa di pericolosita sismica prevista dall’Ordinanza PCM 3274 del 20 marzo 2003Rapporto Conclusivo per il Dipartimento della Protezione Civile. Milano-Roma: INGV, 65.pp. + 5 appendices.
Hardebeck, J. L., Nazareth, J. J., and Hauksson, E. (1998). The Static Stress Change Triggering Model: Constraints from Two Southern California Aftershock Sequences. J. Geophys. Res. 103 (B10), 24427–24437. doi:10.1029/98jb00573
Heidbach, O., Rajabi, M., Cui, X., Fuchs, K., Müller, B., and Reinecker, J. (2018). The World Stress Map Database Release 2016: Crustal Stress Pattern across Scales. Tectonophysics 744, 484–498. doi:10.1016/j.tecto.2018.07.007
Hilley, G. E., and Arrowsmith, J. R. (2008). Geomorphic Response to Uplift along the Dragon's Back Pressure ridge, Carrizo Plain, California. Geol. 36 (5), 367–370. doi:10.1130/G24517a.1
Hilley, G. E., DeLong, S., Prentice, C., Blisniuk, K., and Arrowsmith, J. (2010). Morphologic Dating of Fault Scarps Using Airborne Laser Swath Mapping (ALSM) Data. Geophys. Res. Lett. 37, 1–6. doi:10.1029/2009gl042044
Hino, R., Azuma, R., Ito, Y., Yamamoto, Y., Suzuki, K., and Tsushima, H. (2009). Insight into Complex Rupturing of the Immature Bending normal Fault in the Outer Slope of the Japan Trench from Aftershocks of the 2005 Sanriku Earthquake (Mw=7.0) Located by Ocean Bottom Seismometry. Geochem. Geophys. Geosyst. 10, a–n. doi:10.1029/2009GC002415
Huang, M. H., Fielding, E. J., Liang, C., Milillo, P., Bekaert, D., and Dreger, D. (2017). Coseismic Deformation and Triggered Landslides of the 2016 MW6.2 Amatrice Earthquake in Italy. Geophys. Res. Lett. 44 (3), 1266–1274. doi:10.1002/2016GL071687
Hubbard, J., Almeida, R., Foster, A., Sapkota, S. N., Bürgi, P., and Tapponnier, P. (2016). Structural Segmentation Controlled the 2015 Mw7.8 Gorkha Earthquake Rupture in Nepal. Geology 44 (8), 639–642. doi:10.1130/G38077.1
ISIDe Working Group (2007). Italian Seismological Instrumental and Parametric Database (ISIDe). Istituto Nazionale di Geofisica e Vulcanologia (INGV). doi:10.13127/ISIDE
ITHACA Working Group (2019). ITHACA (ITaly HAzard from CApable Faulting). A Database of Active Capable Faults of the Italian Territory. Available at: http://sgi2.isprambiente.it/ithacaweb/Mappatura.aspx. Version December 2019.
Kennelly, P. J. (2008). Terrain Maps Displaying hill-shading with Curvature. Geomorphology 102 (3-4), 567–577. doi:10.1016/j.geomorph.2008.05.046
King, G. C. P., Stein, R. S., and Lin, J. (1994). Static Stress Changes and the Triggering of Earthquakes. Bull. Seismological Soc. America 84 (3), 935–953.
Koopman, A. (1983). Detachment Tectonics in the central Apennines, Italy. Geologica Eltraiectina 30, 1–155.
Langridge, R. M., Ries, W. F., Farrier, T., Barth, N. C., Khajavi, N., and de Pascale, G. P. (2014). Developing Sub 5-m LiDAR DEMs for Forested Sections of the Alpine and Hope Faults, South Island, New Zealand: Implications for Structural Interpretations. J. Struct. Geology. 64, 53–66. doi:10.1016/j.jsg.2013.11.007
Lavecchia, G., Adinolfi, G. M., de Nardis, R., Ferrarini, F., Cirillo, D., and Brozzetti, F. (2017). Multidisciplinary Inferences on a Newly Recognized Active East-Dipping Extensional System in Central Italy. Terra Nova 29 (1), 77–89. doi:10.1111/ter.12251
Lavecchia, G., Boncio, P., Brozzetti, F., De Nardis, R., Di Naccio, D., and Ferrarini, F. (2011). “The April 2009 L'Aquila (central Italy) Seismic Sequence (Mw6.3): A Preliminary Seismotectonic Picture,” in Recent Progress on Earthquake Geology. Editor P. P. Guarnieri (Nova Science Publishers, Inc.), 1–17.
Lavecchia, G., Brozzetti, F., Barchi, M., Menichetti, M., and Keller, J. V. A. (1994). Seismotectonic Zoning in East-Central Italy Deduced from an Analysis of the Neogene to Present Deformations and Related Stress-Fields. Geol. Soc. America Bull. 106 (9), 1107–1120. doi:10.1130/0016-7606(1994)106<1107:Szieci>2.3.Co;2
Lavecchia, G., Castaldo, R., Nardis, R., De Novellis, V., Ferrarini, F., and Pepe, S. (2016). Ground Deformation and Source Geometry of the 24 August 2016 Amatrice Earthquake (Central Italy) Investigated through Analytical and Numerical Modeling of DInSAR Measurements and Structural‐geological Data. Geophys. Res. Lett. 43 (24), 12389–12398. doi:10.1002/2016GL071723
Lavecchia, G., de Nardis, R., Ferrarini, F., Cirillo, D., Bello, S., and Brozzetti, F. (2020). “Regional Seismotectonic Zonation of Hydrocarbon fields in Active Thrust Belts: a Case Study from Italy,” in Building Knowledge for Geohazard Assessment and Management in the Caucasus and Other Orogenic Regions. Editors F. L. Bonali, F. Pasquaré Mariotto, and N. Tsereteli doi:10.1007/978-94-024-2046-3
Lavecchia, G., Ferrarini, F., Brozzetti, F., de Nardis, R., Boncio, P., and Chiaraluce, L. (2012). From Surface Geology to Aftershock Analysis: Constraints on the Geometry of the L'Aquila 2009 Seismogenic Fault System. Ital. J. Geosciences 131, 330–347. doi:10.3301/Ijg.2012.24
Lavecchia, G. (1985). Il sovrascorrimento dei M. Sibillini: analisi cinemantica e strutturale. Boll. Soc. Geol. It. 104, 161–194.
Lavecchia, G., Minelli, G., and Pialli, G. (1988). The Umbria Marche Arcuate Fold Belt (Italy). Tectonophysics 146 (1-4), 125–137. doi:10.1016/0040-1951(88)90086-8
Lin, J., and Stein, R. S. (2004). Stress Triggering in Thrust and Subduction Earthquakes and Stress Interaction between the Southern San Andreas and Nearby Thrust and Strike-Slip Faults. J. Geophys. Res. 109 (B2). doi:10.1029/2003jb002607
Liu, C., Zheng, Y., Xie, Z., and Xiong, X. (2017). Rupture Features of the 2016 M W 6.2 Norcia Earthquake and its Possible Relationship with strong Seismic Hazards. Geophys. Res. Lett. 44 (3), 1320–1328. doi:10.1002/2016GL071958
Manighetti, I., Campillo, M., Bouley, S., and Cotton, F. (2007). Earthquake Scaling, Fault Segmentation, and Structural Maturity. Earth Planet. Sci. Lett. 253 (3-4), 429–438. doi:10.1016/j.epsl.2006.11.004
Mariucci, M. T., and Montone, P. (2020). IPSI 1.4, Database of Italian Present-Day Stress Indicators, Istituto Nazionale di Geofisica e Vulcanologia (INGV): doi:10.13127/IPSI.1.4
Michele, M., Cattaneo, M., Chiaraluce, L., Spallarossa, D., Scafidi, D., and Segou, M. (2020). An Automatically Generated High-Resolution Earthquake Catalogue for the 2016-2017 Central Italy Seismic Sequence, Including P and S Phase Arrival Times [Data Set]. Zenodo. doi:10.5281/zenodo.4306165
Mildon, Z. K., Roberts, G. P., Faure Walker, J. P., and Iezzi, F. (2017). Coulomb Stress Transfer and Fault Interaction over Millennia on Non-planar Active normal Faults: the Mw6.5-5.0 Seismic Sequence of 2016-2017, central Italy. Geophys. J. Int. 210 (2), 1206–1218. doi:10.1093/gji/ggx213
Mirabella, F., Brozzetti, F., Lupattelli, A., and Barchi, M. R. (2011). Tectonic Evolution of a Low-Angle Extensional Fault System from Restored Cross-Sections in the Northern Apennines (Italy). Tectonics 30, a–n. doi:10.1029/2011tc002890
Montone, P., and Mariucci, M. T. (2016). The New Release of the Italian Contemporary Stress Map. Geophys. J. Int. 205 (3), 1525–1531. doi:10.1093/gji/ggw100
Moore, I. D., Grayson, R. B., and Ladson, A. R. (1991). Digital Terrain Modelling: A Review of Hydrological, Geomorphological, and Biological Applications. Hydrol. Process. 5 (1), 3–30. doi:10.1002/hyp.3360050103
Moro, M., Bosi, V., Galadini, F., Galli, P., Giaccio, B., and Messina, P. (2002). Analisi paleosismologiche lungo la faglia del M. Marine (alta valle dell’Aterno): risultati pelminari. Il Quaternario 15, 267–278.
Odin, G. S., Ricci Lucchi, F., Tateo, F., Cosca, M., and Hunziker, J. C. (1997). “Integrated Stratigraphy of the Maccarone Section, Late Messinian (Marche Region, Italy),” in Miocene Stratigraphy - an Integrated Approach. Editor A. Montanari (Amsterdam: Elsevier), 529–544.
Perrin, C., Manighetti, I., Ampuero, J.-P., Cappa, F., and Gaudemer, Y. (2016). Location of Largest Earthquake Slip and Fast Rupture Controlled by Along-Strike Change in Fault Structural Maturity Due to Fault Growth. J. Geophys. Res. Solid Earth 121 (5), 3666–3685. doi:10.1002/2015JB012671
Pierantoni, P., Deiana, G., and Galdenzi, S. (2013). Stratigraphic and Structural Features of the Sibillini Mountains (Umbria-Marche Apennines, Italy). Italian J. Geosci. 132 (3), 497–520. doi:10.3301/Ijg.2013.08
Pierantoni, P. P., Deiana, G., Romano, A., Paltrinieri, W., Borraccini, F., and Mazzoli, S. (2005). Geometrie strutturali lungo la thrust zone del fronte montuoso umbro-marchigiano-sabino. Boll. Soc. Geol. It. 124, 395–411.
Pino, N. A., Convertito, V., and Madariaga, R. (2019). Clock advance and Magnitude Limitation through Fault Interaction: the Case of the 2016 central Italy Earthquake Sequence. Sci. Rep. 9, 5005. doi:10.1038/s41598-019-41453-1
Pizzi, A., Di Domenica, A., Gallovič, F., Luzi, L., and Puglia, R. (2017). Fault Segmentation as Constraint to the Occurrence of the Main Shocks of the 2016 Central Italy Seismic Sequence. Tectonics 36 (11), 2370–2387. doi:10.1002/2017TC004652
Plesch, A., Shaw, J. H., Benson, C., Bryant, W. A., Carena, S., and Cooke, M. (2007). Community Fault Model (CFM) for Southern California. Bull. Seismological Soc. America 97 (6), 1793–1802. doi:10.1785/0120050211
Pondrelli, S., Salimbeni, S., Ekström, G., and Morelli, A. (2006). The Italian CMT Dataset From 1977 to the Present. Phys. Earth Planet 159, 286–303. doi:10.1016/j.pepi.2006.07.008
Porreca, M., Minelli, G., Ercoli, M., Brobia, A., Mancinelli, P., and Cruciani, F. (2018). Seismic Reflection Profiles and Subsurface Geology of the Area Interested by the 2016-2017 Earthquake Sequence (Central Italy). Tectonics 37 (4), 1116–1137. doi:10.1002/2017TC004915
Pucci, S., De Martini, P. M., Civico, R., Villani, F., Nappi, R., and Ricci, T. (2017). Coseismic Ruptures of the 24 August 2016, M W 6.0 Amatrice Earthquake (central Italy). Geophys. Res. Lett. 44 (5), 2138–2147. doi:10.1002/2016GL071859
Puliti, I., Pizzi, A., Benedetti, L., Di Domenica, A., and Fleury, J. (2020). Comparing Slip Distribution of an Active Fault System at Various Timescales: Insights for the Evolution of the Mt. Vettore‐Mt. Bove Fault System in Central Apennines. Tectonics 39, e2020TC006200. doi:10.1029/2020TC006200
Reasenberg, P. A., and Simpson, R. W. (1992). Response of Regional Seismicity to the Static Stress Change Produced by the Loma Prieta Earthquake. Science 255 (5052), 1687–1690. doi:10.1126/science.255.5052.1687
Regio Ufficio Geologico (1941). Foglio 132 (Norcia) Della Carta 1:100.000 Dell’I. Roma: G.M. Available at: http://193.206.192.231/carta_geologica_italia/tavoletta.php?foglio=132.
Ricci Lucchi, F. (1975). Miocene Paleogeography and basin Analysis in Periadriatic Apennines. Reprinted from Geology of Italy. Tripoli, P. E. S. L.
Ricci Lucchi, F. (1973). Resedimented Evaporites: Indicators of Slope Instability Conditions in Periadriatic Messinian (Apennine Foredeep, Italy). Koninklijke Nederlandse Akademie Van Wetenshappen. Messinian Events in the Mediterranean, Geodynamic Scientific Report No 7 on the Colloquium Held in Utrecht 1973, 142–149. March 2-4
Roberts, G. P., and Michetti, A. M. (2004). Spatial and Temporal Variations in Growth Rates along Active normal Fault Systems: an Example from the Lazio-Abruzzo Apennines, central Italy. J. Struct. Geology. 26 (2), 339–376. doi:10.1016/S0191-8141(03)00103-2
Rovida, A., Locati, M., Camassi, R., Lolli, B., Gasperini, P., and Antonucci, A. (2021). Italian Parametric Earthquake Catalogue (CPTI15), Version 3.0 (Italy: Istituto Nazionale di Geofisica e Vulcanologia (INGV)). doi:10.13127/CPTI/CPTI15.3
Salvini, F., and Vittori, E. (1982). Analisi strutturale della linea Olevano Antrodoco-Posta (Ancona-Anzio Auct.): metodologia di studio delle deformazioni fragili e presentazione del tratto meridionale. Mem. Soc. Geol. It. 24, 335–337.
Savoia, M., Buratti, N., and Vincenzi, L. (2017). Damage and Collapses in Industrial Precast Buildings after the 2012 Emilia Earthquake. Eng. Structures 137, 162–180. doi:10.1016/j.engstruct.2017.01.059
Scarsella, F. (1953). Relazione preliminare sui rilevamenti geologici fatti durante il 1953 nei fogli L’Aquila, Teramo, Civitavecchia, Ariano Irpino. Boll. Serv. Geol. D’it. 75, 795–807.
Scognamiglio, L., Tinti, E., Casarotti, E., Pucci, S., Villani, F., and Cocco, M. (2018). Complex Fault Geometry and Rupture Dynamics of the M W 6.5, 30 October 2016, Central Italy Earthquake. J. Geophys. Res. Solid Earth 123 (4), 2943–2964. doi:10.1785/gssrl.81.6.89210.1002/2018jb015603
Scognamiglio, L., Tinti, E., and Quintiliani, M. (2006). Time Domain Moment Tensor [Data Set]. Istituto Nazionale di Geofisica e Vulcanologia (INGV). doi:10.13127/TDMTsdata.2018.49
Servizio Geologico d’Italia (1968a). Foglio 123 (Assisi) Della Carta 1:100.000 Dell’I. Roma: G.M. Available at: http://193.206.192.231/carta_geologica_italia/tavoletta.php?foglio=123.
Servizio Geologico d’Italia (1967). Foglio 124 (Macerata) Della Carta 1:100.000 Dell’I. Roma: G.M. Available at: http://193.206.192.231/carta_geologica_italia/tavoletta.php?foglio=124.
Servizio Geologico d’Italia (1959). Foglio 125 (Fermo) Della Carta 1:100.000 Dell’I. Roma: G.M. Available at: http://193.206.192.231/carta_geologica_italia/tavoletta.php?foglio=125.
Servizio Geologico d’Italia (1968b). Foglio 131 (Foligno) Della Carta 1:100.000 Dell’I. Roma: G.M. Available at: http://193.206.192.231/carta_geologica_italia/tavoletta.php?foglio=131.
Servizio Geologico d’Italia (1969). Foglio 133-134 (Ascoli Piceno-Giulianova) Della Carta 1:100.000 Dell’I. Roma: G.M. Available at: http://193.206.192.231/carta_geologica_italia/tavoletta.php?foglio=133-134.
Sibson, R. H. (2000). Fluid Involvement in normal Faulting. J. Geodynamics 29, 469–499. doi:10.1016/S0264-3707(99)00042-3
Spallarossa, D., Cattaneo, M., Scafidi, D., Michele, M., Chiaraluce, L., and Segou, M. (2021). An Automatically Generated High-Resolution Earthquake Catalogue for the 2016-2017 Central Italy Seismic Sequence, Including P and S Phase Arrival Times. Geophys. J. Int. 225, 555–571. doi:10.1093/gji/ggaa604
Speranza, F., and Chiappini, M. (2002). Thick-skinned Tectonics in the External Apennines, Italy: New Evidence from Magnetic Anomaly Analysis. J. Geophys. Res. 107 (B11), 8–1. doi:10.1029/2000jb000027
Stein, R. S., Barka, A. A., and Dieterich, J. H. (1997). Progressive Failure on the North Anatolian Fault since 1939 by Earthquake Stress Triggering. Geophys. J. Int. 128 (3), 594–604. doi:10.1111/j.1365-246X.1997.tb05321.x
Suteanu, C., Liucci, L., and Melelli, L. (2018). The Central Italy Seismic Sequence (2016): Spatial Patterns and Dynamic Fingerprints. Pure Appl. Geophys. 175 (1), 1–24. doi:10.1007/s00024-017-1759-8
Tarquini, S., Isola, I., Favalli, M., and Battistini, A. (2007a). TINITALY, a Digital Elevation Model of Italy with a 10 M-Cell Size. Istituto Nazionale di Geofisica e Vulcanologia (INGV). doi:10.13127/TINITALY/1.0 Version 1.0[Data set].
Tarquini, S., Isola, I., Favalli, M., Mazzarini, F., Bisson, M., and Pareschi, M. T. (2007b). TINITALY/01: a New Triangular Irregular Network of Italy. Ann. Geophys. 50, 407–425. doi:10.4401/ag-4424
Tarquini, S., Vinci, S., Favalli, M., Doumaz, F., Fornaciai, A., and Nannipieri, L. (2012). Release of a 10-M-Resolution DEM for the Italian Territory: Comparison with Global-Coverage DEMs and Anaglyph-Mode Exploration via the Web. Comput. Geosciences 38 (1), 168–170. doi:10.1016/j.cageo.2011.04.018
Testa, A., Boncio, P., Di Donato, M., Mataloni, G., Brozzetti, F., and Cirillo, D. (2019). Mapping the Geology of the 2016 Central Italy Earthquake Fault (Mt. Vettore - Mt. Bove Fault, Sibillini Mts.): Geological Details on the Cupi - Ussita and Mt. Bove - Mt. Porche Segments and Overall Pattern of Coseismic Surface Faulting. Geological Field Trip and Maps 11 (2), 1–13. doi:10.3301/Gft.2019.03
Thomas, A. M., Bürgmann, R., and Dreger, D. S. (2013). Incipient Faulting Near Lake Pillsbury, California, and the Role of Accessory Faults in Plate Boundary Evolution. Geology 41 (10), 1119–1122. doi:10.1130/G34588.1
Tinti, E., Scognamiglio, L., Michelini, A., and Cocco, M. (2016). Slip Heterogeneity and Directivity of the ML6.0, 2016, Amatrice Earthquake Estimated with Rapid Finite-Fault Inversion. Geophys. Res. Lett. 43 (20), 745–810. doi:10.1002/2016GL071263
Toda, S., Stein, R. S., Richards-Dinger, K., and Bozkurt, S. B. (2005). Forecasting the Evolution of Seismicity in Southern California: Animations Built on Earthquake Stress Transfer. J. Geophys. Res. 110 (B5). doi:10.1029/2004jb003415
Troise, C., De Natale, G., Pingue, F., and Petrazzuoli, S. M. (1998). Evidence for Static Stress Interaction Among Earthquakes in the South-central Apennines (Italy). Geophys. J. Int. 134, 809–817. doi:10.1046/j.1365-246x.1998.00610.x
Valerio, E., Tizzani, P., Carminati, E., Doglioni, C., Pepe, S., and Petricca, P. (2018). Ground Deformation and Source Geometry of the 30 October 2016 Mw6.5 Norcia Earthquake (Central Italy) Investigated through Seismological Data, DInSAR Measurements, and Numerical Modelling. Remote Sensing 10 (12), 1901. doi:10.3390/Rs10121901
Valoroso, L., Chiaraluce, L., Di Stefano, R., and Monachesi, G. (2017). Mixed-mode Slip Behavior of the Altotiberina Low-Angle normal Fault System (Northern Apennines, Italy) through High-Resolution Earthquake Locations and Repeating Events. J. Geophys. Res. Solid Earth 122, 220–310. doi:10.1002/2017JB014607
Valoroso, L., Chiaraluce, L., Piccinini, D., Di Stefano, R., Schaff, D., and Waldhauser, F. (2013). Radiography of a normal Fault System by 64,000 High-Precision Earthquake Locations: The 2009 L'Aquila (central Italy) Case Study. J. Geophys. Res. Solid Earth 118 (3), 1156–1176. doi:10.1002/jgrb.50130
Vezzani, L., and Ghisetti, F. (1998). Carta Geologica dell’Abruzzo, Scale 1:100.000, 2 Sheets –S.E.L.C.A.. Firenze, Italy
Villani, F., Civico, R., Civico, R., Pucci, S., Pizzimenti, L., and Nappi, R. (2018). A Database of the Coseismic Effects Following the 30 October 2016 Norcia Earthquake in Central Italy. Sci. Data 5. doi:10.1038/Sdata.2018.49
Villani, F., Sapia, V., Baccheschi, P., Civico, R., Di Giulio, G., and Vassallo, M. (2019). Geometry and Structure of a Fault‐Bounded Extensional Basin by Integrating Geophysical Surveys and Seismic Anisotropy Across the 30 October 2016 Mw6.5 Earthquake Fault (Central Italy): The Pian Grande di Castelluccio Basin. Tectonics 38 (1), 26–48. doi:10.1029/2018TC005205
Walters, R. J., Gregory, L. C., Wedmore, L. N. J., Craig, T. J., McCaffrey, K., and Wilkinson, M. (2018). Dual Control of Fault Intersections on Stop-Start Rupture in the 2016 Central Italy Seismic Sequence. Earth Planet. Sci. Lett. 500, 1–14. doi:10.1016/j.epsl.2018.07.043
Wells, D. L., and Coppersmith, K. J. (1994). New Empirical Relationships Among Magnitude, Rupture Length, Rupture Width, Rupture Area, and Surface Displacement. Bull. Seismological Soc. America 84 (4), 974–1002.
Wesnousky, S. G. (2006). Predicting the Endpoints of Earthquake Ruptures. Nature 444 (7117), 358–360. doi:10.1038/nature05275
Wilson, J. P., and Gallant, J. C. (2000). Digital Terrain Analysis. In Wilson, J.P. and Gallant, J.C., Eds., Terrain Analysis: Principles and Applications (New York: John Wiley & Sons). 0-471-32188-5.
Xu, G., Xu, C., Wen, Y., and Jiang, G. (2017). Source Parameters of the 2016-2017 Central Italy Earthquake Sequence from the Sentinel-1, ALOS-2 and GPS Data. Remote Sensing 9 (11), 1182. doi:10.3390/Rs9111182
Zevenbergen, L. W., and Thorne, C. R. (1987). Quantitative Analysis of Land Surface Topography. Earth Surf. Process. Landforms 12 (1), 47–56. doi:10.1002/esp.3290120107
Zielke, O., Arrowsmith, J. R., Grant Ludwig, L., and Akciz, S. O. (2012). High-Resolution Topography-Derived Offsets along the 1857 Fort Tejon Earthquake Rupture Trace, San Andreas Fault. Bull. Seismological Soc. America 102 (3), 1135–1154. doi:10.1785/0120110230
Keywords: distributed active deformation, Pievebovigliana fault, 2016 Norcia seismic sequence, intra-Apennines extension, central Italy
Citation: Ferrarini F, de Nardis R, Brozzetti F, Cirillo D, Arrowsmith JR and Lavecchia G (2021) Multiple Lines of Evidence for a Potentially Seismogenic Fault Along the Central-Apennine (Italy) Active Extensional Belt–An Unexpected Outcome of the MW6.5 Norcia 2016 Earthquake. Front. Earth Sci. 9:642243. doi: 10.3389/feart.2021.642243
Received: 15 December 2020; Accepted: 04 June 2021;
Published: 23 June 2021.
Edited by:
Yosuke Aoki, The University of Tokyo, JapanReviewed by:
Ken McCaffrey, Durham University, United KingdomCopyright © 2021 Ferrarini, de Nardis, Brozzetti, Cirillo, Arrowsmith and Lavecchia. This is an open-access article distributed under the terms of the Creative Commons Attribution License (CC BY). The use, distribution or reproduction in other forums is permitted, provided the original author(s) and the copyright owner(s) are credited and that the original publication in this journal is cited, in accordance with accepted academic practice. No use, distribution or reproduction is permitted which does not comply with these terms.
*Correspondence: Federica Ferrarini, Zi5mZXJyYXJpbmlAdW5pY2guaXQ=
Disclaimer: All claims expressed in this article are solely those of the authors and do not necessarily represent those of their affiliated organizations, or those of the publisher, the editors and the reviewers. Any product that may be evaluated in this article or claim that may be made by its manufacturer is not guaranteed or endorsed by the publisher.
Research integrity at Frontiers
Learn more about the work of our research integrity team to safeguard the quality of each article we publish.