- 1National Institute of Oceanography and Applied Geophysics-OGS, Sgonico, Italy
- 2Department of Mathematics and Geosciences, University of Trieste, Trieste, Italy
We analyzed the data recorded by the NE-Italy subsurface tilt and strainmeter network evidencing a coherent transient signal in the recordings of four tiltmeter sites in the 1984–1990 period that produced a tilt along the main fractures. Borrowing from classical seismology techniques, we used the uprise times to locate the transient signal source. The propagation velocity is compatible with a fluid diffusion process that starts from a source located close to the hypocenter of the February 10, 1983 Uccea earthquake, MD = 4.2 at the Italy-Slovenia border, at an estimated depth of 10.8 km. Our results add to the previous interpretation of a transient signal recorded by several global navigation satellite system (GNSS) stations in the 2006–2009 period in terms of fluid diffusion below the Bovec basin (Slovenia). That source was located upon continuation to the northwest of the Ravne fault, few kilometers to the northeast from the present one, and about 6 km from the July 12, 2004 Bovec–Krn earthquake, Mw = 5.1, depth ~6.1 km. These observations suggest that the area is subject to fault valve behavior episodes that released fluids trapped at depth to the surrounding region as pore-pressure bulges. The convergence between Alpine and External Dinarides structures in this area puts highly permeable dolomitic limestones in contact with low-permeable fine-grained limestones and flysch formations. Therefore, the conditions for overpressure generation can be created, whereas fault movements, from time to time, in close relation with seismic events, can enable fluid diffusion in the surroundings. We also estimated the possible fluid influx needed to maintain overpressure and possible discharge across both the faults. The study provides insights on pore–fluid pressure variations related to slow slip events from a context different from subduction or transform margins, i.e., in a continental collision area.
Introduction
Nowadays, space geodetic observations cover large portions of the Earth, with time series even longer than 20 years, i.e., long enough to allow distinguishing and characterization of periodical or transient variations. The latter consist of variable amplitude signals (from few millimeters to some centimeters, Riel et al., 2014) due to slow slip events often associated with tremors [episodic tremor and slip (ETS)] induced by tectonic or volcanic processes. They have been observed in various parts of the world (e.g., Dragert, 2001; Lowry et al., 2001; a review in Bürgmann, 2018, and references therein).
Besides, crustal deformations at different spatial–temporal scales can also be caused by hydrogeological processes (Watson et al., 2002; van Dam et al., 2007; Longuevergne et al., 2009; Ji and Herring, 2012; Wahr et al., 2013; Devoti et al., 2015, 2018; Silverii et al., 2016, 2019; D'Agostino et al., 2018; Braitenberg et al., 2019). Various types of deformation have been studied considering the elastic response of the crust to the loading forces using increasingly complex models, also taking into account the poroelastic deformations of aquifers and the complicated behavior of karst aquifers (Farrell, 1972; Argus et al., 2014; Devoti et al., 2018; Serpelloni et al., 2018; Silverii et al., 2019) to distinguish and separate hydrological from non-hydrological transient deformations. Some studies (Cervelli et al., 2002; Craig et al., 2017; D'Agostino et al., 2018; Panda et al., 2018, 2020; Chanard et al., 2020) highlighted that rainfalls and consequent groundwater recharge might play a direct role in modulating deformation and seismicity, at least under particular conditions. However, further investigations are needed to confirm these results.
Independently upon the fluid-origin, pore-pressure variations are often thought to be at the origin of slow slip events, ETS, and seismicity (Rice, 1992; Kodaira, 2004; Skarbek and Rempel, 2016; Cruz-Atienza et al., 2018; Nakajima and Uchida, 2018), but most of the voluminous literature regard oceanic–continental plate subduction zones and, in lesser part, volcanic, hotspot, or transform settings (Khoshmanesh and Shirzaei, 2018). Recently, however, fluid migration related to seismic activity has been reported in the Mediterranean, in different parts of the Adria microplate margins (Rossi et al., 2016, 2017, 2018; Nespoli et al., 2018; Console et al., 2020).
In particular, in the northern tip of the Adria microplate, an area of continental collision (Rossi et al., 2016, corrected in 2017–hereafter: RossiI; 2018–hereafter: RossiII), analyzing the global navigation satellite system (GNSS) data from the Friuli Regional Deformation Network (FreDNet) (OGS), Marussi (Friuli Venezia Giulia regional council), and the EUREF networks, reported the occurrence of a transient signal propagating through the region that, between 2006 and 2009, induced a tilt parallel to the principal faulting lineaments. They interpreted the signal as a propagating surge in pore fluid pressure (Revil and Cathles, 2002; Lupi et al., 2011), i.e., a porosity wave. Porosity waves are packets of fluid-filled, hydraulically connected cracks that propagate in response to a pressure gradient set by ambient tectonic stresses (Connolly and Podladchikov, 2013). They have been hypothesized by Skarbek and Rempel (2016) as the transport mechanism of deep fluids triggering ETS in subduction zones. Also, porosity waves can originate in the presence of supra-hydrostatic gradients in fluid pressure across an active fault (Lupi et al., 2011) that may behave as a fluid pressure-activated valve, the so-called fault valve behavior of Sibson (Sibson, 1992, 2014; Fischer et al., 2017; Matsumoto et al., 2021). According to this model, during the interseismic and pre-seismic phases, the fault acts as an impermeable barrier to fluid flow from a region characterized by a supra hydrostatic regime to the overlying layers where the fluid pressure of interconnected pores is hydrostatic (Figure 1A). When failure condition is met, through further increase in fluid pressure or accumulation of shear stress, an earthquake occurs, and the fault and the barrier break, allowing fluid discharge along the fault (Figure 1B). The scheme in Figure 1C shows the time behavior of a fault through time: in the pre-seismic phase (to the left of the earthquakes, indicated as EQ), we observe a slow increase in fluid pressure (Pf) and shear stress (τ). In correspondence with the earthquake, the fault permeability (k) suddenly increases, and the following fluid discharge progressively reduces Pf and τ, with opposite behavior of the frictional shear strength of the fault (τf). Progressive healing due to hydrothermal processes decreases permeability, restoring the impermeable barrier, and the cycle can start again.
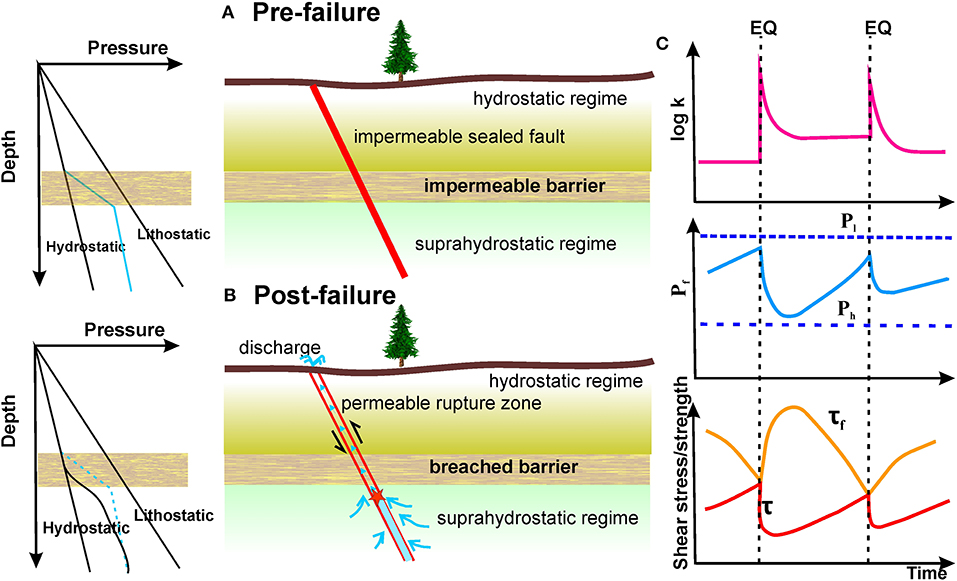
Figure 1. Schematic representation of the fault valve behavior. (A) Pre-failure: on the left, the pore pressure gradient in the fault zone, above and below the impermeable barrier, i.e., the transition from the hydrostatic to the supra-hydrostatic flux regime (right); (B) post-failure: (right) an earthquake (red star) breaks the barrier, and the fluids rise upwards; on the left, the fluid pressure gradient is nearer to the hydrostatic curve; (C) scheme of fault valve action in relation to earthquake occurrence (EQ): when the impermeable barrier is broken, the local permeability k increases, allowing fluid discharge, decreasing fluid pressure Pf, and increasing the frictional strength (τf) (from Sibson, 2020, redrawn). Pl, lithostatic pressure; Ph, hydrostatic pressure; τ, tectonic shear stress (From Sibson, 1992, redrawn).
Although much lower than the fractured fault, the permeability across the fault is not null. Fluids can propagate at a lower rate outside the fault zone in the porous and fractured rocks that constitute a deformable matrix. Hence, a fluid flow would lead to a porosity transient that propagates in a waveform that could be detected by GNSS sensors and tiltmeters, as Braitenberg et al. (2019) demonstrated for pressure changes in karst conduits (Figure 2).
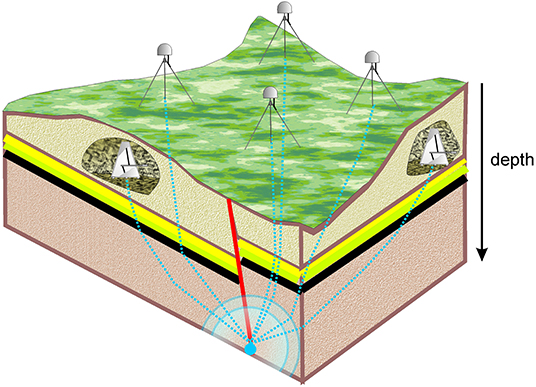
Figure 2. Conceptual model of a porosity wave originating at a fault (red line) and propagating in the hosting rocks. Geodetic instruments, namely, tiltmeters-horizontal pendulums (installed underground, when possible, in natural caves) and GNSS sensors (on the surface) record the induced deformation at different times, depending upon the path of rays, normal to the propagating front (blue dashed lines).
In order to support that the transient signal in the different permanent GNSS stations was due to a porosity wave, and, hence, fluid diffusion, RossiI and RossiII inverted the arrival times of the transient, obtaining both propagation velocity and hydraulic diffusivity values consistent with the fluid diffusion hypothesis, and, from these, they inferred permeability. The permeability values turned out to be consistent with the rocks present in the area: highly permeable dolomitic limestones, low permeable fine-grained limestones, and flysch formations. Such rock formations are involved in the overlapped thrusts and imbricate structures created by several tectonic phases that affected the region of study. The contact between permeable and poorly permeable rocks in a compressive and transpressive tectonic regime can give rise to overpressure conditions favorable to the fault valve behavior (Sibson, 1992, 2014). RossiI and RossiII, based on the location they inferred for the porosity-wave source, close to Bovec (Slovenia), hypothesized a valve behavior of the Ravne fault, a transpressive fault of the External Dinarides, recognized as being responsible for the Bovec–Krn seismic events (1998 Mw = 5.6 at 6.9 km depth; 2004 Mw = 5.1 at 6.1 km depth) (Kastelic et al., 2008). In particular, the transient appeared related to the 2004 earthquake. Unfortunately, there are no GNSS data that could confirm such behavior for the 1998 earthquake.
The hypothesis that the phenomenon reported by RossiI and RossiII is not an isolated episode but could have occurred in the past in the region is at the basis of the present research, focused on re-analysis of old tiltmeter data in light of more recent GNSS observations.
The region, in fact, has also been continuously monitored for over 50 years by the NE-Italy subsurface tilt and strainmeter network (Braitenberg, 1999). The Grotta Gigante horizontal pendulum station has been active since 1964 (Marussi, 1959; Braitenberg et al., 2006), wherein tiltmeters and strainmeters have been installed starting from 1977. In the 3 years before the 1976 Friuli Mw > 6 earthquakes, the Grotta Gigante pendulums recorded “tremors” and an anomalous southward tilt (Chiaruttini and Zadro, 1976; Dragoni et al., 1985). Bonafede et al. (1983) interpreted the tremors in terms of silent earthquakes that originated from the deep non-brittle part of the fault. The frequency is proper for the very low frequency earthquakes (VLFEs) reported by Ito et al. (2007). The suggestion that a transient similar to the 2006–2009 episode could have occurred in the same region in the past came from the observations by Rossi and Zadro (1996) and Zadro and Braitenberg (1999) on long-term variations affecting the signals of the regional tilt-strainmeter network and elastic parameter changes between 1983 and 1986, evidenced by Mao et al. (1989).
Hence, in particular, we focused the analysis on a coherent transient tilt signal, recognizable in the interval 1984–1990, by applying a data-driven approach to the time series. We used the same tomographic approach of RossiI to locate the source of the transient while calculating propagation velocity and hydraulic diffusivity. Finally, we verified whether the associated permeability values are compatible with the rock formation in the region and whether there are conditions for overpressure. To verify the plausibility of the fluid diffusion hypothesis, we also estimated the possible fluid flux through the structures involved in the case analyzed in this study and in the one reported by RossiI and RossiII.
The Tectonic Frame and the Data
Several tectonic phases affected the region, originating different tectonic systems interfering with each other. The primary tectonic systems present in the region are those of the Alpine (with S-directed E–W-striking thrusts) and the Dinaric, represented by the External Dinarides (with NW–SE-oriented dextral transpressive faults) (Slejko et al., 1999; Poljak et al., 2000; Bressan et al., 2007). Originated by the collision between the Adria and Eurasia plates and the counter-clockwise rotation of the former, the two systems merge and intersect in the central part of the region. Here, we record the highest seismic activity (Figure 3), characterized by an intricate pattern of thrusts and strike–slip fault mechanisms, with a compressional axis oriented from NW–SE to NNW–SSE and N-S (Bressan et al., 2018b).
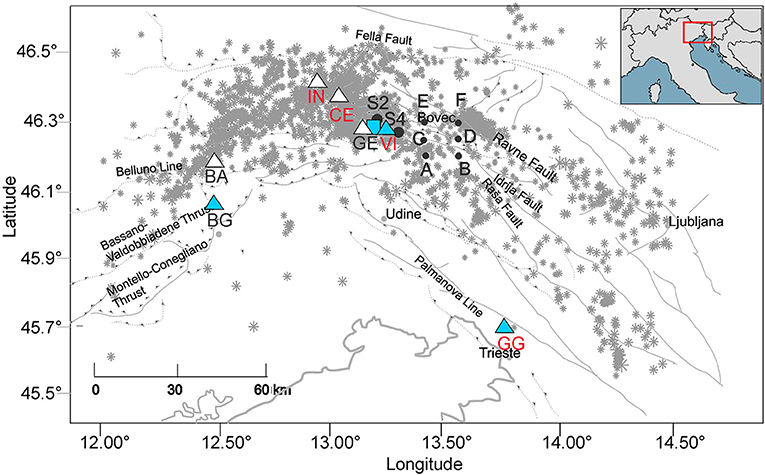
Figure 3. Map with the principal tectonic lineaments and the NE-Italy subsurface tilt and strainmeter network sites: red labels, the sites considered in this study. Blue square: the strainmeter station, presently active; blue triangles: the stations currently active; white triangles: the sites active in the interval 1977–1996. S2, S4: location of the vertical profiles from Faccenda et al. (2007); A,B,C,D,E,F: location of the six vertical profiles extracted from the model of Bressan et al. (2012). Inset: the location of the region of study. Gray stars: earthquakes recorded in 1988–2012 by the National Institute of Oceanography and Applied Geophysics-OGS seismometric networks (NI 10.7914/SN/NI with University of Trieste, and OX 10.7914/SN/OX; Bragato et al., 2021).
The strain field has been continuously monitored for over 50 years by the NE-Italy subsurface tilt and strainmeter network (Braitenberg, 1999). Presently, it consists of two long baseline horizontal pendulums installed in Grotta Gigante (GG), near Trieste (installed in 1959; continuous data:1964–present), and two tiltmeter stations located in the Bus de la Genziana (BG) and Villanova (VI) caves, active since 2005 and 1977, respectively (Figure 3, Table 1; Chiaruttini and Zadro, 1976; Braitenberg, 1999; Zadro and Braitenberg, 1999; Grillo et al., 2018). The VI and BG tiltmeter stations are equipped with two Marussi-type, horizontal pendulums with Zöllner suspension oriented to NS and EW, respectively, with a cast iron conic housing. The nominal angular resolution is 2.5 nrad, and signals are recorded with a sampling rate of 1 h. GG instruments are Zöllner-type horizontal pendulums of exceptional dimensions with an oscillation period of 360 s and an amplification factor of equal to 24,000. VI also hosts three Cambridge wire strainmeters (King and Bilham, 1976) in the N128E, N27E, and N67E directions. The network included at its maximum expansion (1980–1996) four further tiltmeter stations in the Piedmont area of Friuli (CE, BA, IN, and GE) with tiltmeters of the same kind of those in VI and BG (in italic in Table 1; Figure 3).
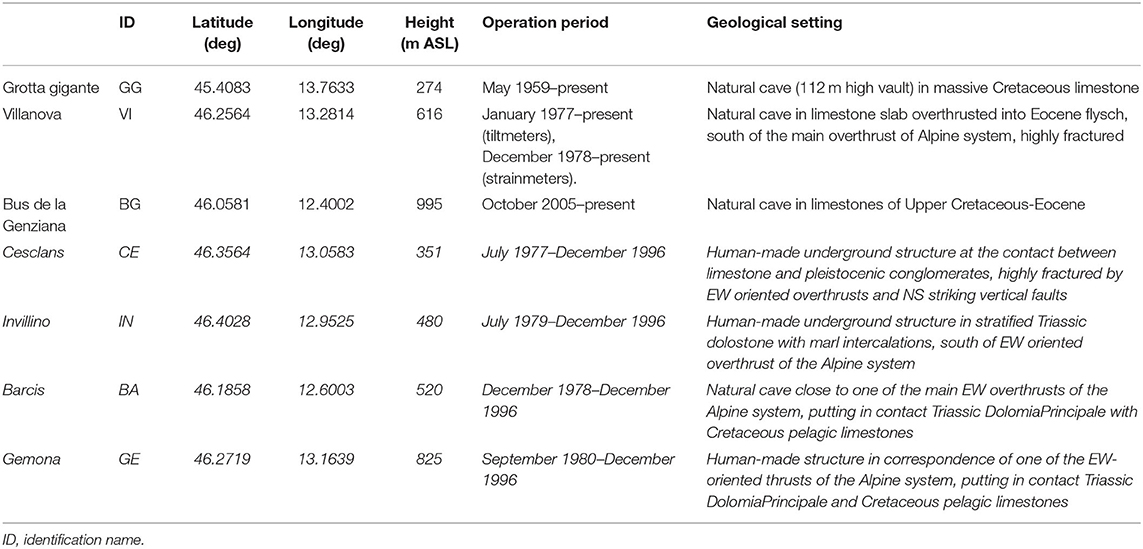
Table 1. Site characteristics of the NE-Italy subsurface tilt-strainmeter network; in italic, the stations that are not presently active.
This study considers the continuous recordings of GG, VI, CE, and IN stations that worked continuously between 1979 and 1996 (Figure 4). Although the raw data have different amplitudes, depending on the instrument and site characteristics (Rossi and Zadro, 1996), some features are recognizable for all stations in the two components (EW and NS). Pluri-annual fluctuations modulate seasonal (annual and semiannual) oscillations. In some cases, a clear linear long-term trend is recognizable (e.g., CE and VI NS-component) (Figure 4). Higher frequency signals (some days) (e.g., in the EW component of VI and GG between the end of 1991 and the beginning of 1992) are correlated to hydrological effects (Braitenberg et al., 2019).
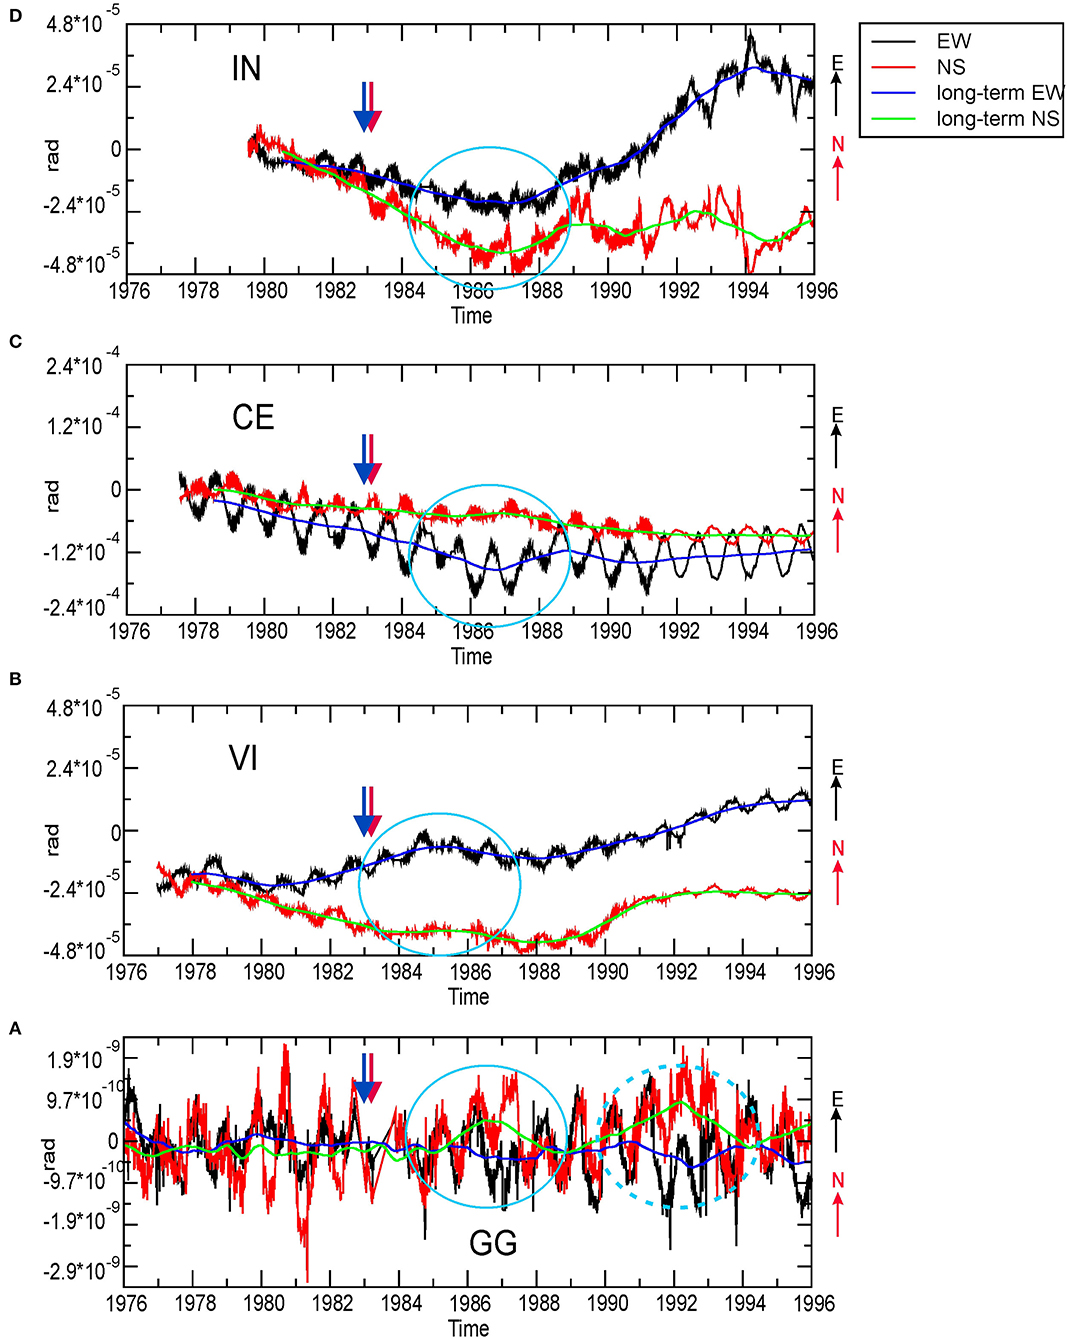
Figure 4. (A–D) Tiltmeter signals for GG, VI, CE, and IN, respectively (1976–1996): original (black and red lines) EW and NS components, and the same, averaged with a running average over 2 years (blue and green lines). The blue ellipse highlights the transient signal; the blue dashed ellipse on GG signals highlights the later transient oscillation. The blue arrow indicates the transient analyzed in this study; the red arrow indicates the 1983, MD = 4.2 Uccea earthquake occurrence. X-axis: time (years). Y-axis: signal amplitude (rad). Positive: North and East, respectively.
The application of a running average over 2 years evidences long-term variations (Figure 4). In particular, one fluctuation with a transient character and that affected all the recordings between 1984 and 1990 is evident (blue ellipse in Figure 4). For GG, we note another higher amplitude fluctuation in the 1989–1994 period (dashed blue ellipse), which will also be analyzed in the following chapter. The search for the direction of the maximum amplitude of the transient for each site requires calculation of the tilt component on directions from N to N165°E, spaced 15°: the signal in the complementary directions (N180°E–N340°E) is easily obtained by merely inverting the sign (Figure 5; RossiI). The 15° spacing enables a first reasonably accurate scan of the direction with the maximum amplitude to be refined later.
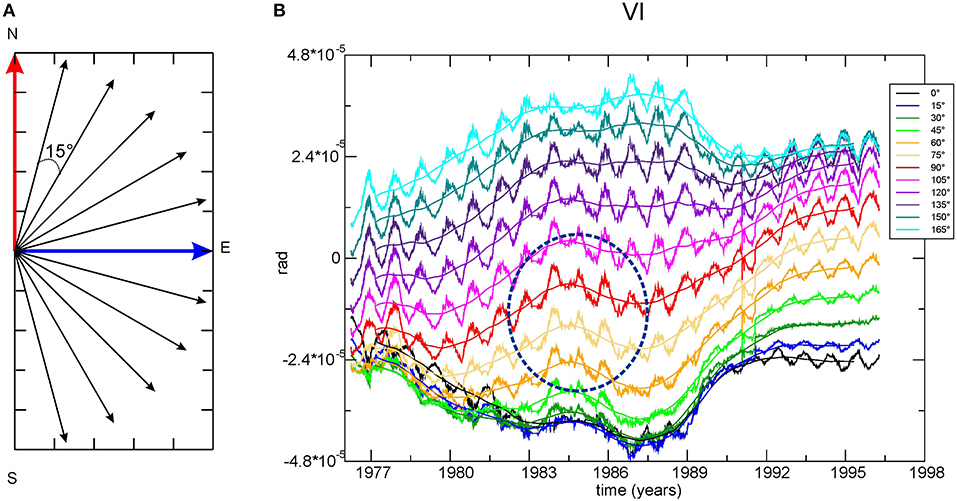
Figure 5. (A) The tilt signal is calculated for directions separated by 15° intervals from N to S, starting from the N–S (red) and E–W (blue) records. (B) Example for VI: the time series calculated for various directions are plotted vs. time: in legend, the color corresponding to each direction. The maximum amplitude of oscillation 1983 and 1986 is recorded in N75 and N90°E directions (dashed blue ellipse). X-axis: time (years). Y-axis: signal amplitude (rad). Positive in the directions written in the legend.
Data Analysis
Time Series Analysis
As shown in Figures 4, 5, the oscillations have transients and likely dispersive characters, so that uprise and duration could change in the different sites. Hence, intending to exploit the time series in its whole length and avoiding the risk of the filtering parameters conditioning the results, in this study we applied a different method from the filtering of RossiI and RossiII: the data-driven empirical mode decomposition (EMD) technique, initially proposed by Huang et al. (1998). Since its introduction, EMD has been successfully applied in various fields (Ditommaso et al., 2012; Zhang et al., 2019). EMD decomposes a noisy, complex signal into a variable number (N) of intrinsic mode functions (IMFs) through an iterative sifting process. Based on the detection of local maxima and minima in the time series, sifting produces a (generally limited) number of IMFs, each containing higher frequency oscillations than the following IMF component. Orthogonality is not a necessary condition of the EMD technique that provides a complete and adaptive basis for expanding linear, non-linear, and non-stationary data.
The original signal x(t) is expressed as
where rn(t) is the residual.
We performed EMD analysis on the projections calculated every 15° (Figure 5). The first 5 IMFs capture the highest frequency signals, including those induced by rainfall, groundwater variations, and co-seismic displacements (red ellipses in original data, IMF1 and IMF2), whereas IMFs 6 and 7 represent the seasonal, periodic, and semi-periodic components (Figure 6). IMF 8 contains a longer wavelength term, dominated by a transient surge, recognizable for all the stations (blue ellipse). For each site, once we found the direction in which IMF 8 shows the maximum amplitude, we repeat the analysis by moving from directions 5 and 10° to North and South, to be sure to find the direction of maximum amplitude of our signal, with an uncertainty of only 5°. The maximum absolute amplitude is recorded in directions N85°E for VI, N135°E for CE, N10°E for IN, and N135°E for GG (blue arrows in Figure 7). The positive tilt is N85°E for VI, N45°W for CE and GG, and N170°W for IN (darker blue). Due to the time delay between the different sites, the image refers to the end of 1985: GG shows a null tilt (light-blue arrow). Transient oscillation is recognizable in the VI signal in 1983–1987, in CE and IN signals in 1984–1988, with slight differences between the two sites, and in the GG signal in 1988–1992. There is a substantial agreement with both the tectonic lineaments existing in the neighbors of the four sites and the directions in which the lower crust background seismicity tends to align, as evidenced by principal component analysis (dashed gray arrows in Figure 7; Bressan et al., 2016, 2019).
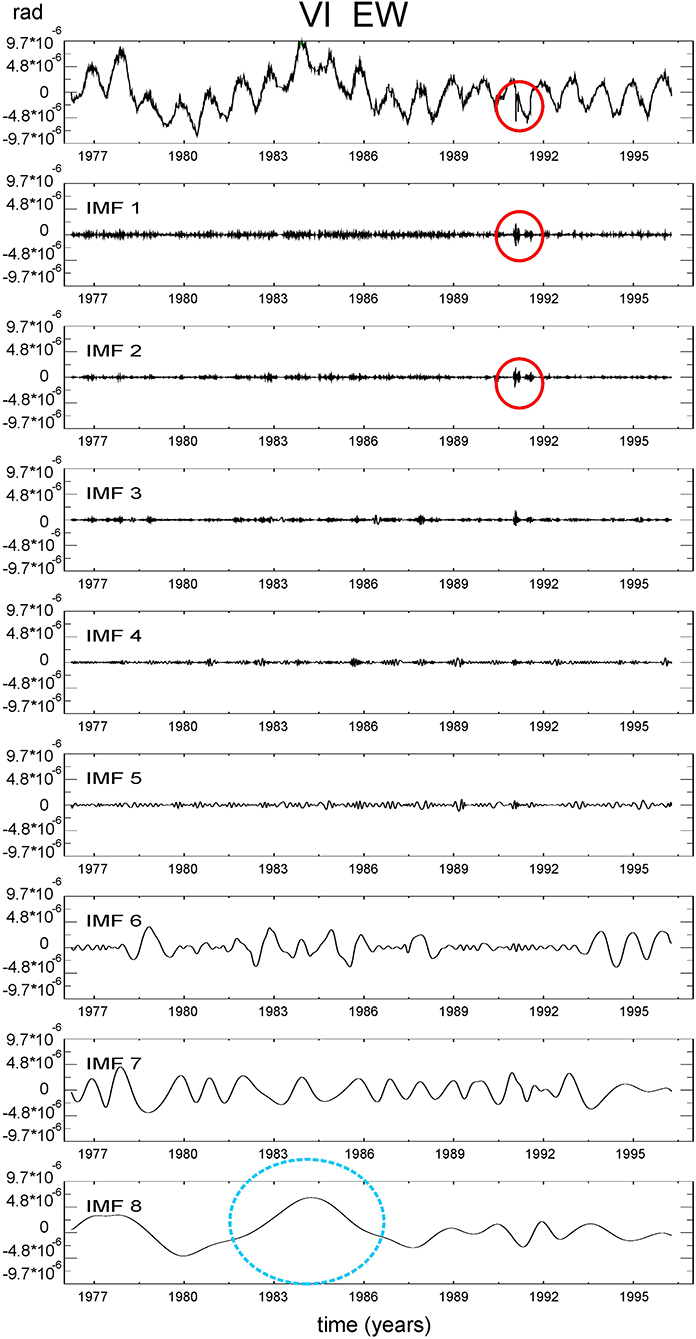
Figure 6. The resulting mode decomposition components from the signal VI (EW): from top to bottom, the original signal, subtracted the long-term trend (the residual of EMD), and the IMFs resulting from EMD: the wavelength of the oscillations increases with the IMF number. IMF1 and IMF2 contain rainfall-induced and co-seismic signals (red ellipse also in the original data). IMF 8 contains the transient of study (fair blue ellipse). Positive: toward East.
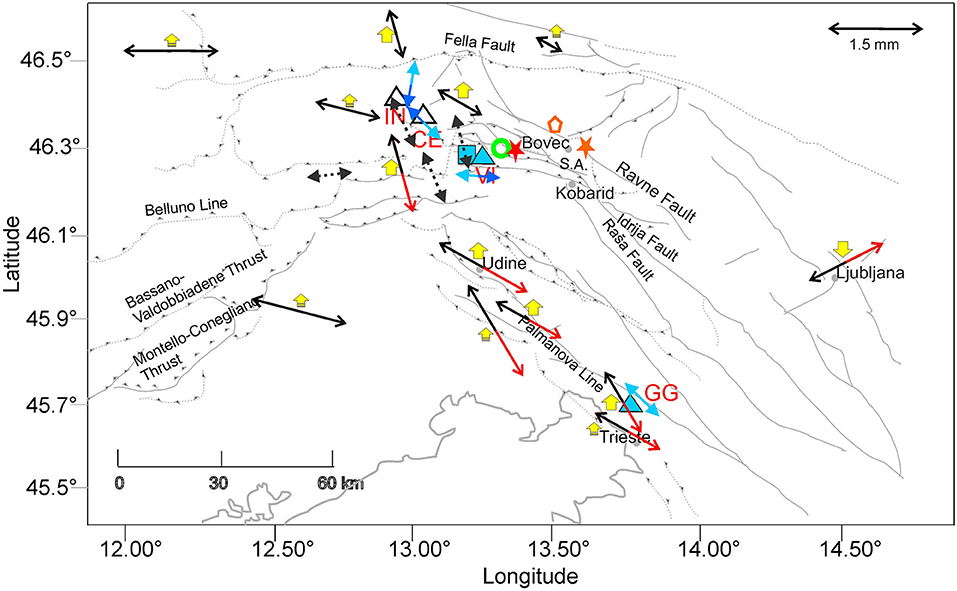
Figure 7. The same map as Figure 3, with indication of the directions of the transient 1984–1990 tilting (blue arrows), of the 2006–2009 GNSS transient displacement (RossiII, red-black arrows, yellow arrows), and of the alignment of the background seismicity (Bressan et al., 2016): gray dashed arrows. 1984–1990 tilting- the map refers to the end of 1985: blue color indicates the positive tilting verse, whereas light blue indicates the negative tilting. A light blue two-sided arrow indicates null tilting. 2006–2009 GNSS displacement- the map refers to June 2008: the red-black arrows indicate the direction of horizontal displacement, red for the positive verse of the displacement, whereas black is the negative displacement. A two-sided black arrow means null horizontal displacement. The vertical displacement is represented by the yellow arrows, indicating up or down movement: if the maximum was not reached in June 2008, the arrow is smaller. Green circle: the origin of the transient analyzed in this study, orange pentagon is the source of the transient analyzed by RossiI and RossiII; red star: 1983, MD = 4.2 Uccea earthquake, 10.8 km depth; orange star: 2004, Mw = 5.1 Bovec–Krn earthquake; 6.1 km depth. SA, South Alpine thrust.
Furthermore, the results are in good agreement with the directions found through the transient analysis that affected the FReDNet GNSS data in the time interval 2006–2009 (red–black arrows for the horizontal component, yellow arrows for the vertical one in Figure 7, RossiII). In this case, due to time propagation of the transient signal, the image refers to a particular moment: June 2008. The stations in which the horizontal signal is null at that moment are represented with a black arrow; whereas in the other cases, the red arrow indicates positive horizontal displacement. Similarly, for vertical displacement, the smaller size of the yellow arrow indicates the cases in which the maximum of transient displacement was not reached in June 2008.
The four tiltmeter time series transient uprise times progressively increase, starting with VI, then with CE and IN northwesterly, and with GG southeasterly (Figure 8). Notably, the transient uprise time in GG is consistent with the 1989–1994 oscillation observed in the original time series (dashed ellipse in Figure 4).
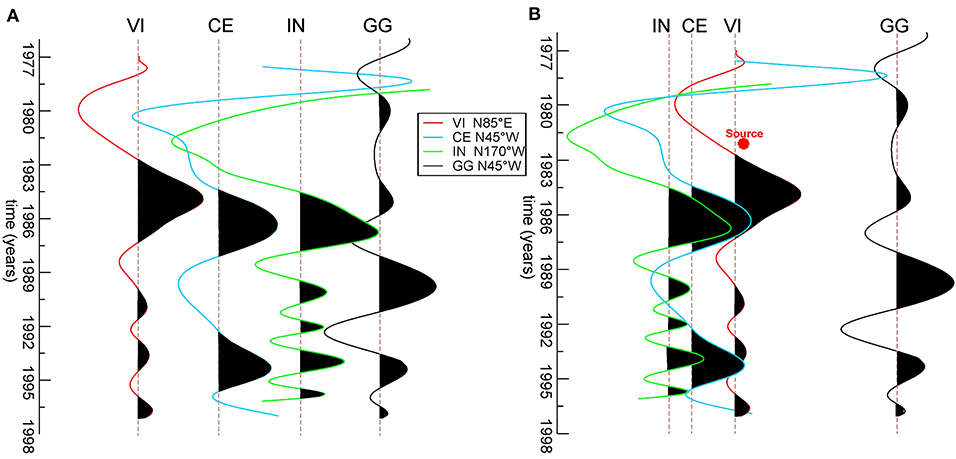
Figure 8. IMF8 for the four stations, in a variable area mode (black area: the positive signal), in the direction in which the transient is maximum and positive. A gain of 104 is applied to the GG signal to allow comparison with the other stations. Vertical axis: time (years). (A) The time series for each station is ordered following the uprise times, with trace interval fixed. (B) The trace interval is proportional to the distance from the calculated source (red star). The traces located to the west of the source of the transient (red star) are on the left, while GG, to the east of the source, on the right.
Transient Source Parameters
To locate the source of the unknown transient (in space and in time), we applied a standard, simplified earthquake location procedure based on circles, whose radii are estimated by the arrival times of the transient and its velocity of propagation (RossiI). We estimated the average propagation velocity based on various distance/differential uprise time ratios between couples of tilt recordings. Then, we refined localization through a tomographic approach, i.e., ray tracing in a stratified medium characterized by laterally varying velocities (Böhm et al., 1999), minimizing the observed and calculated travel time differences. The technique is depicted in Figure 9. For both the frequencies involved and the limited number of observations, we are aware that we are working at the limits of the method. However, the staggered grid procedure limits the drawbacks of inadequate coverage (Vesnaver and Böhm, 2000). Therefore, we initially chose a very coarse grid, consistent with the broad wavelength of the pulses, to have a rough but reliable velocity distribution.
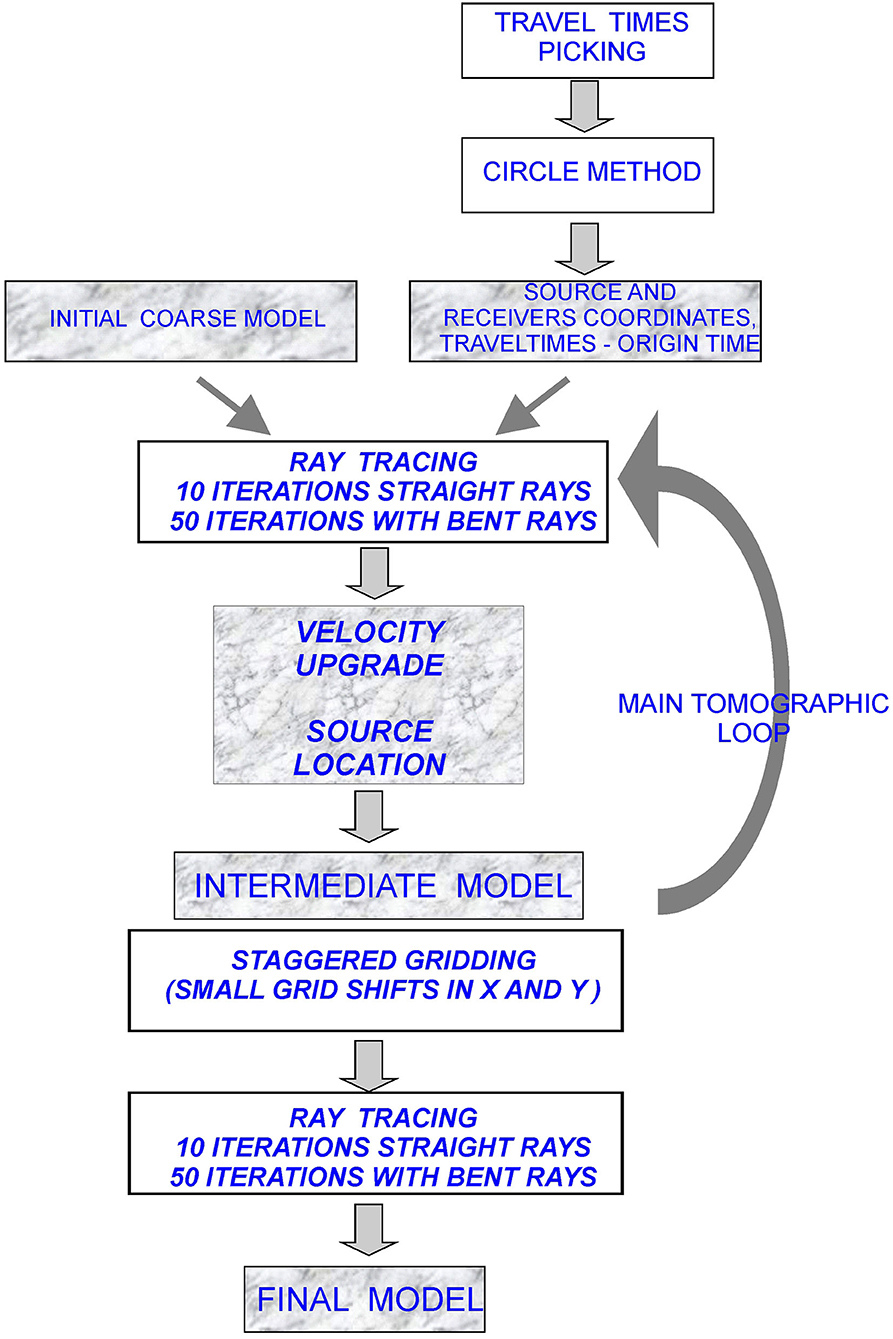
Figure 9. Scheme of the data analysis: retrieval of the source location and origin time (circle method), velocity model refinement (ray tracing method).
We started from the RossiI model (Figure 10A) and performed ray tracing, following the principle of Fermat. The 3D model origin is at 11.8°E, 45.6°N, and it extends to 14.6°E, 46.7° N, from the Moho surface to the topographic surface, with three surfaces in between at average depths of 2, 4, and 11 km, respectively (Rossi I). We refined the velocity model iteratively, together with the source location. When the difference between the observed and calculated travel times was minimal, we applied to the grid small shifts in x and y directions, and repeated the inversion. At the end of the process, we averaged the results, obtaining a higher resolved image without losing the reliability of the original grid (Figure 9; Vesnaver and Böhm, 2000).
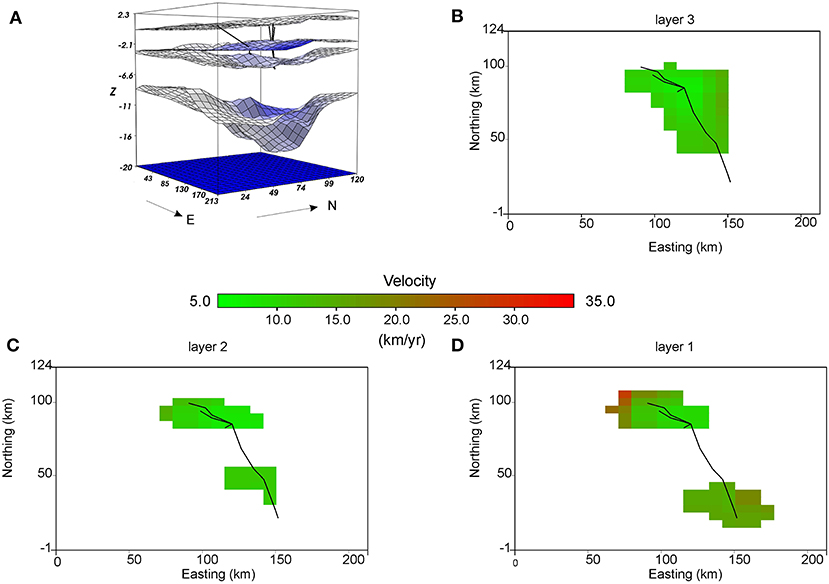
Figure 10. Tomographic inversion. (A) 3D Velocity model, with the rays traced (black lines); (B) plan view of the velocity distribution in the lowermost layer: the pixels with low ray-coverage are masked in white; (C) the same in the intermediate layer; (D) the same in the shallowest layer. Black lines in (A–D) indicate the ray traces. Origin of model:11.8°E, 45.6°N.
The velocities of the final model range between 6.4 and 27 km/year (Figure 10). Notwithstanding the more limited area covered by the rays, the values are close to the ones obtained by RossiI. In the second and third layers, the propagation velocity does not exceed 16 km/year (±0.5 km/year; Figures 10B,C) in the volumes crossed by the rays. The shallowest layer (layer 1) shows the highest velocity values, up to 27 km/year (±0.9 km/year) (Figure 10D). The source of the transient (green circle in Figure 7) is located at 46°16'50.50 “N, 13°19'0.40” E, hence about 5 km to the East of the VI station, at 6 km depth, with an uncertainty of about 7 km in the plane, and 1 km in depth. Low velocities (~8 ± 0.2 km/year) characterize the “hypocentral” area (Figure 10B). Origin time is the end of November 1982 (red star in Figure 8), with an uncertainty of 1.5 months.
Fluid Diffusion
We verified whether the uprise times are compatible with an episode of fluid diffusion in the present case, as in the case reported by RossiI. For this aim, we used the uprise times of the transient as input for hydraulic tomographic inversion to obtain hydraulic diffusivity (Brauchler et al., 2013). We followed the scheme shown in Figure 9, excluding the source location, which is now fixed, and started from the model of hydraulic diffusivity obtained by RossiI. Figure 11 shows the hydraulic diffusivity (Dh) values obtained for the same layers, shown in Figure 10.
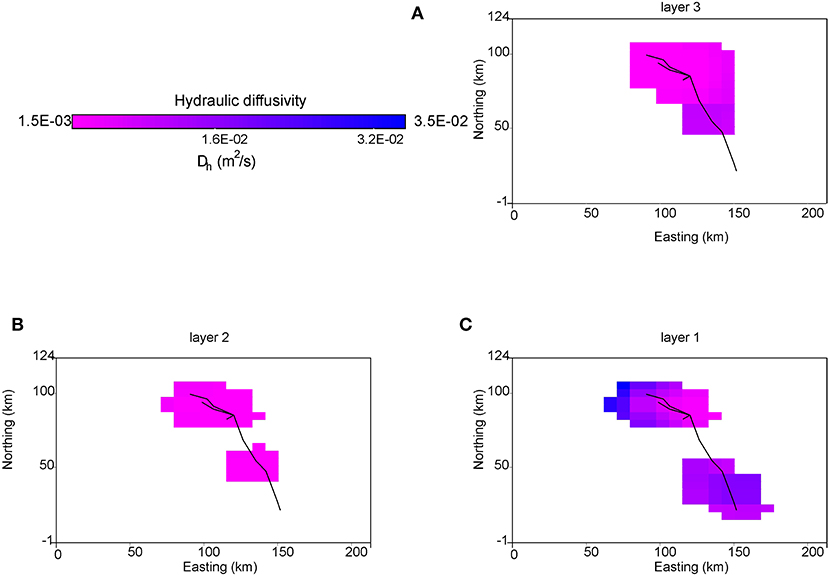
Figure 11. Hydraulic diffusivity tomographic inversion (A) plan view of the diffusivity distribution in the lowermost layer; the pixels with low ray-coverage are masked in white; (B) the same in the intermediate layer; (C) the same in the shallowest layer. Black lines in (A–C) indicate the ray traces. Origin of model:11.8°E, 45.6°N.
The values are in the range 0.1 · 10−3–3.4 · 10−2 m2/s (±.02 · 10−3 m2/s). The highest values are in the first layer (Figure 11C), and the lowest is in the second one (Figure 11B), as observed by RossiI. Since permeability is a physical property for which more measurements are available than hydraulic diffusivity, it is more suitable to compare the obtained values with those that can be expected from the lithology present in the region. The equation binding the two quantities is (Talwani et al., 1999).
where βf, βr, ηf, and ϕ are the fluid and rock compressibility, fluid dynamic viscosity, and rock porosity, respectively, the latter available from a borehole and laboratory measurements (Faccenda et al., 2007). The rays mainly cross the Jurassic limestones and the Cenozoic flysch formations. The finely layered limestones of Jurassic are characterized by permeability values in the order of 10−17 m2, whereas the Cenozoic flysch shows higher permeability (~4 · 10−16 m2) (Table 2).

Table 2. Hydraulic diffusivity (Dh) and permeability (k) calculated for the two regional rock formations crossed by the rays.
The effective stress σ0 associated with the pulse is (RossiI)
where ρf and ρg are the density of fluid and rock, g is the gravity acceleration constant, v is the propagation velocity, and Dh is the hydraulic diffusivity. We chose for the Jurassic limestones and the Cenozoic flysch the propagation velocity and hydraulic diffusivity values in locations where these values can be assumed to be dominant at the depth crossed by the rays, based on the available stratigraphic information (Faccenda et al., 2007; ViDEPI, 2009). In the absence of other information, we assumed water density for fluid density. The density of the grains in the rock ρg values, known from laboratory measurements, are obtained from Table 2 of RossiII.
The effective stress obtained using Equation (2) is quantified as about 19 MPa, with a standard deviation of 0.11 MPa. To see whether this value implies an overpressure condition, we calculated the vertical stress due to lithostatic loading σv:
where Pp is the pore pressure, λ is the pore fluid ratio (Terzaghi, 1923; Hubbert and Rubey, 1959), and ρb is the bulk density of sediment, defined as
We considered the same vertical profiles reported by RossiII, since they are also very close to the source of the transient in this study (A,B,C,D,E,F and S2,S4 in Figure 3). In the present case, given that the origin of the transient is shallower, at a depth of about 6 ± 1.0 km, the lithostatic load is about 167 ± 25 MPa with a standard deviation of ~2.5 MPa. The pore fluid ratio λ is about 0.89 ± 0.01, indicating condition of a supra-hydrostatic state, with pore pressure very close to the lithostatic load.
Discussion
The study of transient variations in deformation requires several years of observations of long-term inter-seismic strain variations, necessary to reveal a particular region or a repetitive behavior of a structure. Since GNSS and interferometric synthetic aperture radar (InSAR) data are limited to the last 20 years, observations on past episodes of slow slip can come from strainmeters, tiltmeters, and dilatometers that had been continuously recorded in the past. This study focused on long-term oscillation of the strain field in NE-Italy observed in the second half of the last century, reported by Rossi and Zadro (1996) and Zadro and Braitenberg (1999), not correlated with meteorological factors, and that has similarities with the recent GNSS observations in the same region (RossiI and RossiII).
We chose the data-driven EMD technique to delineate, at best, transient non-stationary signals in the recordings. This choice has the advantage of avoiding any a priori hypothesis and is independent of any parameter choice while exploiting the time series in its whole length, which is essential when considering transients with some years of duration. The IMF 8 resulting from the tiltmeter data analyses revealed a transient pulse, slowly propagating throughout the region between 1983 and 1987 (Figure 8): the uprise times in the various stations slightly increased from VI to IN—to the west of VI—and to GG— to the east of VI. There is a substantial agreement between the directions of the tilt induced by the transient (blue arrows in Figure 7), the directions found through the analysis of the GNSS data (red-black arrows; RossiII), and the directions in which the background seismicity tends to align (gray dashed arrows; Bressan et al., 2016, 2019). We can argue that the propagation follows the primary fractures, presenting the same orientation (Serpelloni et al., 2016; Peterie et al., 2018).
The velocities range between 6.4 and 27 km/year (Figure 8), in good agreement with the results of RossiI. Such velocities strongly suggest pore pressure diffusion, and a hydraulic tomographic inversion of the surge times in various tiltmeter stations provided the hydraulic diffusivity values: the values range between 0.1 · 10−3 and 3.4 · 10−2 m2/s. The excellent agreement of the derived values for permeability of the Jurassic limestones and Cenozoic sandstones with the values reported in the literature (Hawle et al., 1967; Sibson and Rowland, 2003) strongly supports the hypothesis that the transient signal is the expression of pore fluid pressure diffusion throughout the region.
The origin time (end of November 1982) and the location of the transient source (Figure 7, green circle) indicate a close relationship between fluid surge and the 1983 February 10 MD = 4.2 Uccea earthquake, 6.5 km apart (Figure 7, red star). We can estimate the uncertainty in origin time to about 1.5 months, about 7 km for the location in the plane, and about 1 km in depth. The 2006–2009 origin of the transient (RossiI) (orange pentagon in Figure 7) was located in the northwestward continuation of the Ravne fault, responsible for the 2004 earthquake (Mw = 5.1) (orange star in Figure 7), about 6 km from the epicenter of that earthquake (orange star in Figure 7). The earthquake occurred 3.5 months after the calculated origin time of the transient. In that case, uncertainty in origin time was estimated at about 15 days, whereas the location uncertainty was about 2 km in the horizontal dimension and 0.8 km in depth.
The two sources are <20 km apart, both in the area where the Dinaric fault system crosses and merges with the Alpine one, near the border between NE-Italy and W-Slovenia. In both cases, the effective stress that can be calculated as an origin for the pore fluid pressure surge results low (19 MPa for this case study, 22 MPa for the 2006–2009 one), implying pore pressures about 0.9 the lithostatic one.
These observations suggest that the area mentioned above is subject to fault valve behavior episodes (Sibson, 1992), releasing fluids to the surrounding region as pore pressure bulges. The tectonic style of the area, a complex superposition of thrusting (Alpine) and transpressive structures (the Dinaric ones), is most favorable to fault valve behaviors (Sibson, 2020). The model of Sibson implies accumulation of a volume of high-pressure fluid beneath a low-permeability seal at the base of a fault zone (interseismic period); an earthquake would break the seal, and the fluid would surge upward immediately following the earthquake (Figure 1).
Although the two transients relate to two different faults, some characteristics of the 2004 Bovec–Krn Mw = 5.1 earthquake sequence support the interpretation that, at least in that case, the Ravne fault acted as a valve. Gentili (2010) recognized seismic quiescence preceding the 2004 Mw = 5.1 Bovec–Krn earthquake, which is compatible with an overpressure condition. On the other hand, the depth distribution of the aftershocks that followed the main shock is compatible with upward spreading, as it would be in the case of a fluid discharge (Bressan et al., 2018a). The seismic monitoring network was still limited at the time of the 1983 Uccea earthquake; however, in the preceding year, we observe a reduction in seismic activity close to the forthcoming epicenter. The aftershocks were few and had tendency to become shallower.
Several models have been proposed to relate overpressurized fluids with faulting (Hickman et al., 1995; Faulkner et al., 2010). The model of Rice (1992), formulated to explain the weakening of a fault, implies that a fault zone behaves as an impermeable barrier to the country rocks. A continuous fluid flux from the lower crust maintains high pore pressure. On the contrary, the model of Byerlee (1990) assumes that water from the country rocks saturates a highly permeable fault zone first, and, when the shearing causes fault zone compaction, is released back to the country rocks, until the flow is arrested because of hydrothermal deposition. It results in a complex system of seal-bound compartments and heterogeneous distribution of overpressurized fluids within a fault zone (Khoshmanesh and Shirzaei, 2018).
Some independent observations can help understand which model can be more suitable in describing the phenomenon of study.
As it is known, the state of overpressure can be related to seismic velocities ratio (Vp/Vs) anomalies (Dvorkin et al., 1999; Chiarabba et al., 2018). The source of the transient in this study coincides with a higher value (1.91) (Bressan et al., 2012). The same authors report a value of 1.86 in correspondence with the source of the 2006–2009 transient. Although high Vp/Vs values are proper for limestones and dolomitic limestones, such values can be interpreted as indicative of a state of overpressure. Unfortunately, these values result from the seismic activity analysis over a relatively long period of time, encompassing different phases of the seismic cycle. A different analysis is reported by Mao et al. (1989), who analyzed the seismic velocities in the same region using a sliding time window. They also compared the amplitude of Earth strain tides observed by the three strainmeters located in the VI station with theoretical ones, in 1978–1986, and recovered the elastic parameters. The results from Mao et al. (1989) can be seen in Figure 12, together with the Vp/Vs that we calculated, starting from the velocity values reported in Mao et al. (1989)'s Table 3. It is noteworthy, that they observed changes in velocities and elastic parameters in the same years with a wavelength similar to our transient. In particular, Mao et al. (1989) focused on changes in seismic velocities (3%) and bulk modulus K (50%), started in 1982 and recovered after the 1983 Uccea earthquake, about a year later. The increase in observed bulk modulus (KO), compared with the theoretical one (KT) in correspondence with the earthquake could agree with a state of overpressure at the time of the event. Notably, the Vp/Vs ratio markedly increased from the end of 1982 to the end of 1986, in agreement with the surge in the tilt anomaly in VI. However, the information is relative for a broader part of the region and not limited to a single fault, as, e.g., Chiarabba et al. (2018), and, hence, may reflect pore fluid diffusion through the rock formations hosting the fault. The increase in ratio between the observed shear modulus (μO) and the theoretical one (μT) that we observe from 1980 to 1986 suggests hardening of the rock matrix with time, interrupted by temporary decrease in the course of 1982, in agreement with the pattern shown in Figure 1. We have, however, to remind that the calculation of the shear modulus is strongly affected by the loading tides, and it is unstable, owing to the closeness in values of the two normal strain components of the observed tidal strains (Mao et al., 1989).
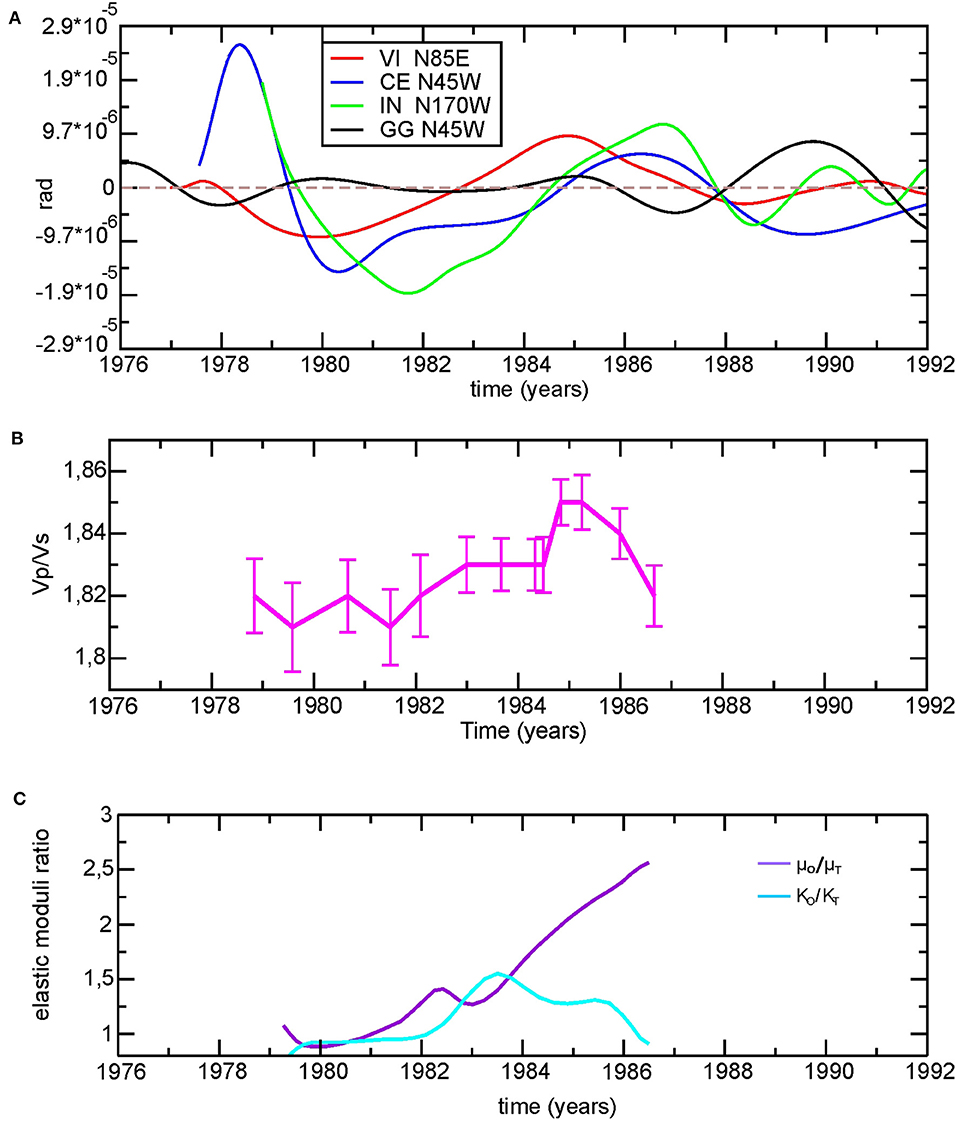
Figure 12. (A) The same curves as Figure 6 (positive, in the direction indicated in the legend). A gain of 104 is applied to the GG signal to allow comparison with the other stations. (B) Vp/Vs from Table 3 of Mao et al. (1989), with the error bars; (C) the ratio between the observed rigidity (μO) and bulk modulus (KO) and the theoretical rigidity (μT) and bulk modulus (KT), from Mao et al. (1989) redrawn.
Our observations, together with the variations in elastic parameters reported by Mao et al. (1989), are in agreement with the time variation in the fluid content, possibly related to compaction-driven porosity and lateral and temporal variations in permeability (Byerlee, 1993; Khoshmanesh and Shirzaei, 2018).
The contribution of meteoric water cannot be excluded in the region of study, characterized by karstic phenomena in outcropping and subsurface formations (Cimolino et al., 2010), implying that complex groundwater flow in the rock matrix, fractures, and conduits also inferred from deformations (Devoti et al., 2015; Braitenberg et al., 2019), as in other regions characterized by karst aquifers (Silverii et al., 2016, 2019). In the present case, based on all the observations presented, the models of Rice (1992) and Byerlee (1993) appear the most suitable.
In the absence of geochemical information, the possibility of a fluid source from crustal deeper parts, as in the model of Rice (1992), could not be excluded. We can estimate the flux rate necessary to maintain the overpressure at depth and verify the plausibility of the values for both cases: the one treated in the present study, and the one reported by RossiI and RossiII. The fluid influx q is defined by David et al. (1994) as
where K0 is the permeability, and ξ is the normalized flux given by
with σ* being the characteristic stress.
We used the permeability values shown in Table 2 for the Jurassic limestones, whereas for permeability and density of the Dolomia Principale and Paleozoic sandstones, not crossed by the rays in this case, we referred to RossiII's Table 2.
In this case, we considered the formations that should be present at the depth of the two transient sources. Table 3 of David et al. (1994) gives the values of σ*: 21.3 MPa for Dolomia Principale and the Jurassic limestones and 26.3 MPa for the Paleozoic sandstones. For the two transients, we obtain the values of ξ in the range 0.21–0.33 for the permeable Dolomia Principale, and in the range 0.53–0.63 when Jurassic limestones or Paleozoic sandstones are considered, in agreement with the values reported by David et al. (1994).
It follows that for both transients the value of the fluid influx q is in the range 0.47–0.65 m/year for the permeable Dolomia Principale and about 0.013–0.015 m/year for the Jurassic limestones, whereas it is 0.023–0.027 m/year for the Paleozoic sandstones. If we use the values of the effective stress we calculated for both transients, instead of σ*, we have a variation of about 8% for ξ and q. The fluid influx values are reasonable compared with the measurements of the mantle fluid flow in different tectonic environments from geochemical measurements: the highest range of values, 0.42–2.6 m/year, is obtained for the Alpine Fault in New Zealand (Menzies et al., 2016), whereas 0.004–0.14 m/year characterizes the San Andreas Fault (Kennedy et al., 1997; Kulongoski et al., 2013), 0.13–0.19 m/year the North Anatolian Fault (de Leeuw et al., 2010), and −0.012–0.019 m/year the Karakoram fault (Klemperer et al., 2013).
To calculate the approximate areas involved in the flux discharge according to the fault valve model, we use the well-known relationships between magnitude and rupture area (Wells and Coppersmith, 1994), considering the February 1983 MD = 4.2 and July 2004 Mw = 5.1 earthquakes. These earthquakes occurred two to three months after the origin of the hypothesized transient. The highest flux discharge corresponds to the more permeable Dolomia Principale (7.2 · 105–4.0 · 106 m3/year), whereas, for the much less permeable Jurassic limestones, near-lithostatic pressure would be maintained even with a flux range of 1.7 . 104–1.1 . 105 m3/year. In all the cases, we obtain the highest values for the 2006–2009 transient and the greater magnitude of the correlated earthquake.
Conclusions
Transient variations in crustal deformation data can potentially detect slow pore fluid pressure propagation and associated effective stress fluctuations. The empirical mode decomposition (EMD) method employed here has been efficient in detecting transient tilt signals. Through the present analysis, we demonstrated that the area at the boundary between NE-Italy and W-Slovenia, where the Dinaric fault system crosses and merges with the Alpine one, strongly supports the recurrence of fault valve behavior, releasing fluids from depth to the surrounding region as pore pressure bulges. The pore fluid pressure appears to have migrated from a depth of 6 km upward and through the surrounding as a porosity wave, as inferred from a strong, coherent tilt transient of about 2.5 years in duration in the direction of the main fractures. At the origin of the fluid release, there are overpressure conditions at depth, with pore pressure ~0.89 the lithostatic one, in agreement with previous and independent observations on elastic parameters and seismic velocity variations. The fluid influx values necessary to maintain such pore pressure values are comparable with other observations in other contexts. Geochemical tracer analysis of the spring water and concretions could help evaluate the budget of meteoric, metamorphic, and mantle fluids. Such information, together with full waveform inversion, more adequate in a near-field case (as for VI and the source of transient), and a pore fluid diffusion model, could better define this complex interaction between fluids, deformation, and seismicity.
Our research provides novel pieces of evidence on the relationship between pore fluid pressure variations and slow slip moderate magnitude events in an area of continental collision. Although based on an almost unique strain data set, our results and observations can help consider phenomena like the ones reported in this study as a possible cause of deformation and seismicity migration patterns in other regions.
Data Availability Statement
The data that support the findings of this study are available upon request from the authors. Requests to access these datasets should be directed to YmVyZ0B1bml0cy5pdA==, YXBhc3RvcnV0dGlAdW5pdHMuaXQ=.
Author Contributions
GR ideated the study, performed data analysis and interpretation of the results, and wrote the manuscript. IN and AP performed the preprocessing of data. CB is responsible for the maintenance of the NE-Italy tilt-strainmeter network of the University of Trieste, and discussed the results and interpretation. SP suggested the EMD technique, designed the EMD software, and participated in EMD data analysis. All the authors read and corrected the manuscript.
Funding
We acknowledge funding by the Italian Ministry of University and Research (MUR) Department of Excellence grant, given to the Department of Mathematics and Geosciences of the University of Trieste (Italy) through which AP is supported.
Conflict of Interest
The authors declare that the research was conducted in the absence of any commercial or financial relationships that could be construed as a potential conflict of interest.
Acknowledgments
We dedicate this study to the memory of Prof. Maria Zadro, who initiated the NE-Italy tilt-strainmeter network of the University of Trieste, and her scientific curiosity that inspired this research. We thank all the technicians and Dr. Barbara Grillo who, through the years, have helped in the management of the network. We thank Dr. Gianni Bressan for constructive discussions and the relocalization of the Uccea and Bovec–Krn earthquakes. We are grateful to Alexandre Canitano, Weijian Mao, Pierre-Michel Rouleau, and the editor, György Hetényi, for the accurate and thorough revision, stimulating comments, and helpful suggestions.
References
Argus, D. F., Fu, Y., and Landerer, F. W. (2014). Seasonal variation in total water storage in California inferred from GPS observations of vertical land motion. Geophys. Res. Lett. 41, 1971–1980. doi: 10.1002/2014GL059570
Böhm, G., Rossi, G., and Vesnaver, A. (1999). Minimum-time ray-tracing for 3D irregular grids. J. Seism. Explor. 8, 117–131.
Bonafede, M., Boschi, E., and Dragoni, M. (1983). Viscoelastic stress relaxation on deep fault sections as a possible source of very long period elastic waves. J. Geophys. Res. 88, 2251–2260. doi: 10.1029/JB088iB03p02251
Bragato, P. L., Comelli, P., Saraò, A., Zuliani, D., Moratto, L., Poggi, V., et al. (2021). The OGS–Northeastern Italy seismic and deformation network: current status and outlook. Seismol. Res. Lett. 92, 1704–1716. doi: 10.1785/0220200372
Braitenberg, C. (1999). The Friuli (NE-Italy) tilt/strain gauges and short term observations. Ann. Geofis. 42, 637–664.
Braitenberg, C., Pivetta, T., Barbolla, D. F., Gabrovšek, F., Devoti, R., and Nagy, I. (2019). Terrain uplift due to natural hydrologic overpressure in karstic conduits. Sci. Rep. 9:3934. doi: 10.1038/s41598-019-38814-1
Braitenberg, C., Romeo, G., Taccetti, Q., and Nagy, I. (2006). The very-broad-band long-base tiltmeters of Grotta Gigante (Trieste, Italy): Secular term tilting and the great Sumatra-Andaman islands earthquake of December 26, 2004. J. Geodyn. 41, 164–174. doi: 10.1016/j.jog.2005.08.015
Brauchler, R., Böhm, G., Leven, C., Dietrich, P., and Sauter, M. (2013). A laboratory study of tracer tomography. Hydrogeol. J. 21, 1265–1274. doi: 10.1007/s10040-013-1006-z
Bressan, G., Barnaba, C., Bragato, P., Ponton, M., and Restivo, A. (2018b). Revised seismotectonic model of NE Italy and W Slovenia based on focal mechanism inversion. J. Seismol. 22, 1563–1578. doi: 10.1007/s10950-018-9785-2
Bressan, G., Barnaba, C., Bragato, P. L., Peresan, A., Rossi, G., and Urban, S. (2019). Distretti sismici del Friuli Venezia Giulia. Boll. Geof. Teor. Appl. 60, S1–S74. doi: 10.4430/bgta0300
Bressan, G., Barnaba, C., Magrin, A., and Rossi, G. (2018a). A study on off-fault aftershock pattern at N-Adria microplate. J. Seismol. 22, 863–881. doi: 10.1007/s10950-018-9737-x
Bressan, G., Gentile, G. F., Tondi, R., De Franco, R., and Urban, S. (2012). Sequential integrated inversion of tomographic images and gravity data: an application to the Friuli area (north-eastern Italy). Boll. Geof. Teor. Appl. 53, 193–212. doi: 10.4430/bgta0059
Bressan, G., Kravanja, S., and Franceschina, G. (2007). Source parameters and stress release of seismic sequences occurred in the Friuli-Venezia Giulia region (Northeastern Italy) and in Western Slovenia. Phys. EarthPlanet. Inter. 160, 192–214. doi: 10.1016/j.pepi.2006.10.005
Bressan, G., Ponton, M., Rossi, G., and Urban, S. (2016). Spatial organization of seismicity and fracture pattern in NE Italy and W Slovenia. J. Seismol. 20, 511–534. doi: 10.1007/s10950-015-9541-9
Bürgmann, R. (2018). The geophysics, geology and mechanics of slow fault slip. Earth Planet. Sci. Lett. 495, 112–134. doi: 10.1016/j.epsl.2018.04.062
Byerlee, J. (1990). Friction, overpressure and fault normal compression. Geophys. Res. Lett. 17, 2109–2112. doi: 10.1029/GL017i012p02109
Byerlee, J. (1993). Model for episodic flow of high-pressure water in fault zones before earthquakes. Geology 21, 303–306. doi: 10.1130/0091-7613(1993)021<0303:MFEFOH>2.3.CO;2
Cervelli, P., Segall, P., Johnson, K., Lisowski, M., and Miklius, A. (2002). Sudden aseismic fault slip on the south flank of Kilauea volcano. Nature 415, 1014–1018. doi: 10.1038/4151014a
Chanard, K., Métois, M., Rebischung, P., and Avouac, J.-P. (2020). A warning against over-interpretation of seasonal signals measured by the global navigation satellite system. Nat. Commun. 11:1375. doi: 10.1038/s41467-020-15100-7
Chiarabba, C., Gori, P. D., Cattaneo, M., Spallarossa, D., and Segou, M. (2018). Faults geometry and the role of fluids in the 2016–2017 Central Italy seismic sequence. Geophys. Res. Lett. 45, 6963–6971. doi: 10.1029/2018GL077485
Chiaruttini, C., and Zadro, M. (1976). Horizontal pendulum observations at Trieste. Boll. Geofis. Teor. Appl. 19, 441–455.
Cimolino, A., Della Vedova, B., Nicolich, R., Barison, E., and Brancatelli, G. (2010). New evidence of the outer Dinaric deformation front in the Grado area (NE-Italy). Rend. Fis. Acc. Lincei 21, 167–179. doi: 10.1007/s12210-010-0096-y
Connolly, J. A. D., and Podladchikov, Y. Y. (2013). “A Hydromechanical Model for Lower Crustal Fluid Flow,” in Metasomatism and the Chemical Transformation of Rock: The Role of Fluids in Terrestrial and Extraterrestrial Processes, eds D. E. Harlov, and H. Austrheim (Berlin: Springer), 599–658. doi: 10.1007/978-3-642-28394-9_14
Console, R., Murru, M., Vannoli, P., Carluccio, R., Taroni, M., and Falcone, G. (2020). Physics-based simulation of sequences with multiple main shocks in Central Italy. Geophys. J. Int. 223, 526–542. doi: 10.1093/gji/ggaa300
Craig, T. J., Chanard, K., and Calais, E. (2017). Hydrologically-driven crustal stresses and seismicity in the New Madrid Seismic Zone. Nat. Commun. 8:2143. doi: 10.1038/s41467-017-01696-w
Cruz-Atienza, V. M., Villafuerte, C., and Bhat, H. S. (2018). Rapid tremor migration and pore-pressure waves in subduction zones. Nat. Commun. 9:2900. doi: 10.1038/s41467-018-05150-3
D'Agostino, N., Silverii, F., Amoroso, O., Convertito, V., Fiorillo, F., Ventafridda, G., et al. (2018). Crustal deformation and seismicity modulated by groundwater recharge of karst aquifers. Geophys. Res. Lett. 45, 253–262. doi: 10.1029/2018GL079794
David, C., Wong, T.-F., Zhu, W., and Zhang, J. (1994). Laboratory measurement of compaction-induced permeability change in porous rocks: implications for the generation and maintenance of pore pressure excess in the crust. Pure Appl. Geophys. 143, 425–456. doi: 10.1007/BF00874337
de Leeuw, G. A. M., Hilton, D. R., Güleç, N., and Mutlu, H. (2010). Regional and temporal variations in CO2/3He, 3He/4He and δ13C along the North Anatolian Fault Zone, Turkey. Appl. Geochem. 25, 524–539. doi: 10.1016/j.apgeochem.2010.01.010
Devoti, R., Riguzzi, F., Cinti, F. R., and Ventura, G. (2018). Long-term strain oscillations related to the hydrological interaction between aquifers in intra-mountain basins: a case study from Apennines chain (Italy). Earth Planet. Sci. Lett. 501, 1–12. doi: 10.1016/j.epsl.2018.08.014
Devoti, R., Zuliani, D., Braitenberg, C., Fabris, P., and Grillo, B. (2015). Hydrologically induced slope deformations detected by GPS and clinometric surveys in the Cansiglio Plateau, southern Alps. Earth Planet. Sci. Lett. 419, 134–142. doi: 10.1016/j.epsl.2015.03.023
Ditommaso, R., Mucciarelli, M., Parolai, S., and Picozzi, M. (2012). Monitoring the structural dynamic response of a masonry tower: comparing classical and time-frequency analyses. Bull. Earthquake Eng. 10, 1221–1235. doi: 10.1007/s10518-012-9347-x
Dragert, H. (2001). A silent slip event on the deeper Cascadia subduction interface. Science 292, 1525–1528. doi: 10.1126/science.1060152
Dragoni, M., Bonafede, M., and Boschi, E. (1985). “On the Interpretation of Slow Ground Deformation Precursory to the 1976 Friuli Earthquake,” in Earthquake Prediction, eds K. Shimazaki, and W. Stuart (Basel: Birkhäuser Basel), 781–792. doi: 10.1007/978-3-0348-6245-5_3
Dvorkin, J., Mavko, G., and Nur, A. (1999). Overpressure detection from compressional- and shear-wave data. Geophys. Res. Lett. 26, 3417–3420. doi: 10.1029/1999GL008382
Faccenda, M., Bressan, G., and Burlini, L. (2007). Seismic properties of the upper crust in the central Friuli area (northeastern Italy) based on petrophysical data. Tectonophysics 445, 210–226. doi: 10.1016/j.tecto.2007.08.004
Farrell, W. E. (1972). Deformation of the earth by surface loads. Rev. Geophys. 10, 761–797. doi: 10.1029/RG010i003p00761
Faulkner, D. R., Jackson, C. A. L., Lunn, R. J., Schlische, R. W., Shipton, Z. K., Wibberley, C. A. J., et al. (2010). A review of recent developments concerning the structure, mechanics and fluid flow properties of fault zones. J. Struct. Geol. Fault Zones 32, 1557–1575. doi: 10.1016/j.jsg.2010.06.009
Fischer, T., Matyska, C., and Heinicke, J. (2017). Earthquake-enhanced permeability - evidence from carbon dioxide release following the ML 3.5 earthquake in West Bohemia. Earth Planet. Sci. Lett. 460, 60–67. doi: 10.1016/j.epsl.2016.12.001
Gentili, S. (2010). Distribution of seismicity before the larger earthquakes in Italy in the time interval 1994–2004. Pure Appl. Geophys. 167, 933–958. doi: 10.1007/s00024-010-0089-x
Grillo, B., Braitenberg, C., Nagy, I., Devoti, R., Zuliani, D., and Fabris, P. (2018). Cansiglio Karst Plateau: 10 Years of Geodetic–Hydrological Observations in Seismically Active Northeast Italy. Pure Appl. Geophys. 175, 1765–1781. doi: 10.1007/s00024-018-1860-7
Hawle, H., Kratochvil, H., Schmied, H., and Wieseneder, H. (1967). “Reservoir geology of the carbonate oil and gas reservoir of the Vienna Basin,” in 7th World Petroleum Congress (Mexico City: OnePetro).
Hickman, S., Sibson, R., and Bruhn, R. (1995). Introduction to special section: mechanical involvement of fluids in faulting. Pure Appl. Geophys. 100, 12831–12840. doi: 10.1029/95JB01121
Huang, N. E., Shen, Z., Long, S. R., Wu, M. C., Shih, H. H., Zheng, Q., et al. (1998). The empirical mode decomposition and the Hilbert spectrum for nonlinear and non-stationary time series analysis. Proc. R. Soc. Lond. A 454, 903–995. doi: 10.1098/rspa.1998.0193
Hubbert, M. K., and Rubey, W. W. (1959). Role of fluid pressure in mechanics of overthrust faulting. Mechanics of fluid-filled porous solids and its application to overthrust faulting. Geol. Soc. Am. Bull. 70, 115–166. doi: 10.1130/0016-7606(1959)70[115:ROFPIM]2.0.CO;2
Ito, Y., Obara, K., Shiomi, K., Sekine, S., and Hirose, H. (2007). Slow earthquakes coincident with episodic tremors and slow slip events. Science 315, 503–506. doi: 10.1126/science.1134454
Ji, K. H., and Herring, T. A. (2012). Correlation between changes in groundwater levels and surface deformation from GPS measurements in the San Gabriel Valley, California. Geophys. Res. Lett. 39, L01301. doi: 10.1029/2011GL050195
Kastelic, V., Vrabec, M., Cunningham, D., and Gosar, A. (2008). Neo-Alpine structural evolution and present-day tectonic activity of the eastern Southern Alps: the case of the Ravne Fault, NW Slovenia. J. Struct. Geol. 30, 963–975. doi: 10.1016/j.jsg.2008.03.009
Kennedy, B. M., Kharaka, Y. K., Evans, W. C., Ellwood, A., DePaolo, D. J., Thordsen, J., et al. (1997). Mantle fluids in the San Andreas Fault System, California. Science 278, 1278–1281. doi: 10.1126/science.278.5341.1278
Khoshmanesh, M., and Shirzaei, M. (2018). Episodic creep events on the San Andreas Fault caused by pore pressure variations. Nat. Geosci. 11, 610–614. doi: 10.1038/s41561-018-0160-2
King, G., and Bilham, R. (1976). A geophysical wire strainmeter. Bull. Seismol. Soc. Am. 66, 2039–2047.
Klemperer, S. L., Kennedy, B. M., Sastry, S. R., Makovsky, Y., Harinarayana, T., and Leech, M. L. (2013). Mantle fluids in the Karakoram fault: Helium isotope evidence. Earth Planet. Sci. Lett. 366, 59–70. doi: 10.1016/j.epsl.2013.01.013
Kodaira, S. (2004). High pore fluid pressure may cause silent slip in the Nankai Trough. Science 304, 1295–1298. doi: 10.1126/science.1096535
Kulongoski, J. T., Hilton, D. R., Barry, P. H., Esser, B. K., Hillegonds, D., and Belitz, K. (2013). Volatile fluxes through the Big Bend section of the San Andreas Fault, California: Helium and carbon-dioxide systematics. Chem. Geol. 339, 92–102. doi: 10.1016/j.chemgeo.2012.09.007
Longuevergne, L., Florsch, N., Boudin, F., Oudin, L., and Camerlynck, C. (2009). Tilt and strain deformation induced by hydrologically active natural fractures: application to the tiltmeters installed in Sainte-Croix-aux-Mines observatory (France). Geophys. J. Int. 178, 667–677. doi: 10.1111/j.1365-246X.2009.04197.x
Lowry, A. R., Larson, K. M., Kostoglodov, V., and Bilham, R. (2001). Transient fault slip in Guerrero, southern Mexico. Geophys. Res. Lett. 28, 3753–3756. doi: 10.1029/2001GL013238
Lupi, M., Geiger, S., and Graham, C. M. (2011). Numerical simulations of seismicity-induced fluid flow in the Tjörnes Fracture Zone, Iceland. J. Geophys. Res. 116:B07101. doi: 10.1029/2010JB007732
Mao, W. J., Ebblin, C., and Zadro, M. (1989). Evidence for variations of mechanical properties in the Friuli seismic area. Tectonophysics 170, 231–242. doi: 10.1016/0040-1951(89)90273-4
Marussi, A. (1959). “The University of Trieste station for the study of the tides of the vertical in the Grotta Gigante,” in Proceedings of the III International Symposium on Earth Tides (Trieste), 45–52.
Matsumoto, Y., Yoshida, K., Matsuzawa, T., and Hasegawa, A. (2021). Fault-valve behavior estimated from intensive foreshocks and aftershocks of the 2017 M 5.3 Kagoshima Bay earthquake sequence, Kyushu, southern Japan. J. Geophys. Res. Solid Earth. 126:e2020JB020278. doi: 10.1029/2020JB020278
Menzies, C. D., Teagle, D. A. H., Niedermann, S., Cox, S. C., Craw, D., and Zimmer, M. (2016). The fluid budget of a continental plate boundary fault: Quantification from the Alpine Fault, New Zealand. Earth Planet. Sci. Lett. 445, 125–135. doi: 10.1016/j.epsl.2016.03.046
Nakajima, J., and Uchida, N. (2018). Repeated drainage from megathrusts during episodic slow slip. Nat. Geosci. 11, 351–356. doi: 10.1038/s41561-018-0090-z
Nespoli, M., Belardinelli, M. E., Gualandi, A., Serpelloni, E., and Bonafede, M. (2018). Poroelasticity and fluid flow modeling for the 2012 Emilia-Romagna earthquakes: hints from GPS and InSAR data. Geofluids 2018:e4160570. doi: 10.1155/2018/4160570
Panda, D., Kundu, B., Gahalaut, V. K., Bürgmann, R., Jha, B., Asaithambi, R., et al. (2018). Seasonal modulation of deep slow-slip and earthquakes on the Main Himalayan Thrust. Nat. Commun. 9:4140. doi: 10.1038/s41467-018-06371-2
Panda, D., Kundu, B., Gahalaut, V. K., Bürgmann, R., Jha, B., Asaithambi, R., et al. (2020). Reply to “A warning against over-interpretation of seasonal signals measured by the Global Navigation Satellite System.” Nat. Commun. 11:1376. doi: 10.1038/s41467-020-15103-4
Peterie, S. L., Miller, R. D., Intfen, J. W., and Gonzales, J. B. (2018). Earthquakes in Kansas induced by extremely far-field pressure diffusion. Geophys. Res. Lett. 45, 1395–1401. doi: 10.1002/2017GL076334
Poljak, M., Živčić, M., and Zupančič, P. (2000). “The seismotectonic characteristics of Slovenia,” in Seismic Hazard of the Circum-Pannonian Region, eds G. F. Panza, M. Radulian, and C. I. Trifu (Basel: Birkhäuser Basel), 37–55. doi: 10.1007/978-3-0348-8415-0_3
Revil, A., and Cathles, L. M. (2002). Fluid transport by solitary waves along growing faults: A field example from the South Eugene Island Basin, Gulf of Mexico. Earth Planet. Sci. Lett. 202, 321–335. doi: 10.1016/S0012-821X(02)00784-7
Rice, J. R. (1992). “Chapter 20: fault stress states, pore pressure distributions, and the weakness of the San Andreas Fault,” in International Geophysics, Fault Mechanics and Transport Properties of Rocks, eds B. Evans and T. F. Wong. International Geophysics (London: Academic Press), 51, 475–503. doi: 10.1016/S0074-6142(08)62835-1
Riel, B., Simons, M., Agram, P., and Zhan, Z. (2014). Detecting transient signals in geodetic time series using sparse estimation techniques. J. Geophys. Res. Solid Earth 119, 5140–5160. doi: 10.1002/2014JB011077
Rossi, G., Fabris, P., and Zuliani, D. (2018). Overpressure and fluid diffusion causing non-hydrological transient GNSS displacements. Pure Appl. Geophys. 175, 1869–1888. doi: 10.1007/s00024-017-1712-x
Rossi, G., and Zadro, M. (1996). Long-term crustal deformations in NE Italy revealed by tilt-strain gauges. Phys. Earth Planet. Inter. 97, 55–70. doi: 10.1016/0031-9201(96)03166-4
Rossi, G., Zuliani, D., and Fabris, P. (2016). Long-term GNSS measurements from the northern Adria microplate reveal fault-induced fluid mobilization. Tectonophysics 690, 142–159. doi: 10.1016/j.tecto.2016.04.031
Rossi, G., Zuliani, D., and Fabris, P. (2017). Corrigendum to “Long-term GNSS measurements from the northern Adria microplate reveal fault-induced fluid mobilization.” Tectonophysics 694, 486–487. doi: 10.1016/j.tecto.2016.10.035
Serpelloni, E., Pintori, F., Gualandi, A., Scoccimarro, E., Cavaliere, A., Anderlini, L., et al. (2018). Hydrologically induced karst deformation: insights from GPS measurements in the Adria-Eurasia plate boundary zone. J. Geophys. Res. Solid Earth 123, 4413–4430. doi: 10.1002/2017JB015252
Serpelloni, E., Vannucci, G., Anderlini, L., and Bennett, R. A. (2016). Kinematics, seismotectonics and seismic potential of the eastern sector of the European Alps from GPS and seismic deformation data. Tectonophysics 688, 157–181. doi: 10.1016/j.tecto.2016.09.026
Sibson, R. H. (1992). Implications of fault-valve behaviour for rupture nucleation and recurrence. Tectonophysics 211, 283–293. doi: 10.1016/0040-1951(92)90065-E
Sibson, R. H. (2014). Earthquake rupturing in fluid-overpressured crust: how common? Pure Appl. Geophys. 171, 2867–2885. doi: 10.1007/s00024-014-0838-3
Sibson, R. H. (2020). Preparation zones for large crustal earthquakes consequent on fault-valve action. Earth Planets Space 72:31. doi: 10.1186/s40623-020-01153-x
Sibson, R. H., and Rowland, J. V. (2003). Stress, fluid pressure and structural permeability in seismogenic crust, North Island, New Zealand. Geophys. J. Int. 154, 584–594. doi: 10.1046/j.1365-246X.2003.01965.x
Silverii, F., D'Agostino, N., Borsa, A. A., Calcaterra, S., Gambino, P., Giuliani, R., et al. (2019). Transient crustal deformation from karst aquifers hydrology in the Apennines (Italy). Earth Planet. Sci. Lett. 506, 23–37. doi: 10.1016/j.epsl.2018.10.019
Silverii, F., D'Agostino, N., Métois, M., Fiorillo, F., and Ventafridda, G. (2016). Transient deformation of karst aquifers due to seasonal and multiyear groundwater variations observed by GPS in southern Apennines (Italy). J. Geophys. Res. Solid Earth 121, 8315–8337. doi: 10.1002/2016JB013361
Skarbek, R. M., and Rempel, A. W. (2016). Dehydration-induced porosity waves and episodic tremor and slip: Porosity waves and ETS. Geochem. Geophys. Geosys. 17, 442–469. doi: 10.1002/2015GC006155
Slejko, D., Neri, G., Orozova, I., Renner, G., and Wyss, M. (1999). Stress field in Friuli (NE Italy) from fault plane solutions of activity following the 1976 main shock. Bull. Seismol. Soc. Am. 89, 1037–1052.
Talwani, P., Cobb, J. S., and Schaeffer, M. F. (1999). In situ measurements of hydraulic properties of a shear zone in northwestern South Carolina. J. Geophys. Res. 104, 14993–15003. doi: 10.1029/1999JB900059
Terzaghi, K. (1923). Die Berechnung der Durchlässigkeitsziffer des Tones aus dem Verlauf der hydrodynamischen Spannungserscheinungen. Akad. Wissenschaft. Wien 132, 125–138.
van Dam, T., Wahr, J., and Lavallée, D. (2007). A comparison of annual vertical crustal displacements from GPS and gravity recovery and climate experiment (GRACE) over Europe. J. Geophys. Res. 112:B03404. doi: 10.1029/2006JB004335
Vesnaver, A., and Böhm, G. (2000). Staggered or adapted grids for seismic tomography? Lead. Edge 19, 944–950. doi: 10.1190/1.1438762
ViDEPI (2009). Visibilità Dei Dati Afferenti All'attività Di Esplorazione Petrolifera in Italia, Società Geologica Italiana. Available online at: https://unmig.mise.gov.it/index.php/it/dati/ricerca-e-coltivazione-di-idrocarburi/dati-storici-videpi (accessed November 19, 2020).
Wahr, J., Khan, S. A., van Dam, T., Liu, L., van Angelen, J. H., van den Broeke, M. R., et al. (2013). The use of GPS horizontals for loading studies, with applications to northern California and southeast Greenland: GPS horizontals for loading studies. J. Geophys. Res. Solid Earth 118, 1795–1806. doi: 10.1002/jgrb.50104
Watson, K. M., Bock, Y., and Sandwell, D. T. (2002). Satellite interferometric observations of displacements associated with seasonal groundwater in the Los Angeles basin: INSAR and GPS Observations of Los Angeles Basin. J. Geophys. Res. 107, ETG 8-1–ETG 8-15. doi: 10.1029/2001JB000470
Wells, D. L., and Coppersmith, K. J. (1994). New empirical relationships among magnitude, rupture length, rupture width, rupture area, and surface displacement. Bull. Seismol. Soc. Am. 84, 974–1002.
Zadro, M., and Braitenberg, C. (1999). Measurements and interpretations of tilt–strain gauges in seismically active areas. Earth Sci. Rev. 47, 151–187. doi: 10.1016/S0012-8252(99)00028-8
Keywords: tiltmeter, transient signal, EMD analysis, hydrogeophysics, fault-valve behavior, porosity wave propagation
Citation: Rossi G, Pastorutti A, Nagy I, Braitenberg C and Parolai S (2021) Recurrence of Fault Valve Behavior in a Continental Collision Area: Evidence From Tilt/Strain Measurements in Northern Adria. Front. Earth Sci. 9:641416. doi: 10.3389/feart.2021.641416
Received: 14 December 2020; Accepted: 19 April 2021;
Published: 02 June 2021.
Edited by:
György Hetényi, University of Lausanne, SwitzerlandReviewed by:
Alexandre Canitano, Academia Sinica, TaiwanWeijian Mao, Innovation Academy for Precision Measurement Science and Technology (CAS), China
Pierre-Michel Rouleau, Memorial University of Newfoundland, Canada
Copyright © 2021 Rossi, Pastorutti, Nagy, Braitenberg and Parolai. This is an open-access article distributed under the terms of the Creative Commons Attribution License (CC BY). The use, distribution or reproduction in other forums is permitted, provided the original author(s) and the copyright owner(s) are credited and that the original publication in this journal is cited, in accordance with accepted academic practice. No use, distribution or reproduction is permitted which does not comply with these terms.
*Correspondence: Giuliana Rossi, Z3Jvc3NpQGlub2dzLml0
 Giuliana Rossi
 Alberto Pastorutti
 Ildiko Nagy
 Carla Braitenberg
 Stefano Parolai