 Diandong Ren
 Aixue Hu
- 1School of Electrical Engineering, Computing and Mathematical Sciences, Curtin University, Perth, WA, Australia
- 2CGD/NCAR, Boulder, CO, United States
The widely used 15-year Gravity Recovery and Climate Experiment (GRACE) measured mass redistribution shows an increasing trend in the nontidal Earth’s moment of inertia (MOI). Various contributing components are independently evaluated using five high-quality atmospheric reanalysis datasets and a novelty numerical modeling system. We found a steady, statistically robust (passed a two-tailed t-test at p = 0.04 for dof = 15) rate of MOI increase reaching ∼11.0 × 1027 kg m2/yr, equivalent to a 11.45 s
Introduction
In recent decades, the net top-of-atmosphere energy imbalance reached 1 W m−2 (Trenberth and Fasullo 2013; Hu and Bates 2018). With the increased energy accumulation, the thermodynamic structure of the atmosphere has been substantially altered. Consequently, the hydrological cycle, ocean circulation, and the cryospheric dynamics have all been changed. According to IPCC (2019), the ocean heat content (0–200 m depth) had increased at a rate of 8–18 × 1021 J/yr. The polar ice sheets respond to this climate change by increasing creeping and other related total mass shedding mechanisms (Ren and Leslie, 2011). As mountain glaciers retreat [e.g., Ren and Karoly (2006)], significant portions of solid water locked at certain latitudes and altitudes become liquid water and are redistributed into global oceans or drained into reservoirs (such as soil moisture and groundwater). The kinetic energy of winds is very unevenly distributed spatially and is concentrated in polar and subtropical jet streams. Subtropical jet stream changes have an important influence on the angular momentum of the earth system (Lee et al., 2019). Polar jet streams influence mid-latitude weather systems, with the storm tracks being essentially a surface expression of the jet stream. What makes the situation compelling is that the mid-latitude meridional temperature gradients are being modified by anthropogenic climate change (Ren 2010; Vallis et al., 2015) and the jet streams are expected to further adjust in response to these changes (Francis and Vavrus, 2012; Haarsma et al., 2013; Francis and Vavrus, 2015).
Although the kinetic energy eventually dissipated in the boundary layer, perpetual effects on the Earth can result from the associated mass redistribution, affecting the Earth’s moment of inertia (MOI). The MOI determines its spin speed, and changes of MOI have important impacts on space missions and remote sensing projects, including the Gravity Recovery and Climate Experiment (GRACE). For example, the GPS schemes have to take into consideration of the Chandler’s wobble. Except for the tidal effects from the Moon, the MOI fluctuates as the mass distribution of the Earth system, including the solid earth, oceans, atmosphere, and the soil moisture/groundwater adapts. Ren and Leslie (2019) also found that atmospheric column’s center of mass is being lifted, due to climate warming, especially for the vast tropical and subtropical areas. This center of mass moving away from the Earth’s axis of rotation increases the MOI. The water locked in the polar ice sheets, after being released to the oceans and spread globally, produces a generic mass redistribution to lower latitudes, again moving farther from the axis of rotation, and also increasing the MOI. The increasing ice sheet mass loss is ongoing and the tendency likely continues (Ren et al., 2011b; Ren et al., 2012; Rignot and Kanagaratnam, 2006), unless human beings could drastically reduce (or even sequester some of) the greenhouse gas emissions. If the overall Bowen ratio does not change much, a warming climate will enhance the global total precipitation because the warmer climate would enhance evaporation and warmer air can hold more water vapor (Pendergrass et al., 2019). Although the regional distribution of this precipitation change is uncertain, a shift of rainbands to higher latitudes is likely (Putnam and Broecker, 2017) and also could induce MOI fluctuations.
Geodetic and gravimetric data had recently been used to estimate the mass redistribution induced changes of MOI and hence on the length of day (e.g., Munk 2002; Mitrovica et al., 2006; Adhikari and Ivins 2016). The GRACE measures temporal gravity variations from which mass changes over the globe can be inferred. This makes GRACE data well-suited for deducing total MOI variations (e.g., Seoane et al., 2012). In this study, GRACE measurements, for 2002–2017, are used to identify persistent influences during the 15-year period, with a focus on estimating the contribution of climate-driven MOI evolution in a warming climate. Then, the total MOI variations and the various contributors are analyzed using the Scalable Extensible Geofluid Modeling framework for ENvironmenTal (SEGMENT, Ren et al., 2008; Ren et al., 2012; Ren 2014) issues modeling system. The SEGMENT is used as the backbone modeling system in this study. It had successfully been applied to the Antarctic ice sheet (AIS, Ren et al., 2012) and the Greenland ice sheet [GrIS, Ren et al., (2011a,b)] for the ice sheet total mass balance, to world mountain regions for landslides and debris flow studies [e.g., Ren 2004], and to various faults for earthquake mechanism studies (Ren 2019). Identifying those persistent contributors during this 15-year period assists estimation of climate-driven MOI evolutions in the transient climate change period.
Data and Methods
Since the focus of this study is the MOI fluctuations caused by the near surface, climate sensitive mass transport phenomena, such as from the altered hydrological cycle, atmospheric expansion, and cryospheric mass balances, multiple data sources and advanced modeling systems are needed to estimate the total MOI and various contributing components. Because mass changes integrate spatially, GRACE has advantages in rapid measuring net mass balance over vast regions including the polar ice sheets, provides mass change rates by repeated measurements over the observation period. Indeed, measuring the gravity anomaly at monthly temporal frequency and ∼3-degree spatial resolution (Vishwakarma et al., 2018), the GRACE provides an ideal way for measuring the evolving of Earth’s MOI. Here, a total MOI curve is estimated from the GRACE measurements. Data from the Jet Propulsion Laboratory (JPL) global mascon solution (Watkins et al., 2015), available at grace.jpl.nasa.gov, are used in this research. The GRACE measures temporal variations of gravity, from which regional mass budgets can be deduced. For many applications involving mass fluxes, the traditional procedure of direct using of spherical harmonics has its limitations (Luthcke et al., 2013; Save et al., 2016; Tapley et al., 2019). Mass concentration blocks (mascons) basis functions typically are used to better estimate mass flux from GRACE measurements. The JPL mascon used in this study (Watkins et al., 2015) applied explicit partial derivatives with analytical expression for the mass concentration to relate the intersatellite range-rate measurements to the individual mascons. Specifically, it is solved on three by three degrees equal area elements, even though the final products are interpolated to 0.5 by 0.5 degrees grids. Water equivalent mass flux data are actually used here. For this purpose, a separate scale factor dataset is used, which is derived from the community land surface model predicted terrestrial water storage changes. The scale factors, which also are on 0.5 by 0.5 degrees grids, are multiplied to the mascons to eventually obtain the mass grids in units of equivalent water depth. The post glacial rebound (PGR) effects, also called glacial isostatic adjustment (GIA), are removed from the mascon solution using model predictions.
Spheric harmonic treatments and filtering operations are spatial operations (Wahr et al., 1998; Swenson and Wahr, 2006; Duan et al., 2009; Longuevergne et al., 2010; Frappart et al., 2011; Wouters et al., 2014) and do not affect global total mass conservation. Because mass changes integrate spatially, GRACE has advantages in rapid measuring net mass balance over vast regions including polar ice sheets, provides mass change rates by repeated measurements over the observation period. (E.g. Chen et al., 2006; Velicogna and Wahr, 2006; Ren et al., 2011a; Luthcke et al., 2013; Bamber et al., 2018; Shepherd et al., 2018). Similarly, understanding of the groundwater distribution (Famiglietti et al., 2011; Long et al., 2013) and (both long-term mean and time variable components) ocean bottom pressure fluctuations (Chambers and Willis 2010; Chambers and Bonin 2012) had been aided by the GRACE mascons solutions. These are direct proofs that mascon solutions are suitable for estimating MOI variations. Because the way MOI anomaly is calculated (see Appendix) based on these data, whether or not taking anomalies of these raw data does not matter. In addition to JPL mascons solution, data from the other two official GRACE data processing centers, the University of Texas Austin’s Center for Space Research (CSR, based on the RL05 GSM solutions, which are solved as gravity changes with respect to the mean static gravity model; http://www2.csr.utexas.edu/grace/RL05_mascons.html), and the Goddard Space Flight Center (GSFC/NASA; https://earth.gsfc.nasa.gov/geo/data/grace-mascons) mascons solutions also are referenced for an intercomparison. Due to aging of the twin-polar orbiters or other technical issues, data within a calendar year occasionally are not full 12-months. For example, there are only 10 months’ data in years 2011 and 2012. From 2012 onward, there are only 9 months’ worth of data. Because there are only 8 months’ data in 2002 and the quality of data in 2017 is questionable, the GSFC data covers only 2003–2016. An arbitrary shift is necessary to make the MOI curve comparable with those from JPL and CSR. As stated earlier, this does not matter for our research purpose on examining non-tidal MOI evolutions.
Given that the primary aim of this study is quantifying MOI contributions from various components, the evaluation of the MOI components is either directly from atmospheric parameters, or is obtained using atmospheric parameters as forcing to the SEGMENT modeling system. For example, driven by atmospheric parameters, the SEGMENT is used to simulate groundwater fluctuations and ice mass loss from the cryosphere. Atmospheric parameters in this study are from reanalysis datasets. In a reanalysis system, conventional and remotely sensed meteorological observations are assimilated by a weather forecast system to produce a global and physically consistent picture of the state of the atmosphere (e.g. Dessler 2010). Five reanalysis products used here are the European Centre for Medium-Range Weather Forecasts interim reanalysis (ERA-Interim reanalysis; Dee et al., 2011), ERA5, the NCEP/NCAR reanalysis (e.g., Kalnay et al., 1996), the NASA’s Modern Era Retrospective analysis for Research and Applications (MERRA; Suarez, 2008), and the JRA-55 reanalysis (Kobayashi et al., 2015), at respectively horizontal resolutions of 0.75°, 0.25º, 2.5°, 0.625° × 0.5°, and 1.25°. The use of five independently produced reanalysis datasets allow us to quantify the sensitivity of our results to uncertainties in the state of the atmospheric forcing. Six hourly data from 1980 to 2017 are used, which fully covers the period of GRACE measurements (2002–2017). The reason for restricting the temporal coverage to the remote sensing era is the large uncertainty in southern hemisphere data before the satellite era due to the lack of observational coverage (e.g., Le Marshall et al., 2013). Time series of globally integrated surface pressure are examined to guarantee the total mass conservation in each reanalysis dataset.
Mass changes in polar ice sheets and mountain glaciers (MGs) are, collectively, the cryospheric response to net energy budget changes. GrIS, AIS, and MGs experience drastically different circulation regimes since they are located at different latitudes (e.g., Ren and Karoly 2006). For example, with a rising anthropogenic forcing, the observed warming is quite different between the southern and northern hemispheres so far, so that the polar amplifications are still absent over AIS but pretty obvious over GrIS. Consequently, the surface melt caused mass loss from AIS is still insignificant (most of the ice loss is through ice flow and tabular calving). Although the destination of cryospheric mass loss is in global oceans, the MOI effects from mountain glaciers, especially those located at lower latitudes, may not be as significant as mass lost from polar ice sheets, since the redistributed mass is mostly shifted to much lower latitudes, leading to a rising sea level everywhere (Chapter 13 in IPCC AR5). Because AIS and GrIS are located at higher latitudes, their mass loss to global oceans (as freshwater runoff to oceans and icebergs) may have far more salient MOI signature than the same amount of mass loss from mid-low latitude MGs. Thus, differentiating cryosphere contribution into GrIS, AIS and MGs are necessary to provide a clear partition of MOI variations. Here, the mass balance of AIS and GrIS is derived using SEGMENT, whereas mass loss from MGs is estimated using a force-restore type model (Ren and Karoly 2008). Eqs A1–A3 are then applied to estimate the MOI anomalies.
In this study, the abrupt mass redistribution directly from tectonic earthquakes is not estimated. We use SEGMENT models’ crown solid earth setting (Ren and Fu 2019). The mass underneath 500 km are assumed to remain unchanged. The upper 500 km spherical crown is same as the Advanced Solver for Problems in Earth’s ConvecTion (ASPECT; Kronbichler et al., 2012). SEGMENT has finer surface topography than ASPECTS. This global usage of SEGMENT provides a reference value of the Earth’s MOI as 8.04 × 1037 kg m2 and also ensures that the near surface mass redistribution over global oceans satisfies the gravity field requirements. It is known that the ocean will rapidly adjust to a mass anomaly (as due to melt land ice) through the propagation of gravity waves and will reach a new global equilibrium within several months (Lorbacher et al., 2012). The time to reach equilibrium can be neglected because we are interested in variations of MOI on far longer time scales. For the MOI anomaly estimation, it is more accurate than using a fixed geoid model or simply assuming the WGS84 ellipsoid. Because components of the temporal varying gravity anomalies in GRACE are independently evaluated using modeling approaches driven by observed atmospheric parameters, solid earth mass adjustments are left as residuals or are effectively isolated. Soil and groundwater fluctuations are estimated using the SEGMENT model with daily precipitation input from Global Historical Climatology Network version 2 (GHCN-D v2, https://data.nodc.noaa.gov/cgi bin/iso?id=gov.noaa.ncdc:C00861; Behnke et al., 2016; Menne et al., 2011) and other atmospheric parameters from atmospheric reanalysis.
Results
The annual mean MOIs from GRACE measurements and the estimated contributing components are presented in Figure 1. The annual MOI values are plotted relative to the 2002 annual mean, instead of the temporal means over the period from April 2002 through August 2017, so that the starting value is zero. This does not affect the estimation of trends. Except for SM, all other components contribute steadily to an increase in MOI. As to absolute value in contribution, AIS is the largest contributor. Through the increased creeping of the ice sheet, AIS loses a similar amount of ice to oceans to GrIS (Velicogna and Wahr 2006; Chen et al., 2008; Ren et al., 2011a, Ren et al., 2013). However, because it is located at higher latitudes than GrIS, its mass loss to oceans signifies more salient increase in the Earth’s MOI. GrIS is the second largest contributor to the increase of MOI, about an order of magnitude larger than mountain glaciers and that from elevated center of mass of the Earth’s atmosphere. Polar amplification so far is more salient in the northern hemisphere than in the southern hemisphere, primarily because the relative low temperature at Antarctica does not kick starts the albedo feedback (Charney et al., 1981) yet. Once this mechanism is also activated in the future, for example, as a result of more ground surface exposure from ice cover retreats (or simply the appearance of seasonal ice surface melting), AIS may play an even more important role in modulating the Earth’s MOI.
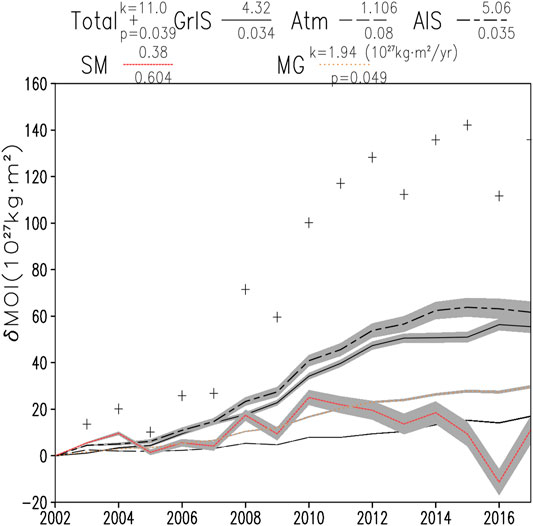
FIGURE 1. Variations of the Earth’s MOI during 2002–2017. Cross markers are MOI estimates based on GRACE measurements of mass anomalies. Curves of different styles are, respectively, contributor components estimated independently using reanalysis or from the SEGMENT model with reanalysis atmospheric parameters as input. The residuals are ascribed to solid earth contributed signal and simulation errors. Shades around the curves represent the uncertainty from the four reanalysis sources. Except the curve for hydrological contribution, which has a statistically insignificant slope of 0.43 s
A unique feature of the contribution from the soil moisture and groundwater is that its annual variation is in phase with the total MOI as indicated by GRACE measurements. In other words, it is the most dynamic contributor to fluctuations in MOI. For a regional area, the enhanced mass can be a result of increased precipitation or enhanced soil moisture/groundwater retention ability. The root mechanism still is not clear but a plausible explanation might be that most of the major earthquakes during this period happened in lower latitudes, the energy released, through some mechanisms, enhanced precipitation distribution in lower latitudes. This might explain the spikes. Each spike (from earthquakes) elevated the MOI to a new, higher level. For example, the moderate 2004 spike that is related to the Indian Ocean earthquake (Sumatra Earthquake 2004), would have caused the length of day to shorten by 3 microseconds and restored somewhat as a response to the upper mantle material. The 2008 Wenchuan, 2011 Tōhoku, 2012 Aceh, and 2015 Nepal earthquakes all left apparent marks on the MOI time series. Without these spikes, the trend of the soil moisture contribution would be slightly decreased, agree with a polar shift of precipitation as climate warms (Dore, 2005; Solomon et al., 2007; Putnam and Broecker, 2017). There are post-seismic evidences of enhanced water retention capability of aquifers, through various hydrologic processes induced by earthquake-induced changes in hydrologic and mechanical properties of the crust (e.g., Ingebritsen and Manga 2019). Very recently, Zhang et al. (2019) found that earthquakes can increase aquifer and aquitard permeabilities by fracturing/compaction, implying an enhanced groundwater retention. According to them, the mass disturbance is ∼1.1–4.7 km3 for the 2010 Chilean earthquake. But the spike on the GRACE curve is >10 km3, suggesting there are other indirect effects on the fluid sphere from tectonic earthquakes. Over the 15-year period, negative contributions are likely, but one large enough to cancel the increasing trend from other components is not supported by the GRACE observations. As pointed out by a referee, earthquakes and other solid earth signals impact the GRACE products as an apparent equivalent water change. How to properly differentiate these signals are challenging but rewarding research directions of earthquake hydrology.
Although the contribution from atmospheric warming is the smallest one among the four, the upward trend is steady and started well before 2002 (Supplementary Figure S1). For the entire meteorological remote sensing era (1979-present), there is essentially no significant negative contribution. The MOI fluctuation associated with the expansion of ocean, contained in the GRACE measurements, and may bear a striking resemblance to that of the atmospheric expansion, is not separated out here. The magnitude reported by Landerer et al. (2007) is a good reference as it is on the same order of magnitude (−0.6
The gravimetry data from GRACE are a mixture of mass transport signal including water transport on the Earth’s surface and solid earth motions (e.g., major earthquakes over the subduction zones and glacial isostatic adjustment processes; Tapley et al., 2019). In this study, except the indirect effects on the hydrological cycle (e.g., enhanced groundwater retention and local precipitation), the direct effect from earthquakes (e.g., associated tectonic motion-caused mass redistribution) is left in the residuals. To determine if the trends are statistically significant, a two-tailed t-test is performed for each time series, by looking at two consecutive periods (2002–2009) and (2010–2017). Linear trends also are estimated for each component. The values of a linear trend (in 1027 kg m2/yr of MOI
After our correction, the global total mass balance is well preserved by both (CSR and JPL) mascon solutions. However, the spatial distribution patterns of the mass flux are different and so are the MOIs. The global total MOI trend estimated using CSR mascon solutions is shown in Figure 2. It is clear that the two solutions differ only quantitatively. Especially, the short-term spikes associated with hydrological patterns linked with major earthquakes (e.g., the 2006 spike associated with the Nepal earthquakes; Ren and Fu, 2019) agree very well. Repeating the above analyses using the CSR mascon solutions gives qualitatively the same conclusions as drawn here from using the JPL mascon solutions. The mascon solution from the GSFC, although following yet another different philosophy, gives an MOI evolution curve closely resembling those from CSR and JPL mascon solutions. The trend identified in the total MOI thus is a consensus among the three mascon solutions and likely a robust signal from a warming climate.
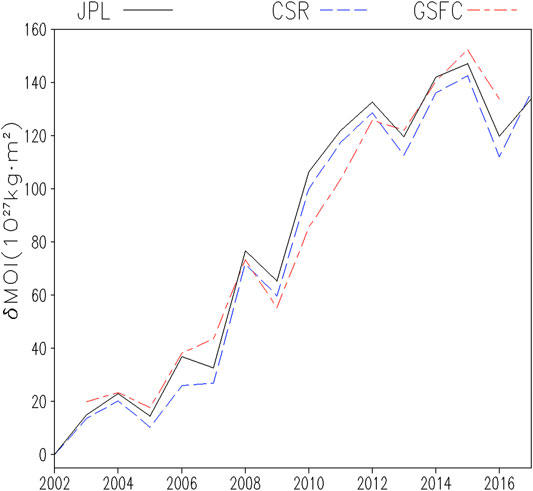
FIGURE 2. Evolution of the Earth’s MOI during 2002–2017, using the 2002 annual mean as a reference. The black line is the estimated MOI based on JPL GRACE mascon mass anomalies (identical to the cross marks in Figure 1). The blue dashed line is from CSR RL06 mascon solutions. The red dot-dashed line is from GSFC mascon solution with PGR signal removed using Peltier et al. (2015) model. Because the GSFC mascon solutions are available only during 2003–2016, an arbitrary shift was fitted to the curve to make it comparable to the other two curves.
We are now in an interglacial period, with the last glacial maximum (LGM) occurred ∼20K years ago, natural variability warrants a vestige of deglaciation: GIA, the ongoing response of the solid Earth to past changes in ice–ocean surface loading. Since GIA is already account for in the GRACE observations. The above discussed components are indeed superimposed on the background signal from GIA. Peltier et al. (2015) deduced GIA are shown in Fig. S2. GIA-caused lifting is especially significant over regions where ice sheets have thinned since the last LGM (e.g., west Antarctic peninsula and northern part of North America). Using Eq. A2, the GIA-caused mass redistribution signifies a global total MOI decreasing rate of 2 × 1026 kg•m2/yr. This rate is almost two orders of magnitude smaller compared with AIS contribution (Figure 1). Thus, the straight line of a small slope (almost indiscernible from the x-axis) is not shown in Figure 1 for clarity. Due to the much larger viscosity of the upper mantle and crust than ice and water, the GIA is a much slower but steady contributor to MOI. At the time scale we are looking at, GIA is insignificant. However, when examining the MOI changes over secular or longer time scales, the accumulated contribution from GIA should be dominant and must be taken in to account (e.g., Munk, 2002; Seoane et al., 2012; Adhikari and Ivins, 2016).
Conclusion
Despite its design lifetime of less than a decade, the GRACE mission provided about 15 years of quality data. Errors in raw GRACE total mass variations were identified and corrected. The primary error source is from satellite aging and secondarily the MOI positive feedback as discussed here. Error-corrected GRACE measurements are used to determine the total nontidal MOI fluctuations over 2002–2017. The advanced modeling system is used to quantify contributions from various components. In this study, we found that the mass shed from the polar ice sheets, mountain glacier retreats, and the atmospheric fluctuations (horizontal systematic redistribution and uplift of the mass center of the atmosphere) all contribute to an increased MOI and hence the slowing down of the rotation of the earth. GRACE measurements provided us a chance to estimate the overall changes to MOI during the 15-year period. Components of the time series are analyzed, and it is found that the abrupt changes in MOI correspond well with major earthquakes. Instead of the relocation of crust and the upper mantle material, it is the associated groundwater or precipitation redistribution that contributed dominantly to the MOI fluctuations. This may be the other facet of the relation between droughts and major earthquakes (e.g., Ren and Fu 2019). Especially the dynamic nature of permeability, as revealed by coseismic and post-seismic hydrologic phenomena (Ingebritsen et al., 2006), has implications for groundwater systems in the fault vicinity. With advances in earthquake hydrogeology, an actively developing subfield of geophysics and geodesy, quantitatively single out the earthquake contribution to MOI is possible in the near future. Thus far, sea-level rise and mass redistribution effects on MOI had been actively studied (e.g., Munk, 2002; Mitrovica et al., 2006; Seoane et al., 2012; Adhikari and Ivins, 2016). In contrast, other components are still insufficiently considered (e.g., the land hydrological cycle) or completely overlooked (e.g., the expansion of the Earth’s atmosphere). Although we still cannot claim a complete decomposition of the total MOI trend, other mechanisms represented in the residual term should played a secondary role in the MOI evolution during the GRACE observational period.
There is statistically significant (p = 0.039) total MOI increase during this 15-year period. The steady increase in MOI has five major contributors. The top two contributors are AIS and GrIS, both trends passed two-tailed t-test at p = 0.035 (dof = 15). Considered together, linear trend of the polar ice sheets reaches 9.5 × 1027 kg m2/yr (equivalent to 10.34
Data Availability Statement
Publicly available datasets were analyzed in this study. This data can be found here: https://earth.gsfc.nasa.gov/geo/data/grace-masconst.
Author Contributions
DR and AH designed the study, performed the analysis, and wrote the paper together.
Funding
Portions of this study were supported by the Regional and Global Model Analysis (RGMA) component of the Earth and Environmental System Modeling Program of the U.S. Department of Energy’s Office of Biological and Environmental Research (BER) via National Science Foundation IA 1844590. The National Center for Atmospheric Research is sponsored by the National Science Foundation of the United States.
Conflict of Interest
The authors declare that the research was conducted in the absence of any commercial or financial relationships that could be construed as a potential conflict of interest.
Publisher’s Note
All claims expressed in this article are solely those of the authors and do not necessarily represent those of their affiliated organizations, or those of the publisher, the editors and the reviewers. Any product that may be evaluated in this article, or claim that may be made by its manufacturer, is not guaranteed or endorsed by the publisher.
Acknowledgments
We thank Professors Yiquan Qi and Zhaomin Wang (BAS and Hohai University), and Jianli Chen (CSR) for constructive comments that significantly improved the manuscript. Lance M. Leslie (UTS) professionally edited the text. The data involved in this study are the 0.5-degree GRACE measurements publicly available from the JPL website https://grace.jpl.nasa.gov at the time of writing this paper (GRACETEllus.JPL.200204_201706. GLO.RL05M_1. MSCNv02. nc). The reanalysis data are all open to public from esteemed data centers and are available through Dee et al. (2011) (ERA5 and ERA interim: https://www.ecmwf.int/en/forecasts/datasets/reanalysis-datasets/era-interim), Kalnay et al. (1996) (NCEP/NCAR reanalysis 2: https://psl.noaa.gov/data/gridded/data.ncep.reanalysis2.html), Suarez (2008) (MERRA: https://gmao.gsfc.nasa.gov/reanalysis/MERRA/), and Kobayashi et al. (2015) (https://jra.kishou.go.jp/JRA-55/index_en.html). L.M Leslie at UTS edited through the text to improve the readability.
Supplementary Material
The Supplementary Material for this article can be found online at: https://www.frontiersin.org/articles/10.3389/feart.2021.640304/full#supplementary-material
Supplementary Figure S1 | Global atmospheric center of mass increase (isolines, in m/yr) during 1979-2014. The average altitudes of the mass center are shown as color shades. Atmospheric parameters used are from ERA interim.
Supplementary Figure S2 | Global mass redistribution rates as a result of postglacial rebound (mm/yr), according to the Peltier (2004) GIA model. The glacial isostatic adjustment signals are most prominent over North America and West Antarctica, with uplift rates reaching up to ∼0.6 mm/yr water height equivalent (at this ∼3 degree resolution, it could be even higher at finer resolution). Consequently, there is a global MOI decreasing rate of 2×1026 kg•m2/yr, which is insignificant compared with other components (Figure 1) discussed in the text, but it is a persistent contributor. Hence, it is a steady background trend that is two orders of magnitude smaller, but persists for many orders of magnitude longer into the future.
References
Adhikari, S., and Ivins, E. R. (2016). Climate-driven polar motion: 2003-2015. Sci. Adv. 2 (4), e1501693. doi:10.1126/sciadv.1501693
Bamber, J. L., Westaway, R. M., Marzeion, B., and Wouters, B. (2018). The land ice contribution to sea level during the satellite era. Environ. Res. Lett. 13, 063008. doi:10.1088/1748-9326/aac2f0
Behnke, R., Vavrus, S., Allstadt, A., Albright, T., Thogmartin, W. E., and Radeloff, V. C. (2016). Evaluation of downscaled, gridded climate data for the conterminous United States. Ecol. Appl. 26, 1338–1351. doi:10.1002/15-1061
Chambers, D. P., and Bonin, J. A. (2012). Evaluation of Release-05 GRACE time-variable gravity coefficients over the ocean. Ocean Sci. 8 (5), 859–868. doi:10.5194/os-8-859-2012
Chambers, D. P., and Willis, J. K. (2010). A Global Evaluation of Ocean Bottom Pressure from GRACE, OMCT, and Steric-Corrected Altimetry. J. Atmos. Ocean. Technol. 27 (8), 1395–1402. doi:10.1175/2010jtecho738.1
Charney, J. G., and Shukla, J. (1981). “Predictability of monsoons,” in Monsoon Dynamics. Editors Sir James Lighthill, and R. P. Pearce. (US: Cambridge University Press). doi:10.1017/cbo9780511897580.009
Chen, J. L., Wilson, C., and Tapley, B. (2006). Satellite gravity measurements confirm accelerated melting of Greenland ice sheet. Science 313, 1958–1960. doi:10.1126/science.1129007
Dee, D. P., Uppala, S. M., Simmons, A. J., Berrisford, P., Poli, P., and Kobayashi, S. (2011). the ERAInterim reanalysis: Configuration and performance of the data as-similation syatem. Q.J.R. Meteorol. Soc. 137, 553–597. doi:10.1002/qj.828
Dessler, A. (2010). A determination of the cloud feedback from climate variations over the past dec-ade. Science 330, 1523–1527. doi:10.1126/science.1192546
Dore, M. (2005). Climate change and changes in global precipitation patterns: What do we know? Environ. Int. 31 (8), 1167–1181. doi:10.1016/j.envint.2005.03.004
Duan, X., Guo, J., Shum, C., and van der Wal, W. (2009). On the postprocessing removal of corre-lated errors in GRACE temporal gravity field solutions. J. Geodesy 83, 1095–1106. doi:10.1007/s00190-009-0327-0
Famiglietti, J., Lo, M., Ho, S., Bethune, J., Anderson, K., Syed, T., et al. (2011). Satellites measure recent rates of groundwater depletion in California's Central Valley, Geophys. Res. Lett. 38, L03403. doi:10.1029/2010GL046442
Francis, J., and Vavrus, S. (2015). Evidence for a wavier jet stream in response to rapid Arctic warming. Environ. Res. Lett. 10, 014005. doi:10.1088/1748-9326/10/1/014005
Francis, J., and Vavrus, S. (2012). Evidence linking Arctic amplification to extreme weather in mid‐latitudes. Geophys. Res. Lett. 39 (6), L06801. doi:10.1029/2012GL051000
Frappart, F., Ramillien, G., and Famiglietti, J. (2011). Water balance of the Arctic drainage system using GRACE gravimetry products. Int. J. Remote Sens 32, 431–453. doi:10.1080/01431160903474954
Gross, R. (2000). The excitation of the Chandler wobble. Geophys. Res. Lett. 27, 2329–2332. doi:10.1029/2000gl011450
IPCC (2019). IPCC Special Report on the Ocean and Cryosphere in a Changing Climate. Editors H.-O. Pörtner, D. C. Roberts, V. Masson-Delmotte, P. Zhai, M. Tignor, E. Poloczanska, K. Mintenbeck, A. Alegría, M. Nicolai, A. Okem, J. Petzold, B. Rama, and N.M. Weyer. In press.
Haarsma, R., Selten, F., and van Oldenborgh, G. (2013). Anthropogenic changes of the thermal and zonal flow structure over Western Europe and Eastern North Atlantic in CMIP3 and CMIP5 models Clim. Clim Dyn. 41, 2577–2588. doi:10.1007/s00382-013-1734-8
Hu, A., and Bates, S. (2018). Internal climate variability and projected future regional steric and dy-namic sea level rise. Nat. Commun. 9 (1), 1068. doi:10.1038/s41467-018-03474-8
Ingebritsen, S., and Manga, M. (2019). Earthquake Hydrogeology. Water Resour. Res 55, 5212–5216. doi:10.1029/2019wr025341
Ingebritsen, S., Sanford, W., and Neuzil, C. (2006). Groundwater in Geologic Processes. 2nd edn. US: Cambridge University Press.
Kalnay, E., Kanamitsu, M., Kistler, R., Collins, W., Deaven, D., Gandin, L., et al. (1996). The NCEP/NCAR 40-year reanalysis project. Bull. Am. Meteorol. Soc. 77, 437–471. doi:10.1175/1520-0477(1996)077<0437:tnyrp>2.0.co;2
Kobayashi, S., Ota, Y., Harada, Y., and Ebita, A. (2015). The JRA-55 reanalysis: general specifications and basic characteristics. J. Meteorol. Soc. Jpn. Ser. 93, 5–48. doi:10.2151/jmsj.2015-001
Kronbichler, M., Heister, T., and Bangerth, W. (2012). High accuracy mantle convection simulation through modern numerical methods. Geophys. J. Int. 191, 12–29. doi:10.1111/j.1365-246x.2012.05609.x
Landerer, F., Jungelaus, J. H., and Marotzke, J. (2007). Ocean bottom pressure changes lead to de-creasing length-of-day in a warming climate. Geophys. Res. Lett. 34, L06307. doi:10.1029/2006gl029106
Le Marshall, J., Lee, J., Jung, J., Gregory, P., and Roux, B. (2013). The considerable impact of earth observations from space on numerical weather prediction. Aust. Meteorol. Oceanographic J. 63, 497–500. doi:10.22499/2.6304.004
Lee, S. H., Williams, P. D., and Frame, T. H. A. (2019). Increased shear in the North Atlantic upper-level jet stream over the past four decades. Nature 572, 639–642. doi:10.1038/s41586-019-1465-z
Long, D., Scanlon, B. R., Longuevergne, L., Sun, A. Y., Fernando, D. N., and Save, H. (2013). GRACE satellite monitoring of large depletion in water storage in response to the 2011 drought in Texas. Geophys. Res. Lett. 40, 3395–3401. doi:10.1002/grl.50655
Longuevergne, L., Scanlon, B., and Wilson, C. (2010). GRACE hydrological estimates for small ba-sins: evaluating processing approaches on the High Plains Aquifer, USA. Water Resour. Res. 46, W11517. doi:10.1029/2009wr008564
Lorbacher, K., Marsland, S., Church, J., Griffies, S., and Stammer, D. (2012). Rapid barotropic sea level rise from ice sheet melting. J. Geophys. Res. 117, C06003. doi:10.1029/2011JC007733
Luthcke, S., Sabaka, T., and Loomis, B. (2013). Antarctica, Greenland and Gulf of Alaska land-ice evolution from an iterated GRACE global mascon solution. J. Glaciol 59, 613–631. doi:10.3189/2013jog12j147
Menne, M., Durre, I., Vose, R., Gleason, B., and Houston, T. (2011). An Overview of the Global Historical Climatology Network-Daily Database. J. Atmos. Oceanic Tech. 29, 897–910.
Mitrovica, J. X., Wahr, J., Matsuyama, I., Paulson, A., and Tamisiea, M. (2006). Reanalysis of ancient eclipse, astronomic and geodetic data: A possible route to resolving the enigma of global sea-level rise. Earth Planet. Sci. Lett. 243, 390–399. doi:10.1016/j.epsl.2005.12.029
Munk, W. (2002). Twentieth century sea level: An enigma. Proc. Natl. Acad. Sci. 99, 6550–6555. doi:10.1073/pnas.092704599
Peltier, W. R., Argus, D. F., and Drummond, R. (2015). Space geodesy constrains ice age terminal deglaciation: The global ICE‐6G_C (VM5a) model. J. Geophys. Res. Solid Earth 120, 450–487. doi:10.1002/2014jb011176
Pendergrass, A. G., Coleman, D., Deser, C., Lehner, F., Rosenbloom, N., and Simpson, I. (2019). Nonlinearresponse of extreme precipitation towarming in CESM1. GRL 46 (10), 551–560. doi:10.1029/2019gl084826
Putnam, A., and Broecker, W. (2017). Human-induced changes in the distribution of rainfall. Sci. Adv. 3 (5), e1600871. doi:10.1126/sciadv.1600871
Ren, D. (2019). An earthquake model based on fatigue mechanism-A Tale of Earthquake Triad. JEP Spec. Issue Hydrol. Water Cycle 7 (8). 2171092. MSID. doi:10.4236/gep.2019.78021
Ren, D., and Karoly, D. (2006). Comparisons of glacier-inferred temperatures with observations and climate model simulations. Geophys. Res. Lett., 33, L 23710.23711-4. doi:10.1029/2006gl027856
Ren, D. (2010). Effects of global warming on wind energy availability. J. Renew. Sustaina-ble Energ. 2, 052301. doi:10.1063/1.3486072
Ren, D., and Fu, R. (2019). How droughts enhance earthquakes. Adv. Environ. Stud-ies 3 (1), 229–251.
Ren, D., Fu, R., Leslie, L., Karoly, D., Chen, J., and Wilson, C. (2011a). A multiple-rheology ice mod-el: Formulation and application to the Greenland ice sheet. JGR-Atmosphere 116, D05112. doi:10.1029/2010jd014855
Ren, D., Fu, R., Leslie, L. M., Chen, J., Wilson, C., and Karoly, D. (2011b). The Greenland ice sheet response to transient climate change. J. Clim. 24, 3469–3483. doi:10.1175/2011jcli3708.1
Ren, D., Fu, R., Leslie, L. M., and Dickinson, R. (2011c). Predicting storm-triggered landslides. Bull. Amer. Met. Soc. 92, 129–139. doi:10.1175/2010bams3017.1
Ren, D., and Karoly, D. (2008). An adjoint force-restore model for glacier terminus fluctuations. J. Geophys. Res. 113, D05103. doi:10.1029/2007JD008997
Ren, D., and Leslie, L. (2019). Impacts of climate warming on aviation fuel consumption. J. Appl. Meteorol. Clim. 58 (7), 1593–1602. doi:10.1175/JAMC-D-19-0005.1
Ren, D., Leslie, L., and Karoly, D. (2008). Mudslide risk analysis using a new constitutive relation-ship for granular flow. Earth Interactions 12, 1–16. doi:10.1175/2007ei237.1
Ren, D., Leslie, L. M., and Lynch, M. (2012). Verification of model simulated mass balance, flow fields and tabular calving events of the Antarctic ice sheet against remotely sensed observations. J. Clim. Dyn. doi:10.1007/s00382-012-1464-3
Ren, D., and Leslie, L. (2011). Three positive feedback mechanisms for ice-sheet melting in a warm-ing climate. J. Glaciology 57, 1057–1066. doi:10.3189/002214311798843250
Rignot, E., and Kanagaratnam, P. (2006). Changes in the velocity structure of the Greenland Ice Sheet. Science 311, 986–990. doi:10.1126/science.1121381
Save, H., Bettadpur, S., and Tapley, B. (2016). High resolution CSR GRACE RL05 mascons. J. Geophys. Res. Solid Earth 121, 7547–7569. doi:10.1002/2016jb013007
Seoane, J., Takkouch, B., Varela-Centelles, P., Tomas, I., and Seoane-Romero, J. (2012). Impact of delay in diagnosis on survival to head and neck carcinomas: a systematic review with meta-analysis. Clin. Otolaryngol. 37, 99–106. doi:10.1111/j.1749-4486.2012.02464.x
Shepherd, A., Ficker, H., and Farrell, S. (2018). Trends and connections across the Antarctic cry-osphere. Nature 558, 223–232. doi:10.1038/s41586-018-0171-6
Solomon, S., Qin, D., Manning, M., Chen, Z., Marquis, M., Averyt, K. B., et al. (2007). IPCC Fourth Assessment Report: Climate Change 2007: Climate Change 2007: Working Group I: The Physical Science Basis. US: Cambridge Univ. Press.
Suarez, M. (2008). The GEOS-5 Data Assimilation System—documentation of versions 5.0.1, 5.1.0, and 5.2.0. NASA/TM 2008, 104606–104627.
Tapley, B. D., Watkins, M. M., Flechtner, F., and Reigber, C. (2019). Contributions of GRACE to understanding climate change. Nat. Clim. Change 9, 358–369. doi:10.1038/s41558-019-0456-2:
Trenberth, K., and Fasullo, J. (2013). An apparent hiatus in global warming? Earth’s Future 1, 19–32. doi:10.1002/2013ef000165
Vallis, G., Zurita-Gotor, P., Cairns, C., and Kidston, J. (2015). Response of the large-scale structure of the atmosphere to global warming. Q.J.R. Meteorol. Soc. 141, 1479–1501. doi:10.1002/qj.2456
Velicogna, I., and Wahr, J. (2006). Acceleration of Greenland ice mass loss in spring 2004. Nature 443, 329–331. doi:10.1038/nature05168
Vishwakarma, B. D., Devaraju, B., and Sneeuw, N. (2018). What is the spatial resolution of GRACE satellite products for hydrology? Remote Sensing 10 (6), 852. doi:10.3390/rs10060852
Wahr, J., Molenaar, M., and Bryan, F. (1998). Time variability of the Earth's gravity field: Hydrolog-ical and oceanic effects and their possible detection using GRACE. J. Geophys. Res. 103 (30), 205–230. doi:10.1029/98jb02844
Watkins, M., Wiese, D., Yuan, D., Boening, C., and Landerer, F. (2015). Improved methods for ob-serving Earth's time variable mass distribution with GRACE using spherical cap mascons: Im-proved Gravity Observations from GRACE. J. Geophys. Res. Solid Earth 120, 2648–2671. doi:10.1002/2014jb011547
Wouters, B., Bonin, J., Chambers, D., Riva, R., Sasgen, I., and Wahr, J. (2014). GRACE, time-varying gravity, Earth system dynamics and climate change. Rep. Prog. Phys 77 (11), p. 116801 (11), 116801. doi:10.1088/0034-4885/77/11/116801
Keywords: MOI change finger printing, earth nontidal MOI, enhanced hydrological cycle, GRACE measurements, climate warming, cryosphere and climate change, climate warming increases Earth's Moment of Inertia
Citation: Ren D and Hu A (2021) Using GRACE Data to Estimate Climate Change Impacts on the Earth’s Moment of Inertia. Front. Earth Sci. 9:640304. doi: 10.3389/feart.2021.640304
Received: 11 December 2020; Accepted: 20 July 2021;
Published: 13 September 2021.
Edited by:
Tomas Halenka, Charles University, CzechiaReviewed by:
Pavel Novak, University of West Bohemia, CzechiaVagner Ferreira, Hohai University, China
Copyright © 2021 Ren and Hu. This is an open-access article distributed under the terms of the Creative Commons Attribution License (CC BY). The use, distribution or reproduction in other forums is permitted, provided the original author(s) and the copyright owner(s) are credited and that the original publication in this journal is cited, in accordance with accepted academic practice. No use, distribution or reproduction is permitted which does not comply with these terms.
*Correspondence: Diandong Ren, RGlhbmRvbmcuUmVuQGN1cnRpbi5lZHUuYXU=