 Chawisa Phujareanchaiwon
 Piyaphong Chenrai
 Kasira Laitrakull
- 1Basin Analysis and Structural Evolution Research Unit, Department of Geology, Chulalongkorn University, Bangkok, Thailand
- 2M.Sc. Program in Petroleum Geoscience, Department of Geology, Faculty of Science, Chulalongkorn University, Bangkok, Thailand
- 3PPT Exploration and Production, Vibhavadi Rangsit Road, Bangkok, Thailand
Gamma ray logs are most useful in identifying subsurface lithology and interpreting depositional environments. This study highlights the use of outcrop gamma-ray logs along with outcrop observations and total organic carbon (TOC) analysis to provide the stratigraphic framework of the organic-rich rocks of Huai Hin Lat Formation in central Thailand. The study reveals five sedimentary facies including (1) structureless sandstone, (2) structured sandstone, (3) interbedded sandstone and siltstone, (4) interbedded mudstone and siltstone and (5) calcareous mudstone. These facies can be grouped into two facies associations; mudstone-dominated and sandstone-dominated facies associations. The depositional environment was interpreted as lacustrine basin-fill subdivided into deep lacustrine environment and sublacustrine fan associated with the turbidity currents. The total gamma-log characteristics are closely related to the lithologies controlled primarily by clay mineral compositions. Whist, the use of spectral gamma-ray can reveal more details on depositional environments and conditions. In this study, U concentrations is proven to be useful in highlighting organic-rich rocks in low K and Th concentration successions due to its ability to be fixed in clay minerals and organic materials under an anoxic condition. Thus, the U spectral gamma ray is suggested to combine with conventional gamma ray log for depositional environment and recognition of organic-rich rocks.
Introduction
Identification and reconstruction of depositional environments are important in petroleum exploration and development as they provide the necessary framework for delineation and prediction of petroleum system components in the basin, especially in frontier exploration areas. Source rock is one of primary concerned elements for petroleum potential evaluation and the occurrence of source rock is controlled by the depositional environments (Magoon and Dow, 1994; Law, 1999). Source rock and depositional environment assessments are typically based on geochemical analyses which can provide both quantitative and qualitative aspects of source rocks (Tissot and Welte, 1984; Peters and Cassa, 1994). However, in order to perform the geochemical analyses, rock samples are required. Thus, there is a limitation in the use of geochemical analyses to examine and evaluate petroleum source rocks in the frontier or immature explorations due to insubstantial or no subsurface samples.
Geophysical approaches such as seismic and well log interpretations have been widely used in petroleum exploration. It can be used to fulfill the gap of the geochemical analyses to investigate depositional environments as well as to assess petroleum source rocks in subsurface, particularly in frontier basins with limited availability of subsurface samples such as cutting, sidewall core, conventional core. Gamma-ray logs are a fundamental tool which is commonly used for lithological identification and stratigraphic correlation in subsurface (Myers and Wignall, 1987; Slatt et al., 1992; Rider, 1996). Gamma-ray logs measure the total γ-emission called total gamma-ray logs and differentiated contributions of potassium (K), uranium (U) and thorium (Th) called spectral gamma-ray logs. The patterns and shapes of gamma-ray logs can assist in facies analysis and interpretation of depositional environments (Selley, 1978; Cant, 1992; Rider, 1996; Nazeer et al., 2016). Moreover, gamma-ray logs and other wireline logs can be utilized to evaluate petroleum source rocks (e.g., Myers and Wignall, 1987; Passey et al., 1990; Lüning and Kolonic, 2003) and estimate total organic carbon (TOC) contents by using the gamma-ray and TOC linear relationship (e.g., Schmoker, 1981; Fertl and Chilingar, 1988; Huang et al., 2015; Aziz et al., 2020). Several investigations provided a relationship between gamma-ray logs, both total and spectral, and organic-rich intervals (e.g., Myers and Wignall, 1987; Lüning et al., 2000, 2004; Lüning and Kolonic, 2003; Correia et al., 2012; Gómez et al., 2016; Sêco et al., 2018). In general, total gamma-ray responses are closely related to fine-grained clay-rich sediments (shale, clay stone, mudstone). The organic matter preservation usually increases within these fine-grained sediments under an anoxic condition. Thus, high gamma-ray responses have been a valuable tool used to correlate a petroleum source rock. However, to evaluate petroleum source rock, the gamma-ray responses should be used with caution as it is dominantly influenced by mineral compositions (Myers and Wignall, 1987; Rider, 1996). Spectral gamma ray logs provide more information on the identification of organic-rich intervals, especially the U response (Myers and Wignall, 1987; Lüning and Kolonic, 2003). Outcrop gamma-ray log has been investigated for many years as it is useful for documenting changes in strata patterns, stratigraphic correlations and sequence stratigraphic interpretations (Myers and Bristow, 1989; Slatt et al., 1992; Davies and Elliott, 1996; Evans et al., 2007). It also provides a link between lithological features observed in outcrop and subsurface which improves the understanding of the subsurface data (Slatt et al., 1992, 1995; Aigner et al., 1995).
The Khorat basin located in northeastern Thailand covers much of the Indochina block and is believed to have complex tectonic activity during the late Paleozoic and Mesozoic (Minezaki et al., 2019). This basin has been explored for petroleum potential since 1962 and two commercial petroleum fields have been discovered since 1988 (Racey, 2011). The Late Triassic Huai Hin Lat Formation is believed to be one of petroleum source rocks in the Khorat basin (Booth, 1998). Due to the thick Mesozoic strata overlain the Huai Hin Lat Formation (Figure 1A), full drilling cores covered this formation are limited (Racey, 2011). Geochemical analyses on petroleum potential source rock of the Huai Hin Lat Formation are confirmed to have a good to excellent source rock (Racey, 2011). However, the lithology and depositional environments of this formation varies from place to place within the Khorat basin. Thus, outcrop gamma-ray log can be used to constrain the well log interpretation of this formation in the subsurface.
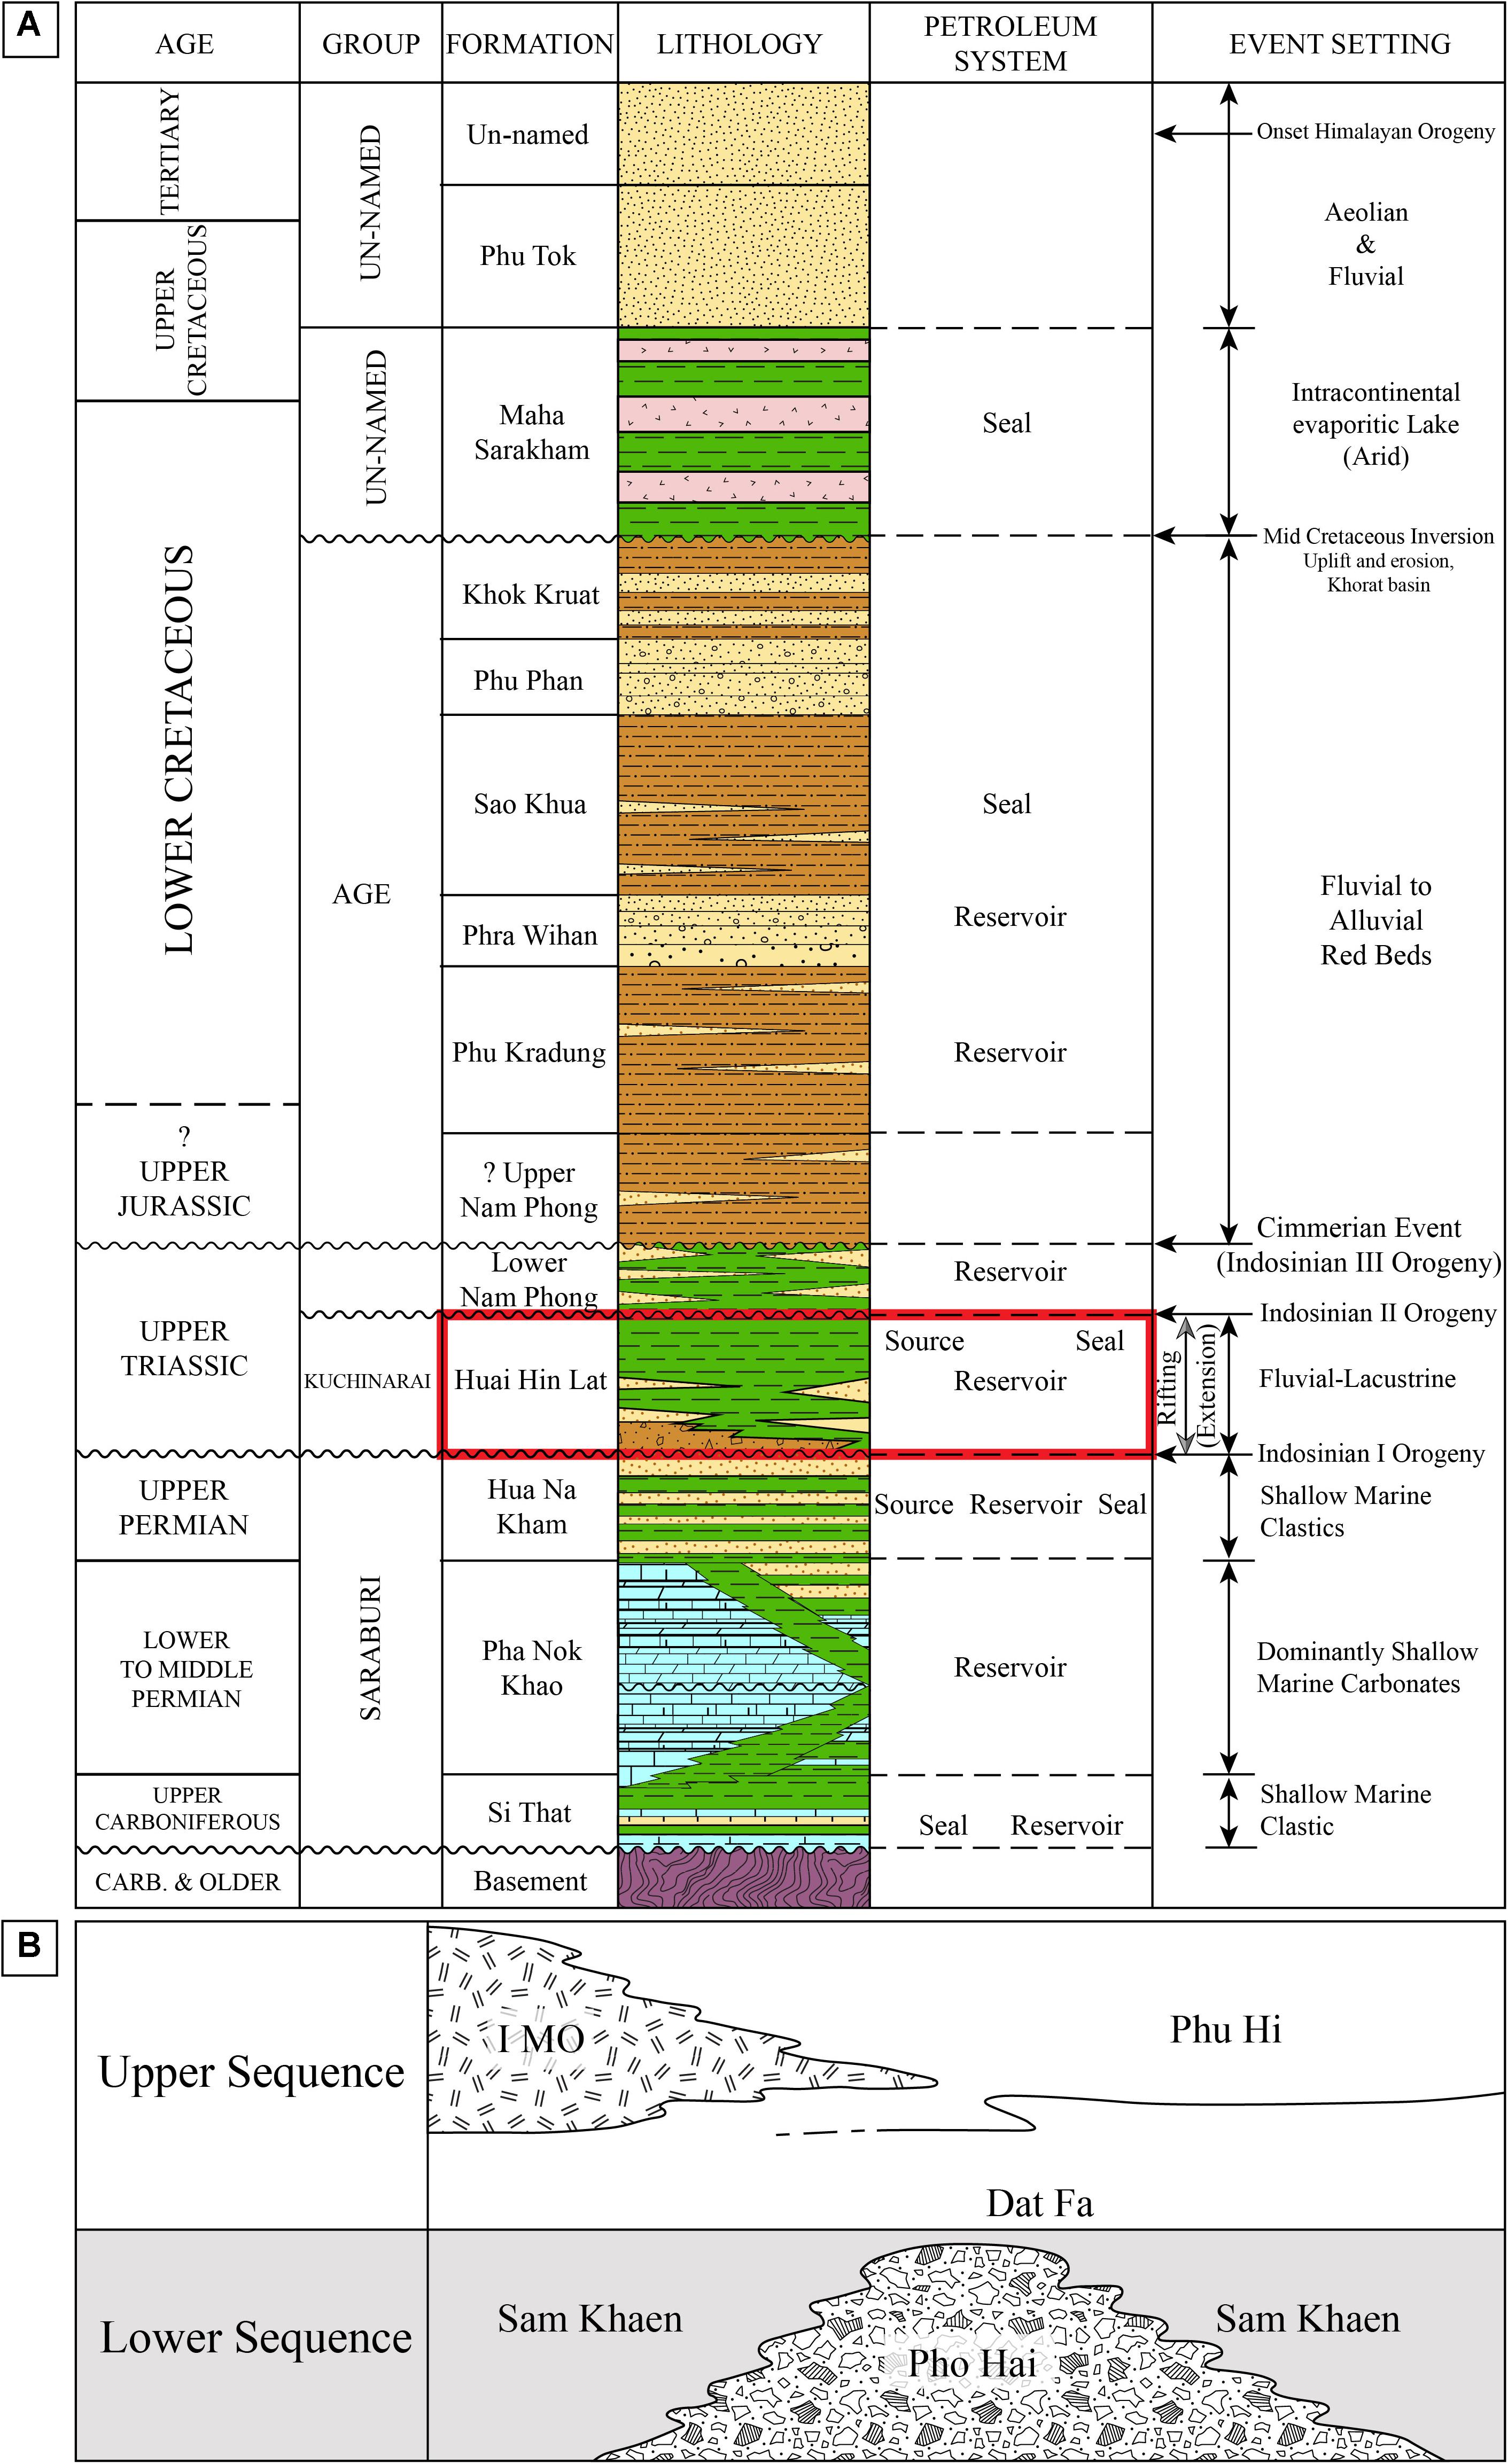
Figure 1. (A) Stratigraphy of the Khorat plateau including petroleum system elements and key events (modified from Racey, 2011). The red box highlights the Huia Hin Lat interval which is the studied Formation. (B) The classified member of the Huai Hin Lat Formation (Chonglakmani and Sattayarak, 1978).
The study area in the Phetchabun Province, situated in the western edge of the Khorat plateau, provides well exposed outcrop of the Huai Hin Lat Formation and can be used as an outcrop analog to enhance the understanding of the Huai Hin Lat Formation in the subsurface. This study highlights the first use of outcrop gamma-ray log investigation in Thailand along with detailed outcrop descriptions, facies analysis, the total organic carbon (TOC) analysis, aiming to identify and reconstruct the deposition environment of the study area. The results are useful for petroleum exploration and recognizing the organic-rich intervals. This contribution can also help in dealing with local and regional correlations of the Triassic anoxic events, especially within the Indochina block.
Geological Setting
The Huai Hin Lat Formation is Late Triassic non-marine Formation distributed along the western margin of the Khorat Plateau and extended through the Khorat basin in subsurface (Booth, 1998; Booth and Sattayarak, 2011). It unconformably overlies the older Permian rock unit and is unconformably overlain by the younger Nam Phong Formation and the thick Mesozoic Khorat Group (Chonglakmani and Sattayarak, 1978; Figure 1A).
During the Late Permian to Middle Triassic, the Khorat basin in northeastern Thailand underwent the compressive deformation resulted from the collision of two main terranes, the Sibumasu (Shan-Thai) and the Indochina terranes, called the Indosinian I event (Booth and Sattayarak, 2011; Figure 1A). This event followed by the Late Triassic extension which created a series of half-graben basin in the Indochina Terrane leading to deposition of the Huai Hin Lat Formation (Chonglakmani and Sattayarak, 1978; Chonglakmani, 2011; Booth and Sattayarak, 2011; Racey, 2011). The depositional environment of the Huai Hin Lat Formation is broadly interpreted to have been a fluvial and lacustrine setting during the extension and half-graben development (Chonglakmani and Sattayarak, 1978). The Huai Hin Lat Formation consists of various lithologies which are characterized by different siliciclastic grain size. It was determined paleontologically as Late Triassic (Norian) age based on the Estheria fauna, spore and pollen (Haile, 1973; Kobayashi, 1973; Konno and Asama, 1973; Chonglakmani and Sattayarak, 1978). Chonglakmani and Sattayarak (1978) classified the Huai Hin Lat Formation into two major units, the lower and upper sequences, containing five members (Figure 1B). The lower sequence consists of the Pho Hai Member and the Sam Khaen Conglomerate Member, while the upper sequence composes of the Dat Fa Member, the Phu Hi Member and the I Mo Member (Figure 1B). The Pho Hai Member is characterized by the volcanic rocks including tuff, agglomerate, rhyolite, andesite and some interlayers of sandstone and conglomerate. The Sam Khaen Conglomerate Member, considered to be lateral equivalent unit of the Pho Hai Member, contains predominantly conglomerate with some intercalations of limestone beds, and normally found interfingering with sandstone and shale. Overlying the Sam Khaen Conglomerate Member or the Pho Hai Member, the Dat Fa Member composes of calcareous, carbonaceous shale, and argillaceous limestone with fossils. The Phu Hi Member is characterized by sandstone, shale and argillaceous limestone with some conglomerate. The I Mo Member, only presented in some areas, consist of volcanic rocks interbedded with shale, sandstone and limestone.
The outcrop of this study is located along the Highway 12 Lomsak-Chumpae in Lom Sak district, about 40 km north-east of Phetchabun Province (Figures 2A,B), central Thailand. The measured section is mapped as the Huai Hin Lat Formation (Figure 2C). This location yields well exposed and continuous outcrop of the Huai Hin Lat Formation which permits detailed stratigraphy and outcrop gamma-ray logging studies. The measured section is bounded by fold at the base and the outcrop strata can be tracked through the roadside (Figure 2D). The outcrop comprises a thick (7-14 m) dark-colored fined-grained interval that probably indicate a petroleum source rock composing high organic matters.
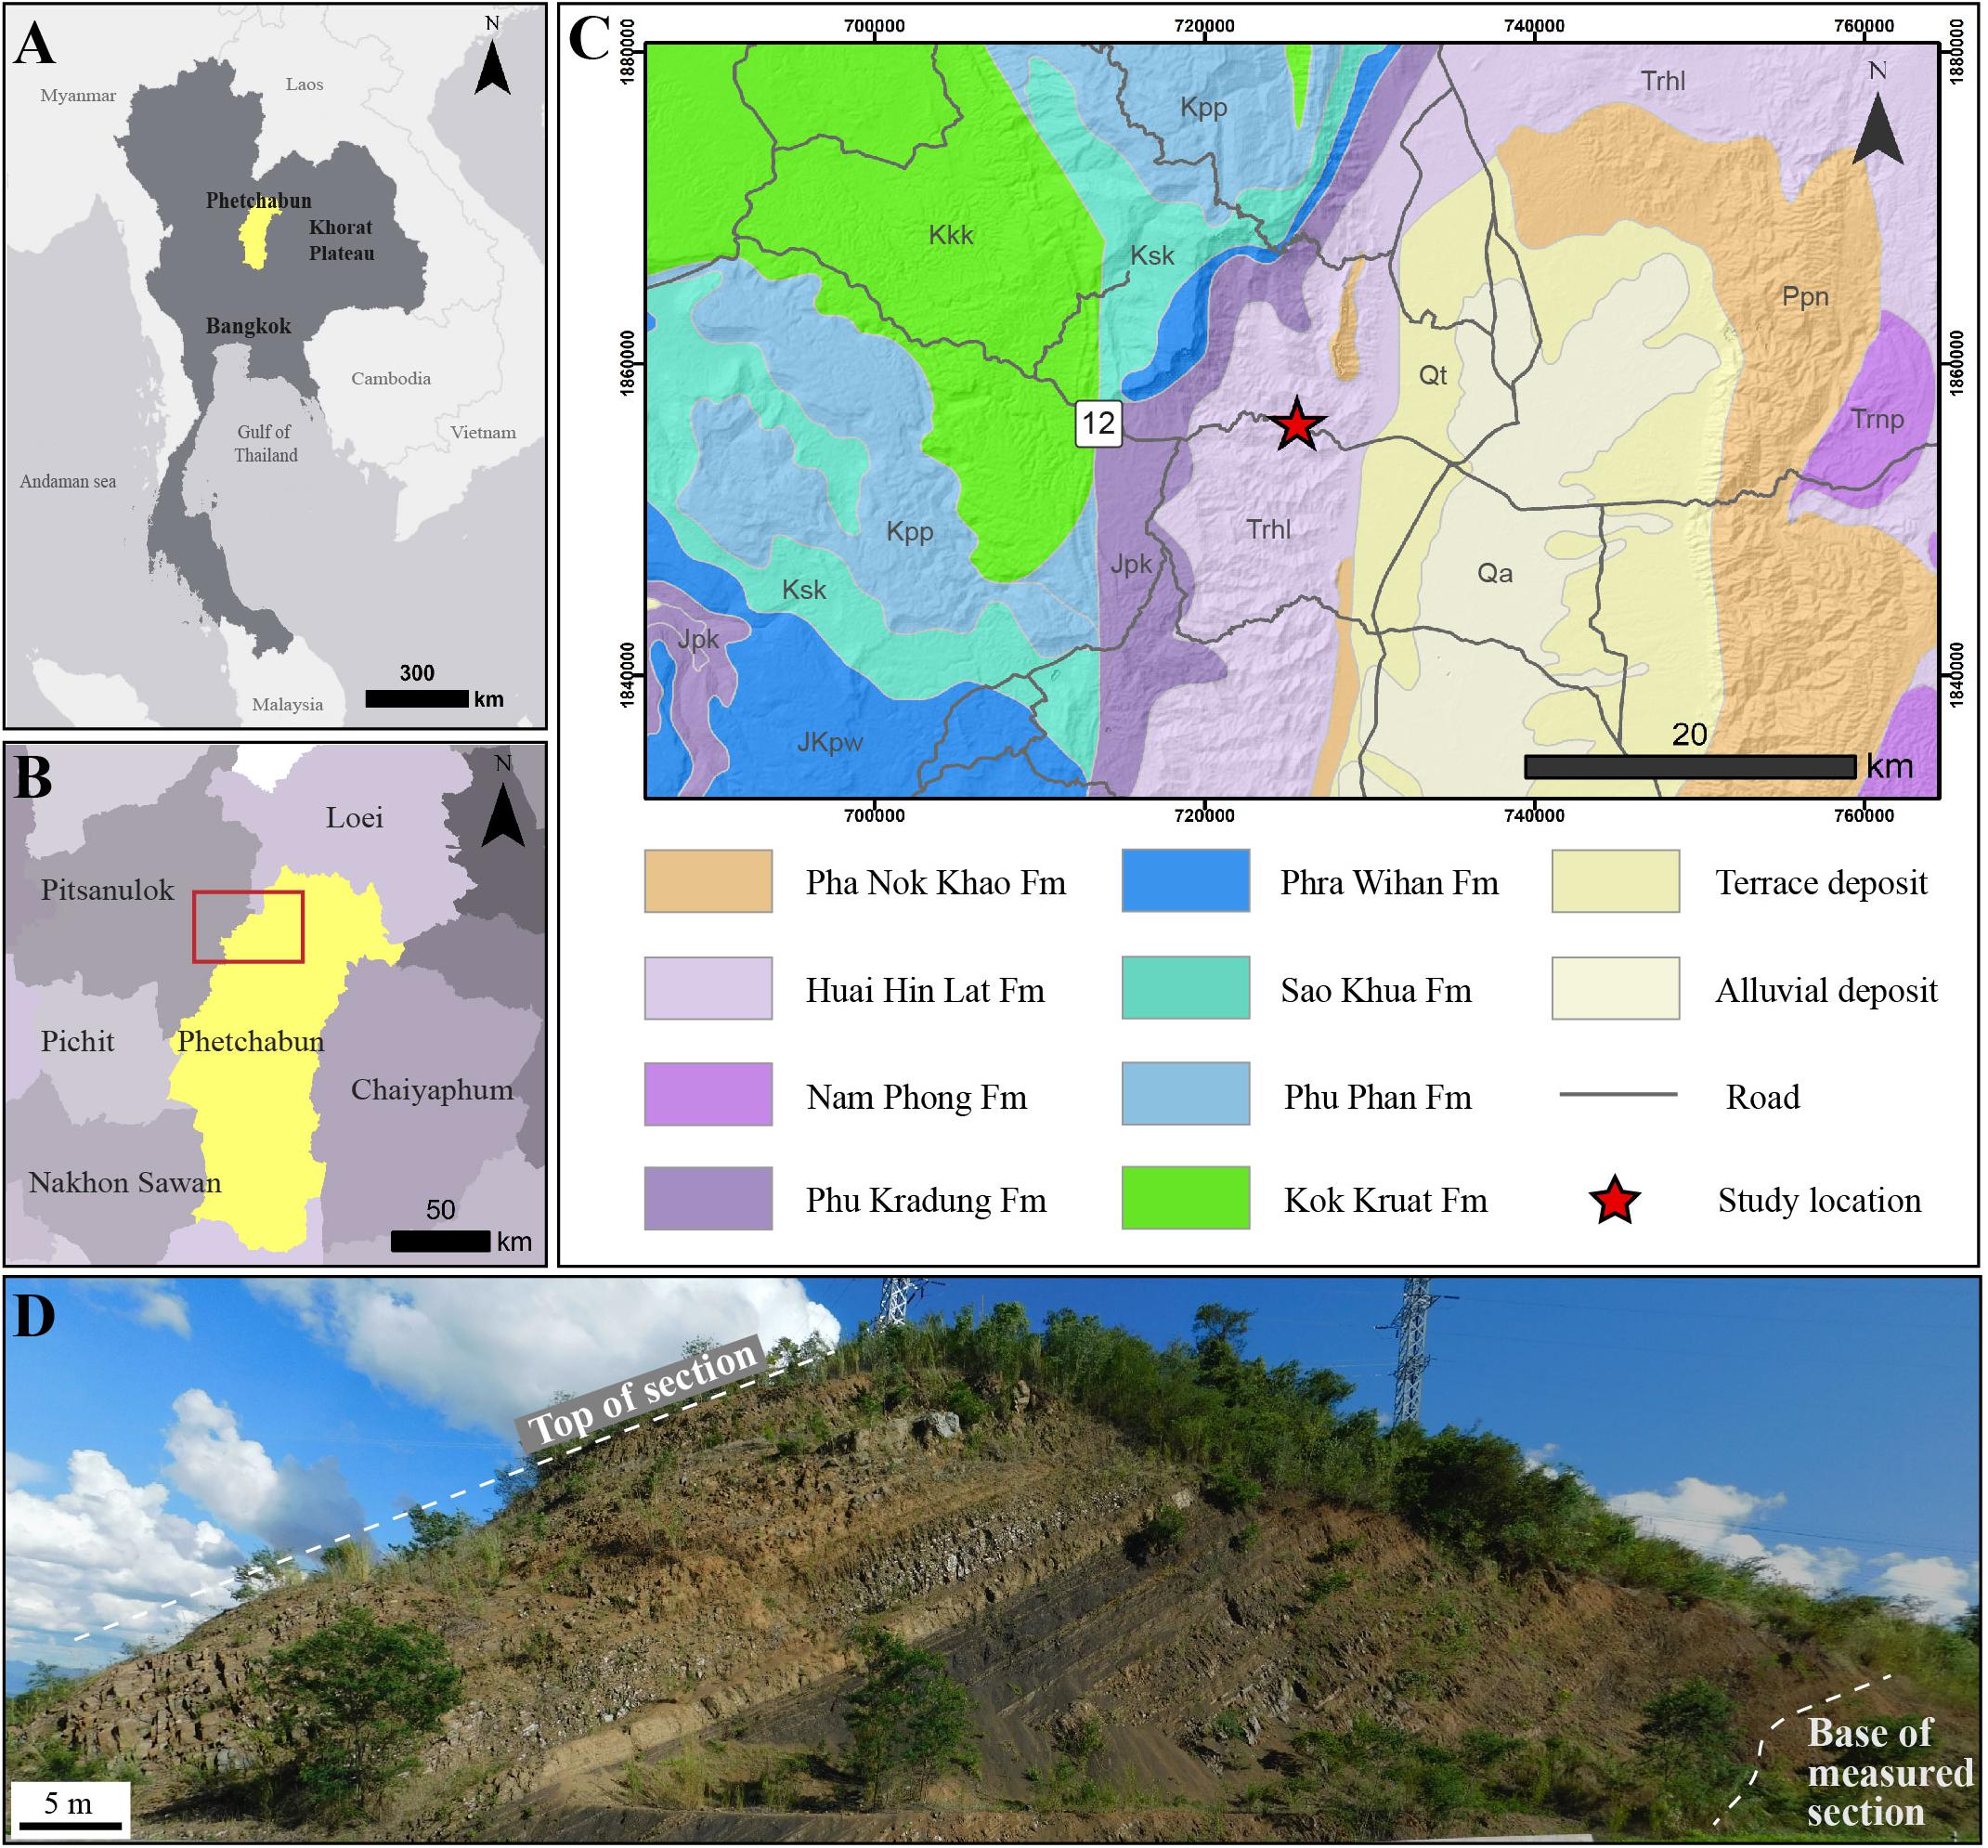
Figure 2. Maps show the study location (A) Location of Phetchabun province, central Thailand, (B) close up of the study area in northwestern part of Phetchabun province, (C) the geological map of the study area which the study location situated in the Huai Hin Lat Formation, and (D) the studied outcrop provides continuous parallel beds of siliciclastic sedimentary rocks.
Materials and Methods
The datasets used in this study consist of four parts: (i) the stratigraphic and facies descriptions, (ii) the total organic carbon (TOC) contents, (iii) the gamma-ray log measurements and (iv) X-Ray Diffractometer (XRD). A total 72.8 m of the measured section was described in detail based on the lithologies, grain sizes, textures and sedimentary structures. The sedimentary facies and facies associations were identified and integrated in depositional environment interpretation.
Thirty-three representative samples from all sedimentary facies were collected for total organic carbon (TOC) analysis. The samples were grounded into powder by an agate ball mill, and then, were analyzed for TOC contents by the CORE Laboratory in Houston, USA. The TOC values (wt%) were plotted against the stratigraphic succession, together with total and spectral gamma-ray logs to provide the relationship of organic-rich intervals and the gamma-ray trends.
The total of 380 gamma-ray measuring points were measured throughout the measured section. The total and spectral gamma-ray signals were measured by a RS-230 Super Spec handheld spectrometer with a 103 cm3 bismuth-germanate-oxide (BGO) scintillation detector (Radiation Solutions Inc., Canada). The detector measures an average value for a bowl-shaped volume with surface diameter of 80 cm and penetrating depth of 14 cm from outcrop surface (e.g., Løvborg et al., 1971; Myers and Wignall, 1987). The assay mode was chosen to provide the total gamma radiation and concentration of K (%), U (ppm) and Th (ppm). The gamma-ray measurements were performed at 15 to 30 cm interval depending on bedding boundaries and lithology variations. The counting time for each measuring point was 120 seconds. Each measurement was made on the flat surface with a full contact to the rock and perpendicular to the section wall. The reading values were automatically recorded by the instrument. The concentrations of U, K and Th of each point were converted to American Petroleum Institute (API) unit using the formula provided by Ellis and Singer (2008): γAPI = 4Th [ppm] + 8U [ppm] + 16K [%]. The total and spectral gamma-ray values were plotted against the measured section to characterize the gamma-ray patterns in this locality. The U/Th log was also provided to indicate the redox conditions throughout the measured section. Cross-plots of spectral gamma-ray components (K, Th, and U) were adopted to examine the relationship of K, Th, and U abundance in each sedimentary facies. The K/TOC, Th/TOC and U/TOC ratios were also presented to provide the relationship of spectral gamma-ray components with organic matter from the section. The simple linear regression analysis of these ratios was also performed.
Mineral composition of seventeen representative mudstone samples was determined using XRD in order to investigate the relationship between gamma-ray responses and mineral compositions in organic-rich samples. The operational conditions were set at 40 kV and 30 mA with 2 Theta 5-50 degree, increment 0.01 degree, scan speed 1 second per step. Semi-quantitative evaluations are based on the peak heights and areas summed to 100%. The mineral compositions were compared to the measured section and gamma-ray logs.
Results
Sedimentary Facies and Facies Associations
The studied outcrop mainly consists of sandstone, siltstone and mudstone with minor calcareous mudstone and limestone (Figure 3). The measured section was described and identified into five sedimentary facies consisting of (1) structureless sandstone facies (F1; Figure 4), (2) structured sandstone facies (F2; Figure 5), (3) interbedded sandstone and siltstone facies (F3; Figure 6), (4) interbedded siltstone and mudstone facies (F4; Figure 7) and (5) calcareous mudstone facies (F5; Figure 7). The summary of descriptions and interpretation of processes in each facies is provided in Table 1 (detail descriptions of sedimentary facies are in the Supplementary Material). The stratigraphic log and facies identification as well as a total gamma-ray profile are illustrated in Figure 3. Five sedimentary facies were grouped into two facies associations, mudstone-dominated and sandstone-dominated facies associations, to represent the depositional environments of this locality. The representative logs, the facies components and depositional environments of each facies association are summarized and displayed in Table 2.
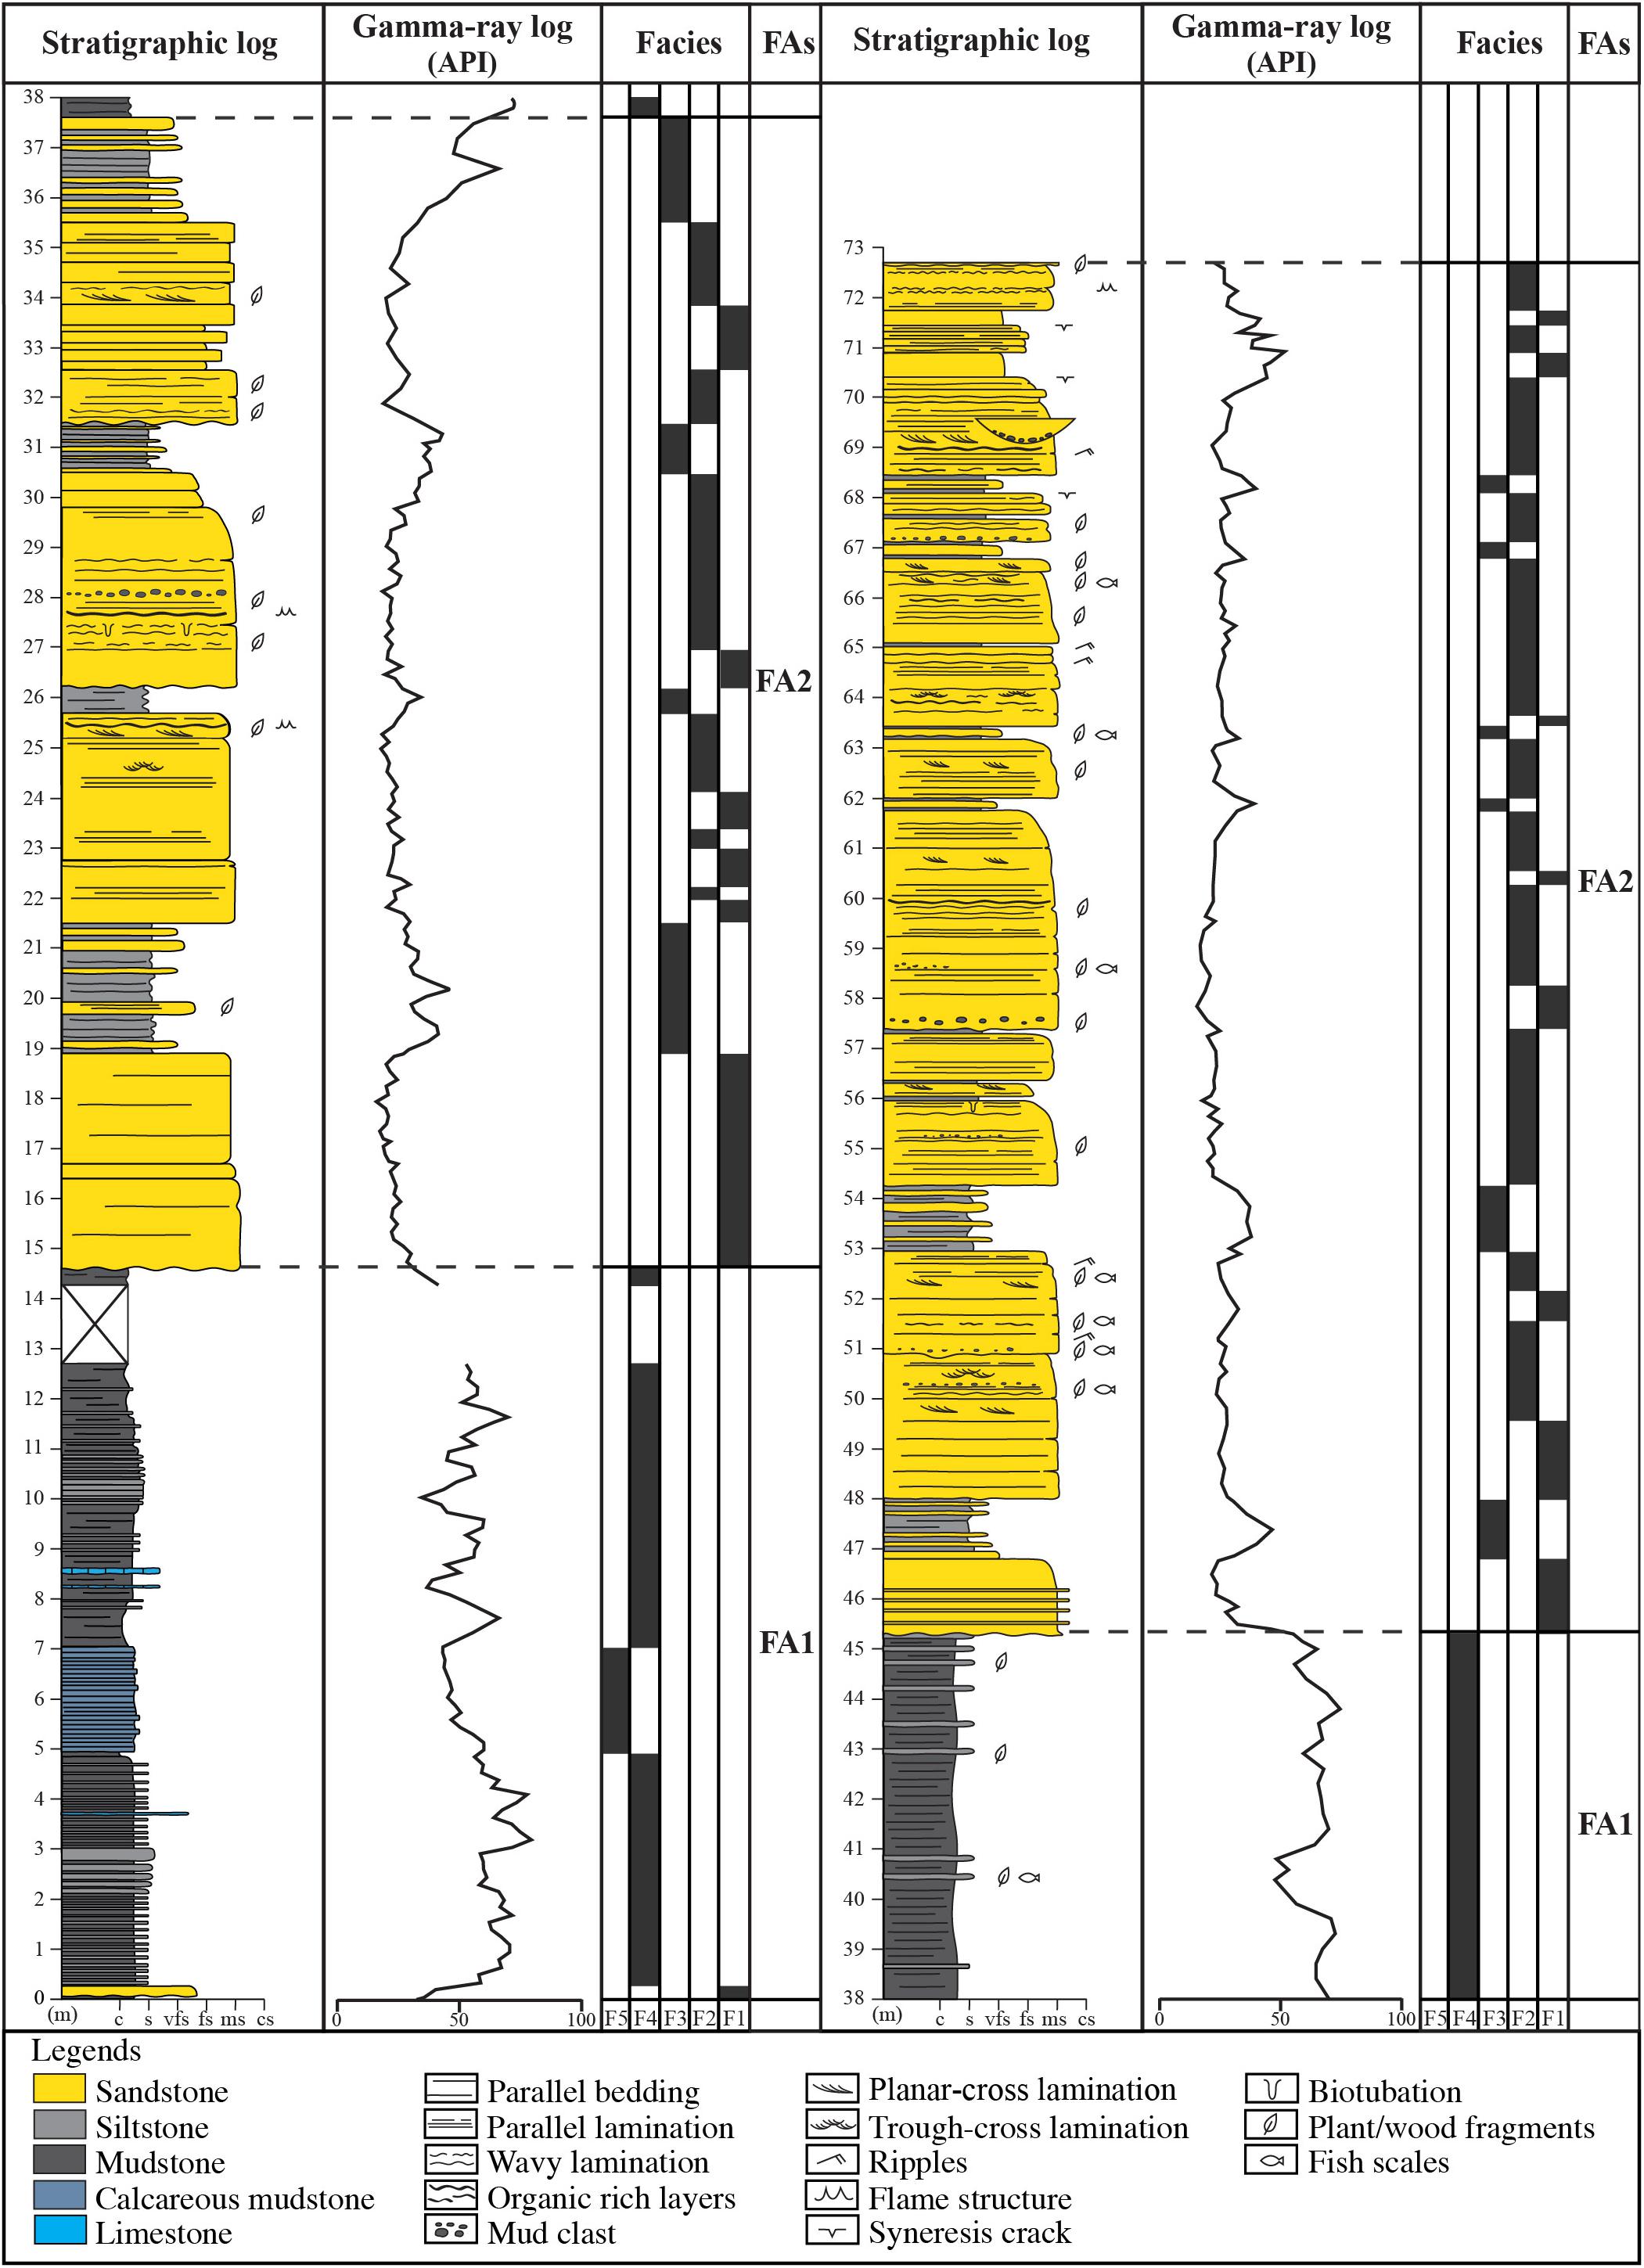
Figure 3. The detailed stratigraphic log of the Huai Hin Lat outcrop correlates with the total gamma-ray log and identified sedimentary facies. (FAs: Facies associations, F1: Structureless sandstone, F2: Structured sandstone, F3: Interbedded sandstone and siltstone, F4: Interbedded siltstone and mudstone, F5: calcareous mudstone facies; c: clay, s: silt, vfs: very fine sand, fs: fine sand, ms: medium sand, cs: coarse sand).
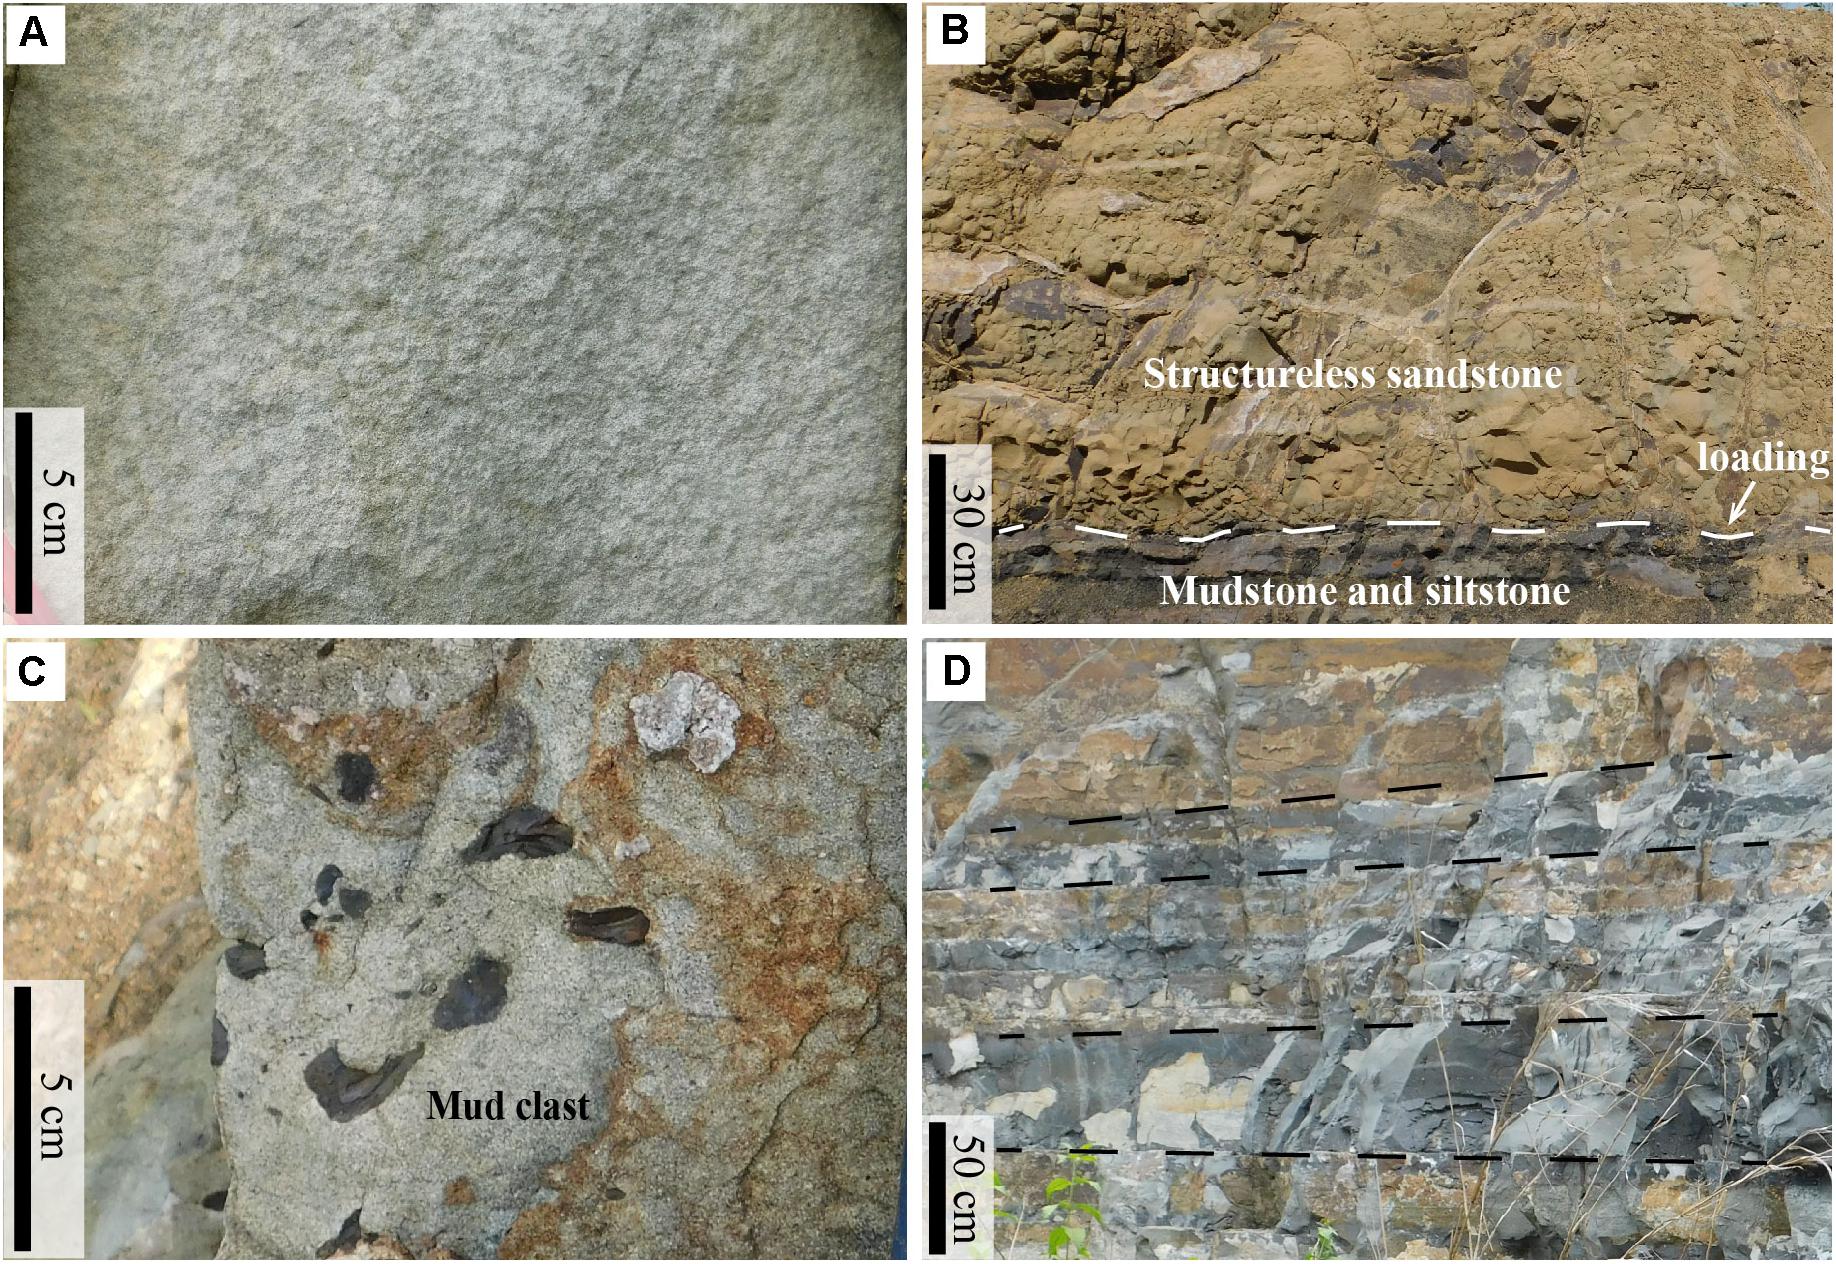
Figure 4. Representative photographs of structureless sandstone facies (F1). (A) Light gray structureless sandstone. (B) Yellowish sandstone with erosional and loading contact with siltstone and mudstone layers. (C) Mud rip-up clasts in sandstone bed. (D) Very fine argillaceous sandstone beds presented near the top of the measured section.
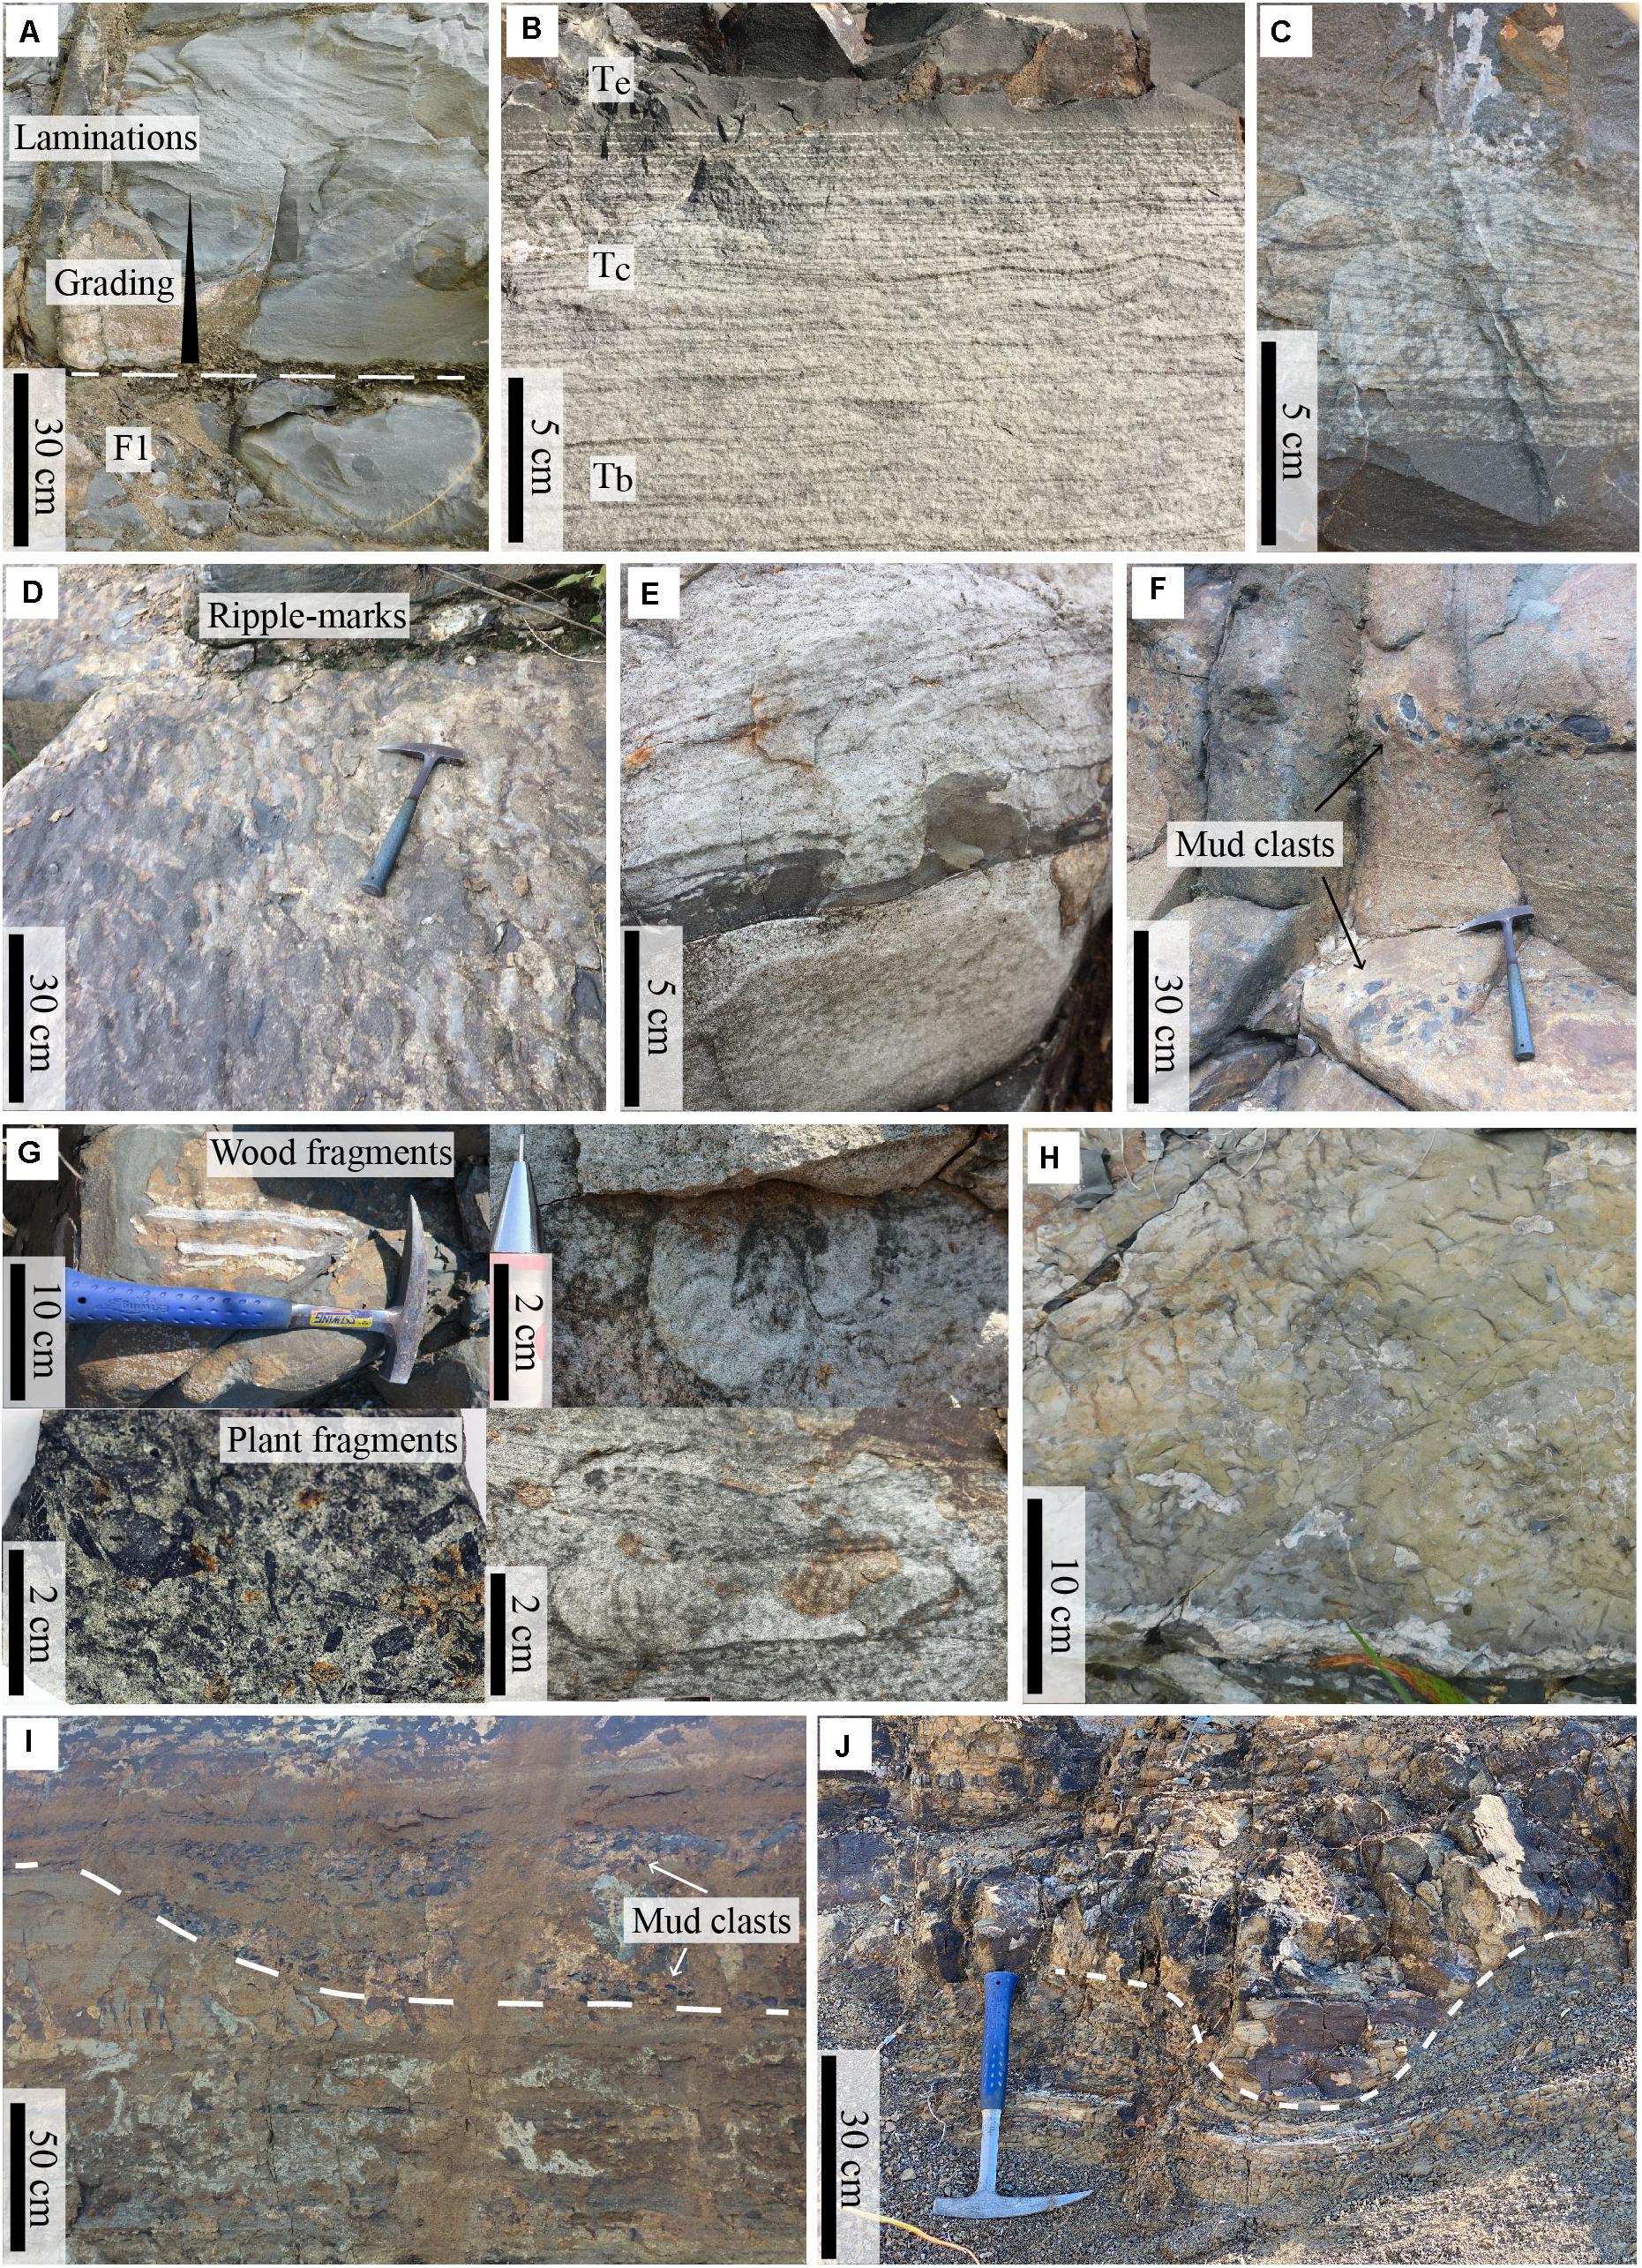
Figure 5. Representative photographs of structured sandstone facies (F2). (A) Graded and laminated sandstone overlying structureless sandstone of F1. (B) Parallel (Tb) and wavy-ripple (Tc) laminations overlain by structureless mudstone (Te). (C) Small-scale trough cross laminations (D) Ripple marks observed on bedding surface. (E) Organic-rich layer with load and flame structures. (F) Mud rip-up clasts with various shape and size. (G) Wood, plant fragments and bioturbated sandstone. (H) Syneresis crack on the bedding surface. (I) Channel feature with mud clasts layers. (J) Small-scale channel-like feature.
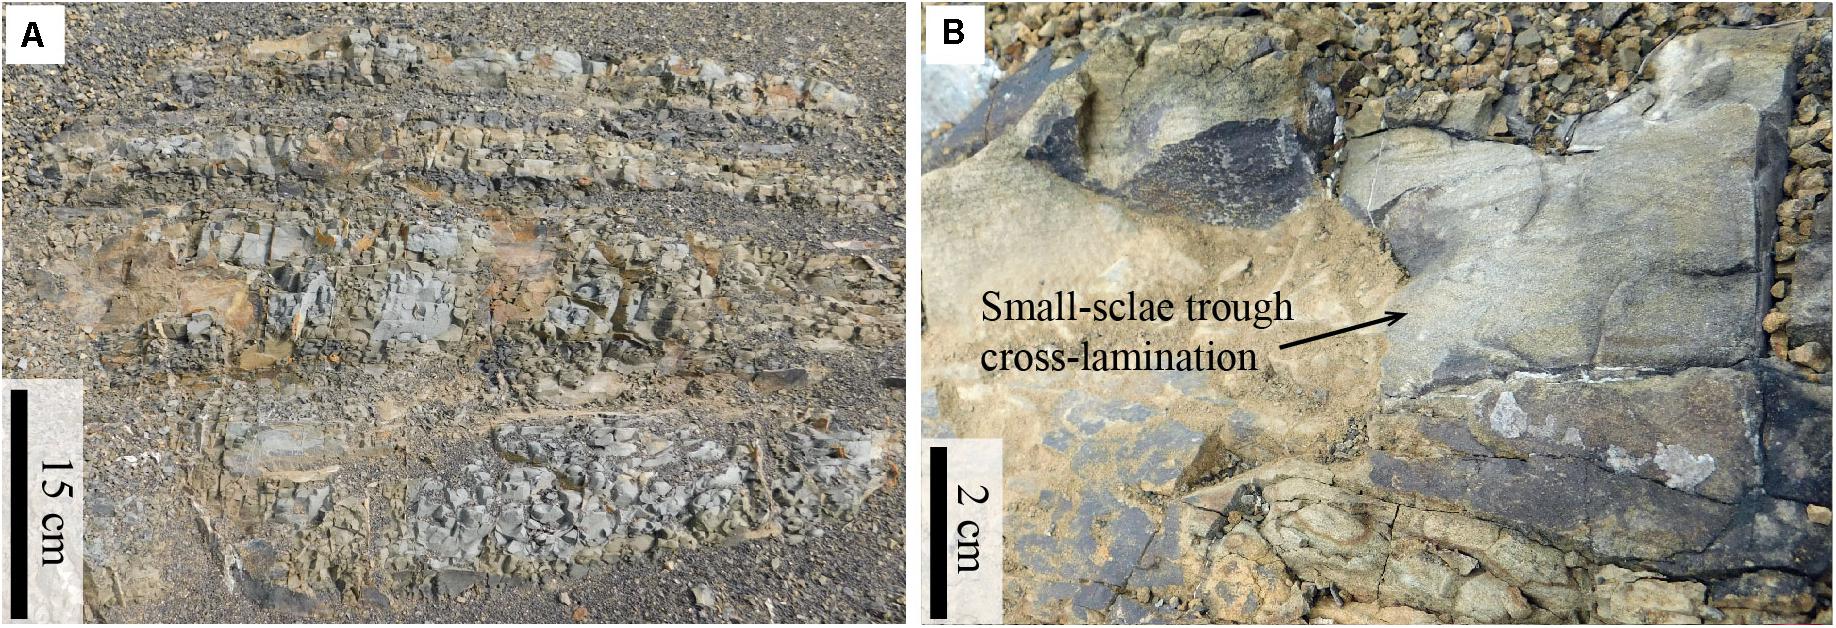
Figure 6. (A) Interbedded sandstone and siltstone facies (F3). (B) Small scale planar and through cross-laminations in sandstone bed of F3.
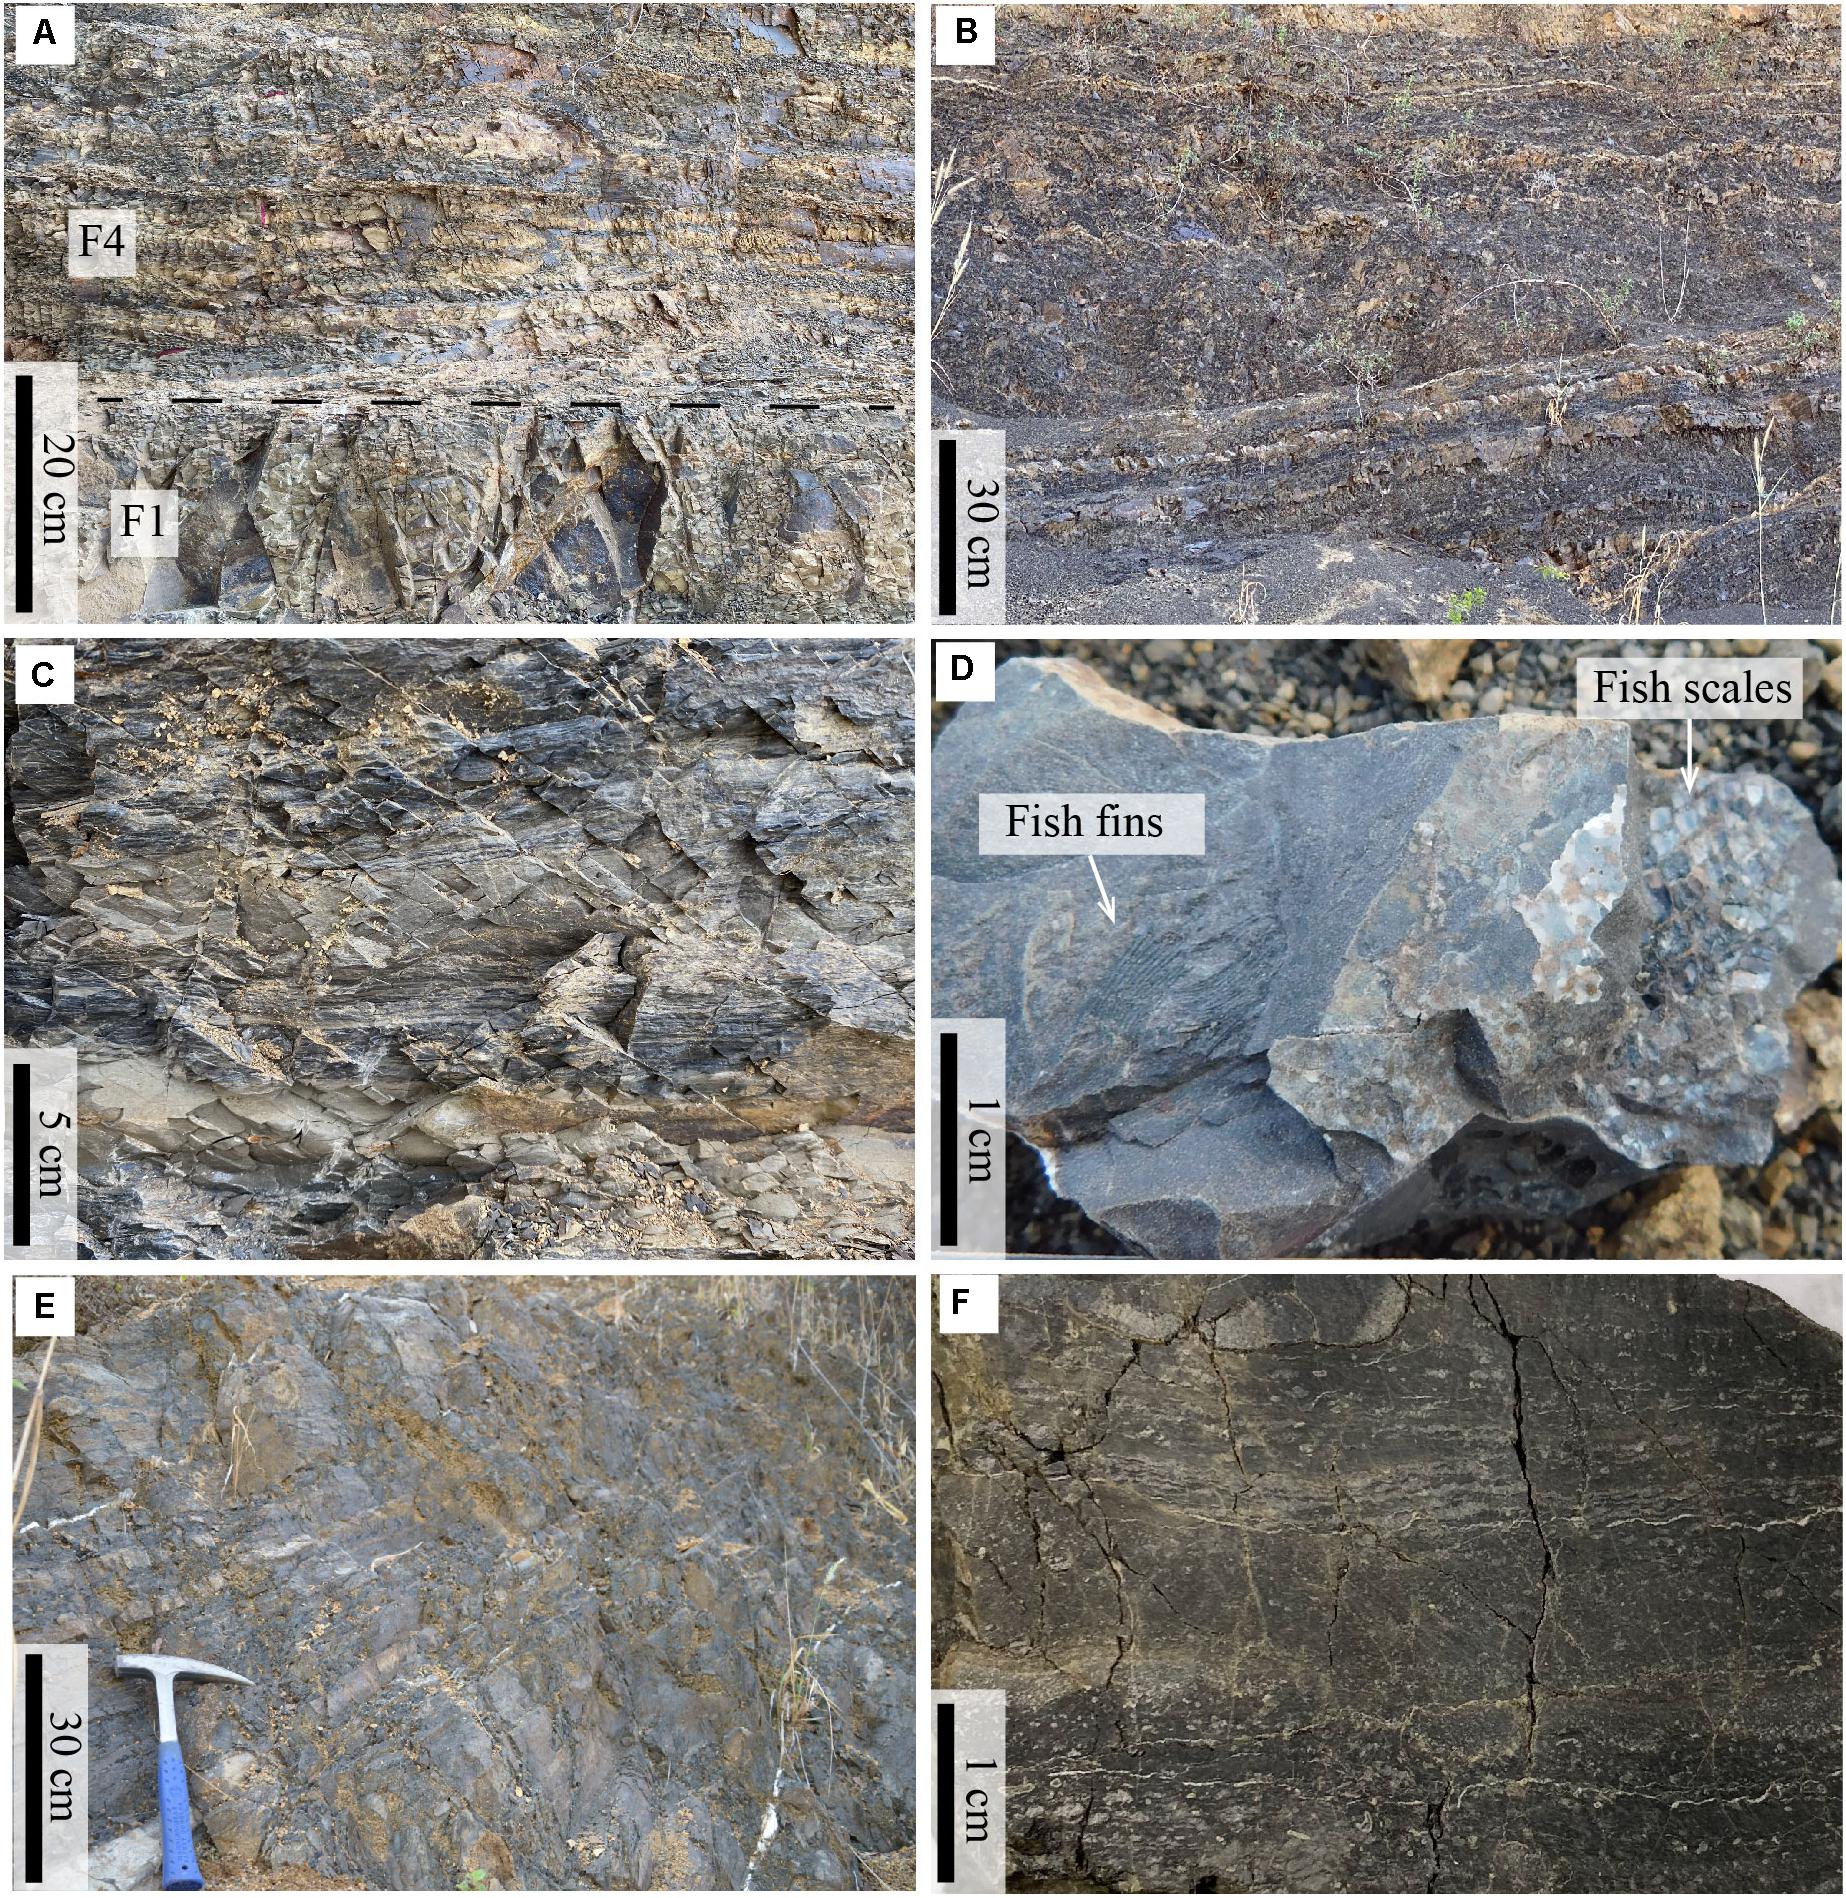
Figure 7. (A) Interbedded siltstone and mudstone facies (F4) in the lower part of the section, overlying sandstone of F1. (B) Interbedded siltstone and mudstone facies in the middle part of the section showing mudstone beds are dominant. (C) Laminated mudstone intercalated with structureless siltstone. (D) Fossil of fish scales and fins found in F4 in the middle part of the section. (E) parallel beds of calcareous mudstone facies (F5). (F) Close-up textures of calcareous mudstone, showing laminations.
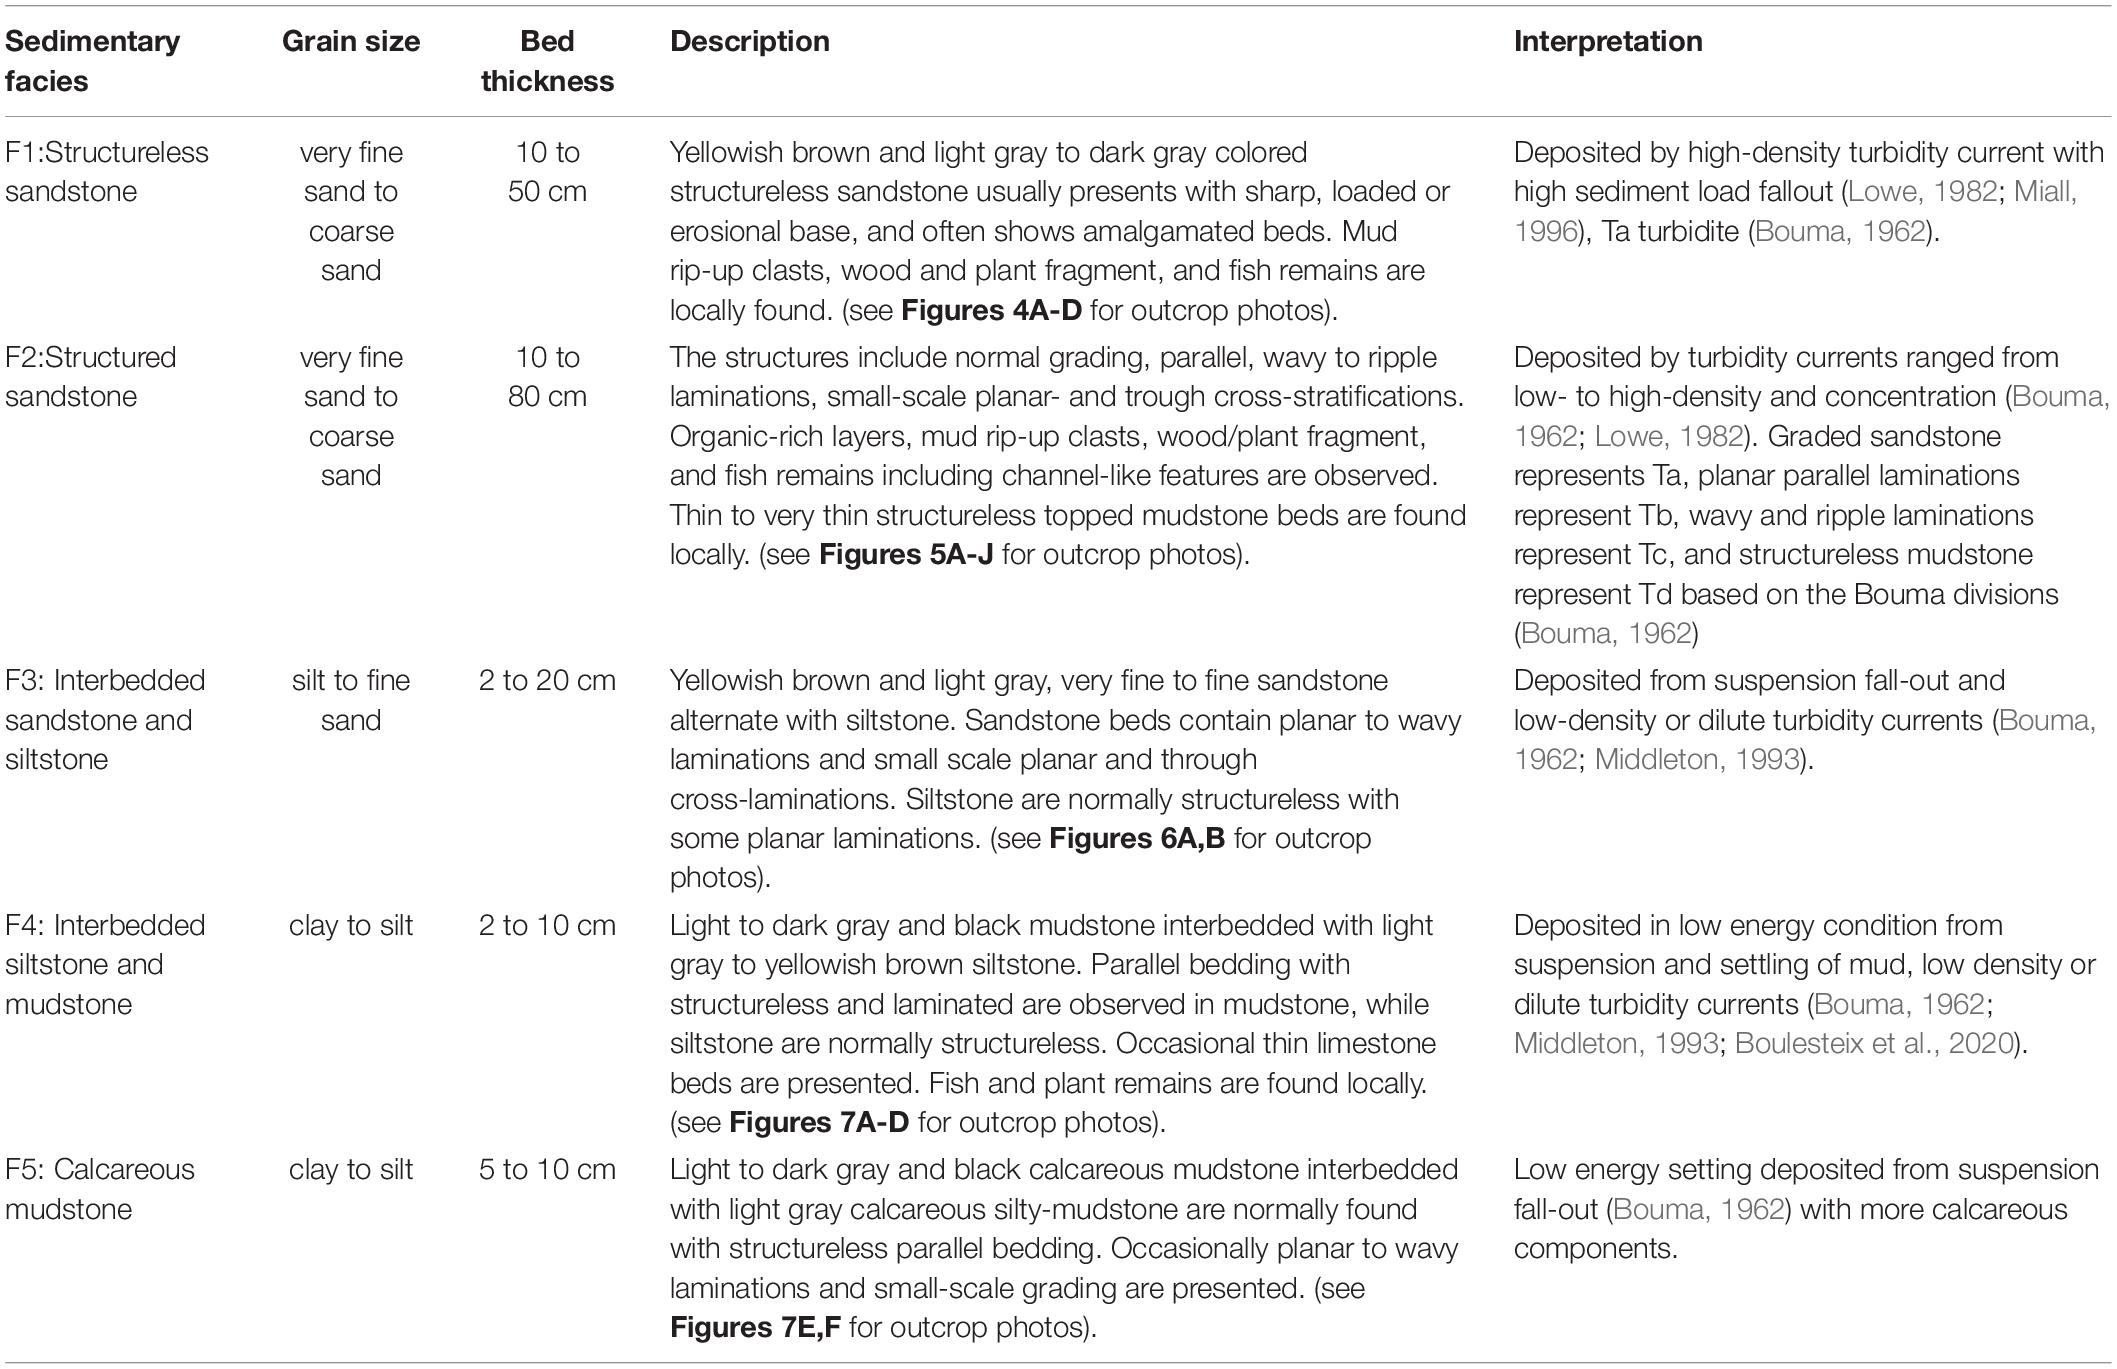
Table 1. Summary of sedimentary facies from the studied section.
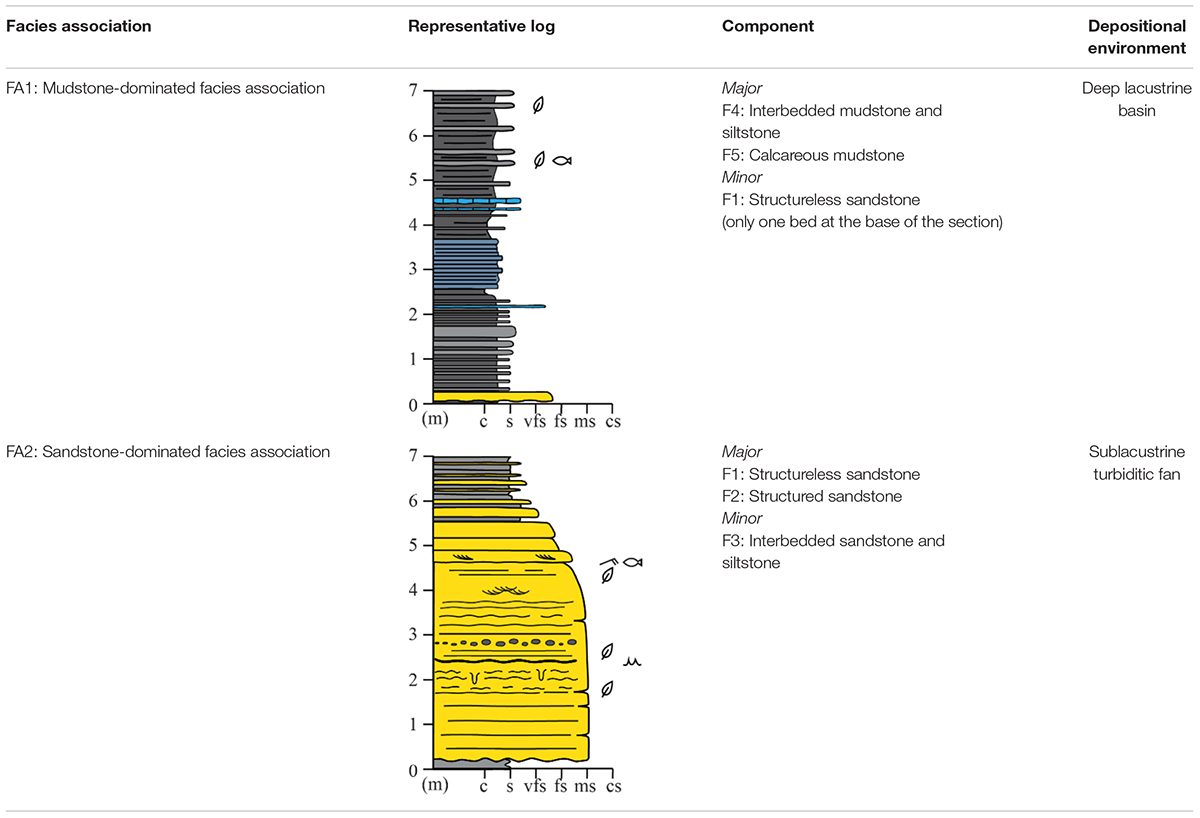
Table 2. Facies associations and representative logs.
Facies Association 1 (FA1): Mudstone-Dominated Facies Association
Facies association 1 (FA1) consists mainly of fine-grained sedimentary facies including interbedded mudstone and siltstone facies (F4), calcareous mudstone facies (F5), and occasional thin bedded structureless sandstone facies (F1) (Table 2). The FA 1 occurs in two main parts of the measured section; the lower part from 0 to 14.7 m and the middle part from 37.5 to 45.3 m. The lower part is dominated by F4 with a short interval of F5 and a thin bed of F1 at the base of this facies association. Fossils and trace fossils are rarely observed in the lower part. The frequency of siltstone beds intercalated with the mudstone in this part is higher than those in the middle part (Figures 7A,B). The middle part mainly comprises F4 with mudstone dominant. The FA1 is bounded by an erosional surface at the top of the facies association which changes into sandstone-dominated facies association.
Facies Association 2 (FA2): Sandstone-Dominated Facies Association
Facies association 2 (FA2) composes of structureless sandstone facies (F1), structured sandstone facies (F2) and interbedded sandstone and siltstone facies (F3) (Table 2). This facies association is encountered from 14.7 to 37.6 m in the lower part of the measured section and from 45.3 to 72.8 m in the upper part of the measured section overlying the FA1. The structureless sandstone facies (F1) is more dominant in the lower part and often presented as amalgamated beds (Figure 3). The structured sandstone facies (F2) is the main component of this facies association, especially in the upper part (Figure 3). The structureless sandstone beds are often overlain by parallel laminated sandstone and gradually change into wavy to ripple laminations with occasionally topped by thin structureless siltstone or mudstone (Figures 5A,B). The interbedded sandstone and siltstone facies, normally found on top of F1 and F2, are more abundant in the lower part than those in the upper part that occasionally appear as short intervals (Figure 3). The wood and plant fragments including fish scales and bioturbation are locally observed throughout the FA2.
Total Organic Carbon (TOC)
The TOC contents in this study range from 0.02 to 0.99 wt%. The lowest TOC value is recorded from sandstone and the highest TOC value is found in mudstone. The source rock potential of samples from the section can be classified as poor (0-0.5%) to fair (0.5-1%) based on the classification of Peters and Cassa (1994). The summary of the ranges and averages of TOC values in each facies is presented in Table 3.
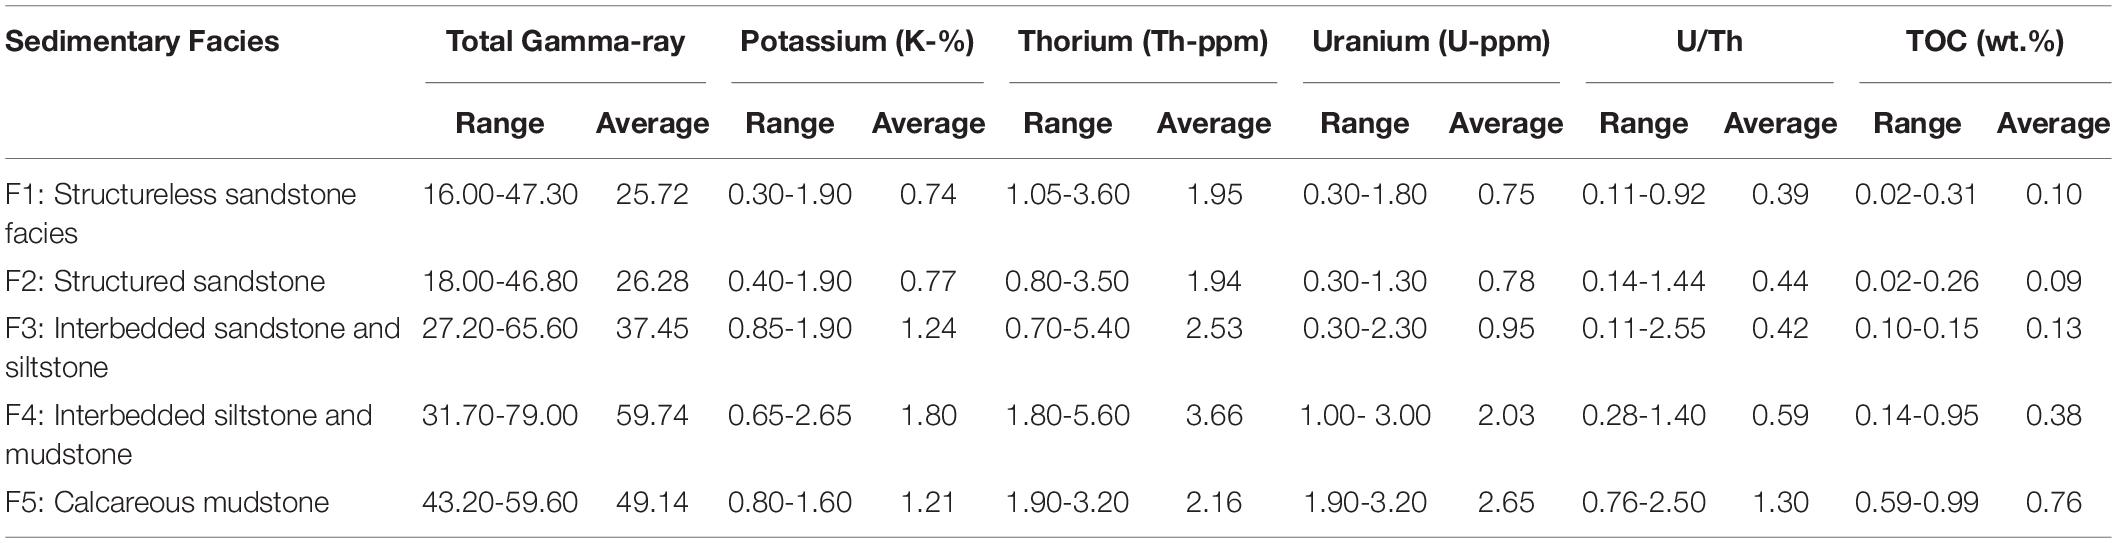
Table 3. Summary of total, spectral gamma-radiation values, U/Th ratios and TOC contents of sedimentary facies.
The TOC contents measured from the structureless sandstone facies (F1) show relatively low values, ranging from 0.02 to 0.31 wt% (Table 3). Similar to the F1, the TOC contents of the structured sandstone facies (F2) are generally low, ranging from 0.02 to 0.26 wt% (Table 3). The representative samples from interbedded sandstone and siltstone facies (F3) collected for TOC analysis are all siltstones which provide slightly higher TOC values (in average) than most of F1 and F2 samples, ranging from 0.10-0.15 wt%. The interbedded siltstone and mudstone facies (F4) yields a wide range of TOC contents from 0.14% in siltstone and up to 0.95% in mudstone. All TOC values from the collected samples are plotted against the stratigraphic log of the measured section (Figure 8). It can be observed that the TOC values from FA1 in the lower part seem to be averagely higher than TOC values analyzed from FA1 in the upper part. The TOC contents of calcareous mudstone facies (F5) show relatively higher values than other facie ranging from 0.59 to 0.99 wt% with average of 0.76 wt%.
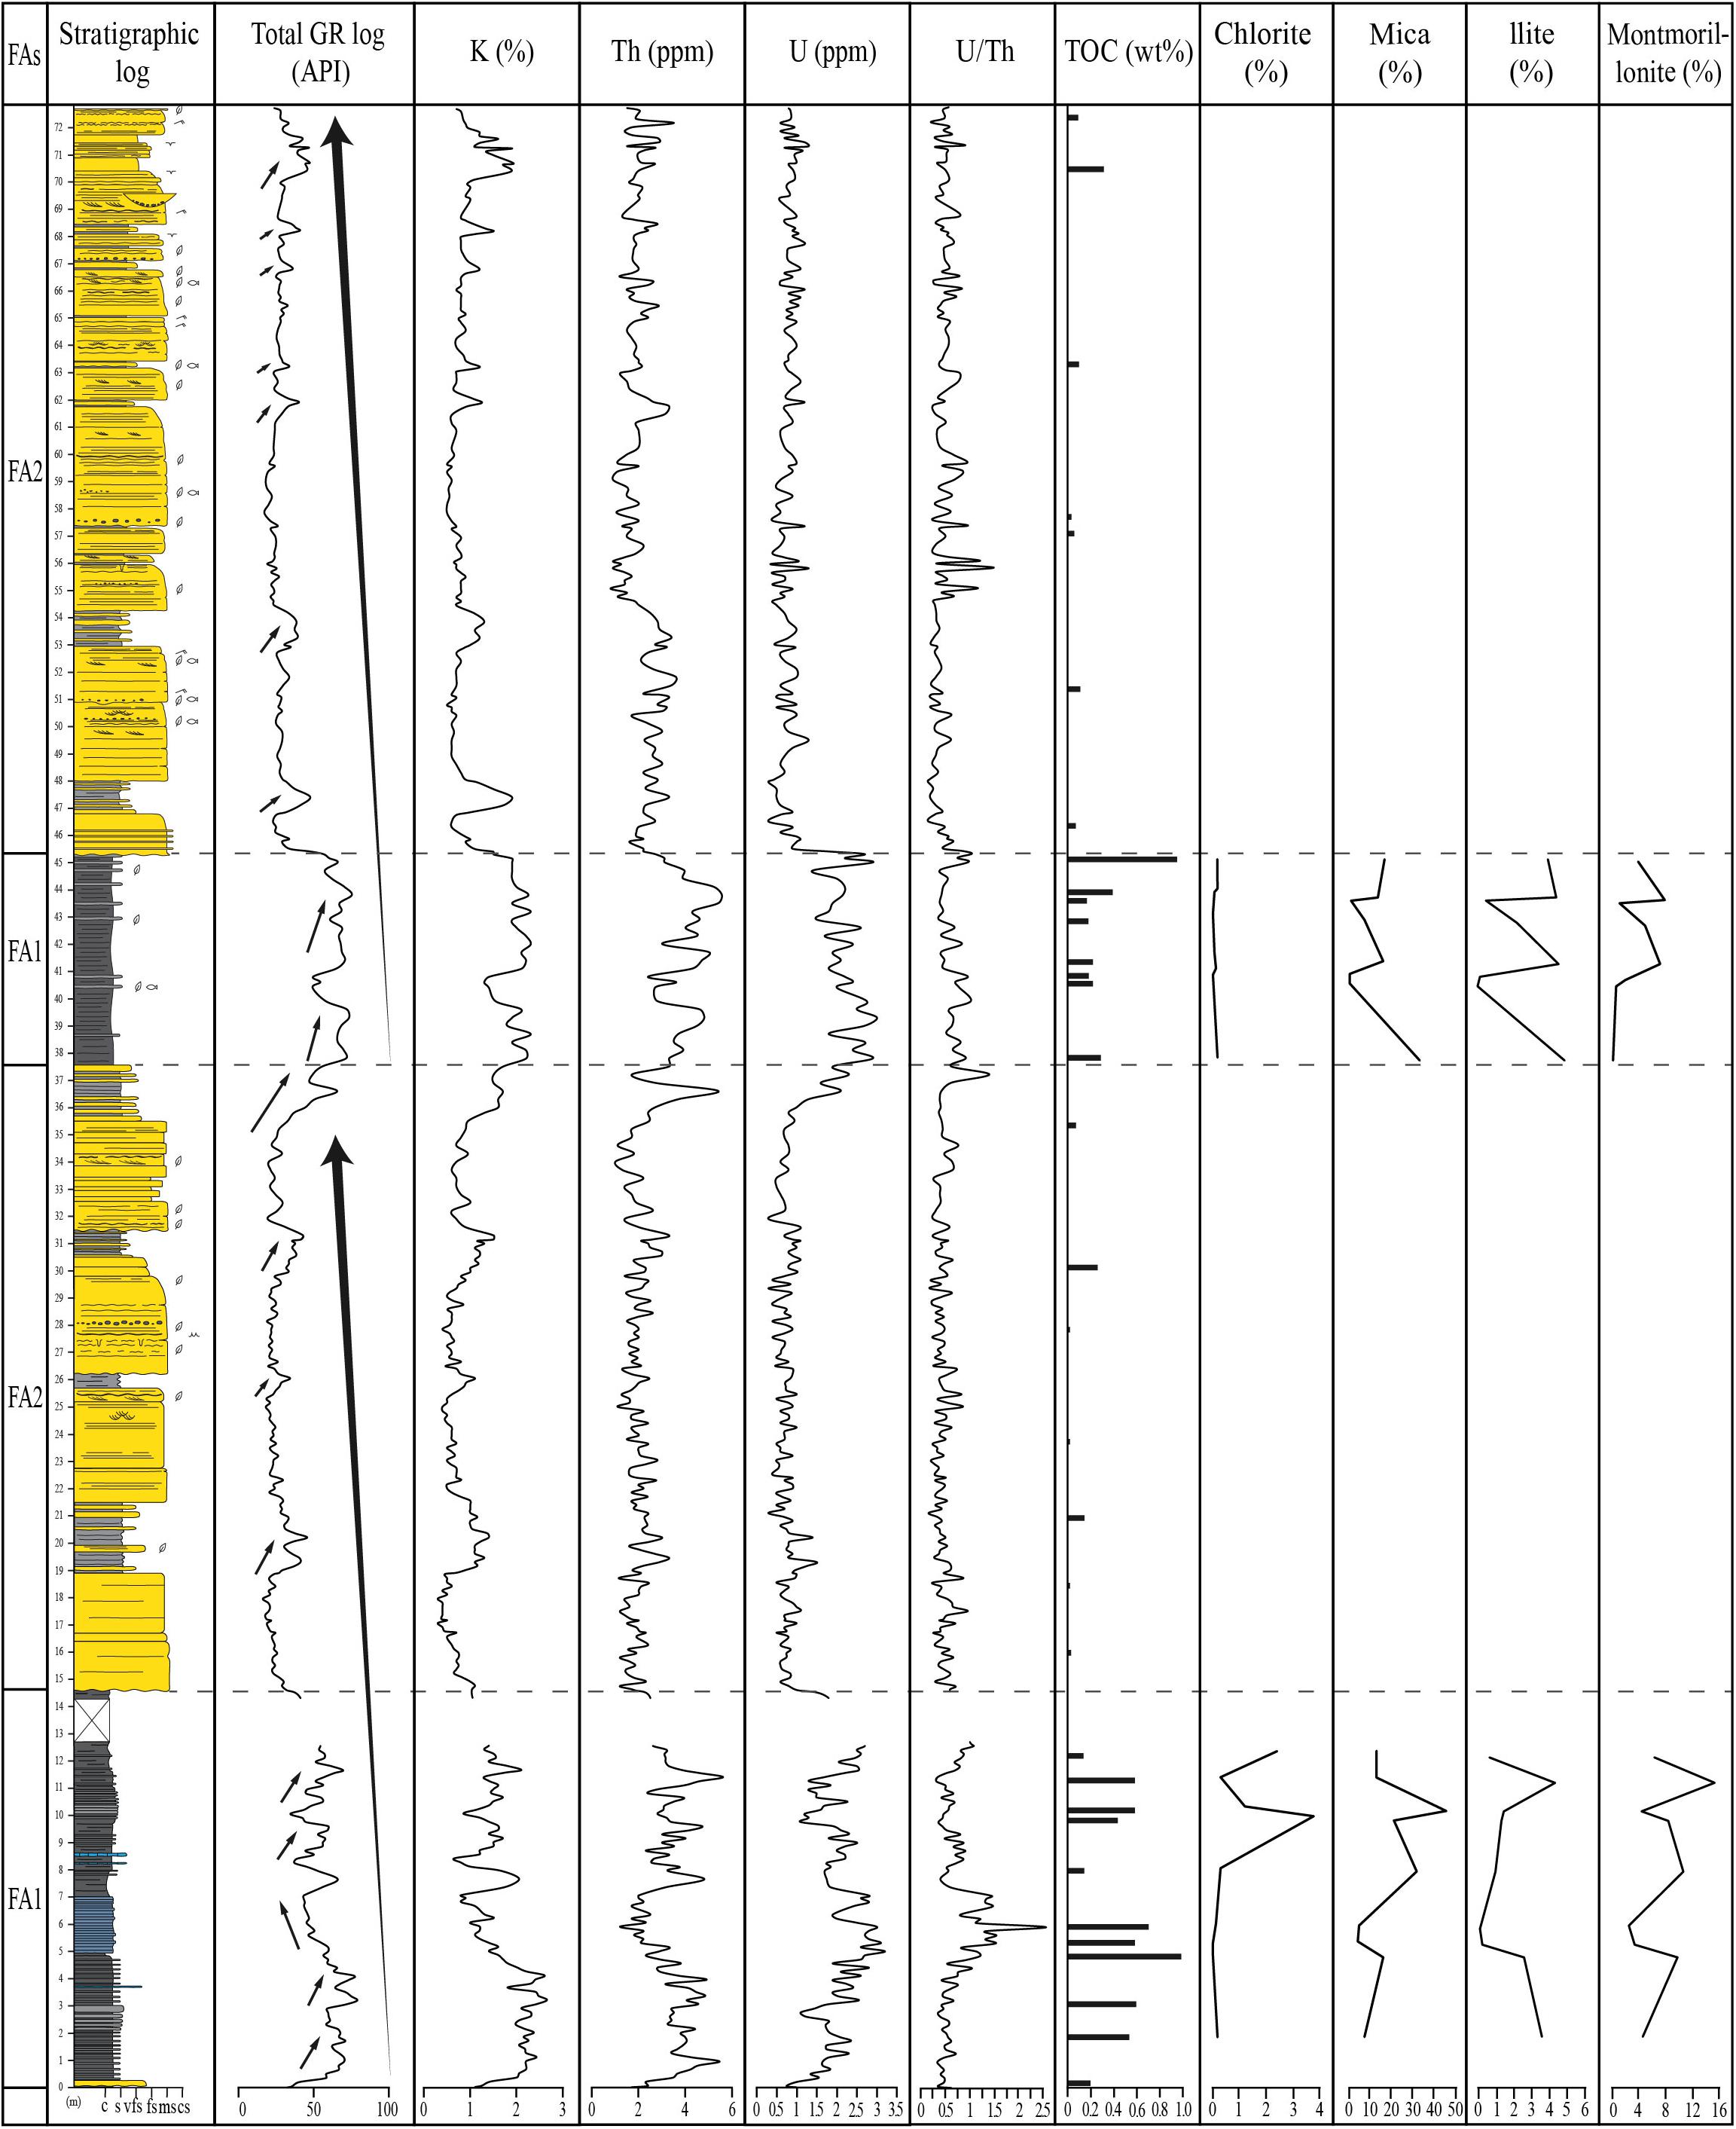
Figure 8. The lithology log of the studied section correlate with total and spectral gamma-ray logs composed of potassium (K), thorium (Th), uranium (U), U/Th ratios including the TOC abundance from the representative samples throughout the section. Facies association boundaries are presented in dash line. Two major coarsening upward cycles (large arrows) and several minor trends (small arrows) of the sections can be observed mainly from total gamma-ray log in correlation with the sedimentary facies from stratigraphic log. The abundances of clay minerals including chlorite, mica, illite and montmorillonite from mudstone samples are also included to provide the correlation with the other logs in the section.
Gamma-ray Responses
Total gamma-ray measurements in this study reveal highly variable values ranging from 16.0 to 79.0 (API unit). Spectral gamma-ray measurements are used to characterize the sedimentary facies and investigate a possible relationship between organic rich intervals and spectral gamma-ray responses. Ranges and average values of the total and spectral gamma-ray from each facies are summarized in the Table 3. The patterns and trends of total and spectral gamma-ray profiles are different in each sedimentary facies and provides a vertical change of facies associations (Figures 3, 8). The significant changes of gamma-ray trends usually correlate with changes in lithology related to mineral and clay contents. The spectral gamma-ray values are plotted to illustrate sedimentary facies along with the U/Th and the TOC profiles through the measured section (Figure 8). A clear differentiation of gamma-ray signals has been recognized between two facies associations representing different depositional environments (Figure 8). The gamma-ray pattern from the FA1 shows relatively high values corresponding to mudstone-dominated lithologies. The shape of the total and spectral gamma-ray logs from the FA1 is in a serrated or irregular shape. The gamma-ray pattern from the FA2 presents relatively low values due to the majority of sandstone presenting in this facies association. Most of the gamma-ray patterns show a low-amplitude box shape representing homogeneous lithology, such as high sand/shale ratio within the FA2. The characteristics of the total and spectral gamma-ray logs in each facies are described in the following sections.
Total Gamma-ray Responses
The overall trend of total gamma-ray in F1 is relatively low and ranges from 16.0 to 47.30 (API unit) with the average of 25.72 (Table 3). The pattern of the total gamma-ray log shows cylindrical or box shape with only small fluctuations and often has a clear boundary with mudstone- and siltstone-related facies of F3 and F4 (Figure 3). The gamma-ray response of F2 is similar to F1 having relatively low values for both facies (Figures 3, 8). The total gamma-ray values of F2 range from 18.00 to 46.80 API unit (Table 3). Graded structures can be observed from the total gamma-ray log with an increasing trend (e.g., at 29 m and 51 m). The gamma-ray responses of F3 range from 27.20 to 65.6 with average of 37.45 (API unit; Table 3). Serrated to irregular shape of total gamma-ray log from F3 is presented only in short intervals (less than 4 m thick) in the measured section. Gamma-ray responses from F3 are relatively high compared to surrounded sand-dominated facies, F1 and F2, due to lithology change into finer-grained sediments. The total gamma ray responses in F4 show relatively high values, ranging from 31.70 up to 79.00 (API unit) with the average of 59.74 (API unit). Gamma-ray responses of F4 are characterized by high amplitude with irregular shape (Figures 3, 8). The total gamma ray responses in F5 show relatively high values ranging from 43.20 to 59.60 with the average of 49.1 (API unit). However, the gamma-ray response reveals a slightly decrease in the calcareous mudstone interval within F5.
Spectral Gamma-ray Responses
The trend of the potassium log from F1 and F2 is relatively consistent with the total gamma-ray log showing a serrated box shape (Figure 8). Also, the Th and U values from F1 and F2 show a relatively low variance (Figure 8). The K, Th, and U responses from F3 show slightly high values compared to surrounded sandstone-dominated facies. These high values of the spectral gamma ray can be used to distinguish the interbedded sandstone and siltstone facies from sand-dominated facies in this study, possibly due to an increasing in clay minerals within siltstone beds. The spectral K and Th log patterns from F4 are normally consistent with the total gamma-ray log characterized by high-amplitude irregular shape. The variation of the spectral gamma ray in F4 are closely related to grain size and lithological variation in this facies. The K and Th contents in F4 range from 0.65 to 2.65% and from 1.80 to 5.60 ppm, respectively. Generally, the U response from F4 also presents relatively high values (1.00-3.00 ppm) with an irregular shape. However, the U response deviates from the K, Th and total gamma-ray in some parts of this F4, especially within high TOC zones (e.g., at 12.4 m and 45.1 m; Figure 8). From F5, the U concentration shows relatively high values coincident with the high TOC zones, while K and Th concentrations are relatively low compared to U concentration in the high TOC zones. Overall K and Th responses are similar in every facies though the measured section, but U responses are slightly different, especially in F5 where K and Th responses are decreased in calcareous mudstone. The high TOC zones in this study are not usually correlated with total gamma-ray responses. In contrast, the high concentration of U provides a relatively good correlation with high TOC in this measured section.
U/Th Log
The U/Th ratio is commonly used to indicate the redox conditions of the depositional system (Adams and Weaver, 1958; Wignall and Myers, 1988; Jones and Manning, 1994; Kimura and Watanabe, 2001; Lash and Blood, 2014; Zeng et al., 2015; Wang et al., 2017). The U/Th ratios in the measured section differ from 0.11 to 2.50 (Table 3), basically the value less than 0.5 indicates an oxic condition, 0.5 to 1.25 indicates a suboxic condition and more than 1.25 indicates an anoxic condition (Ferreira et al., 2020). The values of U/Th ratio show relatively high fluctuation throughout the section (Figure 8). In F1, F2 and F3, the values of U/Th ratio show relatively low values with high fluctuation. The average U/Th ratios of F1, F2 and F3 are 0.39, 0.44, and 0.42, respectively. The average value of U/Th ratio in F4 is 0.59 which is slightly higher than the F1, F2 and F3. The U/Th ratio of F5 can be clearly distinguished exhibiting relatively high values and the average value of 1.30. These high U concentrations indicate organic-rich mudstones with an anoxic condition based on U/Th ratio. The U peaks of the measured section are correlated with the calcareous mudstones and high TOC zones (Figure 8). It is also possible to observe that the U/Th ratio rises above 1.25 in the calcareous mudstone intervals suggested anoxic condition.
Mineral Composition From XRD Analysis
The mineral composition of the mudstone samples consists of quartz, calcite, siderite, and clay minerals which include chlorite, mica, illite, montmorillonite and kaolinite. The mineral composition results of the samples are presented in Supplementary Material. Chlorite, mica, illite and montmorillonite contents are plotted along the stratigraphic depth (Figure 8). Mica and montmorillonite are relatively abundant in the samples, while chlorite abundances are relatively low in all samples, especially in mudstone interval at the upper part of the section. The samples from F5 provide relatively low amounts of all clay minerals. In general, the contents of mica, illite and montmorillonite correspond to total gamma-ray, K and Th logs. A change in clay mineral contents (mica, illite and montmorillonite) from high to low is consistent with the decreasing trends from total gamma-ray, K and Th logs. In the other hand, the change in clay mineral contents is not consistent with U log (Figure 8).
Cross-Plots of Spectral Gamma-ray and TOC
The variation plots of spectral gamma-ray components (Th/K, Th/U and U/K) provide different distributions and trends in each sedimentary facies (Figure 9). The structureless sandstone facies (F1), structured sandstone facies (F2) and interbedded sandstone and siltstone facies (F3) tend to have lower Th, K and U contents from Th-K, Th-U and U-K cross-plots than interbedded siltstone and mudstone facies (F4) (Figure 9). These three facies fall within the same plotting area in every cross-plots. The interbedded siltstone and mudstone facies (F4) reveals relatively wide spread of data points with high contents in all spectral gamma-ray components (Th-K, Th-U, and U-K). The calcareous mudstone facies (F5) can be clearly observed with high U content in the Th-U and U-K cross-plots, but it overlaps with F1, F2 and F3 in the Th-K cross-plot (Figure 9). Thus, the Th-U and U-K cross-plots can be used to distinguished between sandstone and mudstone.
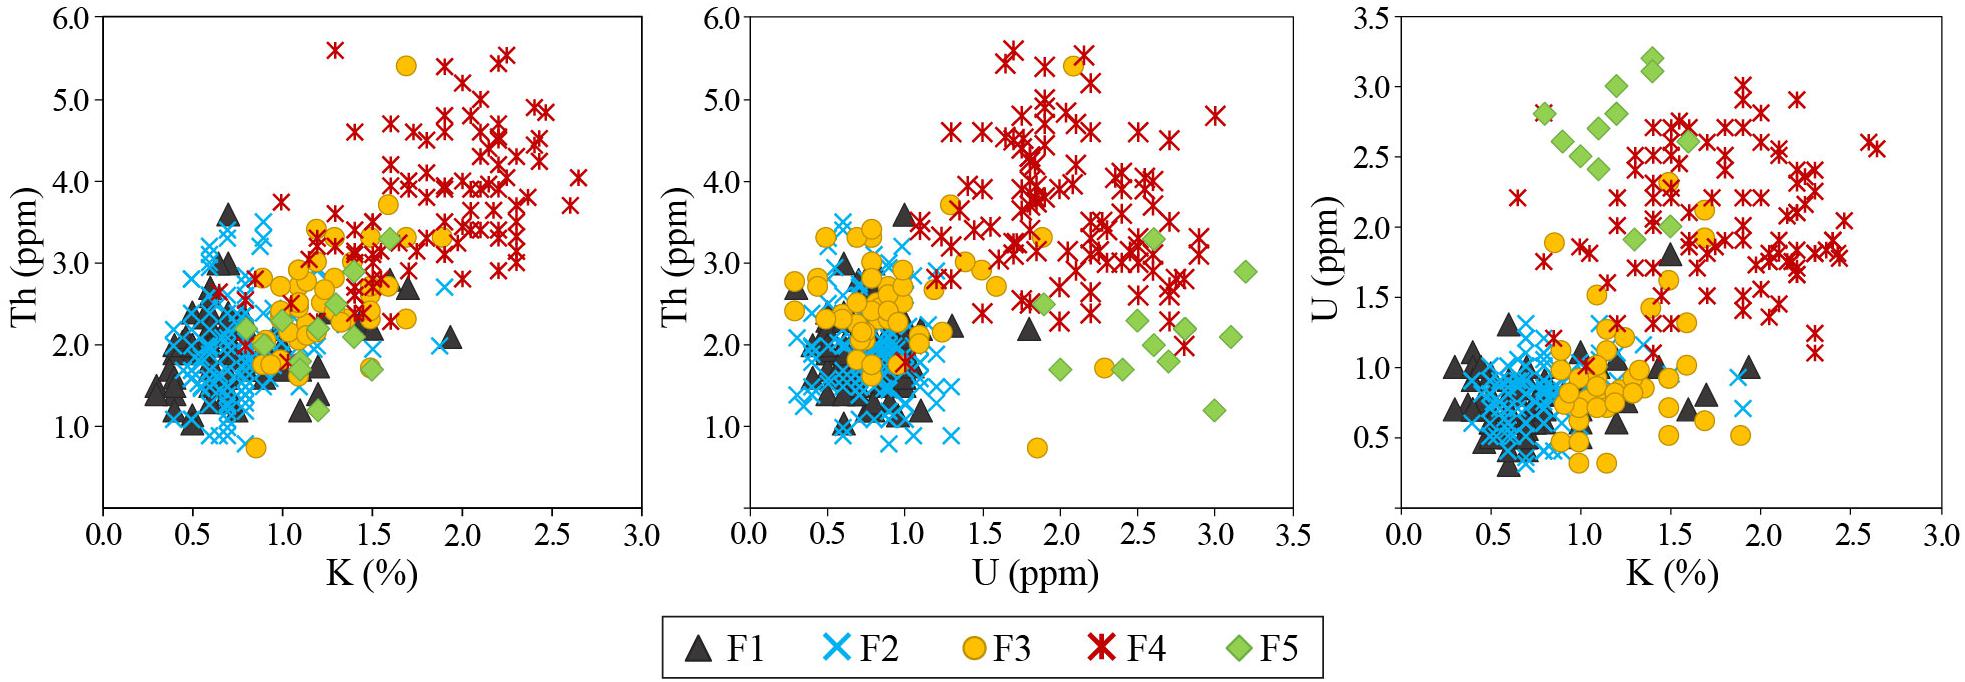
Figure 9. Cross-plots of K, U and Th from outcrop spectral gamma-ray measurements of difference identified facies. (F1: Structureless sandstone, F2: Structured sandstone, F3: Interbedded sandstone and siltstone, F4: Interbedded siltstone and mudstone, F5: calcareous mudstone facies).
The U/TOC ratio shows a moderate correlation of linear regression (R2 = 0.4977; Figure 10) and is higher than both K/TOC (R2 = 0.2792; Figure 10) and Th/TOC ratios (R2 = 0.1744; Figure 10). Although the linear relationships of U/TOC, K/TOC and Th/TOC are not in a good fit with the linear equations, the high U contents coincide with the high TOC contents, especially in the F5. Correlation coefficient is calculated to provide a correlation between variables of spectral gamma ray (U, K, and Th) and TOC values. The results show that the correlation coefficients (r) of U/TOC, K/TOC and Th/TOC are 0.7055, 0.5284, and 0.4177, respectively. The correlation coefficient of U/TOC is relatively strong relationship compared with K/TOC and Th/TOC.
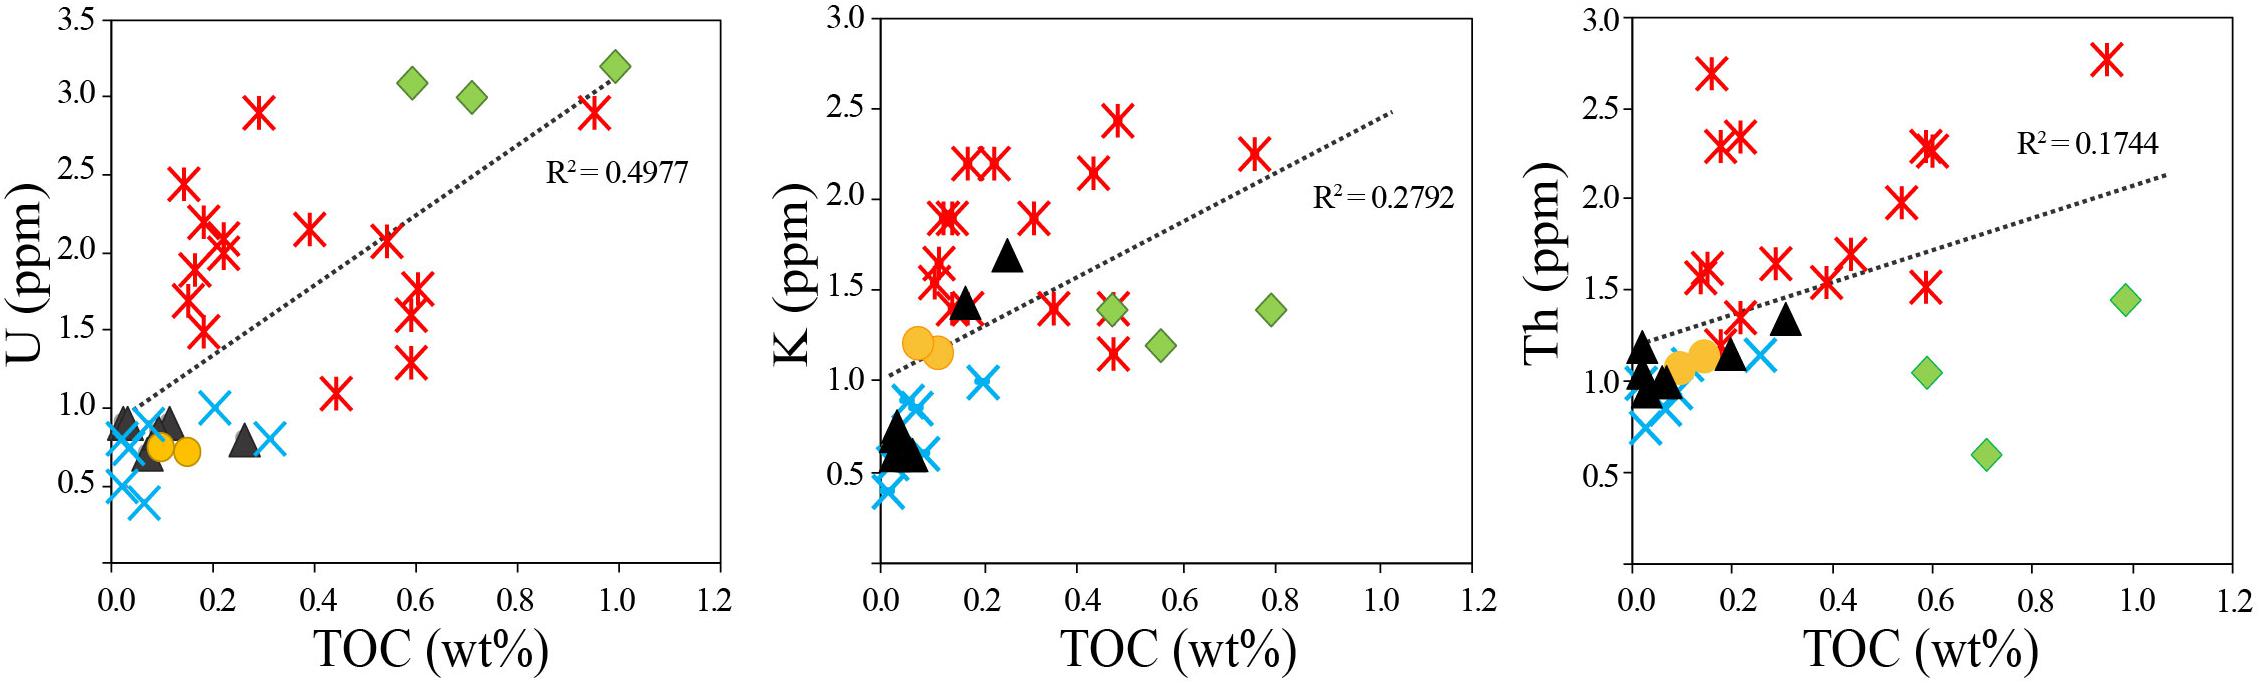
Figure 10. Plotting of U, K, and Th concentrations and TOC in five sedimentary facies provides a scattering pattern of data points.
Discussion
Depositional Environments and Trends
The depositional environment of the measured section is interpreted as an overall lacustrine environment with two subenvironments: deep lake basin containing mudstone-dominated facies (FA1), and sublacustrine fan comprising sandstone-dominated facies (FA2). The deposition of mudstone and siltstone of the FA1 suggests low energy environment deposited by suspension fall-out or low-density/dilute turbidity currents (Bouma, 1962; Middleton, 1993; Boulesteix et al., 2020), representing relatively deep lacustrine environment or in the lacustrine basin floor. The presence of plant fragments including leave and wood debris indicates non-marine terrestrial sources. However, the FA1 is encountered in two main parts of the measured section, upper and lower parts, and has slightly different features. These different features are probably caused by different conditions of the lake. For example, the presence of a short interval calcareous mudstone (F5) in the lower part of the measured section is possibly caused by an increasing in salinity or water depth within the lake during the time of the deposition. The depositional environment of the FA2 is interpreted as sublacustrine fan deposited from turbidity currents. The features observed in the FA2 including structureless sandstone, parallel laminated sandstone, wavy, ripple and cross laminated sandstone and structureless siltstone to mudstone represent Ta, Tb, Tc, and Te divisions of classic Bouma’s sequence (Bouma, 1962), respectively, indicating the deposition from turbidity current ranging from low-to high-density and concentration. However, the occurrence of complete Bouma sequence is rarely found, especially the parallel laminated siltstone of Td. The sequences are normally found as Tab (Figure 5A), Tabc, Tbc with occasional Te on the top of this association (Figure 5B). Sandstones mostly consist of medium to fine grains with little to no coarse-grained and conglomerate sediments. The majority of sandstone bodies both structured and structureless facies can be interpreted to represent the fan lobes (Prélat et al., 2009; Dodd et al., 2019), possibly in medial fan, while the interbedded sandstone and siltstone facies suggests relatively distal fan fringe of the sublacustrine fan (Dodd et al., 2019; Boulesteix et al., 2020).
Vertical trends of the depositional environments in the measured section reveal major and minor changes indicating changes in accommodation space and/or sediment supply. Two main cycles of the coarsening-upward trends can be distinguished from both the stratigraphic and the total gamma-ray logs (Figure 8). Each cycle contains vertical facies development from the FA1 to FA2. Small cycles of fining-upward trends are also presented in both facies associations. The FA1 illustrate small cycles (approximately 0.5 to 2 m.) changing from siltstone to mudstone, while the small cycles of the FA2 changing from amalgamated sandstone (F1 and F2) into intercalations of fine sandstone and siltstone (F3) (Figure 8).
The first cycle occurs in the lower part of the measured section (37.6 m thick) consisting of interlayered mudstone and siltstone packages at the base with a short interval of calcareous mudstone (F5) representing a deep lacustrine setting, and overlying sandstone-dominated succession (FA2) representing the sublacustrine fan, with an erosional contact at the base of the sandstone (Figures 3, 8). The change of vertical facies associations suggests progradation basinward of the sublacustrine turbidite fan to the deeper lacustrine environment which relate to decrease in accommodation space or an increasing in sedimentary supply, or a combination. Internally, apart from the decreasing gamma-ray trend corresponding to the facies change of F4 to more calcareous component of F5, the FA1 in the lower part also comprises small fining-upward trends (approximately 0.5 to 2 m.) which can only be observed in the total gamma-ray log, while the outcrop investigations do not clearly show these trends. These are possibly caused by the change of mineral compositions in the mudstones and siltstones indicating higher clay contents which reflects in the increase of gamma-ray values. The succession of the FA2 in the lower part contains short cycles fining-upward trends of sandstone bodies, representing turbidite lobes, grading into interbedded sandstone and siltstone, representing relatively distal lobes or lobe fringes, which can be observed in three cycles. These indicate moderate change in lake systems such as fluctuation of lake level, accommodation space and sediment supply (Bohacs et al., 2000).
The second cycle is presented in the middle to upper part of the section, starting from 37.6 to 72.8 m, with making the unit of 35.2 m thick (Figure 9). The boundary between the first and second cycles is marked by an abrupt upward deepening of facies from turbidite sandstones to deep lacustrine mudstone suggested a rapid change in depositional conditions. The major components and development of the facie associations in the second cycle are similar to the first cycle which generally contains the FA1 overlain by the FA2. There is a slightly difference between these two cycles leading to lithological variations. For example, the FA1 in the first cycle has a higher salinity or a higher water depth than the FA1 in the second cycle supported by the presence of calcareous component in the sediments and lack of paleo-biological activities within the sedimentary successions. As hydrology of the lake, controlled by accommodation and supply of sediment and water, affects sedimentary deposition, and higher salinity water of closed lake allows more chemical sediments to deposit (Bohacs et al., 2000). The higher salinity also has an effect on the abundance of biological activity in the lake suggested by rare bioturbation evidences due to the salinity stress (Buatois and Mángano, 2009). Interbedded between siltstone and mudstone is more frequency within the FA2 in the first cycle than in the second cycle. This may suggest that the variation in depositional conditions during the first cycle is higher than in the second cycle. The FA2 presented in the second cycle provides a progradation with a stacking pattern related to sublacustrine fan.
Source Rock Potential and Depositional Controls
Lacustrine shales of the Huai Hin Lat Formation have been recognized as one of potential source rock in the Khorat basin (Booth, 1998; Racey, 2011). The TOC contents are variable from approximately 0.2 to 5.0% (Racey, 2011) and from 1.9 to 10.09% from black shales and coaly shales in some locations (Arsairai et al., 2016, 2020). In this study, the total organic carbon contents show relatively low values from 0.02 to 0.99 wt% which can be classified as poor to fair potential source rock (Peters and Cassa, 1994). Rocks exceeding 0.50 wt% TOC are restricted to the samples from the mudstone-dominated facies association of the deep lacustrine environment (Table 3).
The deposition of organic-rich rocks in lacustrine environment is dominantly controlled by the relation of production, destruction and dilution (Bohacs et al., 2000, 2005; Katz, 2005). The production refers to the source of organic matter both allochthonous transported from land and autochthonous derived from algae and aquatic plant (Bohacs et al., 2000, 2005). The destruction of organic matter occurs by bacteria in oxygenated water condition, while the anoxic condition, usually occurred in deep bottom water where the oxygen is limited, enhance the preservation of the organic matter (Bohacs et al., 2000, 2005). The dilution of organic matter is caused by the abundance of clastic detritus that decrease the organic matter proportions (Bohacs et al., 2000, 2005). Even though the organic source from the algae and aquatic plant cannot be physically observed, the evidences from the studied outcrop reveal abundance of plant/wood fragment transported from land which can be the source of the organic matter in the basin. The frequency of siltstone intercalations in the FA1indicates the possibility of dilution by the clastic materials. Thus, the controls on the organic-richness in deep lacustrine facies from this location possibly relate to the preservation of organic matter due to the depositional area is probably not deep enough to allow the anoxic condition to prevailed, and the dilution by the disturbed detrital sediments from the turbidity current in the adjacent areas. However, the high salinity condition of deep lacustrine facies association in the lower part, representing by the calcareous mudstone facies, provide higher TOC which suggests that higher salinity of lake hydrology enhance the favorable condition for organic matter preservation which is consistent with the previous finding (e.g., Bohacs et al., 2000).
Using Gamma-ray Log for Interpretation of Depositional Environment and Recognition of Organic-Rich Intervals
Gamma-ray can successfully distinguish changes in lithology based on mineral compositions in this study. However, using the gamma-ray log shape alone can lead to misinterpretation as similar patterns and API values can represent several depositional environments (Selley, 1978; Cant, 1992). For example, the coarse-grained sandstone and calcareous mudstone intervals in this study cannot be distinguished from each other using the gamma ray responses and patterns alone. The coarse-grained sandstone and calcareous mudstone intervals show low response of gamma-ray, while mudstone intervals are indicated by high response of gamma-ray. The use of spectral gamma responses is then useful for detailed interpretation of depositional environments, because K, Th, and U are found to be abundant in different minerals and depositional environments. K is usually found within orthoclase (K-feldspar), mica (muscovite) illite and glauconite (Fabricius et al., 2003). Th is found in heavy minerals (e.g., monazite, zircon, and rutile) and can be fixed to clay minerals by adsorption (Hassan et al., 1976). U has greater mobility and transport than K and Th, and can be precipitated under reducing conditions leading to the adsorption of U into clay minerals or organic materials (Swanson, 1961; Fabricius et al., 2003; Ellis and Singer, 2008).
The minerals of chlorite, mica, illite and montmorillonite are observed in most non-calcareous mudstone samples from XRD analysis (Figure 8). These minerals are confirmed to have high K and Th concentrations in the non-calcareous mudstones, while the calcareous mudstones have low abundance of these minerals. Based on depositional environment interpretation and U/Th ratios, the thick mudstone sequence in this measured section is deposited in deep lacustrine with suboxic to anoxic conditions. Organic matter can be preserved in this environment giving a petroleum potential source rock. Without thermal maturation studies, we cannot discuss why the TOC values are low in this section. The calcareous mudstones are deposited in deeper water of stratified lakes and more reducing conditions than the non-calcareous mudstones deposited in suboxic condition based on U/Th ratio. The depositional conditions of the calcareous mudstones are likely to provide U adsorbed to organic materials. For example, the duration of anoxia that is possibly long enough for the uranium adsorption in deep water lake (Myers and Wignall, 1987; Lüning and Kolonic, 2003). Low K and Th responses in the calcareous mudstone intervals are likely caused by K- and Th-depletions of feldspars and clay minerals (chlorite, mica, illite and montmorillonite) (Figure 8). These minerals are usually deposited partly or completely in proximal fan or shallow water lake before reaching to deep water lake where the calcareous mudstone deposits. K- and Th-depletions are supported by calcite precipitation coinciding with low responses of K and Th in this interval. The calcite precipitation in the intervals has high impact on the total gamma-ray response showing low values as calcite provides low gamma radiation (Rider, 1996).
The non-calcareous mudstones have a higher concentration of K, Th, and U and can be clearly distinguished from the sandstone dominated facies association in this measured section. The calcareous mudstone facies shows low gamma-ray response which is similar to the sandstone-dominated facies association in this study. Without spectral gamma-ray responses, the calcareous mudstone interval would be grouped into sandstone-dominated facies. Thus, using the total gamma-ray log for indicating the organic-rich rocks could provide erroneous interpretation, especially in the intervals containing calcareous composition. The U spectral gamma ray is suggested to combine with conventional gamma ray log for depositional environment and recognition of organic-rich intervals.
The cross-plot of spectral gamma-ray values of each facies can be used to differentiate between the sedimentary facies. The K-Th cross-plot can be distinguished between sedimentary facies except for the F5 which overlapped with F3. This possibly relates to the similar amount of clay mineral contents in the F5 and F3. The cross-plots of U-Th and U-K are clearly distinguished the F5 facies due to high U component in this facies (Figure 9). As F5 facies having high TOC contents is characterized by low K and Th concentrations and high U concentration, the results of cross-plots suggest that the organic-rich intervals can be distinguished using the U component.
In addition, the U/TOC ratio shows a moderate correlation of linear regression (R2 = 0.4977; Figure 10) and is higher than both K/TOC (R2 = 0.2792; Figure 10) and Th/TOC ratios (R2 = 0.1744; Figure 10). The moderate correlation on U/TOC could be resulted from several factors such as primary uranium concentration, lithological composition, sedimentation rate and duration of anoxia, and diagenetic factors (e.g., Lüning and Kolonic, 2003). Although, the U/TOC ratio is not illustrated a good fit with the linear equation, the correlation coefficient of U/TOC indicates that the correlation between these variables is strong (r = 0.7055).
Conclusion
The studied outcrop of the Huai Hin Lat Formation in Phetchabun Province was investigated in detail to provide the stratigraphic framework, sedimentary facies, the total organic carbon (TOC), the gamma-ray log characteristics, and the interpretation of depositional environments of the section. Five sedimentary facies were discriminated including structureless sandstone, structured sandstone, interbedded sandstone and siltstone, interbedded siltstone and mudstone, and calcareous mudstone facies. These facies were assigned into two facies associations, mudstone-dominated facies association and sandstone-dominated facies association, representing the deep lacustrine basin and sublacustrine fan respectively. The TOC contents throughout the section suggest poor to fair potential source rock (0.02 – 0.99 wt%) which are controlled by the depositional conditions. The outcrop gamma-ray measurements show high variability of the gamma radiation (16.0 to 79.0 API unit) corresponding to the lithologies. The total gamma-log characteristics are closely related to the lithologies controlled primarily by clay mineral compositions including chlorite, mica, illite and montmorillonite. The mudstones usually have K, Th and U concentrations. The U concentration is useful to investigate organic-rich rocks in low K and Th concentration successions due to its ability to fixed in clay minerals and organic materials under an anoxic condition. Thus, the U spectral gamma ray is suggested to combine with conventional gamma ray log for depositional environment and recognition of organic-rich intervals.
Data Availability Statement
The original contributions presented in the study are included in the article/Supplementary Material, further inquiries can be directed to the corresponding author/s.
Author Contributions
This research was part of the Ph.D. project of CP. The research plan was thus developed between the Ph.D. candidate and the supervisors PC. The data analysis and interpretation was conducted by all authors. The manuscript was also developed, written and revised by all authors. PC approved the final version of the manuscript.
Funding
This research was supported by the 90th Anniversary of Chulalongkorn University Fund (Ratchadaphisek Somphot Endowment Fund: GCUGR1125633074D). Reviewers are thanked for their useful and constructive comments.
Conflict of Interest
The authors declare that the research was conducted in the absence of any commercial or financial relationships that could be construed as a potential conflict of interest.
Acknowledgments
The authors thank the Office of Research Affairs, Chulalongkorn University, for assistance during manuscript preparation.
Supplementary Material
The Supplementary Material for this article can be found online at: https://www.frontiersin.org/articles/10.3389/feart.2021.638862/full#supplementary-material
References
Adams, J., and Weaver, C. (1958). Thorium-to-Uranium ratios as indicators of sedimentary processes: example of concept of geochemical facies. AAPG Bull. 42, 387–430.
Aigner, T., Schauer, M., Junghans, W. D., and Reinhard, T. L. (1995). Outcrop gamma-ray logging and its applications: examples from the German Triassic. Sediment. Geol. 100, 47–61. doi: 10.1016/0037-0738(95)00102-6
Arsairai, B., Feng, Q., Chonglakmani, C., Wannakomol, A., and Vattanasak, H. (2020). Geochemical indices and palynology comparison used for paleoproductivity and paleoredox conditions of the Huai Hin Lat formation in part of Loei-Petchabun Fold Belt in central Thailand. Songklanakarin J. Sci. Technol. 42, 621–630.
Arsairai, B., Wannakomol, A., Feng, Q., and Chonglakmani, C. (2016). Paleoproductivity and paleoredox condition of the Huai Hin Lat Formation in northeastern Thailand. J. Earth Sci. 27, 350–364. doi: 10.1007/s12583-016-0666-8
Aziz, H., Ehsan, M., Ali, A., Khan, H. K., and Khan, A. (2020). Hydrocarbon source rock evaluation and quantification of organic richness from correlation of well logs and geochemical data: a case study from the sembar formation, Southern Indus Basin, Pakistan. J. Nat. Gas Sci. Eng. 81:103433. doi: 10.1016/j.jngse.2020.103433
Bohacs, K. M., Carroll, A. R., Neal, J. E., and Mankiewicz, P. J. (2000). “Lake-basin type, source potential, and hydrocarbon character: an integrated sequence-stratigraphic-geochemical framework,” in Lake Basins Through Space and Time, eds E. H. Gierlowski-Kordesch and K. R. Kelts (Tulsa, OK: AAPG).
Bohacs, K. M., Grabowski, G. J. Jr., Carroll, A. R., Mankiewicz, P. J., Miskell-Gerhardt, K. J., Schwalbach, J. R., et al. (2005). “Production, destruction, and dilution—the many paths to source-rock development,” in The Deposition of Organic-Carbon-Rich Sediments: Models, Mechanisms, and Consequences, ed. N. B. Harris (Broken Arrow, OK: SEPM Special Publications), 61–101. doi: 10.2110/pec.05.82.0061
Booth, J. E. (1998). “The Khorat Plateau of NE Thailand-exploration history and hydrocarbon potential,” in Proceedings of the 1998 SEAPEX Exploration Conference, Singapore, 169–202.
Booth, J. E., and Sattayarak, N. (2011). “Subsurface carboniferous – cretaceous geology of northeast Thailand,” in The Geology of Thailand, eds M. F. Ridd, A. J. Barber, and M. J. Crow (London: Geological Society of London), 185–222. doi: 10.1144/goth.9
Boulesteix, K., Poyatos-Moré, M., Hodgson, D. M., Flint, S. S., and Taylor, K. G. (2020). Fringe or background: characterizing deep-water mudstones beyond the basin-floor fan sandstone pinchout. J. Sediment. Res. 90, 1678–1705. doi: 10.2110/jsr.2020.048
Bouma, A. H. (1962). Sedimentology of Some Flysch Deposits: A Graphic Approach to Facies Interpretation. Amsterdam, NY: Elsevier.
Buatois, L. A., and Mángano, M. G. (2009). Applications of ichnology in lacustrine sequence stratigraphy: potential and limitations. Palaeogeogr. Palaeoclimatol. Palaeoecol. 273, 127–142. doi: 10.1016/j.palaeo.2008.10.012
Cant, D. J. (1992). “Subsurface facies analysis,” in Facies Models, Response to Sea Level Changes, eds R. G. Walker and N. P. James (St. John’s, NL: Geological Association of Canada), 27–45.
Chonglakmani, C. (2011). “Triassic,” in The Geology of Thailand, eds M. F. Ridd, A. J. Barber, and M. J. Crow (St. John’s, NL: Geological Society of London). doi: 10.1016/j.tecto.2016.06.015
Chonglakmani, C., and Sattayarak, N. (1978). “Straigraphy of the Huai Hin Lat Formation (Upper Triassic) in northeastern Thailand,” in Proceedings on the Third Conference on Geology and Mineral Resources of Southeast Asia, Bangkok, 739–762.
Correia, G., Duarte, L. V., Pereira, A., and Silva, R. L. (2012). Outcrop spectral gamma-ray: applications to the sinemurian-pliensbachian organic-rich facies of the Lusitanian Basin (Portugal). J. Iber. Geol. 38, 373–388. doi: 10.3140/bull.geosci.1315
Davies, S. J., and Elliott, T. (1996). “Spectral gamma ray characterization of high resolution sequence stratigraphy: examples from Upper Carboniferous fluvio-deltaic systems, County Clare, Ireland,” in High Resolution Sequence Stratigraphy: Innovations and Applications, Vol. 104, eds J. A. Howell and J. F. Aitken (London: Special Publication of the Geological Society London), 25–35. doi: 10.1144/gsl.sp.1996.104.01.03
Dodd, T. J., McCarthy, D. J., and Richards, P. C. (2019). A depositional model for deep−lacustrine, partially confined, turbidite fans: early cretaceous, North Falkland Basin. Sedimentology 66, 53–80. doi: 10.1111/sed.12483
Evans, R., Mory, A. J., and Tait, A. M. (2007). An outcrop gamma ray study of the Tumblagooda Sandstone, Western Australia. J. Pet. Sci. Eng. 57, 37–59. doi: 10.1016/j.petrol.2006.02.004
Fabricius, I. L., Fazladic, L. D., Steinholm, A., and Korsbech, U. (2003). The use of spectral natural gamma-ray analysis in reservoir evaluation of siliciclastic sediments: a case study from the Middle Jurassic of the Harald Field, Danish Central Graben. Geol. Surv. Denmark Greenland (GEUS) Bull. 1, 349–366. doi: 10.34194/geusb.v1.4677
Ferreira, E., Mateus, A., Azerêdo, A. C., Duarte, L. V., Mendonça-Filho, J., and Tassinari, C. C. (2020). Tracing bottom-water redox conditions during deposition of lower and upper jurassic organic-rich sedimentary rocks in the Lusitanian Basin (Portugal): insights from inorganic geochemistry. Mar. Pet. Geol. 117:104343. doi: 10.1016/j.marpetgeo.2020.104343
Fertl, W. H., and Chilingar, G. V. (1988). Total organic content determined from well logs. SPE Form. Eval. 3, 407–419. doi: 10.2118/15612-pa
Gómez, J. J., Comas-Rengifo, M. J., and Goy, A. (2016). The hydrocarbon source rocks of the Pliensbachian (Early Jurassic) in the Asturian Basin (northern Spain): their relationship with the palaeoclimatic oscillations and gamma-ray response. J. Iber. Geol. 42:259.
Haile, N. S. (1973). Note on Triassic Fossil Pollen from Nam Pha Formation, Chulabhon (Nam Phrom) Dam, Thailand. GST Newslett. 6, 15–16.
Hassan, M., Hossin, A., and Combaz, A. (1976). “Fundamentals of the differential gamma ray log – interpretation technique,” in Paper Presented at the Society of Professional Well Log Analysts 17th Annual Logging Symposium, June 9–12, 1976, Denver, Colorado, 18.
Huang, R., Wang, Y., Cheng, S., Liu, S., and Cheng, L. (2015). Selection of logging-based TOC calculation methods for shale reservoirs: a case study of the Jiaoshiba shale gas field in the Sichuan Basin. Nat. Gas Ind. B 2, 155–161. doi: 10.1016/j.ngib.2015.07.004
Jones, B., and Manning, D. A. C. (1994). Comparison of geochemical indices used for the interpretation of palaeoredox conditions in ancient mudstones. Chem. Geol. 111, 111–129. doi: 10.1016/0009-2541(94)90085-x
Katz, B. J. (2005). “Controlling factors on source rock development–a review of productivity, preservation, and sedimentation rate,” in The Deposition of Organic-Carbon-Rich Sediments: Models, Mechanisms and Consequences, ed. N. B. Harris (Broken Arrow, OK: SEPM Special Publications), 7–16. doi: 10.2110/pec.05.82.0007
Kimura, H., and Watanabe, Y. (2001). Oceanic anoxia at the Precambrian-Cambrian boundary. Geology 29, 995–998. doi: 10.1130/0091-7613(2001)029<0995:oaatpc>2.0.co;2
Kobayashi, T. (1973). Upper Triassic estheriids in Thailand and the conchostracan development in Asia in Mesozoic Era. Geol. Palaeontol. Southeast Asia 16, 57–90.
Konno, E., and Asama, K. (1973). Mesozoic plants from Khorat, Thailand? Geol. Palaeontol. Southeast Asia 12, 149–172.
Lash, G. G., and Blood, D. R. (2014). Organic matter accumulation, redox, and diagenetic history of the Marcellus Formation, southwestern Pennsylvania, Appalachian basin. Mar. Pet. Geol. 57, 244–263. doi: 10.1016/j.marpetgeo.2014.06.001
Law, C. A. (1999). “Evaluating source rocks,” in Treatise of Petroleum Geology/Handbook of Petroleum Geology: Exploring for Oil and Gas Traps, eds E. A. Beaumont and N. H. Foster (Tulsa, OK: AAPG), 6–1.
Løvborg, L., Wollenberg, H., Sørensen, P., and Hansen, J. (1971). Field determination of uranium and thorium by gamma-ray spectrometry, exemplified by measurements in the Ilímaussaq alkaline intrusion, South Greenland. Econ. Geol. 66, 368–384. doi: 10.2113/gsecongeo.66.3.368
Lowe, D. R. (1982). Sediment gravity flows; II, depositional models with special reference to the deposits of high-density turbidity currents. J. Sediment. Res. 52, 279–297.
Lüning, S., and Kolonic, S. (2003). Uranium spectral gamma−ray response as a proxy for organic richness in black shales: applicability and limitations. J. Pet. Geol. 26, 153–174. doi: 10.1111/j.1747-5457.2003.tb00023.x
Lüning, S., Loydell, D. K., Sutcliffe, O., Ait Salem, A., Zanell, E., Craig, J., et al. (2000). Silurian—lower Devonian black shales in Morocco: which are the organically richest horizons? J. Pet. Geol. 23, 293–311. doi: 10.1111/j.1747-5457.2000.tb01021.x
Lüning, S., Wendt, J., Belka, Z., and Kaufmann, B. (2004). Temporal–spatial reconstruction of the early Frasnian (Late Devonian) anoxia in NW Africa: new field data from the Ahnet Basin (Algeria). Sediment. Geol. 163, 237–264. doi: 10.1016/s0037-0738(03)00210-0
Magoon, L. B., and Dow, W. G. (1994). “The petroleum system,” in The Petroleum System—From Source to Trap, Vol. 60, eds L. B. Magoon and W. G. Dow (Tulsa, OK: AAPG), 3–24. doi: 10.1306/m60585c1
Middleton, G. V. (1993). Sediment deposition from turbidity currents. Annu. Rev. Earth Planet. Sci. 21, 89–114. doi: 10.1146/annurev.ea.21.050193.000513
Minezaki, T., Hisada, K. I., Hara, H., and Kamata, Y. (2019). Tectono-stratigraphy of late Carboniferous to Triassic successions of the Khorat Plateau Basin, Indochina block, northeastern Thailand: initiation of the Indosinian Orogeny by collision of the Indochina and South China blocks. J. Asian Earth Sci. 170, 208–224. doi: 10.1016/j.jseaes.2018.10.020
Myers, K. J., and Bristow, C. S. (1989). Detailed sedimentology and gamma-ray log characteristics of a Namurian deltaic succession II: gamma-ray logging. Geol. Soc. London Spec. Publ. 41, 81–88. doi: 10.1144/gsl.sp.1989.041.01.07
Myers, K. J., and Wignall, P. B. (1987). “Understanding Jurassic organic-rich mudrocks—new concepts using gamma-ray spectrometry and paleoecology: examples from the Kimmeridge Clay of Dorset and Jet Rock of Yorkshire,” in Marine Clastic Sedimentology, eds J. K. Leggett and G. G. Zutta (Dordrecht: Springer Netherlands), 172–189. doi: 10.1007/978-94-009-3241-8_9
Nazeer, A., Abbasi, S. A., and Solangi, S. H. (2016). Sedimentary facies interpretation of Gamma Ray (GR) log as basic well logs in Central and Lower Indus Basin of Pakistan. Geod. Geodyn. 7, 432–443. doi: 10.1016/j.geog.2016.06.006
Passey, Q. R., Creaney, S., Kulla, J. B., Moretti, F. J., and Stroud, J. D. (1990). A practical model for organic richness from porosity and resistivity logs. AAPG Bull. 74, 1777–1794.
Peters, K. E., and Cassa, M. R. (1994). “Applied source rock geochemistry,” in The Petroleum System—From Source to Trap, eds L. B. Magoon and W. G. Dow (Tulsa, OK: AAPG), 60.
Prélat, A., Hodgson, D. M., and Flint, S. S. (2009). Evolution, architecture and hierarchy of distributary deep−water deposits: a high−resolution outcrop investigation from the Permian Karoo Basin, South Africa. Sedimentology 56, 2132–2154. doi: 10.1111/j.1365-3091.2009.01073.x
Racey, A. (2011). “Petroleum geology,” in The Geology of Thailand, eds M. F. Ridd, A. J. Barber, and M. J. Crow (London: Geological Society of London), 351–392.
Rider, M. (1996). The Geological Interpretation of Well Logs Petroleum Exploration. Aberdeen: Rider French Consulting Ltd.
Schmoker, J. W. (1981). Organic-Matter Content of Appalachian Devonian Shales Determined by Use of Wire-Line Logs: Summary of Work Done 1976–1980. Reston, VA: Geological Survey, 81–181.
Sêco, S. L., Duarte, L. V., Pereira, A. J., and Silva, R. L. (2018). Field gamma-ray patterns and stratigraphic reinterpretation of offshore well-log data from Lower Jurassic organic-rich units of the Lusitanian Basin (Portugal). Mar. Pet. Geol. 98, 860–872. doi: 10.1016/j.marpetgeo.2018.07.036
Selley, R. C. (1978). Concepts and Methods of Subsurface Facies Analysis. Tulsa, OK: American Association of Petroleum Geologists.
Slatt, R. M., Borer, J. M., Horn, B. W., Al-Sitabi, H. A., and Pietraszek, S. R. (1995). Outcrop gamma-ray logging applied to subsurface petroleum geology. Mt. Geol. 32/4, 81–94.
Slatt, R. M., Jordan, D. W., D’Agostino, A. E., and Gillespie, R. H. (1992). Outcrop gamma-ray logging to improve understanding of subsurface well log correlations. Geol. Soc. London Spec. Publ. 65, 3–19.
Swanson, V. E. (1961). Geology and Geochemistry of Uranium in Marine Black Shales: A Review. Washington, DC: US Government Printing Office, 1–110.
Tissot, B. P., and Welte, D. H. (1984). Petroleum Formation and Occurrence, 2nd Edn. Berlin: Springer-Verlag.
Wang, C., Wang, Q., Chen, G., He, L., Xu, Y., and Chen, L. (2017). Petrographic and geochemical characteristics of the lacustrine black shales from the Upper Triassic Yanchang Formation of the Ordos Basin, China: implications for the organic matter accumulation. Mar. Pet. Geol. 86, 52–65. doi: 10.1016/j.marpetgeo.2017.05.016
Wignall, P. B., and Myers, K. J. (1988). Interpreting benthic oxygen levels in mudrocks: a new approach. Geology 16, 452–455. doi: 10.1130/0091-7613(1988)016<0452:ibolim>2.3.co;2
Keywords: depositional environment, sedimentary facies, outcrop gamma-ray, source rock, Huai Hin Lat Formation
Citation: Phujareanchaiwon C, Chenrai P and Laitrakull K (2021) Interpretation and Reconstruction of Depositional Environment and Petroleum Source Rock Using Outcrop Gamma-ray Log Spectrometry From the Huai Hin Lat Formation, Thailand. Front. Earth Sci. 9:638862. doi: 10.3389/feart.2021.638862
Received: 07 December 2020; Accepted: 09 April 2021;
Published: 30 April 2021.
Edited by:
Basilios Tsikouras, Universiti Brunei Darussalam, BruneiReviewed by:
Mehrdad Sardar Abadi, University of Oklahoma, United StatesMike Rogerson, University of Hull, United Kingdom
Copyright © 2021 Phujareanchaiwon, Chenrai and Laitrakull. This is an open-access article distributed under the terms of the Creative Commons Attribution License (CC BY). The use, distribution or reproduction in other forums is permitted, provided the original author(s) and the copyright owner(s) are credited and that the original publication in this journal is cited, in accordance with accepted academic practice. No use, distribution or reproduction is permitted which does not comply with these terms.
*Correspondence: Piyaphong Chenrai, cGl5YXBob25nLmNAY2h1bGEuYWMudGg=