 Shun-Da Li
 Chuan Chen*
- Xinjiang Key Laboratory for Geodynamic Processes and Metallogenic Prognosis of the Central Asian Orogenic Belt, College of Geology and Mining Engineering, Xinjiang University, Urumqi, China
The Jinba gold deposit is located in the Maerkakuli Shear Zone of the south Altay Orogenic Belt, NW China. Mineralization types are classified as altered rock–and quartz vein–type. Orebodies occur as veins or lenses controlled by NW–trending faults, and are hosted in phyllite (Early–Middle Devonian Ashele Formation) and plagiogranite (Early Devonian Habahe Pluton). Three paragenetic stages were identified: early quartz–pyrite–gold (Stage 1), middle quartz–chalcopyrite (Stage 2), and late calcite–quartz–galena–sphalerite (Stage 3). Fluid inclusions within the deposit are liquid–rich aqueous (LV–type), vapor–rich aqueous (VL–type), carbonic–aqueous (LC–type), and purely carbonic (C–type) FIs. Homogenization temperatures for stages 1–3 FIs were 373–406 °C, 315–345 °C, and 237–265 °C, respectively. Fluid salinities for stages 1–3 were 2.1–13.6 wt%, 3.2–6.1 wt% and 3.9–6.0 wt% NaCl equivalent, respectively. The ore–forming fluids evolved from a CO2–NaCl–H2O ± CH4 to a NaCl–H2O system from stage 1–3. Oxygen, hydrogen, and carbon isotopic data (δ18Ofluid = 1.7‰–8.1‰, δDfluid = –104.1‰ to –91.7‰, δ13Cfluid = –0.4‰–6.3‰) indicate that ore–forming fluids were metamorphic hydrothermal origin with the addition of a late meteoric fluid. Sulfur and lead isotope data for pyrite (δ34Spy = 3.3‰–5.3‰, 206Pb/204Pb = 17.912.3–18.495, 207Pb/204Pb = 15.564–15.590, 208Pb/204Pb = 37.813–38.422) show that the ore–forming materials were mainly derived from diorite and the Ashele Formation. Mineralization, FIs, and isotope studies demonstrate that the Jinba deposit is an orogenic gold deposit.
Introduction
Orogenic gold deposits (OGDs) comprise over 30% of global gold reserves (Frimmel, 2008). These deposits share a number of common features, namely: relative timing in the evolution of orogenic processes, low–medium NaCl–H2O ± CO2 ± CH4 ± N2 ore–forming fluids, structural controls exerted by second–order ductile shear zones, host rocks with greenschist facies metamorphism, and emplacement at convergent plate margins. OGDs are widely distributed throughout the world, with examples such as the Abitibi Greenstone Belt in Canada, the Yilgarn Craton in Australia, and the Chinese Altay Orogenic Belt (CAOB) (Ayer, 2008; Deng and Wang, 2016). The CAOB is part of the Central Asian Orogenic Belt and lies at the junction of the Siberian Plate, the Kazakhstan Plate, and the Junggar Plate (Groves et al., 1998). It is connected to the Kazakhstan Altay metallogenic belt to the west and borders the Mongolian metallogenic belt in the east (Figure 1A). This region has experienced a long geodynamic evolution, including the oceanic plate subduction, continental accretion, and collisional orogenesis (Xiao et al., 2009; Kröner et al., 2013).
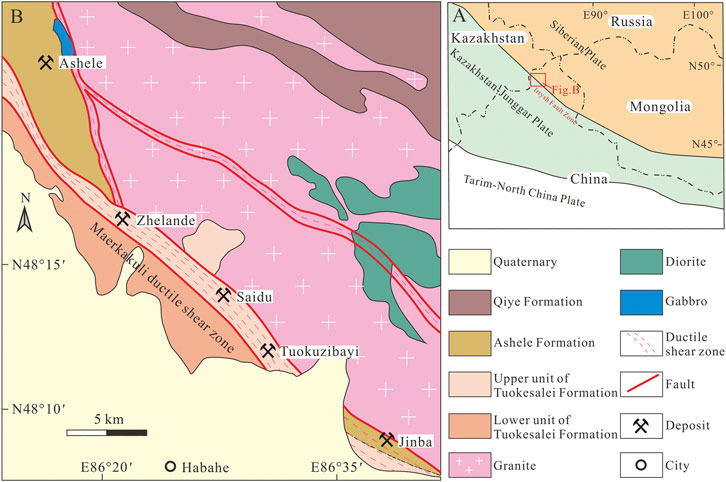
FIGURE 1. (A) Tectonic map of western China. (B) Regional geological map of the southwestern Chinese AOB (modified after Zhou et al., 2012).
The Jinba gold deposit is located in the southwestern CAOB. The deposit was discovered in 1997 by the 11th Geological Party of the Xinjiang Bureau of Geology and Mineral Exploration. Ongoing exploration has provided 15,311 m of drill core from over 50 holes, and has led to the development of 964 m of underground tunnels and 2,581 m3 of trenches. The results of this exploration revealed a 2.3 t gold reserves with a grade of 2.6 g/t Au. Previous studies of this deposit have focused on its geological features, geochemistry, geochronology, and geological exploration. However, most of the literature is in Chinese (Chen et al., 2010; Deng, 2011; Zhou et al., 2012). The nature and sources of ore–forming fluids have not yet been investigated in detail. In addition, the deposit’s genetic classification is controversial. While some scholars suggest that the Jinba deposit is a ductile shear zone–type gold deposit (Chen et al., 2003), others consider it to be a middle–to low–temperature hydrothermal deposit (Wang et al., 2018). In addition, it has also been classified as an altered rock gold deposit (Li and Chen, 2004). However, many features of the Jinba deposit are typical of OGDs.
In the present work, based on fieldwork focused on geology and mineralization styles, we present new fluid inclusion (FI) and isotope (H–O–C–S–Pb) data. The main aims of this study are to: 1) determine the source and evolution of the ore–forming fluids, 2) clarify the origin of ore–forming materials, and 3) propose a genetic model for the deposit.
Regional Geology
The study area is located in the southwestern CAOB (Figure 1A). Terranes in this region are mainly comprised of the Lower–Middle Devonian Tuokesalei Formation, the Lower–Middle Devonian Ashele Formation, the Upper Devonian Qiye Formation, and Quaternary sediments (Figure 1B). The Tuokesalei Formation is a sequence of marine terrigenous clastic, metasedimentary, and carbonate rocks. The lower unit is comprised of metamorphic sandstone and metamorphic siltstone, whereas the upper unit includes sandstone, argillaceous siltstone, and limestone. The Ashele Formation is a sequence of marine volcanic rocks, metasedimentary rocks, sericite phyllite and carbonate rocks. The predominant lithologies in the sequence are tuff, tuffaceous siltstone, and metamorphic sandstone, with limestone lenses. The Qiye Formation is a sequence of intermediate–mafic volcanic rocks, with pyroclastic–sedimentary units. These rocks are composed of andesite, breccia tuff, and tuffaceous sandstone. These Devonian strata were generally folded and metamorphosed to greenschist facies (Laurent et al., 2002; Wei et al., 2007). The Irtysh Fault Zone (Figure 1A)—considered to be a suture zone between the Siberian Plate and the Kazakhstan–Junggar Plate—is the largest structure in the region (Yakubchuk, 2004; Pirajno et al., 2011). The Maerkakuli Shear Zone (Figure 1B)—which controls the distribution of intrusive rocks and deposits in the area—is a second–order fault system of the Irtysh Fault Zone. Most of the ore deposits in this area distributed along this shear zone, such as the Ashele, Zhelande, Saidu, Tuokuzibayi and Jinba deposits.
Geology and Mineralization
The Jinba gold deposit is located 16 km northeast of the city of Habahe, Xinjiang Uygur Autonomous Region (Figure 1B). The strata exposed in the mining area correspond to the Ashele Formation. Outcropping lithologies include metasandstone and sericite phyllite (Figure 2A). Dominant structures include NW–SE trending faults, along with minor NE–SW trending faults. The NW–SE trending faults were formed before or during mineralization, with some orebodies occurring along these faults. The NE–SW trending faults—which crosscut the orebodies—were formed after mineralization. Plagiogranite (Habahe Pluton), yielding zircon U–Pb ages of 406.3 ± 2.1 Ma (Li et al., 2012), is widely exposed in the northern part of the Jinba deposit. Granite and diorite, yielding zircon U–Pb ages of 384.5 ± 1.2 Ma and 393.9 ± 3.5 Ma (Gao, 2020), respectively, occur as dykes or stocks scattered across the deposit.
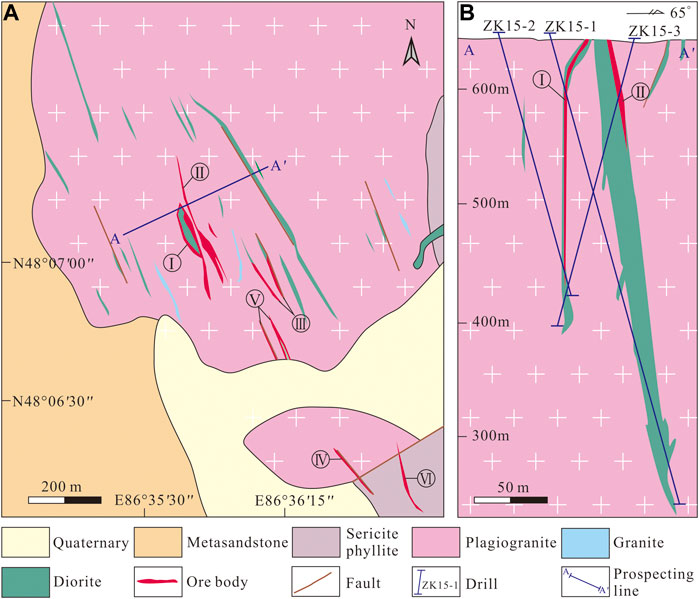
FIGURE 2. (A) Geological map of the Jinba gold deposit (modified after Wang et al., 2018). (B) Geological cross–section of the orebodies (modified after Wang et al., 2018).
Six orebodies have been identified at the Jinba deposit prior to 2018 (Wang et al., 2018). Mineralization types are classified as altered rock–and quartz vein–type. The altered rock–type orebodies are comprised of altered diorite, and occur as veins or lenses, including orebodies I, II, III, and V (Figure 2B). Silicification, chloritization, epidotization and carbonation are common in diorite dykes and adjacent plagiogranite. Pyrite occurs in diorite as fine–grained crystals and disseminated veinlets (Figures 3A,B,G). Orebody I—which is the largest and has an average Au grade of 2.6 g/t—was selected as a representative example to study altered rock–type mineralization. This economically significant orebody is 120 m long with an average thickness of 1.8 m, striking 138–155°, and dipping 68–80° NE (Wang et al., 2018).
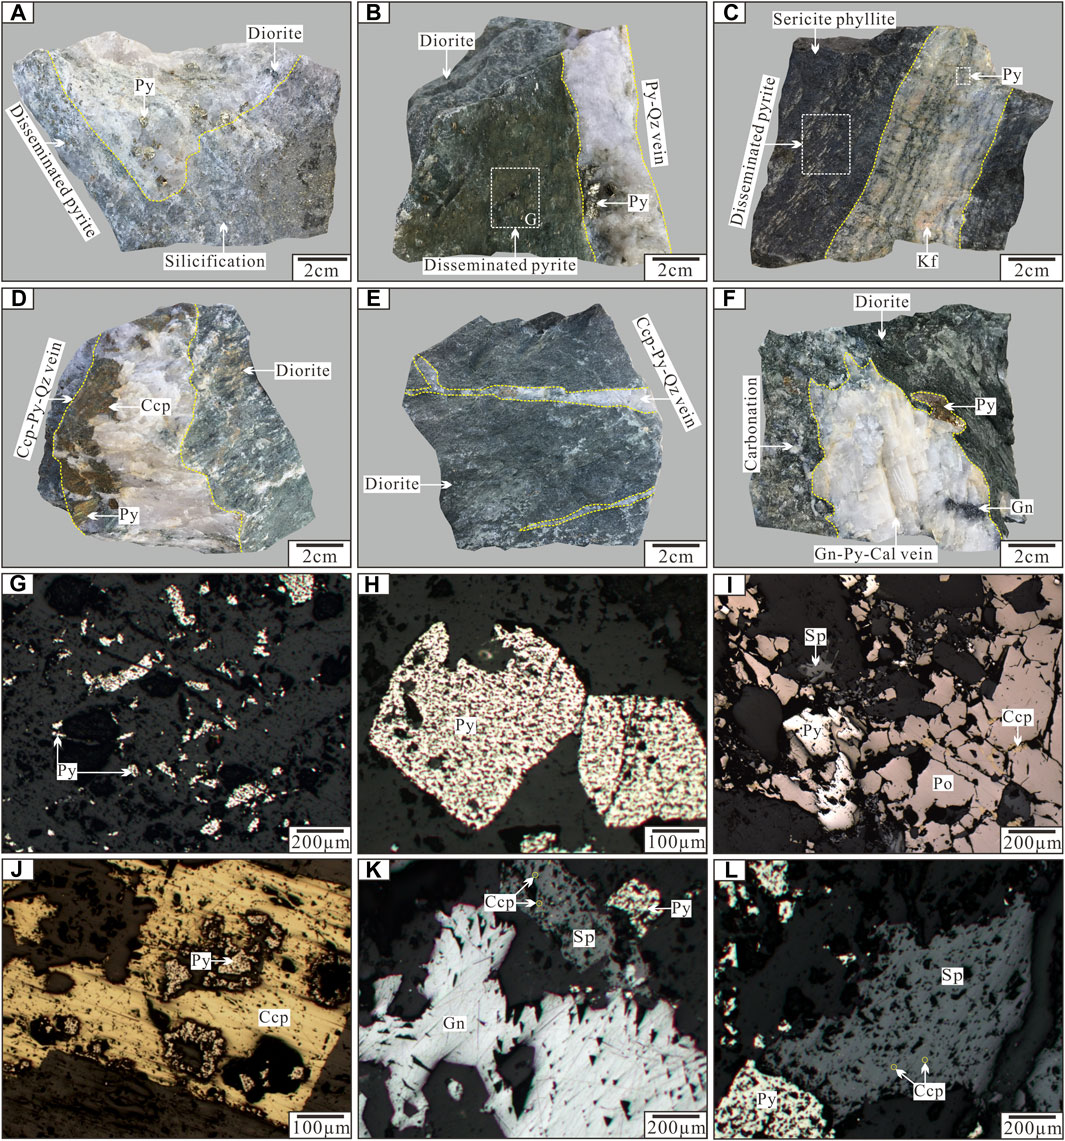
FIGURE 3. Photographs of ore and mineral assemblages from the Jinba gold deposit. (A) Disseminated pyrite occurring in the diorite with silicification; (B) Quartz–pyrite–gold vein in diorite; (C) Quartz vein–type mineralization in sericite phyllite; (D, E) Quartz–chalcopyrite–pyrite vein in diorite; (F) Calcite–galena–pyrite vein in the diorite with carbonation; (G) Disseminated pyrite; (H) Euhedral–subhedral pyrite; (I) Interstitial chalcopyrite in pyrrhotite; (J) Pyrite replaced by chalcopyrite; (K) Galena and sphalerite aggregation; (L) Chalcopyrite emulsion in sphalerite. Abbreviations: Qz (quartz); Py (pyrite); Po (pyrrhotite); Ccp (chalcopyrite); Sp (sphalerite); Gn (Galena).
Quartz vein–type orebodies, controlled by NW–trending faults, occur as veins, and are hosted in plagiogranite and sericite phyllite of the Ashele Formation. These include orebodies IV and VI (Figure 2B). There is a clear boundary between the ore veins and the surrounding rock (Figure 3C). The width of quartz veins varies from a few centimeters to several meters. Mineralization is also occasionally found in strongly fractured wall rocks along the edges of quartz veins. Wall rock alteration is characterized by silicification and potassic alteration. Orebody IV—with an average Au grade of 3.1 g/t—was selected as a representative example to study quartz vein–type orebodies. It is 140 m long with an average thickness of 1.7 m, striking 122–144°, and dipping 62–74° NE (Wang et al., 2018).
Ore mineral assemblages mainly include pyrite, chalcopyrite, sphalerite, galena, and native Au, with minor pyrrhotite and gold telluride (calaverite). Gangue minerals include quartz, calcite, K–feldspar, biotite, sericite, chlorite, and epidote. The major ores of the deposit have a disseminated, vein, veinlet and stockwork structure. Ore microstructure is characterized by euhedral to subhedral grains, anhedral grains, emulsion and replacement textures (Figures 3G–L).
Based on the mineral assemblages, paragenetic sequences, and crosscutting relationships between ore veins, the following three stages of mineralization have been identified. Early–stage mineralization (stage 1), which is comprised of quartz–pyrite–gold veins, is widespread and accounts for most of the deposit’s Au. Characteristic minerals of this stage are milky white quartz and pyrite with minor pyrrhotite (Figures 3A,B,H–I). Euhedral pyrite is the most abundant ore mineral and varies in size from 0.2 mm up to 10 mm. Gold is observed between pyrite and quartz crystals, and is coeval with pyrite based on microstructural relationships. Intermediate–stage mineralization (stage 2) is characterized by quartz–chalcopyrite veins with minor pyrite and gold (Figures 3D,E,J). Ore veins have straight boundaries and vary in size from 0.2 mm up to 5 mm. The content of Cu in the ore has no economic value for it is lower than the minimum industrial grade. Late–stage mineralization (stage 3) produced calcite–quartz–galena–sphalerite veins that contain small amounts of chalcopyrite and pyrite (Figures 3F,K–L). These veins have a limited distribution near the outer edge of the deposit, suggesting later formation within the mineralization sequence.
Samples and Analytical Methods
Fresh ores were sampled from the drill holes (ZK15-1, ZK15-2, and ZK15-3) and surface outcrops in the Jinba deposit. Samples are divided into three groups: 1) Forty–six samples of quartz and calcite from stages 1–3 for FI petrography study. Fifteen representative quartz samples of the above were chosen for FI microthermometry. Ore–stage quartz and calcite occurred in assemblage with metallic minerals, indicating that the gangue and ore minerals were coeval; 2) Twelve quartz samples representative of mineralization stages 1–3 for H–O isotopic analyses; 3) Six pyrite samples from stage 1 for S–Pb isotopic analyses. Sulfides from stage 2 and 3 were not analyzed, since they held limited economic value and the pyrite was not abundant enough to be separated. Detailed sample information is shown in Table 1.
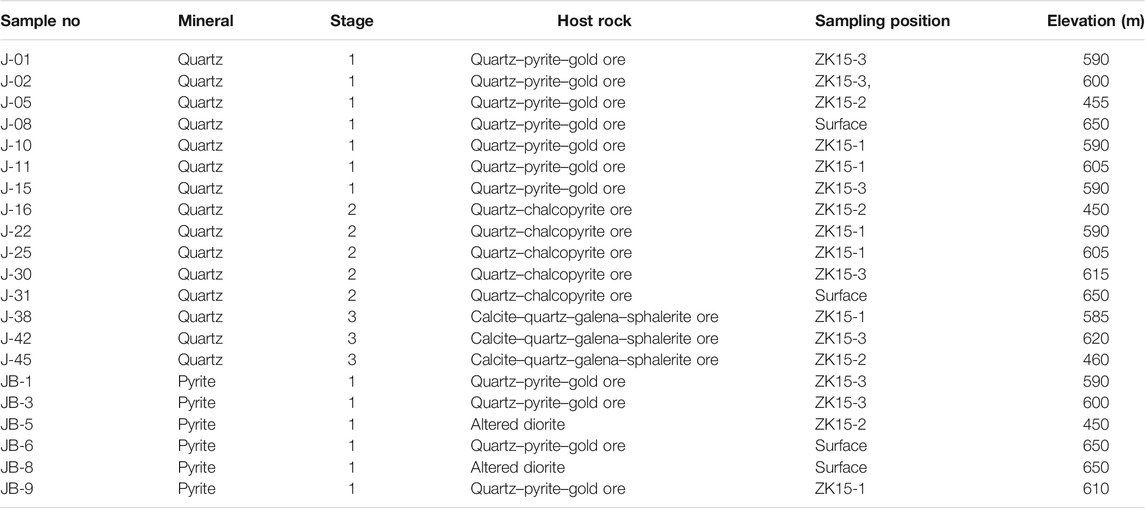
TABLE 1. Sample information of the Jinba gold deposit.
Fluid Inclusions
Forty–six samples of quartz and calcite were doubly polished to a thickness of 0.20–0.25 mm, soaked in acetone for 3–4 h, rinsed with clean water, and dried thoroughly. FI petrography involved careful observation of shapes, spatial distribution, genetic and compositional types, and vapor–liquid ratios. Fifteen samples with abundant and representative FIs were selected for microthermometric measurements.
FI analyses were carried out at the Geological Fluid Laboratory, Xinjiang University, Urumqi, China, using the fluid inclusion assemblage (FIA) methodology of Goldstein and Reynolds (1994). An Olympus BX–50 microscope was used for petrographic analysis. Microthermometry was performed using a Linkam THMS600 heating–freezing stage with a temperature range of −196 to 600 °C. Calibration of the stage was completed using the following standards: pure water inclusions (0 °C), pure CO2 inclusions (–56.6 °C), and potassium bichromate (398 °C). This yielded an accuracy of ±0.2 °C during freezing and ±2 °C for heating at temperatures between 100 and 600 °C. Salinities of NaCl–H2O FIs were calculated using the final melting temperature of ice (Bodnar, 1993). For LC–type FIs, the salinities of the fluids were calculated on the basis of CO2 clathrate melting temperatures in the NaCl–H2O–CO2 system (Roedder, 1984). FI density was calculated using the Flincor software (Brown, 1989). FI volatiles were analyzed using a Renishaw RM1000 Raman microprobe and an Ar ion laser. Operating conditions for the Raman microprobe were the following: surface power of 5 mW and exciting radiation of 514.5 nm; surface area of 20 μm2 for the detector charge–coupled device; scanning range of 1,000–4,000 cm−1 for spectra; and an accumulation time of 30 s per scan.
H–O–C–S–Pb Isotopes
Quartz and pyrite grains of the different ore–forming stages were handpicked from crushed and sieved (40–60 mesh) samples under a binocular microscope (purity >99%). Isotope analyses of 6 pyrite samples and 12 quartz samples were performed on a MAT–253 mass spectrometer at the Analytical Laboratory of the Beijing Research Institute of Uranium Geology, China National Nuclear Corporation, Beijing, China. The analytical uncertainties in this study are <0.2‰.
Oxygen isotope analyses were performed on 10–20 mg quartz samples using the BrF5 method of Clayton and Mayeda (1963), converted to CO2 on a platinum–coated carbon rod. For hydrogen isotope analyses, samples were placed under vacuum and heated at 150 °C for 3 h to degas labile volatiles. Water was released from FIs by heating to ∼500 °C in an induction furnace, and then converted to H2 through interaction with Zn powder at 410 °C (Friedman, 1953). Results of oxygen and hydrogen isotope analyses are reported in relation to Vienna Standard Mean Ocean Water (VSMOW). Prior to carbon isotopic analyses, quartz–hosted FIs (bearing trace amounts of carbon) were treated with H3PO4 at 50 °C for 24 h to generate CO2 (Zhou et al., 2013). Results are reported as δ12C with respect to the Pee Dee Belemnite standard (PDB). Sulfide isotopic analyses were carried out following the procedures of Robinson and Kusakabe (1975). Pyrite samples were reacted with Cu2O to obtain pure SO2. Results are reported as δ34S relative to the Vienna Canyon Diablo Troilite standard (VCDT). Lead isotopic analyses were carried out following the procedures of Zhao et al., 2007. Pyrite samples were dissolved with concentrated HCl + HNO3. A two–column AG 1–X8 anion resin method was then used to separate and purify the Pb. Data obtained were corrected using the ANBS–981 standard for analytical error correction.
Results
Fluid Inclusions
Fluid Inclusion Petrography
FIs in stage 1–3 quartz grains were analyzed by microthermometry. The criteria of Roedder (1984) and Hollister and Burruss (1976) were used to distinguish different generations of FIs in hydrothermal quartz. FIs occurring as isolated inclusions, random distributions, or in clusters are interpreted as primary features (Goldstein and Reynolds, 1994; Goldstein, 2003). Each cluster or group of FIs along growth zones was considered to represent a FIA (Goldstein and Reynolds, 1994). FIs occurring in linear arrays along fractures or grain boundaries were considered to be secondary features. These secondary FIs were not analyzed by microthermometry, given the possibility that they formed later with respect to mineralization. Different types of FIs were recognized from their room–temperature phase relationships and phase transitions during heating and cooling and laser Raman microprobe analyses. Four types of FIs were identified using the classification of Shepherd et al. (1985): liquid–rich aqueous (LV–type), vapor–rich aqueous (VL–type), carbonic–aqueous (LC–type), and purely carbonic (C–type) FIs.
LV–type FIs consist of a water vapor bubble and a liquid water phase at room temperature (Figure 4A). These FIs are typically rectangular or elliptical and 5–15 μm in size. Vapor bubbles account for 10–25% of the total volume. These FIs are present in stages 2–3 and commonly occur as planar arrays restricted to the interior of quartz grains. However, some LV–type FIs fill microfractures in quartz, which indicated a secondary origin (Figure 4L).
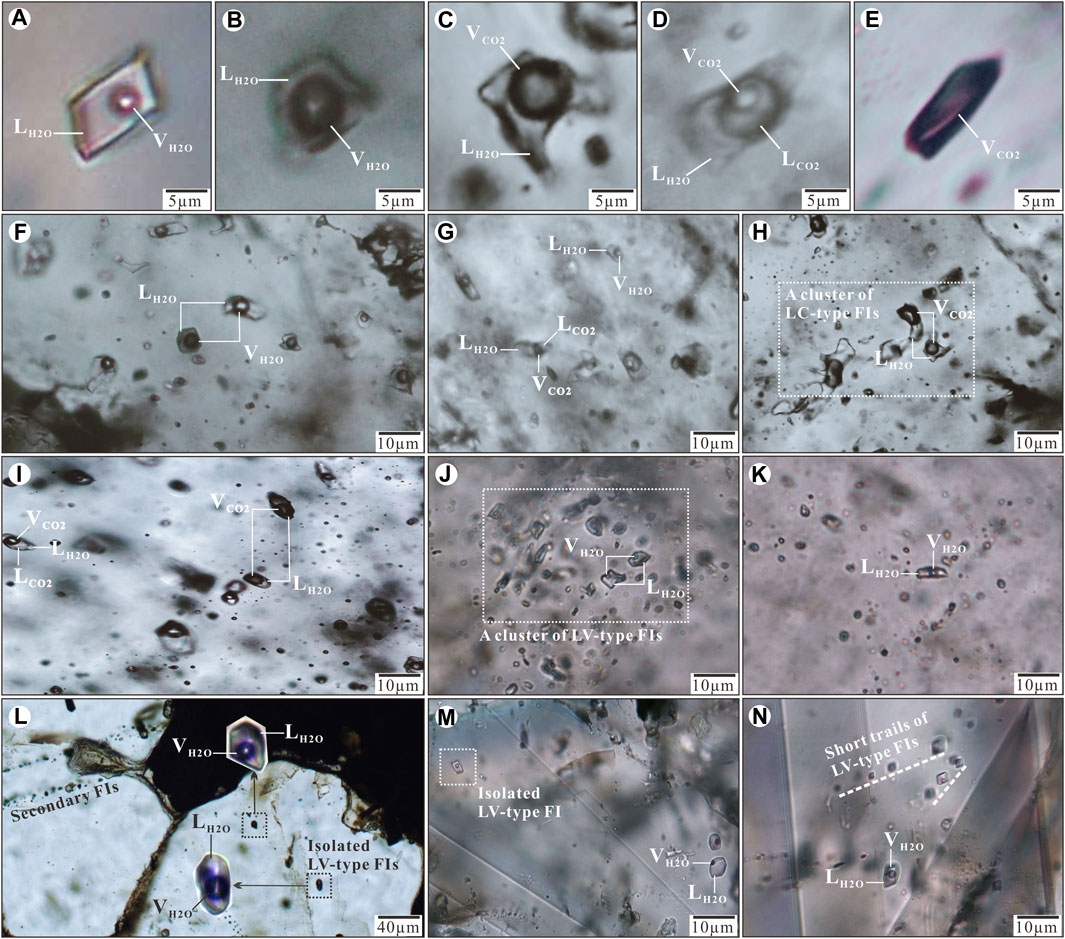
FIGURE 4. Photomicrographs of FIs in quartz and calcite from stages 1–3 of the Jinba gold deposit. (A) LV–type FI; (B) VL–type FI; (C) Two phase LC–type FI; (D) Three phase LC–type FI; (E) monophase C–type FI; (F) VL–and LV–type FIs in stage 1quartz; (G) LV–and LC–type FIs in stage 1quartz; (H) A cluster of two phase LC–type FIs in stage 1quartz; (I) Two phase and three phase LC–type FIs in stage 2 quartz; (J) A cluster of two phase LV–type FIs in stage 2 quartz; (K) LV–type FIs in stage 2 quartz; (L) Primary isolated FI and secondary FIs in stage 3 quartz; (M) Isolated LV–type FI in stage 3 calcite; (N) Short trails of LV–type FIs in stage 3 calcite. Abbreviations: LH2O (liquid H2O), VH2O (vapor H2O), LCO2 (liquid CO2), VCO2 (vapor CO2).
VL–type FIs consist of liquid water with a vapor water bubble that accounts for 50–70% of the volume (Figure 4B). This type of FI is typically elliptical to sub–rounded and 8–12 μm in size. These FIs are only observed in stage 1 quartz grains.
LC–type FIs contain two phases (liquid H2O + vapor CO2) (Figure 4C) or three phases (liquid H2O + liquid CO2 + vapor CO2) (Figure 4D) at room temperature. Two–phase LC–type FIs change into three-phase FIs with the appearance of vapor CO2 when cooling around ∼10 °C. The carbonic phase accounts for 30–70% of the total FI volume. This FI–type is usually circular or elliptical, 8–16 μm in size, and commonly observed in stages 1–2 quartz grains (absent in stage 3 samples).
C–type FIs consist of monophase CO2 (mainly vapor) at room temperature (Figure 4E), which splits into two phases (liquid CO2 + vapor CO2) when cooling to 10 °C. These FIs are elliptical, appear as clusters or scattered, and are mostly less than 12 μm in size. C–type FIs commonly coexist with LC–type FIs in stage 1 quartz grains, which indicates fluid immiscibility (Lu et al., 2004).
Fluid Inclusion Microthermometry
Microthermometry was performed on FIs from 15 quartz samples of stages 1–3. Primary FIs with sizes >5 μm, regular shapes, and without evidence of necking (Roedder, 1984) were chosen for microthermometry (Table 2; Figure 5).
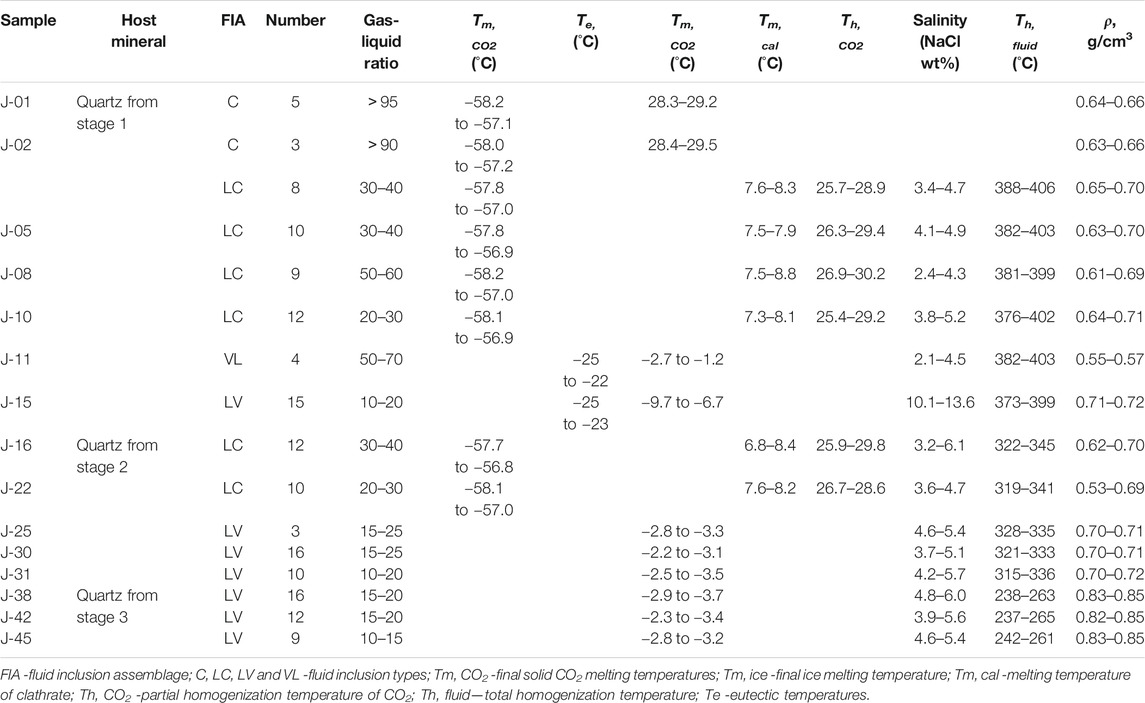
TABLE 2. Microthermometric data from FIs in hydrothermal quartz of the Jinba gold deposit.
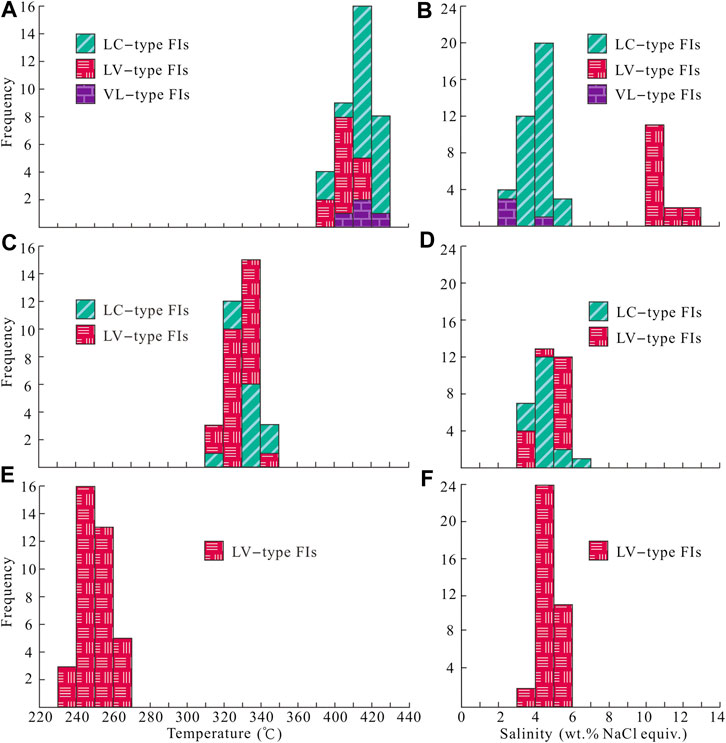
FIGURE 5. Histograms of microthermometric data for FIs in quartz of the Jinba gold deposit. (A) Homogenization temperatures for LC–, VL–and LV–type FIs of stage 1. (B) Salinity for LC–, VL–and LV–type FIs of stage 1. (C) Homogenization temperatures for LC–and LV–type FIs of stage 2. (D) Salinity for LC–and LV–type FIs of stage 2. (E) Homogenization temperatures for LV–type FIs of stage 3. (F) Salinity for LV–type FIs of stage 3.
Stage–1 quartz veins contain LC–, C–, LV–, and VL–type FIs (Figures 4F–H), which account for about 60, 20, 10, and 10% of total primary FIs, respectively. The final melting temperatures of solid CO2 in LC–type FIs range from –58.2 to –56.9 °C, slightly below the triple–phase point for pure CO2 (–56.6 °C), indicating the presence of small amounts of CH4 and/or N2 (Lu et al., 2004). Final melting temperatures of clathrate are in the range of 7.3–8.8 °C, with corresponding salinities of 2.4–5.2 wt% NaCl equivalent, and CO2 partial homogenization temperatures range between 25.4 and 30.2 °C. Most LC–type FIs decrepitated before homogenization during heating. Only part of the FIs with low vapor–liquid ratios achieved total homogenization. Total homogenization temperatures of these FIs to the liquid phase range from 376 to 406 °C. For C–type FIs, the final melting temperatures of solid CO2 range from –58.2 to –57.1 °C. Final ice melting temperatures are in the range of –2.7 to –1.2 °C, corresponding to salinities of 2.1–4.5 wt% NaCl equivalent. FI homogenization to the vapor phase occurred at temperatures of 382–403 °C. Eutectic temperatures of LV–type FIs range from –25 to –22 °C. Final ice melting temperatures of FIs in stage 1 quartz grains range from –9.7 to –6.7 °C, corresponding to salinities of 10.1–13.6 wt% NaCl equivalent. Total homogenization of FIs to the liquid phase occurred at 373–399 °C.
Stage 2 quartz veins contain LC–and LV–type FIs (Figures 4I–K), which account for about 40 and 60% of total primary FIs, respectively. Final melting temperatures of solid CO2 in LC–type FIs range from –58.1 to –56.8 °C. Final melting temperatures of clathrate range from 6.8 to 8.4 °C, with corresponding salinities of 3.2–6.1 wt% NaCl equivalent. CO2 partial homogenization temperatures range from 25.9 to 29.8 °C. FIs were homogenized to the liquid phase at temperatures of 319–345 °C. Eutectic temperatures of LV–type FIs range from –25 to –23 °C. Final ice melting temperatures of these FIs in stage 2 quartz grains are in the range of –3.5 to –2.8 °C, corresponding to salinities of 3.7–5.7 wt% NaCl equivalent. Total homogenization of LV–type FIs to the liquid phase occurred at temperatures of 315–336 °C.
Stage 3 quartz and calcite grains contain only LV–type FIs (Figures 4L–N). Eutectic temperatures of FIs range from –26 to –23 °C. Homogenization to the liquid phase occurred at 237–265 °C, and final ice melting happened at –3.7 to –2.3 °C, corresponding to salinities of 3.9–6.0 wt% NaCl equivalent.
Laser Raman Microprobe Analysis
Typical FIs were selected for laser Raman analysis. Laser Raman spectroscopic detection revealed that the vapor phase in LC–and C–type FIs is dominated by CO2 with minor CH4 (Figures 6A–C). This is in agreement with our microthermometric results, which show that melting temperatures of solid CO2 are slightly lower than 56.6 °C. The vapor phase of LV–type FIs mainly contains H2O (Figure 6D), with minor CO2, which is not consistent with any CO2 phase transition in FIs. The fluid system evolved from a CO2–rich fluid to an aqueous solution end–member.
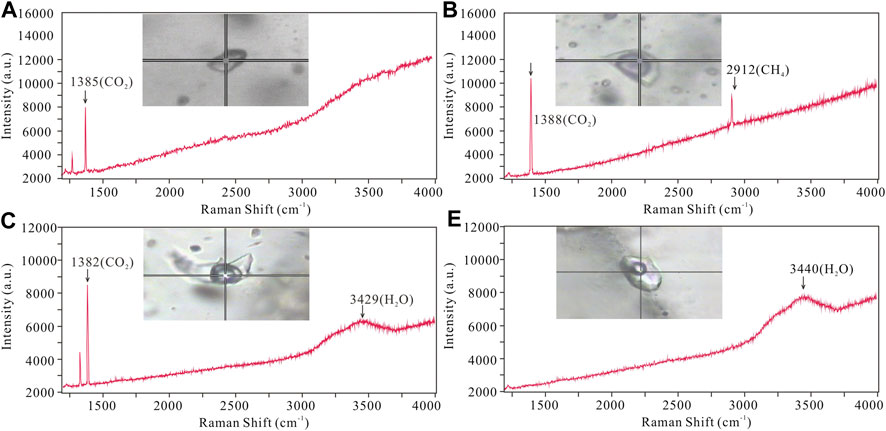
FIGURE 6. Representative Raman spectra of FIs from the Jinba gold deposit. (A) C–type FI showing major CO2 peak; (B) Two phase LC–type FI showing major CO2 with minor CH4 peak; (C) Three LC–type FI showing major CO2 peaks; (D) LV–type FI showing major H2O peak.
Oxygen, Hydrogen, and Carbon Isotopes
Isotopic data for 12 quartz samples representing mineralization stages 1–3 of the Jinba deposit are listed in Table 3.
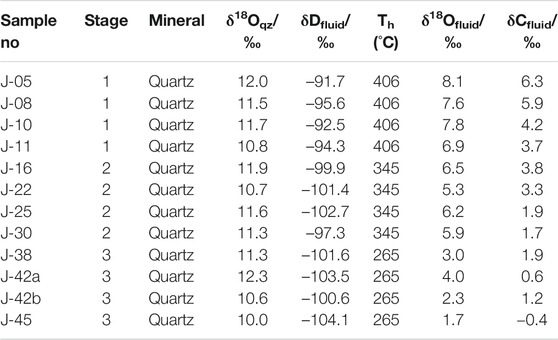
TABLE 3. Oxygen, hydrogen, and carbon isotope data from hydrothermal quartz, stages 1–3 of the Jinba gold deposit.
Data ranges are the following: δ18Oqz = 10.2‰–12.5‰, δDfluid = –104.1‰ ∼ –91.7‰, δ13Cfluid = –0.4‰–6.3‰ (Table 3). Values for δ18Ofluid (1.7‰–8.1‰) were calculated using the following equation: 1000lnαqz–water = 3.38 × 10⁶ T−2–3.4 (Clayton et al., 1972). Since our homogenization temperature data plot within a narrow range and correspond to the minimum trapping temperatures, we selected the highest homogenization temperature value as an estimate of the trapping temperature. The carbon isotope data obtained are unique, being the first C isotopes measured in the vapor phase of FIs from hydrothermal quartz of stages 1–3 of the Jinba deposit.
Sulfur and Lead Isotopes
S and Pb isotope compositions of 6 pyrite samples are listed in Table 4. δ34S values in pyrite range from 3.3 to 5.3‰, with an average value of 4.4‰ (n = 6). Pb isotope compositions in pyrite yielded 206Pb/204Pb ratios of 17.912.3 to 18.495, with an average of 18.194; 207Pb/204Pb ratios of 15.564–15.590, with an average of 15.579; and 208Pb/204Pb ratios of 37.813–38.422, with an average of 38.083.
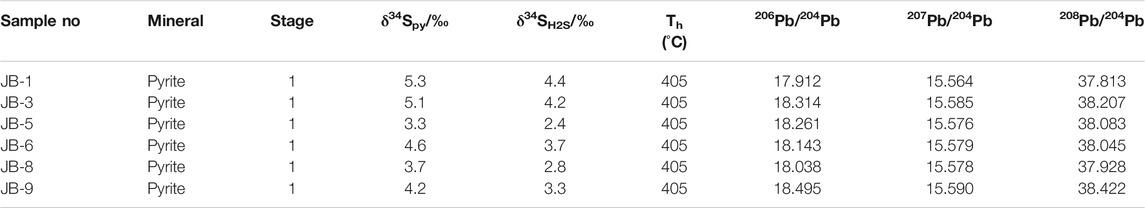
TABLE 4. Sulfur and lead isotope data for pyrite from the Jinba gold deposit.
Discussion
Sources of Ore–forming Materials
δ34S values for 6 pyrite samples from stage 1 mineralization range from 3.9‰ to 5.3‰. The stage 1 quartz–pyrite–gold assemblage shows reduced ƒO2 and consequently low SO42–/H2S ratios (Bastrakov et al., 2007). Pyrite δ34SH2S values are therefore consistent with fluid Σδ34S values. Calculated equilibrium 34SH2S values range from 2.4‰ to 4.4‰ (average = 3.5‰) using the following formula: A×106/T2 = δ34SVCDT—δ34SH2S (Ohmoto and Goldhaber, 1997) (T = mineralization temperature, Apyrite = –0.40). We consider that such a narrow range of δ34S in fluid H2S has a deep origin and is probably derived from mantle or lower crust (Ohmoto and Rye, 1979). The δ34S values of sulfides from gold deposits in the Maerkaluli Shear Zone are generally low positive (Figure 7A). These data are similar to the δ34S values of sulfides from the majority of OGDs (Figure 7B), such as Bendigo gold deposit in Australia (1.4 to 9.3‰, Bierlein et al., 2004), Awanda gold deposit in China (–3.6 to 6.2‰, Ding et al., 2014) and Cononish gold deposit in Scotland (–2.0 to 11.4‰, Spence-Jones et al., 2018). The sources of sulfur for OGDs are commonly considered derived from host wall rocks (Kerrich et al., 2000; Chen et al., 2001). If the sulfur in wall rocks comes from deep source, the sulfur isotopes will not change significantly during the mineralization process. We speculate that sulfur from the deeper source rocks to be subsequently concentrated by metamorphism and hydrothermal processes, forming Jinba gold deposits at higher crustal levels (Large et al., 2011).
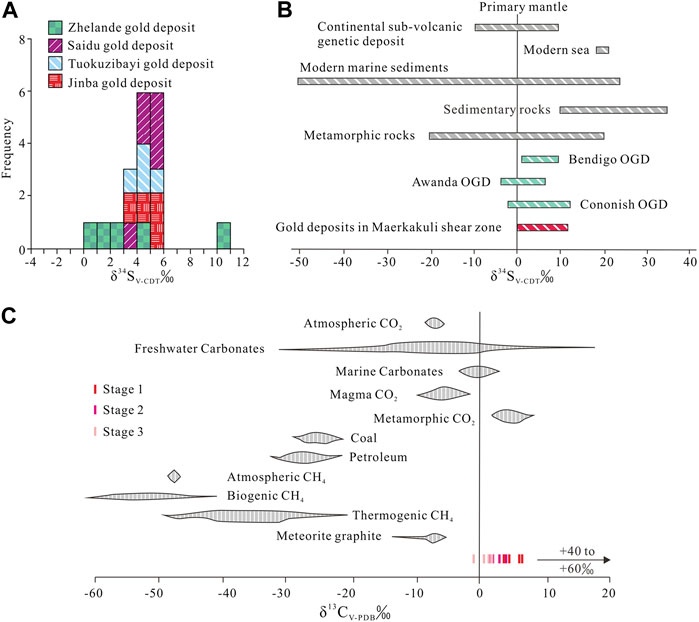
FIGURE 7. (A) Histogram showing δ34S values of pyrites from gold deposits in Maerkakuli Shear Zone (data from Xu et al., 2009; Deng, 2011; Zhan et al., 2016; Gao, 2020). (B) δ34S values from pyrites of gold deposits in Maerkakuli Shear Zone compared to the values in important geological reservoirs (data from Ohmoto and Goldhaber, 1997; Bierlein et al., 2004; Ding et al., 2014; Spence-Jones et al., 2018). (C) δ13C values from quartz of the Jinba gold deposit compared to the values in important geological reservoirs (data from Clark and Fritz, 1997).
Pb isotopic compositions can also constrain ore deposit material sources (Bierlein and McNaughton, 1998). Pb isotopic data for pyrite samples from the Jinba gold deposit show values of 17.912–18.495 for 206Pb/204Pb, 15.564–15.590 for 207Pb/204Pb, and 37.813–38.422 for 208Pb/204Pb (Table 4). These values indicate that the samples are relatively rich in uranogenic Pb, and poor in thorogenic Pb. Pb isotopic data for the samples plot close to the orogenic growth line on both the uranogenic and thorogenic plots, which suggests that the formation of the deposit was closely related to orogenic activity (Stacey and Kramers, 1975; Doe and Zartman, 1979). We interpret these data to reflect a hybrid crustal–mantle lead source. In addition, the Pb isotope data show a linear distribution on the uranogenic and thorogenic plots (Figures 8A,B). This trend suggests a mixture of two end–members components (Ding et al., 2014). One end–member must be highly radiogenic, and the other end–member must be less radiogenic. The highly radiogenic end–member is similar to the plagiogranite (Habahe Plution) reservoir (Figure 8B), and possibly represented by magmatic rocks formed under sulfidic oxidizing condition. The less radigenic end–member might correspond to the Ashele Formation reservoir (Figure 8B), and possibly represented by sedimentary strata with organic matter formed under nonsulfidic anoxic condition. Similar Pb isotope compositions are found in ore and diorite, suggesting the same source of Pb.
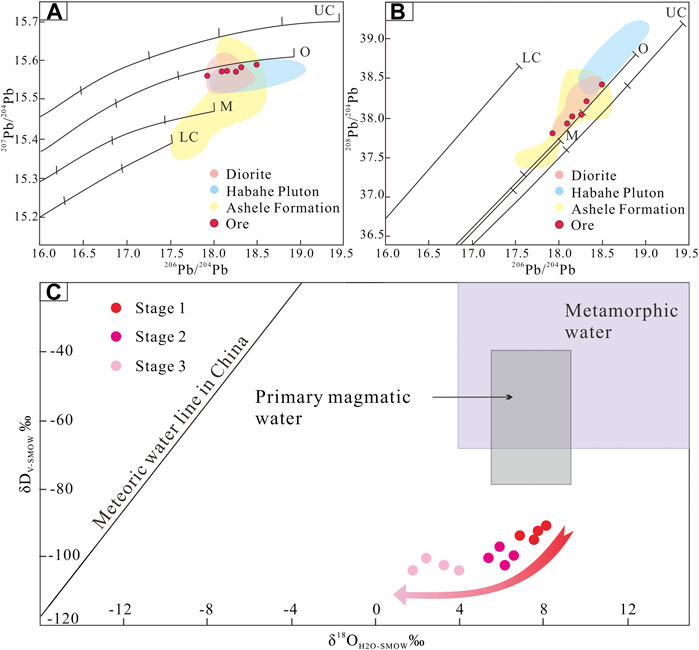
FIGURE 8. (A) 207Pb/204Pb vs. 206Pb/204Pb plot and (B)208Pb/204Pb vs. 206Pb/204Pb plot for sulfides in the Jinba gold deposit and associated host rocks. The average growth curve is from Zartman and Doe (1981). (C) Diagram showing δD vs. δ18O for quartz, representing different stages of mineralization in the Jinba gold deposit.
In terms of ore content, geochemical analyses for regional lithologic units indicate that the Ashele Formation, plagiogranite (Habahe Pluton) and diorite have average Au contents of 6.02, 9.45, and 11.90 ppb, respectively (Xiao et al., 2003). The Au contents of the Ashele Formation, Habahe Pluton, and diorite are much higher than the crustal abundance of Au (1.10 ppb).
Thus, the ore–forming material sources of the Jinba gold deposit were mostly diorite and Ashele Formation rocks, with minor contamination from the Habahe Pluton.
Source and Evolution of Hydrothermal Fluids
The FI microthermometric data obtained–as well as the presence of different types of FIs in gangue minerals from stages 1–3 of the Jinba gold deposit—highlight distinct changes in the hydrothermal system with time. In addition, we have identified the influence of at least two types of source fluids with contrasting composition and temperature. In this section, we analyze the hypothesis involving hydrothermal source fluids with different origins using H, O, and C isotope data.
Stage 1 samples plot below the box representing primary magmatic and metamorphic water on the δD vs δ18O plot (Figure 8C). Eutectic temperatures of LV–type FIs range from –26 to –23 °C, indicating that the fluids were dominated by NaCl solutions with other minor components (such as MgCl2 or KCl). FI microthermometric and laser Raman spectroscopic data suggest that the ore–forming fluids can be estimated as a H2O–CO2–NaCl ± CH4 system; which is different from a fluid exsolved from a magma with high salinity and low CO2 content. These features are typical of metamorphic fluids as reported in many research studies (Phillips and Powell, 2015; Martinek, et al., 2016). In addition, chronological data (Li et al., 2012; Gao, 2020) show that intrusions such as the Habahe Pluton (406.3 ± 2.1 Ma), granite intrusions (393.9 ± 3.5 Ma), and diorite intrusions (384.5 ± 1.2 Ma) exposed in the mining area were all emplaced before gold mineralization (300–270 Ma) in the region (Li et al., 2007; Deng, 2011). These intrusions may provide the ore–forming materials required, however, the source of ore–forming fluids were derived from elsewhere. Carbon isotope data for FIs in quartz veins are also useful to determine the source of ore–forming fluids. The limited variation of δ13Cfluid values (δ13Cfluid = 3.7–6.3‰) for stage 1 indicates a single source of metamorphic CO2 (Figure 7C). CO2 and CH4 may have been produced from carbonaceous sediments during metamorphism through the following reaction: 2C + H2O = CO2+CH4 (Roedder, 1984). In contrast, O–H isotope data for paragenetically younger stage 2 quartz define a trend toward the meteoric water line (Figure 8C). δ13Cfluid values (δ13Cfluid = 1.7–3.8‰) for stage 2 reveal a mixed source of metamorphic CO2 and meteoric CO2 (Figure 7C). Stage 2 samples are characterized by the appearance of vast LV–type FIs and decreased LC–type FIs, as well as absent C–and VL–type FIs. Two sources of fluid have been inferred: 1) inherited CO2–H2O–NaCl fluids, and 2) foreign H2O–NaCl fluids. LC–type FIAs were inherited from the earlier stage, while the occurrence of vast LV–type FIAs provides important evidence of meteoric water mixing. The mixing of metamorphic water with meteoric water caused phase separation of CO2 fluids, resulting in the release of a large amount of CO2 gas phase components. With temperature reduction and pressure release, VL–type inclusions were recondensed into LV–type inclusions (Heinrich et al., 2004). On the other hand, stage–3 samples plot closer to the meteoric water line (Figure 8C) and the meteoric CO2 field (Figure 7C), and only LV–type FIs are present. These characteristics may suggest an increasing meteoric–water influence over time. In summary, based on FI and H–O–C isotope data, the ore–forming fluids that sourced the Jinba gold deposit may have an initial metamorphic origin, followed by the introduction of meteoric water.
δD values for quartz of stages 1–3 are lighter than metamorphic water δD (Ohmoto, 1972), and plot beneath the range of metamorphic water (plotted alongside calculated δ18OH2O values). Low and/or variable δD values of quartz samples may result from magmatic degassing, fluid boiling, fluid mixing, or water–rock interaction. 1) Magmatic degassing can produce wide ranges of δD values through fractionation (Li et al., 2017). However, the ore–forming fluids in the Jinba deposit have an initial metamorphic origin, followed by the introduction of meteoric water. There is no magmatic water involved in the mineralization system, excluding the impact of magmatic degassing. 2) Fluid boiling can influence H isotopic composition, since vapor separation results in a relative depletion of δD in the remaining ore–forming fluid (Koděra et al., 2005). Abundant vapor–rich aqueous (VL–type) FIs and/or high salinity brine FIs are commonly trapped during the process of fluid boiling (Goldstein, 2003). However, in the case of the Jinba deposit, only minor VL–type FIs were trapped and high salinity brine FIs were absented in quartz grains. These characteristics reflect no obvious fluid boiling occurred during mineralization process. 3) Meteoric water has a low δD value (Taylor, 1974), and mixing of metamorphic water and meteoric water could explain the δD depletion observed in the present study. From stage I to III, the δD values define a downward trend (Figure 8C), which may reflect the increasing contribution of meteoric water to the system over time. 4) Water–rock interaction is widespread in Jinba mine confirmed by the occurrence of disseminated pyrite in the wall rocks (Figures 3A–C) and the isotope studies. The ore–forming fluid exchanged 13C, 34S, D, and Pb isotopes, as well as Au and Fe, among other elements, with the wall rocks. During this process, mixture of secondary or primary FIs from devolatilization of organic matter in wall rocks can contribute to apparently lighter bulk δD values of quartz (Taylor, 1974; Sheppard, 1986). Thus, we suggest that fluid mixing and water–rock interaction may be the most likely factors for the δD depletion.
The ore–forming fluids of the Jinba gold deposit belong to the H2O–CO2–NaCl ± CH4 system. Temperatures and pressures can be determined by using the P–T diagram of C–type and coeval LV–type FIs (Roedder and Bodnar, 1980). We obtained temperatures of 373–406 °C and pressures of 1,020–1,320 bars, which correspond to depths of 3.8–4.9 km (lithostatic pressure) (Figure 9).
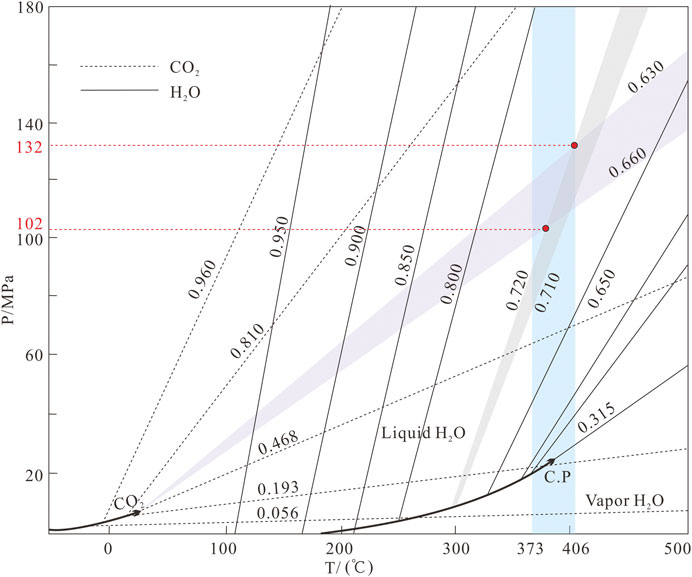
FIGURE 9. Pressure estimates for FIs of the Jinba gold deposit (after Roedder and Bodnar, 1980).
Genesis and Metallogenic Model for the Jinba Deposit
The Jinba gold deposit shares many characteristics of typical OGDs. 1) Firstly, the deposit was formed near the Irtysh Fault Zone in the Altay collisional orogenic belt and is controlled by the second–order Maerkakuli Shear Zone. 2) In addition, orebodies were formed in the greenschist facies, with alteration combinations such as carbonation, sericitization and chloritization. 3) Ore–forming fluids evolved from the CO2–NaCl–H2O ± CH4 system to the NaCl–H2O system. 4) The ore has a low sulfide content. 5) Veins were generally formed at medium to low pressures (1–5 kbar) and at low to medium temperatures (200–600 °C), corresponding to depths of 3–20 km (Groves, 1993).
Maerkakuli Shear Zone is an important gold concentration area in the Altay Orogenic Belt. More than 50 t gold reserves have been proved in the region. Typical gold deposits include Tuokuzibayi (reserves 20.7 t @ 3.81 g/t gold), Saidu (reserves 2.4 t @ 4.61 g/t gold), Zhelande (reserves 3.6 t @ 3.62 g/t gold) and Jinba gold deposit. These deposits are all emplaced in Devonian strata and within the Maerkakuli Shear Zone (Figure 1B), which is controlled by NW–trending faults. They all have similar mineralization types (quartz vein + altered rock types), mineral assemblages, fluid character, and isotope composition (Table 5); suggesting the same geodynamic setting and metallogenic timing. There is no accurate mineralization age data for the Jingba gold deposit to date. However, a lot of chronological data has been reported for other gold deposits in the region. The interpreted age of gold mineralization is based on Rb–Sr, K–Ar, and Ar–Ar ages of alteration minerals and FIs in ore–bearing quartz veins (Li and Chen., 2004; Yan et al., 2004; Li et al., 2007; Deng, 2011; Liu et al., 2018). Mineralization in the region is interpreted to have occurred between ca. 300 and 270 Ma with a peak value of ∼290 Ma, which is consistent with the period of orogenic events in the region during the Late Carboniferous–Early Permian.
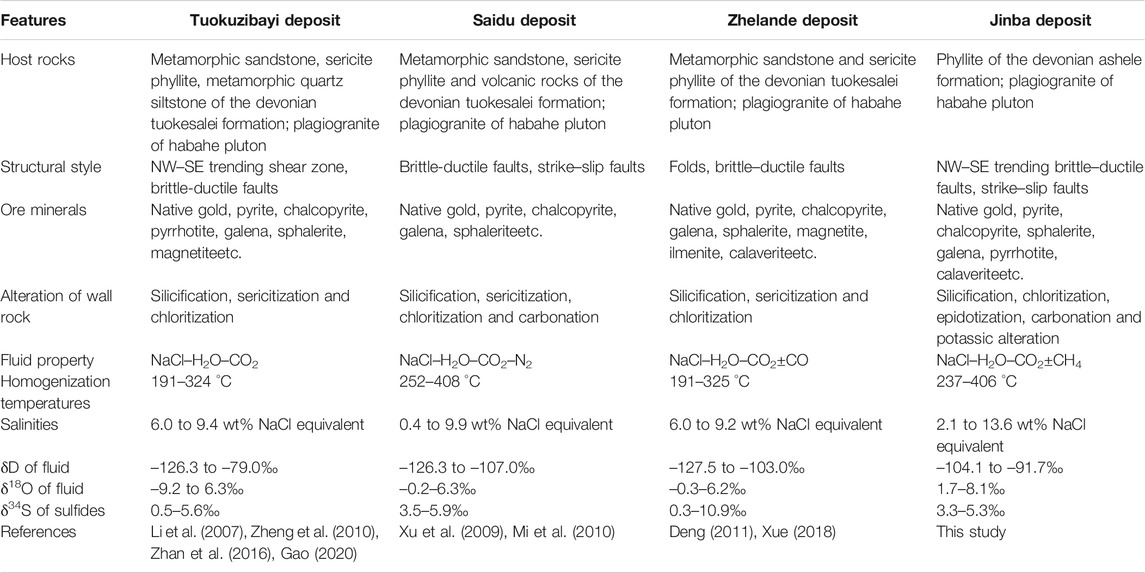
TABLE 5. Comparison of general features of gold deposits in the Maerkaluli Shear Zone.
In the Late Carboniferous–Early Permian, the ancient Asian Ocean closed and the Junggar–Kazakhstan Plate collided with the Siberian Plate (Xiao et al., 2009; Kröner et al., 2013). Sedimentary terranes folded due to orogenic processes and produced a large–scale northwest–trending left–slip ductile shear zone (Xu et al., 2009; Zhan et al., 2016). Dehydration of the surrounding metalliferous and organic–bearing metasedimentary rocks in the deep source could have generated CO2–rich metamorphic fluids (Ding et al., 2014). Gold, sulfur, lead and other ore–forming elements found in the wall rocks was mobilized and migrated by the metamorphic fluid along the Maerkakuli Shear Zone (Figure 10). A large number of ductile and brittle structures formed during the process of regional shear deformation. The shallow brittle structures provided a channel for the upward migration of ore–forming fluids and downward–flowing meteoric water (Sibson et al., 1988). Upon reaching these structures, depressurization and fluid mixing changed the physicochemical conditions and composition of the ore–forming fluids, depositing ore–forming elements rapidly (Houghton et al., 2004), and thus resulting in intensive mineralization in the area of the Jinba mine.
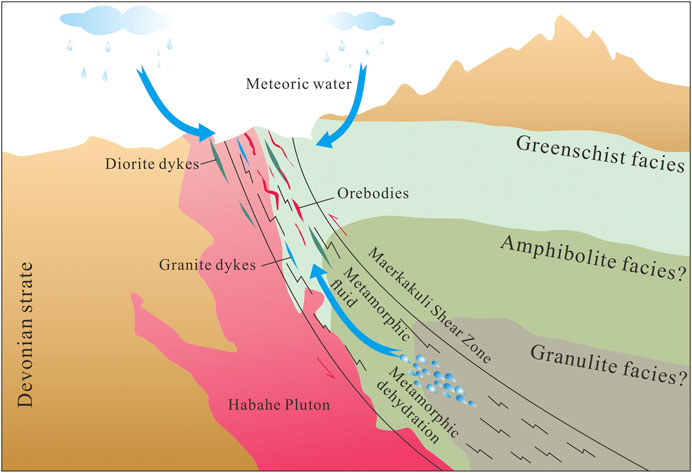
FIGURE 10. Metallogenic model of the Jinba gold deposit.
Conclusion
The ore–forming fluids of the Jinba gold deposit evolved from medium temperature, middle–low salinity, NaCl–H2O–CO2 ± CH4 fluids to low temperature, low salinity, NaCl–H2O fluids. These fluids were initially derived from metamorphic water, followed by the addition of meteoric water.
The ore–forming materials of the Jinba gold deposit were most likely derived from diorite and rocks of the Ashele Formation, with some influence from the Habahe Pluton.
Based on the mineralization characteristics, source, and the evolution of ore–forming fluids and materials, we conclude that Jinba corresponds to an orogenic gold deposit.
Data Availability Statement
The original contributions presented in the study are included in the article/Supplementary Material, further inquiries can be directed to the corresponding author.
Author Contributions
S-DL, CC, and K-YW designed the model and wrote the manuscript. S-DL, FX, L-LG, and X-BZ conducted the experiments. S-DL managed and directed the project. All authors contributed to the article and approved the submitted version.
Funding
This work was supported by the Natural Science Foundation of the Xinjiang Uygur Autonomous Region (Project no. 2020D01C075).
Conflict of Interest
The authors declare that the research was conducted in the absence of any commercial or financial relationships that could be construed as a potential conflict of interest.
Acknowledgments
We are grateful to Liu for his assistance with stable isotope analyses and chromatography analyses at the Analytical Laboratory of the Beijing Research Institute of Uranium Geology. Anonymous reviewers are thanked for their constructive comments and reviews regarding the manuscript, as well as Changzhi Wu for editorial handling.
References
Ayer, J. A., Thurston, P. C., and Lafrance, B. (2008). A special issue devoted to base metal and gold metallogeny at regional, camp, and deposit scales in the Abitibi Greenstone belt: preface. Econ. Geol. 103 (6), 1091–1096. doi:10.2113/gsecongeo.103.6.1091
Bastrakov, E. N., Skirrow, R. G., and Davidson, G. J. (2007). Fluid evolution and origins of iron oxide Cu-Au prospects in the olympic dam district, gawler Craton, south Australia. Econ. Geol. 102, 1415–1440. doi:10.2113/gsecongeo.102.8.1415
Bierlein, F. P., Arne, D. C., and Cartwright, I. (2004). Stable isotope (C, O, S) systematics in alteration haloes associatedwith orogenic gold mineralization in the Victorian gold province,SE Australia. Geochem. Explor. Environ. Anal. 4, 191–211. doi:10.1144/1467-7873/04-201
Bierlein, F. P., and McNaughton, N. J. (1998). Pb isotope fingerprinting of mesothermal gold deposits from central Victoria, Australia: implications for ore genesis. Miner. Deposita 33, 633–638. doi:10.1007/s001260050178
Bodnar, R. J. (1993). Revised equation and table for determining the freezing point depression of H2O-Nacl solutions. Geochem. Cosmochim. Acta 57, 683–684. doi:10.1016/0016-7037(93)90378-a
Brown, P. E. (1989). FLINCOR: a microcomputer program for the reduction and investigation of fluid inclusion data. Am. Mineral. 74, 1390–1393.
Chen, H. Y., Chen, Y. J., and Liu, Y. L. (2001). Metallogenetic process of the Erqis gold ore belt in Xinjiang and relationship with the Central Asian orogeny. Science in China (Series D) 30, 38–44 [In Chinese with English abstract].
Chen, K. Q., Dang, Y. X., Dong, Y. G., and Ding, R. F. (2010). Zircon U–Pb age of the Au–bearing quartz veins in Saidu gold deposit and its geological implications. Miner. Explor. 1 (3), 229–233 [In Chinese with English abstract].
Chen, Y. C., Ye, Q. T., and Wang, J. B. (2003). Geological, metallogenic regularity and technical economic evaluation of the ore deposit in the Altai ore belt, Xinjiang, Beijing, China: Geological Publishing House, 190–216 [In Chinese with English abstract].
Clark, I. D., and Fritz, P. (1997). Environmental isotopes in hydrogeology. New York, NY: Lewis Publishers.
Clayton, R. N., and Mayeda, T. K. (1963). The use of bromine pentafluoride in the extraction of oxygen from oxides and silicates for isotopic analysis. Geochem. Cosmochim. Acta 27, 43–52. doi:10.1016/0016-7037(63)90071-1
Clayton, R. N., O’Neil, J. R., and Mayeda, T. K. (1972). Oxygen isotope exchange between quartz and water. J. Geophys. Res. 77, 3057–3067. doi:10.1029/jb077i017p03057
Deng, J., and Wang, Q. (2016). Gold mineralization in China: metallogenic provinces, deposit types and tectonic framework. Gondwana Res. 36, 219–274. doi:10.1016/j.gr.2015.10.003
Deng, S. L. (2011). Mineralation of ductile shear belt gold deposit of Maerkakuli in Habahe, Xinjiang. Master’s Thesis. Chengdu (China): Chengdu Unieversity of Technology [In Chinese with English abstract].
Ding, Q.-F., Wu, C.-Z., Santosh, M., Fu, Y., Dong, L.-H., Qu, X., et al. (2014). H-O, S and Pb isotope geochemistry of the Awanda gold deposit in southern Tianshan, Central Asian orogenic belt: implications for fluid regime and metallogeny. Ore Geol. Rev. 62 (62), 40–53. doi:10.1016/j.oregeorev.2014.02.017
Doe, B. R., and Zartman, R. E. (1979). “Plumbotectonics, the phanerozoic,” in Geochemistry of hydrothermal ore deposits. Editor H. L. Barenes Second Edn (New York, NY: John Wiley), 509–567.
Friedman, I. (1953). Deuterium content of natural waters and other substances. Geochem. Cosmochim. Acta 4, 89–103. doi:10.1016/0016-7037(53)90066-0
Frimmel, H. E. (2008). Earth’s continental crustal gold endowment. Earth Planet Sci. Lett. 267, 45–55. doi:10.1016/j.epsl.2007.11.022
Gao, L. L. (2020). The Metallogenic regularity and metallogenetic prediction of Au and Cu-Zn polymetallic deposits in the south margin of western Altay Range, Xinjiang. Doctor’s Thesis. Changchun (China): Jilin Unieversity [In Chinese with English abstract].
Goldstein, R. H. (2003). “Petrographic analysis of fluid inclusions,” in Fluid inclusions: analysis and interpretation (Ottawa, ON, Canada: Mineralogical Association of Canada), 32, 9–53.
Goldstein, R. H., and Reynolds, T. J. (1994). Systematics of fluid inclusions in diagenetic minerals. SEPM Short. Course 31, 199. doi:10.2110/scn.94.31
Groves, D. I., Goldfarb, R. J., Gebre-Mariam, M., Hagemann, S. G., and Robert, F. (1998). Orogenic gold deposits: a proposed classification in the context of their crustal distribution and relationship to other gold deposit types, Ore Geol. Rev., 13, 7–27. doi:10.1016/s0169-1368(97)00012-7
Groves, D. I. (1993). The crustal continuum model for late-Archaean lode-gold deposits of the Yilgarn Block, Western Australia. Miner. Deposita 28 (6), 366–374. doi:10.1007/bf02431596
Heinrich, C. A., Driesner, T., Stefánsson, A., and Seward, T. M. (2004). Magmatic vapor contraction and the transport of gold from the porphyry environment to epithermal ore deposits. Geol. 32, 761–764. doi:10.1130/g20629.1
Hollister, L. S., and Burruss, R. C. (1976). Phase equilibria in fluid inclusions from the Khtada Lake metamorphic complex. Geochem. Cosmochim. Acta 40, 163–175. doi:10.1016/0016-7037(76)90174-5
Houghton, J. L., Shanks, W. C., and Seyfried, W. E. (2004). Massive sulfide deposition and trace element remobilization in the Middle Valley sediment-hosted hydrothermal system, northern Juan de Fuca Rdge. Geochem. Cosmochim. Acta 68, 2863–2873. doi:10.1016/j.gca.2003.12.023
Kerrich, R., Goldfarb, R., Groves, D., Garwin, S., and Jia, Y. (2000). The characteristics, origins, and geodynamic settings of supergiant gold metallogenic provinces. Sci. China Earth Sci. 43, 1–68. doi:10.1007/bf02911933
Koděra, P., Lexa, J., Rankin, A. H., and Fallick, A. E. (2005). Epithermal gold veins in a caldera setting: banská Hodruša, Slovakia. Miner. Deposita 39, 921–943. doi:10.1007/s00126-004-0449-5
Kröner, A., Alexeiev, D. V., Rojas-Agramonte, Y., Hegner, E., Wong, J., Xia, X., et al. (2013). Mesoproterozoic (Grenville-age) terranes in the Kyrgyz North Tianshan: zircon ages and Nd-Hf isotopic constraints on the origin and evolution of basement blocks in the southern Central Asian Orogen. Gondwana Res. 23, 272–295. doi:10.1016/j.gr.2012.05.004
Large, R. R., Bull, S. W., and Maslennikov, V. V. (2011). A carbonaceous sedimentary source-rock model for Carlin-type and orogenic gold deposits. Econ. Geol. 106, 331–358. doi:10.2113/econgeo.106.3.331
Laurent, S., Charvet, J., Shu, L. S., Ma, R. S., and Lu, H. F. (2002). Palaeozoic late collisional strike‐slip deformations in Tianshan and Altay, Eastern Xinjiang, NW China. Terra. Nova 14, 249–256. doi:10.1046/j.1365-3121.2002.00417.x
Li, G. M., Shen, Y. C., Liu, T. B., Shen, P., and Zhou, N. W. (2007). Metallogenic evolution of Tuokuzibayi gold deposit in southern Altay, north Xinjiang: evidence from characteristics of quartz vein systems, isotopic geochemistry and Ar–Ar chronology. Miner. Deposits 1, 15–32 [In Chinese with English abstract].
Li, H. Q., and Chen, F. W. (2004). Chronology of regional mineralization in Xinjiang. Beijing, China. Geological Publishing House, 40–45 [In Chinese with English abstract].
Li, S., Wang, K., Wang, Y., Zhang, X., and Quan, H. (2017). Genesis of the bairendaba Ag-Zn-Pb deposit, southern great xing’an range, NE China: a fluid inclusion and stable isotope study. Geofluids 2017, 1–18. doi:10.1155/2017/1206587
Li, Y., Zhou, G., and Chai, F. M. (2012). LA–ICP–MS U–Pb ages and geological implications of the Habahe Pluton at the southern margin of the Altay, Xinjiang. Xinjiang Geol. 30, 146–151 [In Chinese with English abstract].
Liu, G. R., Li, Y., Wang, R., Wang, H. P., Yang, C. D., Chen, Q., et al. (2018). 40Ar/39Ar dating of muscovite from the Zhelande Au deposit, Irtysh Tectonic Zone, Xinjiang and its geological implication. Rock Miner. Anal. 37 (6), 705–712 [In Chinese with English abstract].
Lu, H. Z., Fan, H. R., Ni, P., Ou, X. G., Shen, K., and Zhang, W. H. (2004). Fluid inclusion. Beijing, China: Science Press, 1–487 [In Chinese with English abstract].
Martinek, K. R., Wagner, T., Walle, M., Heinrich, C. A., and Arlt, T. (2016). Chemical evolution of metamorphic fluids in the Central Alps, Switzerland: insight from LA–ICPMS analysis of fluid inclusions. Geofluids 16 (5), 877–908. doi:10.1111/gfl.12194
Mi, D. J., Su, D. Y., Zou, C. H., and Tang, X. D. (2010). Geological characteristics of Saidu gold deposit in Habahe county of Xinjiang automomous region. Contrib. Geol. Miner. Resour. Res. 25 (4), 331–335 [In Chinese with English abstract].
Ohmoto, H., and Goldhaber, M. (1997). “Sulphur and carbon isotopes,” in Geochemistry of hydrothermal ore deposits. Editor H. L. Barnes (New York, NY: Wiley), 517–611.
Ohmoto, H., and Rye, R. O. (1979). Isotopes of sulfur and carbon. New York, NY: John Wiley and Sons.
Ohmoto, H. (1972). Systematics of sulfur and carbon isotopes in hydrothermal ore deposits. Econ. Geol. 67, 551–578. doi:10.2113/gsecongeo.67.5.551
Phillips, G. N., and Powell, R. (2015). Hydrothermal alteration in the Witwatersrand goldfields. Ore Geol. Rev. 65, 245–273. doi:10.1016/j.oregeorev.2014.09.031
Pirajno, F., Seltmann, R., and Yang, Y. (2011). A review of mineral systems and associated tectonic settings of northern Xinjiang,NW China. Geoscience Frontiers 2, 47–75. doi:10.1016/j.gsf.2011.03.006
Robinson, B. W., and Kusakabe, M. (1975). Quantitative preparation of sulfur dioxide, for sulfur-34/sulfur-32 analyses, from sulfides by combustion with cuprous oxide. Anal. Chem. 47, 1179–1181. doi:10.1021/ac60357a026
Roedder, E., and Bodnar, R. J. (1980). Geologic Pressure determinations from fluid inclusion studies. Annu. Rev. Earth Planet Sci. 8, 263–301. doi:10.1146/annurev.ea.08.050180.001403
Taylor, H. P. (1974). The application of oxygen and hydrogen isotope studies to problems of hydrothermal alteration and ore deposition. Econ. Geol. 69, 843–883. doi:10.2113/gsecongeo.69.6.843
Stacey, J. S., and Kramers, J. D. (1975). Approximation of terrestrial lead isotope evolution by a two-stage model. Earth Planet Sci. Lett. 26, 207–221. doi:10.1016/0012-821x(75)90088-6
Shepherd, T. J., Rankin, A. H., and Alderton, D. (1985). A practical guide to fluid inclusion studies. Glasgow, Scotland: Blackie and Son, 239.
Sheppard, S. M. F. (1986). Chapter 6. Characterization and isotopic variations in natural waters. Rev. Mineral. 16, 165–184. doi:10.1515/9781501508936-011
Sibson, R. H., Robert, F., and Poulsen, K. H. (1988). High-angle reverse faults, fluid-pressure cycling, and mesothermal gold-quartz deposits. Geol., 16, 551–555. doi:10.1130/0091-7613(1988)016<0551:harffp>2.3.co;2
Spence-Jones, C. P., Jenkin, G. R. T., Boyce, A. J., Hill, N. J., and Sangster, C. J. S. (2018). Tellurium, magmatic fluids and orogenic gold: an early magmatic fluid pulse at Cononish gold deposit, Scotland. Ore Geol. Rev. 102, 894–905. doi:10.1016/j.oregeorev.2018.05.014
Wang, Y., Xu, J., Wei, X., and Ding, R. (2018). The mineralization of the Jinba gold deposit, Xinjiang, China: evidence from geology and fluid inclusions. J. China Univ. Geosci. 43, 3112–3125 [In Chinese with English abstract].
Wei, C., Clarke, G., Tian, W., and Qiu, L. (2007). Transition of metamorphic series from the Kyanite- to andalusite-types in the Altai orogen, Xinjiang, China: evidence from petrography and calculated KMnFMASH and KFMASH phase relations. Lithos 96, 353–374. doi:10.1016/j.lithos.2006.11.004
Xiao, H. L., Zhou, J. Y., Wang, H. N., Dong, Y. G., Ji, J. F., and Zhao, Y. (2003). Geochemical characteristics and source of ore–forming fluid of Duolanasayi gold deposit, Xinjiang. Chin. J. Geochem. 22, 74–82 [In Chinese with English abstract].
Xiao, W. J., Windley, B. F., Huang, B. C., Han, C. M., Yuan, C., Chen, H. L., et al. (2009). End-Permian to mid-Triassic termination of the accretionary processes of the southern Altaids: implications for the geodynamic evolution, Phanerozoic continental growth, and metallogeny of Central Asia. Int. J. Earth Sci. 98, 1189–1217. doi:10.1007/s00531-008-0407-z
Xu, J. H., Zhang, G. R., Xie, Y. L., Shan, L. H., Zhang, S. J., Wang, P. H., et al. (2009). The evolution of teconic–metallogenic fluids in the Saidu gold deposit, Southern Altay. Acta Petrol. Mineral. 28 (2), 141–151 [In Chinese with English abstract].
Xue, X. L. (2018). Geological characteristics and genises of zanlander gold deposit, Habahe county, Xinjiang. World Nonferrous Metal 4, 150 [In Chinese with English abstract].
Yakubchuk, A. (2004). Architecture and mineral deposit settings of the Altaid orogenic collage: a revised model. J. Asian Earth Sci. 23, 761–779. doi:10.1016/j.jseaes.2004.01.006
Yan, S. H., Chen, W., Wang, Y. T., Zhang, Z. C., and Chen, B. L. (2004). 40Ar/39Ar dating and its significance of the extix gold metallogenic belt in the Altay orogen, Xinjiang. Acta Geol. Sin. 4, 500–506 [In Chinese with English abstract].
Zartman, R. E., and Doe, B. R. (1981). Plumbotectonics-the model. Tectonophysics 75, 135–162. doi:10.1016/0040-1951(81)90213-4
Zhan, S., Tian, Z. F., Song, M. Y., and Qi, Y. (2016). Stable isotope of the typical deposits in Habahe gold ore belt, Xinjiang. Xinjiang Geol. 34 (4), 476–480 [In Chinese with English abstract].
Zhao, K.-D., Jiang, S.-Y., Ni, P., Ling, H.-F., and Jiang, Y.-H. (2007). Sulfur, lead and helium isotopic compositions of sulfide minerals from the Dachang Sn-polymetallic ore district in South China: implication for ore genesis. Mineral. Petrol. 89, 251–273. doi:10.1007/s00710-006-0148-2
Zheng, Y., Lv, X. B., and Cheng, Y. (2010). Geology and genesis of Tuokuzibayi gold deposit, Xinjiang. Geol. Sci. Technol. Inf. (29), 123–129 [In Chinese with English abstract].
Zhou, J., Huang, Z., Zhou, M., Li, X., and Jin, Z. (2013). Constraints of C-O-S-Pb isotope compositions and Rb-Sr isotopic age on the origin of the Tianqiao carbonate-hosted Pb-Zn deposit, SW China. Ore Geol. Rev. 53, 77–92. doi:10.1016/j.oregeorev.2013.01.001
Keywords: fluid inclusion, isotope, orogenic gold deposit, xinjiang, altay orogenic belt
Citation: Li S-D, Chen C, Gao L-L, Xia F, Zhang X-B and Wang K-Y (2021) Fluid Inclusions and H–O–C–S–Pb Isotopic Systematics of the Jinba Gold Deposit, NW China: Implications for Ore Genesis. Front. Earth Sci. 9:638375. doi: 10.3389/feart.2021.638375
Received: 06 December 2020; Accepted: 18 January 2021;
Published: 22 February 2021.
Edited by:
Chang-Zhi Wu, Chang’an University, ChinaCopyright © 2021 Li, Chen, Gao, Xia, Zhang and Wang. This is an open-access article distributed under the terms of the Creative Commons Attribution License (CC BY). The use, distribution or reproduction in other forums is permitted, provided the original author(s) and the copyright owner(s) are credited and that the original publication in this journal is cited, in accordance with accepted academic practice. No use, distribution or reproduction is permitted which does not comply with these terms.
*Correspondence: Chuan Chen, eGp6eWNjMjAxN0AxNjMuY29t