 Francis Ö. Dudás
 Hua Zhang
 Shu-Zhong Shen
 Samuel A. Bowring1†
- 1Department of Earth, Atmospheric, and Planetary Sciences, Massachusetts Institute of Technology, Cambridge, MA, United States
- 2State Key Laboratory of Palaeobiology and Stratigraphy, Nanjing Institute of Geology and Palaeontology and Center for Excellence in Life and Paleoenvironment, Chinese Academy of Sciences, Nanjing, China
- 3State Key Laboratory for Mineral Deposits Research, School of Earth Sciences and Engineering and Frontiers Science Center for Critical Earth Material Cycling, Nanjing University, Nanjing, China
We report extensive major and trace element data for the Permian-Triassic boundary (PTB) at Meishan, China. Analyses of 64 samples from a 2.5 m section span the last 75 kyr of the Permian and the first 335 kyr of the Triassic, from beds 24 to 34. We also report data for 20 acetic acid extracts that characterize the carbonate fraction. Whole rock major element data reflect the change of lithology from carbonate in the Permian to mudstone and marl in the Triassic, indicate an increase of siliciclastic input and MgO in and above the extinction interval (beds 24f–28), and silica diagenesis in carbonates below the extinction horizon. Above bed 27, enrichment factors calculated with respect to Al and Post-Archean Australian Shale (PAAS) are ∼1 for most trace elements, confirming that siliciclastic input dominates trace element distributions in the Triassic. Within the extinction interval, beds 24f and 26 show increases in As, Mo, U and some transition metals. V, Cr, Co, Ni, Cu, Zn, Pb, and Ba are variably enriched, particularly in bed 26. Below the extinction interval, the top of bed 24d shows enrichment of V, Cr, Co, Ni, Cu, Zn, Pb, and Ba in a zone of diagenetic silicification. Trace elements thus reflect siliciclastic input, diagenetic redistribution, and responses to redox conditions. Trace element patterns suggest either a change in provenance of the detrital component, or a change in the proportion of mechanical to chemical weathering that is coincident with the beginning of the extinction in bed 24f. Ba, Zr, and Zn behave anomalously. Ba shows little variation, despite changes in biological activity and redox conditions. The enrichment factor for Zr is variable in the carbonates below bed 24f, suggesting diagenetic Zr mobility. Zn shows a sharp drop in the extinction horizon, suggesting that its distribution was related to phytoplankton productivity. Rare earth element content is controlled by the siliciclastic fraction, and carbonate extracts show middle rare earth enrichment due to diagenesis. Ce and Eu anomalies are not reliable indicators of the redox environment at Meishan.
Introduction
Virtually every aspect of the geology of the Global Stratotype Section and Point (GSSP) of the Permian-Triassic boundary (PTB) at Meishan, China (Yin et al., 2001), has been studied in detail. This intensive scrutiny reflects both the need for detailed documentation of the global reference section, and the expectation that such data can shed light on the mechanism(s) and rates of the earth’s most severe extinction. One aspect of the geochemistry of the Meishan section that has received relatively less attention is the extent of diagenetic modification in this dominantly carbonate sedimentary sequence. Interpretation of trace element distributions and isotopic compositions depends at least in part on an understanding of the extent of diagenetic overprinting.
Presently, there is a consensus that the eruption of the Siberian Large Igneous Province, because of its contemporaneity with the extinction, its sheer magnitude and its projected effects on the global atmosphere-ocean system, is the likeliest ultimate cause of the extinction. The Siberian eruptions are closely linked with the extinction in time (Renne et al., 1995; Kamo et al., 2003; Burgess et al., 2014; Burgess and Bowring, 2015; Burgess et al., 2017). Input of erosols, CO2, CH4, and possibly SO2 to the atmosphere from the Siberian eruptions (Ganino and Arndt, 2009; Saunders and Reichow, 2009; Svensen et al., 2009; Brand et al., 2012; Payne and Clapham, 2012) is proposed to have initiated a “volcanic winter” (Rampino et al., 1988; Saunders and Reichow, 2009) that manifested itself in a range of subsidiary mechanisms. Volcanic aerosol input to the atmosphere may be linked with lethally hot atmospheric temperatures (Sun et al., 2012), with increasing seawater temperature (Joachimski et al., 2012; Chen Z. Q. et al., 2015), with marine anoxia (Wignall and Twitchett, 1996; Meyer and Kump, 2008; Jenkyns, 2010), and with acidification of seawater (Hinojosa et al., 2012; Clarkson et al., 2015), all of which could contribute to extinction in the oceans. The timing of anoxia, acidification, and oceanic warming, with respect to the extinction, remains a matter of debate (Chen Z. Q. et al., 2015; Wang et al., 2019; Joachimski et al., 2020). Recent work suggests that different species retain different records, record diagenetic overprinting in addition to primordial seawater signals, and that global warming and sea surface temperature changes could post-date the extinction event by tens of thousands of years (Chen et al., 2016; Shen S. Z. et al., 2019; Joachimski et al., 2020). Acid rain (Black et al., 2014) and elevated atmospheric temperatures probably caused extinction on land (Fielding et al., 2019; Feng et al., 2020), and increased weathering and erosion (Algeo and Twitchett, 2010), because they represent increased nutrient input, likely contributed to a positive feedback on anoxia in at least the surface ocean (Wei et al., 2015; Zhang et al., 2018; Zhang et al., 2020). In Australia, the extinction or massive reorganization of ecosystems on land predates the extinction in the oceans (Fielding et al., 2019), but is coincident with inception of volcanism in Siberia. Increased weathering and erosion also impact the 87Sr/86Sr composition of the oceans, so that correlated isotopic and other chemical patterns constrain the timing and mechanisms of extinction.
The most direct evidence that has implicated the Siberian eruptions is the presence of elevated Ni and Hg in both terrigenous (Fielding et al., 2019; Shen J. et al., 2019) and marine sedimentary rocks (Rothman et al., 2014; Xiang et al., 2016; Grasby et al., 2017). Aerosolization of Ni and Hg during the eruptions would have allowed global transport of these tracers (Grasby et al., 2017; Rampino et al., 2020). Elevated Ni is also linked with marine anoxia (Rothman et al., 2014), and it is possible that Hg levels in the ocean may have reached lethal concentrations (Sanei et al., 2015). There are few data to evaluate whether other trace elements—Co, Cr, Cu, and V, for example, might correlate with Ni and Hg, and might also reflect global volcanogenic input.
In PTB sections in south China, multiple volcanic ash beds show that there was direct volcanic input from local sources. These claystones are not basaltic ashes (Shen et al., 2012; Gao et al., 2013; He et al., 2014), and are not derived from the Siberian magmatic event. Calc-alkaline, arc-related volcanism, centered apparently to the west and south of most Chinese PTB sections (Gao et al., 2013; He et al., 2014), was contemporaneous with the extinction event. This more local volcanism may have had greater impact on the PTB record in the eastern Paleotethys than the Siberian eruptions. Algeo et al. (2012) note that the collapse of organic carbon accumulation rates and primary oceanic productivity at the extinction horizon are unique to the South China sections, for which a local cause should be sought.
In the course of a detailed study of 87Sr/86Sr at the GSSP of the PTB at Meishan, China (Dudás et al., 2017), we also collected major and trace element data. These data provide a high-resolution geochemical record for a range of elements, help in assessing the extent and patterns of diagenesis, and in evaluating the relative contributions of local and Siberian volcanism to the trace element complement of the Meishan section.
Geological and Geochemical Background
The GSSP of the PTB is in Meishan section D (Yin et al., 2001). The PTB is defined to be at the base of bed 27c (Yin et al., 2001), at the first appearance datum of the conodont Hindeodus parvus (Figure 1). Our sampling is from sections B and C (Supplementary Figures 1, 2), and includes parts of the Changhsing Formation of Lopingian (Changhsingian) age and the Yinkeng Formation of Early Triassic (Induan) age. The oldest samples for 87Sr/86Sr analyses, from bed 22 within the conodont Clarkina yini Zone (Yuan et al., 2014), are about 205 kyr older than the PTB based on the chronology of Burgess et al. (2014), whereas the youngest postdate the PTB by about 350 kyr (Supplementary Text, Supplementary Table 1; Dudás et al., 2017). This ∼500 kyr interval includes the earliest indications of stress on the late Permian biological system (the initial decrease of δ13C in bed 23-5; Cao et al., 2009), the extinction that began about 39 kyr before the PTB and is marked by bed 24f in our sampling, and extends above the extinction interval into bed 34. Our geochemical samples focus on carbonate strata and include only beds 24 and above, to the bottom of bed 34, a time range of 75 kyr prior to the PTB to 335 kyr after the PTB.
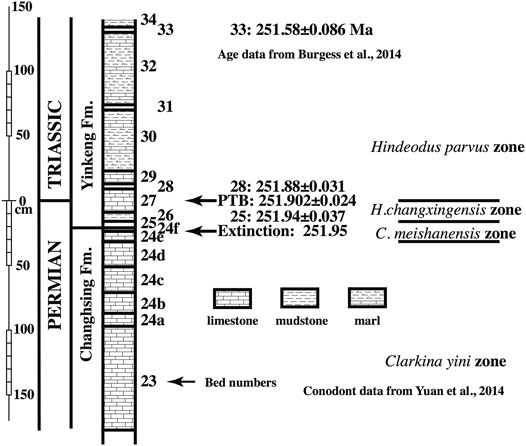
FIGURE 1. Meishan stratigraphic section, with the measurement datum set at the PTB at the top of bed 27b. U/Pb zircon dates are from Burgess et al. (2014). Conodont zones are from Yuan et al. (2014). Sampling for this study extends from bed 24a to bed 34, from -95 to 140 cm, with 63 of 64 samples being between −95 and 60 cm.
Beds 22, 23 and 24 are dominantly bioclastic packstones and wackestones (Cao and Zheng, 2009; Zheng et al., 2013), with minor admixture of siliciclastics, most of which are concentrated in thin cleats along bedding planes. The carbonates also contain silica-rich horizons that are interpreted to be spiculites (Zheng et al., 2013). Li G. et al. (2016) argue that the limestone beds below the extinction horizon represent two facies: finely laminated, micritic limestones that reflect primary depositional conditions, and turbidite beds that are allochthonous, and do not represent environmental conditions at the site where they are found. These facies persist up to the top of bed 24d. The uppermost bed of the Changhsing Formation, 24e, is a bioclastic wackestone that contains numerous fossils (Wang et al., 2019), and is topped by a ∼3 cm pyrite-rich horizon that is coincident with the onset of the major extinction at Meishan (Yin et al., 2001; Shen S. Z. et al., 2011). This sulfidic horizon is sometimes identified as bed 24e8 (Yuan et al., 2014), or as bed 25-1 (Chen Z. Q. et al., 2015); herein we call this bed 24f (Supplementary Figure 3).
There is a major change in lithology above bed 24, coincident with the boundary between the Changhsing and Yinkeng formations (Yin et al., 2001; Zheng et al., 2013). Below bed 24f, the dominant lithology is limestone, whereas the beds above 24f are dominantly mudstones and marls, with carbonate interbeds in beds 27, 29, 32 and 34. This change is coincident with a change in apparent depositional rate (Burgess et al., 2014; Supplementary Text).
The mineralogy of the sedimentary rocks of the Meishan section changes significantly upsection (Liang, 2002; French et al., 2012; Chen Z. Q. et al., 2015; Li and Jones, 2017). Below the extinction horizon, the carbonate fraction is dominated by calcite, and the siliciclastic fraction is characterized by quartz with a minor clay component. Above the extinction horizon, the carbonate fraction contains a large proportion of Fe- and Mg-bearing carbonates, and the siliciclastic fraction is more prominent and includes chlorite, mixed-layer illite-smectite, and smectite. In beds 24f, 25 and 26, gypsum constitutes up to 30% of the rock (Li and Jones, 2017). The abundance of pyrite, both as large grains and as framboidal aggregates, also varies with stratigraphy (Jiang et al., 2006; Shen et al., 2007; Chen Z. Q. et al., 2015; Li G. et al., 2016; Wei et al., 2020), and is a potential proxy for interpreting redox conditions.
In addition to a depositional hiatus at the top of bed 24d, there are at least two non-deposition surfaces in bed 27 that are not coincident with subdivisions of bed 27. Cao and Zheng (2009) and Li and Jones (2017) describe these hiatal surfaces. Thus, the Meishan section records shoaling, and not all of the section reflects deposition in a slope environment. These non-deposition surfaces are within the carbonate parts of the section, so that near-surface diagenetic modification of the carbonates in these intervals is likely. The U/Pb zircon data for ash beds 25 and 28 at Meishan bracket the extinction interval (Burgess et al., 2014), and show that the hiatus associated with non-deposition surfaces in bed 27 cannot exceed tens of kyr. Because beds 25 and 28 are predominantly volcanic ash beds, they are not included in our geochemical study. We rely on the data of Gao et al. (2013) and He et al. (2014) in evaluating the contribution of local volcanism to the overall geochemistry of the section.
Shen S. Z. et al. (2011) and Shen S. Z. et al. (2019) have argued that the end-Permian extinction, at Meishan, is a protracted event. Dating of the Meishan section (U/Pb on zircon from tuff horizons in beds 22, 25, 28, 31 and 34; Burgess et al., 2014; Shen S. Z. et al., 2011) suggests that the extinction interval was 61 ± 48 kyr, extending from the top of bed 24e to bed 28, although new data from Penglaitan (Guangxi province, South China) indicate a shorter extinction interval of <31 ± 31 kyr (Shen S. Z. et al., 2019). In this contribution, we consider the extinction interval to begin at the top of bed 24e. Other studies advocate a two-step extinction (Xie et al., 2007; Yin et al., 2012; Song et al., 2013; Chen Z. Q. et al., 2015), rather than a protracted single event. Astronomical tuning of the Meishan section (Wu et al., 2013; Li M. et al., 2016) suggests that the extinction interval may be up to 40% shorter than that indicated by the data of Burgess et al. (2014), a suggestion that is consistent with the data from Penglaitan.
The studies that explicitly address the nature and extent of diagenesis in the Meishan section are those of French et al. (2012), Li and Jones (2017), and Wang et al. (2019). French et al. focus on diagenesis as it affects the organic geochemistry of the Meishan section, and on links between clay mineralogy and diagenesis, but do not address diagenesis of major elements. Li and Jones discuss the impact of diagenesis on δ13Ccarb, and conclude that diagenesis by meteoric waters has enhanced the negative excursions of δ13Ccarb in the Meishan section. They present data on mineralogy, on bulk rock Mg, Ca, Fe, Mn and Sr, analyses of REE and Y, and detailed examinations of diagenetic features by cathodoluminescence and scanning electron microscope imaging. Wang et al. conclude, based on Ca, Mg, Sr, and Mn data, that the Meishan section shows both early diagenesis under fluid-buffered conditions, and late-stage diagenesis such that primary seawater signals in δ44/40Ca, δ88/86Sr, and 87Sr/86Sr, at least, are difficult to identify. Zhang et al. (2020), in a review of U-isotopes as a redox proxy in carbonates, discuss the effects of carbonate diagenesis in some detail, but this discussion is not specific to the Meishan section.
A general review of diagenesis and its impact on trace elements in carbonates (Smrzka et al., 2019) is fairly comprehensive, but excludes major and common elements (Ba, Ca, Fe, Mg, Mn, Sr). The discussion of As and Sb is helpful, as are observations on Cd, Re, and Se, which are not included in our dataset.
Rare earth element (REE) data potentially contribute to our understanding of geochemical systematics in four ways. Because marine carbonates have low overall REE content (Alibo and Nozaki, 1999; Nothdurft et al., 2004), REE data are sensitive to even small amounts of detrital input, and thus provide a constraint on the extent of mixing between carbonate and siliciclastic materials. REE in marine carbonates are subject to diagenetic modification (Li and Jones, 2014), and offer a way of assessing diagenetic effects. REE patterns can potentially distinguish between different volcanic sources; typically flat tholeiitic REE patterns contrast with light REE (LREE) enriched patterns of typical calc-alkaline volcanics. Finally, anomalies in Ce and Eu, which are redox-sensitive, have been proposed as redox proxies in marine carbonate rocks (Bolhar et al., 2004; Nothdurft et al., 2004; Bolhar and Van Kranendonk, 2007), though redox conditions in the water column can differ from those in sediment pore waters (Shields and Stille, 2001; Chen J. et al., 2015).
Other than isotopic data (δ7Li: Sun et al., 2018; δ13C: Cao et al., 2009, and many others; δ18O: Chen et al., 2016; clumped isotopes of O and C: Joachimski et al., 2012; δ34S: Kaiho et al., 2001; Jiang et al., 2006; Kaiho et al., 2006a; Kaiho et al., 2006b; Riccardi et al., 2006; Shen Y. et al., 2011; δ44/40Ca: Hinojosa et al., 2012; Wang et al., 2019; δ66Zn: Liu et al., 2107; 87Sr/86Sr: Cao et al., 2009; Song et al., 2015; Dudás et al., 2017; Wang et al., 2019; δ88/86Sr: Wang et al., 2019; δ202Hg and Δ199Hg: Grasby et al., 2017; Wang et al., 2018; Shen J. et al., 2019; Sial et al., 2020), there is a paucity of published geochemical data on the Meishan section. Most studies are narrowly focused, addressing organic geochemistry (Cao et al., 2009; French et al., 2012), platinoid-group elements (Xu et al., 2007; Xu and Lin, 2014) and specific redox markers (Song et al., 2012; Rothman et al., 2014; Xiang et al., 2020). Only Zhou and Kyte (1988), Kaiho et al. (2001), Xu et al. (2007), and Li and Jones (2017) present bulk rock trace element data. Wang et al. (2019) provide data for Ca, Mg, Mn and Sr, whereas Xiang et al. (2020) report data for Al, Fe, Mo, U, and V, in addition to Fe speciation measurements.
Samples and Methods
The Supplementary Text describes sample locations and analytical methods. The samples for this study are from Meishan sections C and B (Supplementary Figure 2).
Results
Whole-Rock Data: Major Element Stratigraphy
Table 1 and Figure 2 summarize the whole-rock major element data; the data are shown in Supplementary Table 2. Independently of the stratigraphic subdivisions of the Meishan section, the data justify division of the section into beds lying above 24e, those lying below 24e, and 24e separately (Figure 2). Overall, SiO2 content ranges up to 57 wt%, and is highly variable, especially in beds below 24e. Bed 24d has increased SiO2 compared with most of the stratigraphy below 24e. CaO ranges up to 55 wt%, and decreases upsection as SiO2 increases. Above bed 24e, Al2O3 ranges up to 20 wt%, while remaining below 9 and 0.8 wt% in beds below 24e and bed 24e, respectively. Except for anomalous concentrations of Fe2O3T in bed 24f (up to 30 wt%), Fe2O3T above Bed 24e is below 8 wt%, and below 2 wt% in all other samples. The section below bed 26 contains less than 2 wt% MgO; MgO increases upsection. Above bed 24e, K2O content ranges up to 5.1 wt%, but is below 0.2 and 2.5 wt% in bed 24e and beds below 24e, respectively.
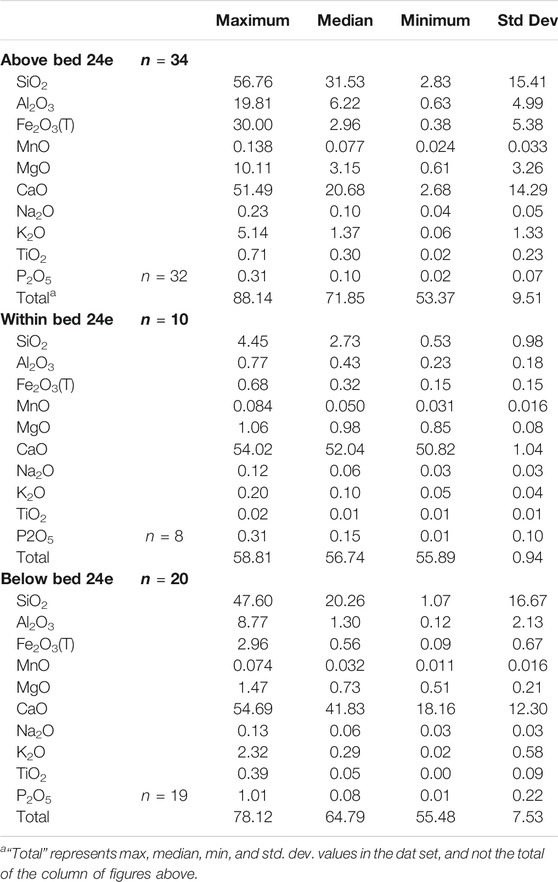
TABLE 1. Summary of whole rock major element data.
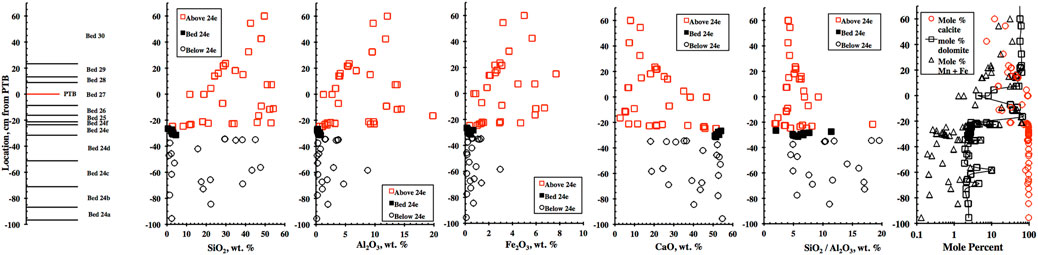
FIGURE 2. Major element whole rock data, plotted stratigraphically. Two values of Fe2O3 in bed 24f (−21 cm) are off scale. Calculated proportions of calcite, dolomite, and rhodochrosite are plotted on a log scale. See text for limitations on the estimates of these mineralogical abundances.
Whole-Rock Data: Major Element Correlations
The major element data show correlations (Table 2; Supplementary Figure 5; Supplementary Table 4) that are consistent with dominantly carbonate and siliciclastic lithologies. We consider statistically significant correlations to have r2 > 0.5. In beds above 24e, where the section is dominated by mudstones and marls, SiO2 is correlated with Al, Na, K, and Ti; SiO2 is negatively correlated with Mn and Ca. Neither Fe nor Mg is correlated with other major elements. In bed 24e, SiO2 is correlated with Al, Na, K, Ti, and P, and is negatively correlated with Mg and Ca. Fe shows no correlation with other major elements, but Mg is strongly correlated with Ca, and negatively correlated with K and Ti. Below bed 24e, SiO2 is correlated with Al, Fe, Na, K, and Ti, and negatively correlated with Ca. Mg is correlated with K and Ti, whereas Ca is negatively correlated with Na, K, and Ti. The geochemical data thus reflect mixing between limestone and siliciclastic components. The absence of statistically significant major element correlations with Fe2O3T in bed 24e and those above 24e is unexpected, and suggests that Fe2O3T content is controlled by something other than detrital, siliciclastic input.
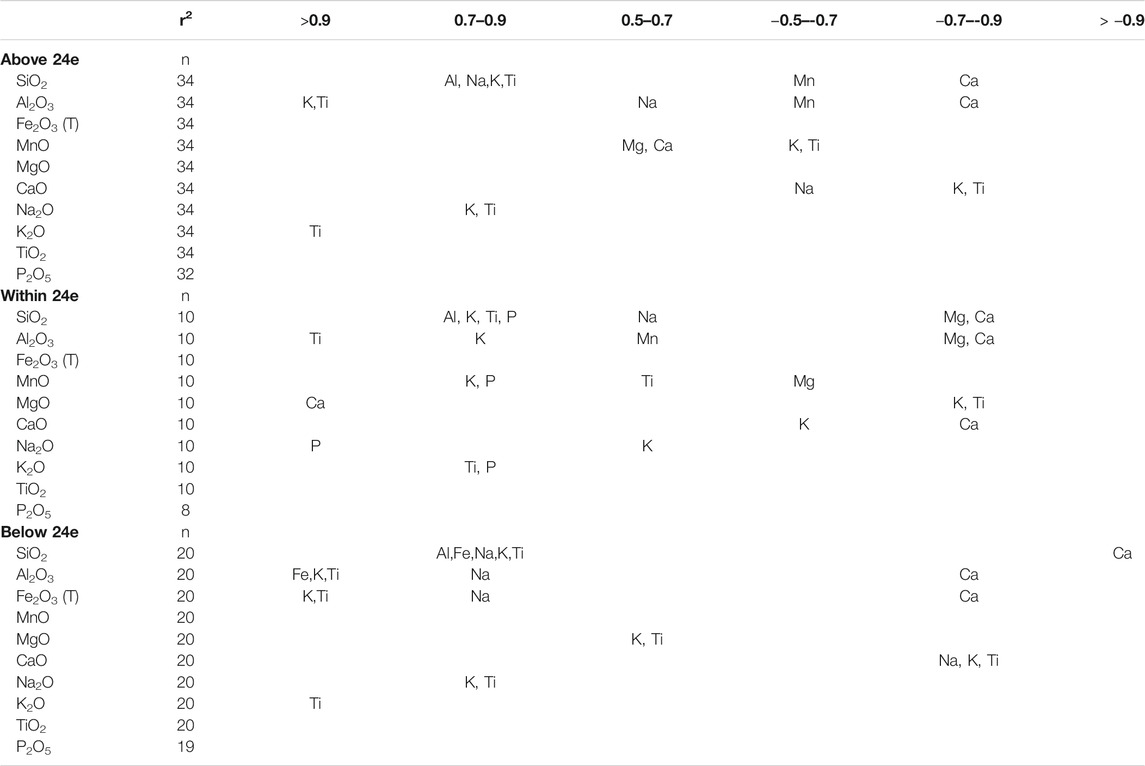
TABLE 2. Summary of major element correlations.
Whole-Rock Data: Trace Element Stratigraphy
Table 3 and Figures 3 ,4 summarize the whole-rock trace element data; the complete data set is Supplementary Table 3. Elements analyzed but not reported in Table 3 are excluded because there are numerous missing values, or because other elements are adequate proxies (REE). Figure 3 shows the trace element data as a function of stratigraphy, whereas Figure 4 shows trace element data against Al2O3 content, the best indicator of siliciclastic input.
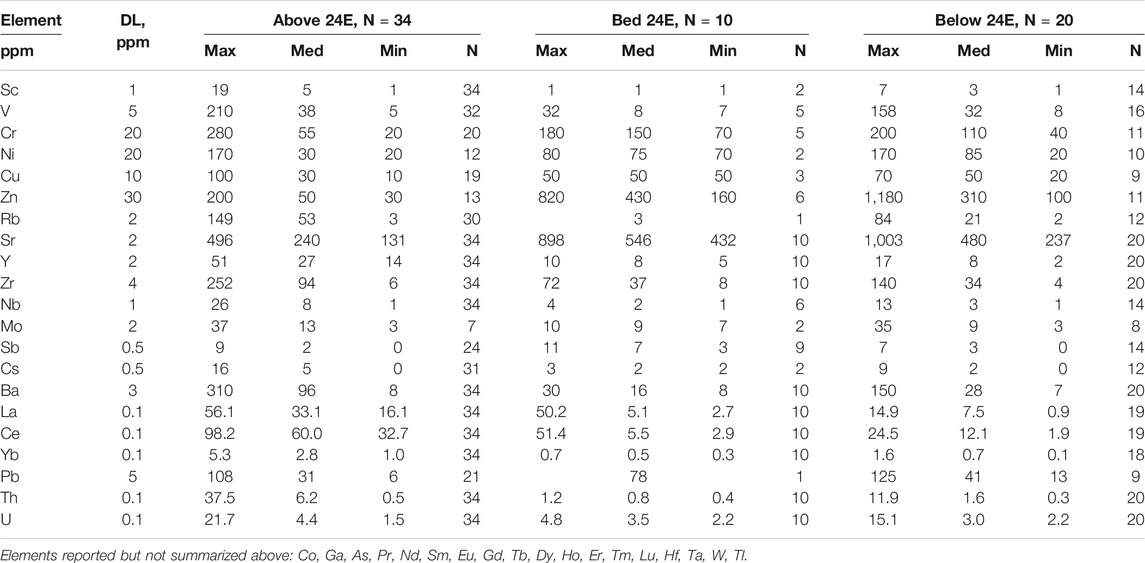
TABLE 3. Summary of whole rock trace element data.
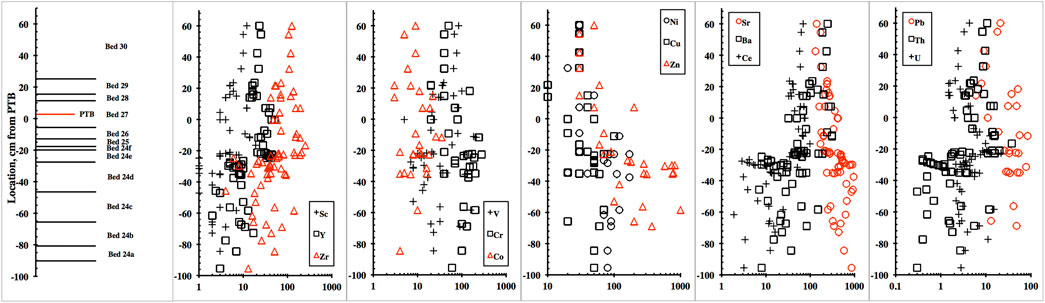
FIGURE 3. Selected trace element data, plotted stratigraphically. All concentration data are on a log scale.
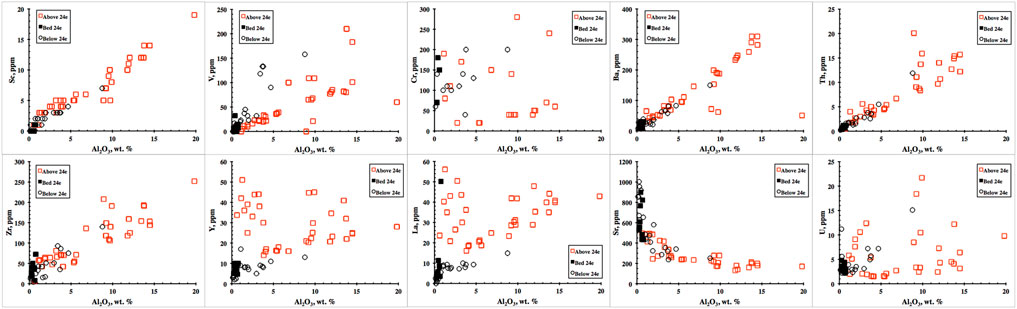
FIGURE 4. Bivariate plots of selected trace element data. Data are plotted against Al2O3 as an index of detrital input.
Trace element concentrations vary on the scale of individual sediment laminae. The data indicate that the units we sampled are best treated as groups: beds below 24d can be grouped, beds 24d, 24e, 24f, and 26, in some cases, need to be treated separately, and beds above 26 can be grouped. Most notably, bed 24f, the beginning of the extinction horizon, shows enrichments, compared with the other parts of the stratigraphy, in As, Cr, Mo, Pb, Sb, Th, Tl, U and W. The overlying black mudstone, bed 26, shows enrichments in As, Ba, Co, Ga, Mo, Pb, Rb, Sb, Th, Tl, and V. In contrast with bed 24f, bed 26 does not show enrichment in Cr, U or W. In both beds, there are individual samples with Ni up to 170 ppm, but there is no overall pattern of Ni enrichment. Two samples in bed 24f have V content of 109 ppm, but the other seven samples of 24f have V below 25 ppm. The majority of the trace elements that are enriched in beds 24f and 26 are redox sensitive, or have important metabolic pathways.
Al2O3, Sc, Th, and Zr best characterize the detrital component (Figure 4). In bed 24e and below, Zr content is variable, but always below 100 ppm. In beds 24f and 26, Zr is between 100 and 300 ppm, whereas the section above bed 26 contains between 100 and 200 ppm Zr. Similarly to Zr, Y shows an increase from bed 24e (always <20 ppm) to 20–60 ppm in beds 24f, 26, and 27, with a “baseline” of 10–30 ppm above bed 27. The distribution of Sc parallels that of Y. Ce (and other REE) content also follows a pattern similar to Zr, in that it is below 25 ppm and variable in beds below 24e; in beds 24f and 26, Ce is enriched (34–98 ppm), whereas in beds above 26, it has a range of 30–80 ppm.
Below bed 24e, V content is variable between 8 and 160 ppm, with four samples being below the limit of detection (BLOD) of 5 ppm. In bed 24e, V is below 32 ppm, with 5 of 10 samples being BLOD. Above 24e, two samples are BLOD, whereas the others range up to 210 ppm, with a median value of 65. For Cr, many samples are BLOD (detection limit, DL, is 20 ppm). The highest value, 280 ppm, is in bed 24f, and the “baseline” above bed 27 is around 50 ppm. For Co, also, there are numerous missing values with a DL of 1 ppm. Notably, all of bed 24e is BLOD, whereas bed 24d shows up to 16 ppm. Beds 24f and 26 range up to 35 ppm Co, whereas beds 27 and above mostly contain <10 ppm Co. The high DL of Ni, 20 ppm, limits our data. Below bed 24 d and in 24e, Ni is BLOD for most samples, whereas in bed 24d, Ni spikes to 170 ppm. There is a similar spike to 170 ppm in beds 24f and 26. Fewer than half of samples above bed 26 have detectable Ni. The highest Cu content, 100 ppm, is in bed 26. Most samples below 24f are BLOD, and the scattered data for beds above bed 26 suggest a “baseline” of about 30 ppm.
The distribution of Zn contrasts with that of the other transition metals. In beds above 24e, Zn content is below 200 ppm, and averages about 60 ppm, with 21 of 34 samples being BLOD (DL is 30 ppm). By comparison, 6 of 10 samples in bed 24e returned values with a median of 430 ppm. There is a distinct enrichment of Zn in bed 24d; 6 of 9 samples have reportable values with a median near 300 ppm and a high value of 1,180 ppm. In the beds below 24d, 6 of 11 samples are BLOD, but there is a single high value of 1,000 ppm. The pattern for Pb is similar to Zn: bed 24d is enriched (median value of ∼30 ppm), with spikes to 125 ppm in some beds below 24d. Pb is BLOD in most of bed 24e, but shows enrichment in beds 24f and 26. Above bed 26, Pb is mostly below 20 ppm, with a few values reaching 50 ppm. Th and U are above the DL in all samples. Below bed 24d, Th values are erratic, varying from 0.3 to 12 ppm; bed 24d is not distinct from the units below it. In bed 24e, Th is low (0.4–1.2 ppm). In bed 24f, Th is slightly higher, from 0.4 to 20 ppm, whereas in bed 26 it ranges from 15 to 38 ppm. Above bed 26, Th values are between 3 and 15 ppm. Beds below 24e are not distinct in their U contents, varying from 2.2 to 15 ppm. Bed 24e is also in this same range, with U between 2.1 and 4.8 ppm. There is a distinct spike in U content in bed 24f, with U ranging from 4.4 to 22 ppm. Bed 26 is also somewhat elevated, with U between 6 and 12 ppm. Above bed 26, U content is generally low, between 1.5 and 4.5 ppm, with the exception of two samples in bed 27, with 5.4 and 7.3 ppm.
In beds above 24e, REE patterns are almost flat when normalized to PAAS (Post-Archean Australian Shale; Taylor and McLennan, 1985), with some samples showing negative Ce anomalies and a slight enrichment in the MREE (Figure 5). Overall REE abundances vary by more than a factor of 10. In Bed 24e, the REE patterns show depletion of LREE, and generally low REE abundances. Beds below 24e show variable REE abundances, and all samples have patterns that are depleted in LREE. In the limestones of bed 24e and below, there is no distinct negative Ce anomaly. Several samples throughout the section show positive Y anomalies.
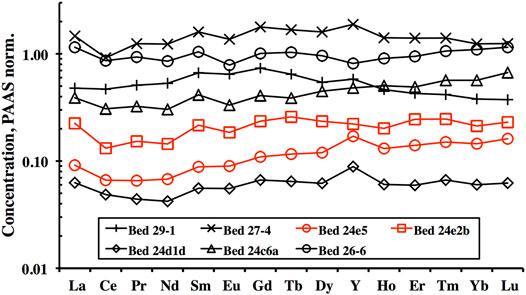
FIGURE 5. Selected whole rock rare earth element data, normalized to PAAS (Taylor and McLennan, 1985).
Whole-Rock Data: Trace Element Correlations
Because there are numerous missing values in the trace element matrix, the statistical significance of the correlation coefficient for trace elements varies more than it does for major elements. As a rough guide, we have chosen r2 > 0.5 to indicate correlation; the correlation data are shown in Supplementary Table 4. In beds below 24e, an expected suite of lithophile trace elements (Sc, Ga, Rb, Nb, Cs, Ba, Zr, Hf, Pb, Th) is strongly and positively correlated with Al2O3 (Figure 4), Fe2O3T, K2O, and TiO2, but is only moderately correlated with SiO2. This correlation is less pronounced in bed 24e and the beds above 24e. A second suite of elements, including V, Co, Mo, the REE, Ta, and 87Sr/86Sr, is less strongly correlated with the same suite of major elements, whereas a third suite of trace elements, including Cr, Cu, Tl, and U, has weak correlations with Al2O3, Fe2O3T, K2O, and TiO2. Sr is strongly to moderately anti-correlated with SiO2, Al2O3, Fe2O3T, K2O, and TiO2. CaO is moderately to strongly correlated with Sr, but is anti-correlated with the lithophile trace elements listed above, as well as with 87Sr/86Sr. There is a weak anti-correlation between CaO and Cr, Mo, Ta, and Tl. The same patterns generally hold in bed 24e, except that there is a weak to moderate anti-correlation between MgO and CaO and Cr, Zn, Sb, Th, Tl, MREE, and HREE. Above bed 24e, MnO, MgO, and CaO are anti-correlated with most of the lithophile elements. Also above bed 24e, there is a weak anti-correlation between Mo and SiO2, MnO, MgO, and P2O5.
Correlations among the trace elements are consistent with suites of trace elements that are controlled by siliciclastic or carbonate components. Thus, Sc, Ga, Rb, Zr, Nb, Cs, Ba, Pb, Th, and U are mutually and mostly strongly correlated, and are related to the siliciclastic component. Cr, Cu, Co, Ni, Sb, Mo, and W constitute a second suite that shows mutual correlations; this group is not distinctly associated with either lithological component. The REE are correlated within themselves, and with Zr, Ta, Hf, Pb, Th, and U. Sr is the only trace element that is negatively correlated with Sc, V, Cr, Ga, Rb, Y, Nb, Cs, Ta, Pb, Zr, Ba, Th, and the REE; it is not positively correlated with any other trace element.
Acetic Acid Extracts: Trace Element Data
Table 4 and Figures 6 ,7 present trace element data for the acetic acid extracts. Major elements were not analyzed in the acetic acid samples. The correlation matrix for the acetic acid extract data is Supplementary Table 5. The data are reported as ppb in solution, and are mostly from beds above 24e, where we expect the most pronounced signal of changes in environmental conditions. Because we have only poor constraints on the amount of sample dissolved during acetic acid leaching, conversion of these data to ppm in the solid introduces large uncertainties. Comparison of concentrations in the acid solution provides a qualitative measure of the trace element content of the carbonate fraction in each sample. The low Ga, Zr, and Th content in these solutions is consistent with our assumption that the siliciclastic component made little or no contribution to these data, though Rb and Cs data suggest that some exchange with phyllosilicates probably occurred. Elements that were sought but were below detection limits in more than 75% of samples include Cr, Ga, Ge, As, Zr, Nb, Mo, Ag, In, Sn, Sb, Hf, Ta, W, Tl, and Bi. The absence of reportable Cr, As, Zr, Mo, Sb, and W contrasts with data from the bulk rock samples.
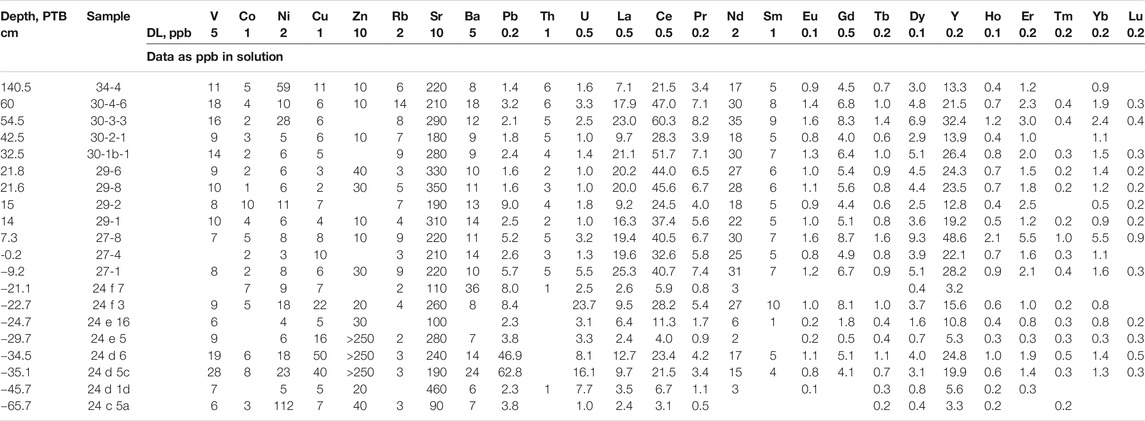
TABLE 4. Summary of acetic acid extract data.
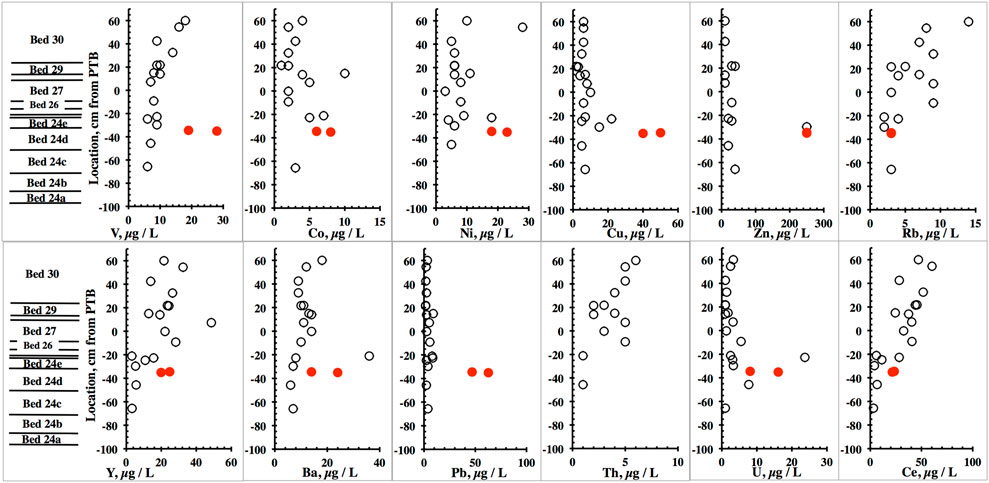
FIGURE 6. Trace element data for acetic acid extracts, plotted stratigraphically. Data for bed 24d are shown in red.
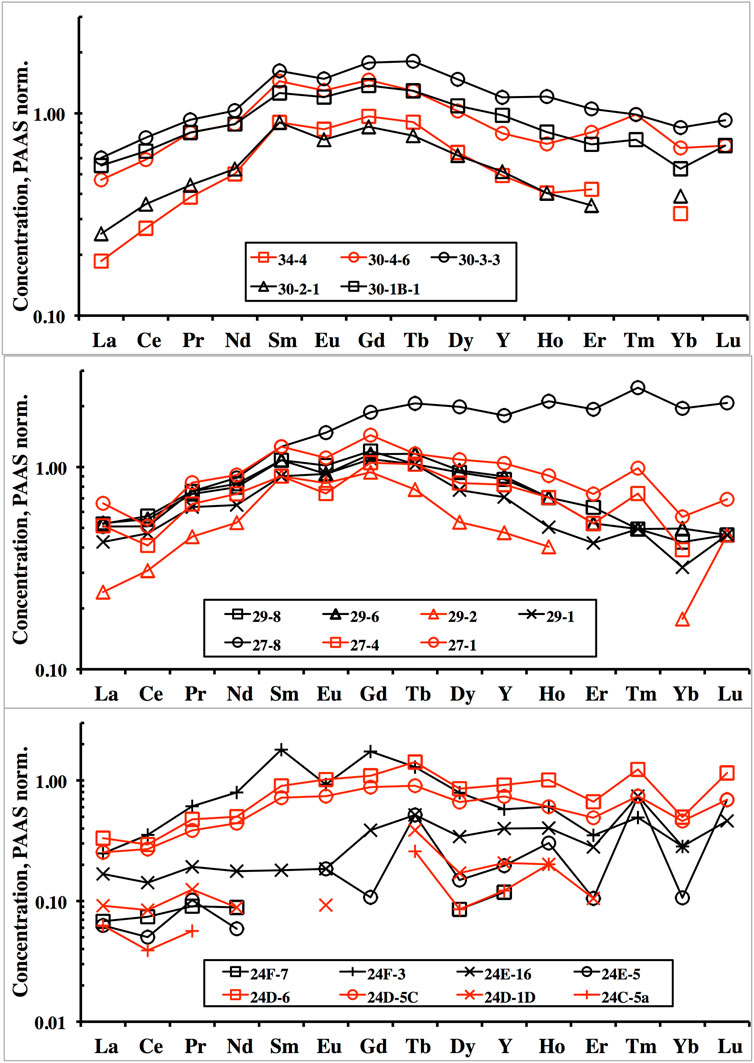
FIGURE 7. Rare earth element patterns of acetic acid extracts. All data have been multiplied by 1,000 to plot on a scale comparable to the whole rock data.
Of the transition metals that were above detection limits in these analyses (V, Co, Ni, Cu, Zn, Pb), all but Co show a distinct concentration peak in bed 24d, just below the extinction horizon in bed 24e (Figure 6). The high concentration of Zn continues into bed 24e, but not into bed 26. Ba is also elevated in bed 24d. U shows a similar distribution, with an additional peak in bed 24f. Some lithophile elements (V, Rb, Y, Th, Ce) show a slight increase upsection. By comparison with the top of bed 24d, the extinction horizon, bed 24f, is not particularly enriched in trace metals, despite the extreme enrichment of Fe, which is present as pyrite. U and Ba have elevated values in 24f. Throughout the section, Th is below detection limit in the carbonate-rich samples, whereas U is enriched in beds 24d, 24e, and 24f, compared with the extracts from beds above 24f. Despite obvious problems in quantitation of the HREE, REE patterns are distinguishable (Figure 7), with beds above 24e having higher REE concentrations and distinct MREE enrichment, whereas both 24e and the beds below 24e show LREE depletion. Negative Ce anomalies are present in most samples below bed 30, and negative Eu anomalies characterize most samples above bed 24e.
Discussion
Geochemistry in Relation to Depositional Environments
Major and trace element data track the major change of lithology between the carbonate-dominated section in beds 24e and below to the siliciclastic-dominated section in beds 24f and above (Figure 2). There are variations on the scale of single laminae within the carbonate section, where SiO2 content can reach above 45 wt% (sample 24c6a) in individual samples. Elevated SiO2, when paired with elevated Al2O3, reflects detrital input deriving from turbidite events (Li G. et al., 2016). Detrital input appears to have SiO2/Al2O3 ∼ 5, the average value in beds above bed 26, and SiO2/Al2O3 above eight indicates SiO2 content independent of detrital input (Figure 2), either as sponge spicule accumulations (Zheng et al., 2013) or as diagenetic silicification. Whole rock compositions thus can be interpreted in terms of three components - carbonate, detrital siliciclastics, and biogenic silica. In the trace element data, the signature of biogenic silica cannot be separately identified, and only the carbonate and detrital components can be recognized. Because the siliciclastic section above bed 24e is dominated by detrital inputs, it is difficult to infer ambient seawater conditions from data in that part of the section.
The non-deposition of carbonates in the extinction horizon (beds 24f–26) may reflect an acidification event in the surface ocean. If the break in carbonate deposition in beds 24f–26 was due to acidification, it was a transient condition lasting less than about 15 kyr, which was followed by carbonate deposition for ∼26 kyr in beds 27–29. Evidence for acidification is tied to the latter part of the extinction interval in the Early Triassic (Clarkson et al., 2015), and not to the latest Permian, and is also presumed to be short-lived, not exceeding 10 kyr. Furthermore, the acidification event is modeled to have decreased oceanic pH from ∼8 to ∼7.3 (Clarkson et al., 2015), a pH at which there would not be extensive dissolution of existing carbonate sediments in marine settings. Alternately, the cessation of carbonate deposition in beds 24f–26 could be due to voluminous detrital input that suppressed carbonate deposition, input that is coincident with deposition of the volcanic ash in bed 25. Carbonate deposition depends on carbonate saturation, i.e., the extent to which the activity product of Ca2+ and CO32− exceeds the solubility product; detrital input that is rich in clays will drop the activity of Ca2+ by providing a large increase in adsorption sites, sequestering Ca2+ in smectite and montmorillonite. Increased detrital input could also reflect increased erosion, as suggested by δ7Li data (Sun et al., 2018), suggesting that the extinction on land was coincident with the marine extinction event (Sephton et al., 2005; Shen S. Z. et al., 2011; Zhang et al., 2015). Negative Δ199Hg in Meishan beds 25–26 is interpreted to indicate that the Hg budget was dominated by local terrigenous inputs (Grasby et al., 2017), also pointing to increased erosion contemporaneously with the extinction. Major and trace element data are insufficient to distinguish between these alternatives, but the absence of evidence for carbonate dissolution at the top of bed 24e is consistent with the latter interpretation.
The exceptional enrichment of Fe2O3T in samples 24f7 and 24f7b, to 30 wt%, signals the pyrite-rich layer in bed 24f. The continuity of this pyrite layer in several sections at Meishan indicates that it is a primary depositional feature, not a diagenetic feature. The pyritic horizon is thin, being <5 mm at the top of bed 24f (though all of bed 24f is pyrite-rich in comparison to the rest of the stratigraphy) that has a total thickness of 24 mm (Supplementary Figure 3), and represents initiation of an euxinic event. Fossils and burrows in bed 24e (Chen Z. Q. et al., 2015) show that bed 24e was deposited under suboxic conditions, so that the euxinic event associated with the end-Permian extinction post-dates bed 24e. Deposition of bed 24f occurred over less than 2 kyr, and the euxinic event could be restricted to a fraction of this interval. There is no clear evidence, in our data, of where termination of euxinic conditions might have occurred upsection. The deposition of the pyrite horizon requires not only the availability of sulfide, but also of Fe in a quantity that is not reflected in any other part of the Meishan section. We interpret the cessation of pyrite precipitation as reflecting the exhaustion of the Fe reservoir rather than the cessation of euxinic conditions: the data of Xiang et al. (2020) and Wei et al. (2020) both show the persistence of anoxia from bed 24f upward through at least bed 26, though euxinia in this interval may have been episodic. There is evidence for trace metal depletion in the water column by precipitation in euxinic waters (Takahashi et al., 2014), but the abundance of Fe in their samples does not show much change across the extinction interval; their data, from an open ocean setting in the Panthalassic Ocean, may not track Fe abundances in shallow water sections like Meishan. The source of Fe - from the overlying water column that includes fresh weathering inputs, or diagenetically mobilized Fe in pore waters - is unclear. Fe enrichment in bed 24f7 is accompanied by enrichments in As, Mo, and Tl, but not in Co, Cu, or Ni.
Previous studies have documented a change in mineralogy in the Meishan section, going from dominantly calcite in the limestones in bed 24e and below, to dominantly Fe- and Mg-bearing carbonates (ankerite or dolomite) in the carbonate beds above bed 24e (Liang, 2002; Li and Jones, 2017). Figure 2 shows the calculated carbonate mineralogy of the Meishan section. The extent of MgO, MnO, and Fe2+ partitioning into the carbonate component is not clear from geochemical data, so that the mineralogical proportions in Figure 2 are estimates, based on the assumption that all CaO is partitioned into calcite, all MgO is partitioned into dolomite (ignoring Mg in chlorite and smectite), and all MnO is present as rhodochrosite. In the absence of analytical data on Fe3+/Fe2+ and S2−, we assumed that Fe2+ is present as pyrite, and have excluded siderite from our calculations. Xiang et al. (2020) measured carbonate associated Fe but do not discuss these data separately. In their data, pyrite represents 0.4–0.8 of highly reactive Fe in the bed 24–28 interval, so that roughly half of the reactive Fe could be present as siderite. Analyses of dolomite grains in beds 25 and above show that Fe-rich zones occur as narrow (<5 µm) rims on some dolomite grains (Li and Jones, 2017).
Trace element data suggest that beds 24e and below have a different detrital component than those above 24e. Thus, for example, there are two different trends of Cr and V abundance with respect to Al2O3 (Figure 4), one trend for beds above 24e showing low Cr/Al and V/Al and a second trend for beds 24e and below with elevated Cr/Al and V/Al. Similar patterns are evident for Y and La (for the REE in general), where data for beds 24e and below show a trend with low Y and La abundance, with a second trend of higher Y and La abundance for beds above 24e.
Multiple factors could contribute to the change in trace element abundances between the section below bed 25 and that above bed 25. A change in the provenance of the sediments is possible, if there is a re-ordering of drainage patterns on land that is coincident with the extinction beginning at the top of bed 24e. A change in the bulk composition of material being transported into the marine environment is possible, if volcanic material deposited on, and subsequently eroded from land comes to comprise a sufficiently large proportion of the total detritus. A change in the proportion of mechanical to chemical weathering could produce different major and trace element patterns as a function of time. Finally, a change in patterns of winnowing of heavy minerals during transport could affect some element distributions, if there were a significant change in the volume of rainfall.
There is an up-section increase in trace element abundances. If, for beds 24e and below, the sediment source area was predominantly carbonates with low trace element content, a change in provenance to a dominantly siliciclastic source area for the beds above bed 24e could account for the increase in trace element abundances. Reconstruction of paleo-drainage patterns would be required to evaluate this possibility.
Numerous volcanic ashes were deposited across all of South China in the latest Permian and early Triassic. If the proportion of ash-derived detritus increased in going from bed 24e to the beds above 24e, and the detrital input in the lower part of the section had a low trace element inventory, this could account for increased trace element abundances up-section. Volcanic ash is relatively quickly eroded, and would produce a transient spike in trace element patterns, unlike the persistent increase in trace element abundances we observe in our data for beds 26–30. Elevated trace element abundances could persist if multiple ash events were involved in this erosional scenario. Because present models suggest global dispersion of some trace elements as aerosol (e.g., Ni and Hg) from the Siberian Traps, identifying those trace elements that were aerosolized and therefore should correlate with Ni and those that were dispersed mainly in the ash beds in South China would be a priority.
A progressive increase in atmospheric CO2 (Saunders and Reichow, 2009) characterized the Late Permian. Elevated atmospheric CO2 is implicated in acidification of rain and the surface ocean, in increasing atmospheric and surface ocean temperatures, and in the rate of silicate weathering (Broecker and Sanyal, 1998; Winnick and Maher, 2018). Compared to an early Changhsingian baseline, increases in acid rain, in atmospheric temperature, and in the rate of silicate weathering all point to an increase in the overall rate of chemical weathering (Algeo and Twitchett, 2010) in the late Changhsingian. The increase of chemical weathering will increase the dissolved load of rivers, and this ultimately will be reflected in increased trace element abundances in the strata above bed 24e. The timing of these effects is uncertain and is debated, but the change in trace element patterns in our data occurs at the very top of bed 24e, and into beds 24f and 26.
Abundances of trace elements with low solubility in aqueous systems (e.g., Ti and Zr) are tied to the abundances and distributions of accessory minerals (rutile, titanite, zircon). The change of Ti abundance from bed 24e to the strata above 24e potentially reflects a change in the winnowing of heavy minerals during riverine transport (c.f., Bennett and Canfield, 2020; Cole et al., 2017).
Li isotopic and abundance data (Sun et al., 2018) show a change between the section below bed 25 and that above, that Sun et al. interpret to indicate increased riverine flux of light 7Li into the oceans. Sun et al. point out the strong correlation of Li with Al, implying that Li is controlled by detrital input, but do not discuss the potential impact of diagenesis on either Li abundance or δ7Li. In Mg isotopic data (Chen et al., 2020), there is a signal of increased weathering starting in the mid-Dienerian, but mineralogical controls on Mg distribution obscure the weathering signal in the earliest Triassic, including the section covered by our sampling.
Post-Archean Australian Shale-Based Enrichment Factors
We have compared the Meishan section to other sedimentary rocks by calculating elemental enrichment factors (ef) with respect to PAAS (Taylor and McLennan, 1985). We use a clastic reference material for dominantly carbonate rocks because many trace elements in the Meishan section are controlled by the detrital, clastic fraction, as is evidenced by trace element correlations with Al. The ef is calculated as (element/Al)sample/(element/Al)PAAS. The most striking feature of ef values as a function of stratigraphy is that most elements have ef ∼1 above bed 27 (0 cm from PTB; Figure 8): the concentration of most elements above bed 27 is comparable to that in average shale. This underscores the observation that the detrital siliciclastic component controls trace element distributions in the upper part of the section.
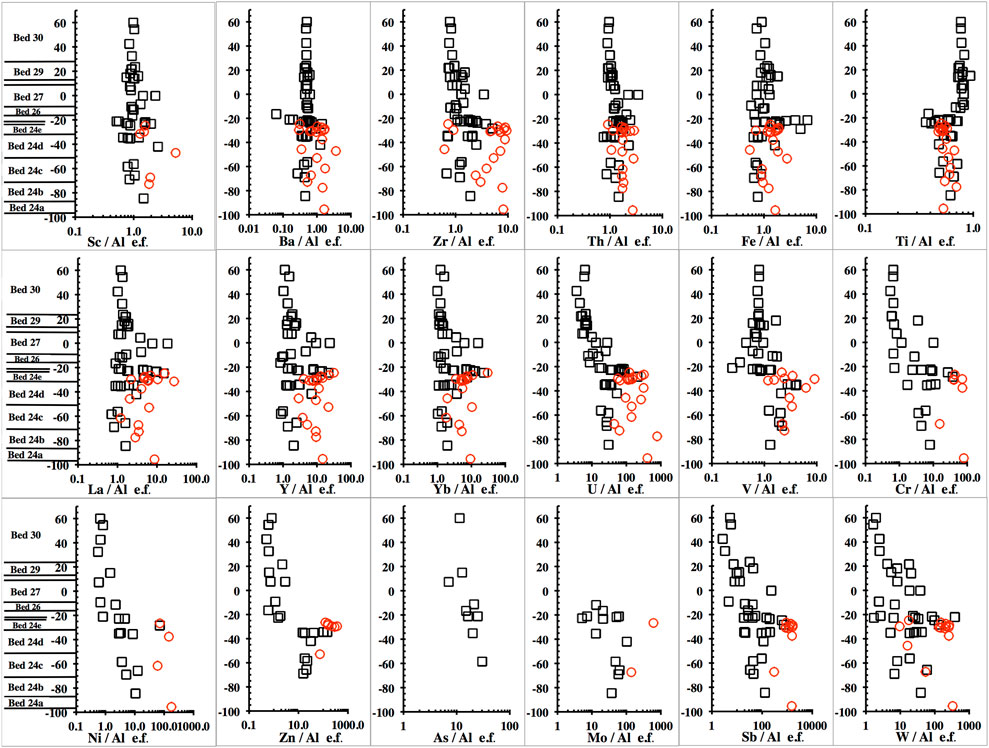
FIGURE 8. Enrichment factors (ef) for whole rock trace elements calculated with respect to Al in PAAS. Samples containing less than 0.5 wt% Fe2O3T are shown in red. Concentration scales vary.
Because of low Al content in carbonate-rich strata, ef values in the carbonate beds are systematically high (c.f., Xiang et al., 2020), and ef calculated with respect to PAAS are potentially misleading. Of particular concern are ef for redox-sensitive trace elements like Ni, As, and Mo, and for Zn, none of which are correlated with Al. In our analyses, these elements have relatively high DL (20, 5, 2, and 30 ppm, respectively). Using the DL values to calculate ef (i.e., for samples with values below DL, substituting DL for the element value in the ef expression) shows interesting patterns that reveal the weakness of our data and of PAAS-based ef in carbonate strata. Above bed 24e, in the siliciclastic section, median ef calculated with DL values are 0.9, 8.6, 5.2, and 1.0 for Ni, As, Mo, and Zn, respectively. In bed 24e, the median ef are 12.5, 125, 75, and 14, respectively, for Ni, As, Mo, and Zn. In the carbonate-dominated beds below 24e, the median ef are 4.2, 42, 25, and 4.7. Because Fe is correlated with Al in beds below 24e, low Fe samples (Fe2O3T < 0.5%) below bed 24e (red points in Figure 8) show this tendency toward higher overall ef.
Sc, Ba, and Th show little variation of ef, regardless of stratigraphic position, suggesting that these elements, throughout the section, are controlled almost exclusively by the siliciclastic component. The apparent insensitivity of Ba to changing biological activity and redox conditions is unexpected. By contrast, the efZr is highly variable below bed 27. Though Zr is usually part of the detrital fraction, and is considered to be immobile in low-temperature environments, efZr variability implies that there has been post-depositional mobility. Zr can be mobilized as hydroxyl and fluoride complexes (Censi et al., 2015), can interact with phosphate binding sites on microbial cell surfaces (Censi et al., 2015), and potentially can also be mobilized as carbonate complexes (Kobayashi and Sasaki, 2017). Mobilization of Zr as hydroxyl or carbonate complexes would require neutral to alkaline pH in the pore water environment.
Other elements that show little variation of ef include Fe and Ti (Figure 8). There is a clear perturbation of efFe in the extinction horizon (24f), and a suggestion of increased efFe at low Fe concentrations in the beds below 24e. Variability of efFe potentially supports the argument of Fe depletion as the limitation on pyrite deposition at the top of 24f: the Fe-rich samples in beds 24d and 24f have efFe > 4, whereas efFe < 2 in beds 26 and above. There is a distinct break in efTi at the extinction horizon, suggesting again that there are different detrital sources, different extents of chemical weathering, or different conditions of winnowing during transport contributing to the weathering flux above and below bed 24e.
The elements that have ef > 1 above bed 27 are Sb, W, As, and U; for these, ef is even higher in beds below 27. Among these elements, only U is measurable in the acetic acid extracts, so that only U enrichment is tied to the carbonate fraction. The controls on Sb, W, and As abundances are unclear.
Zn shows a dramatic change of ef from bed 24e to 24f; in 24e and below, efZn ≥ 10, whereas in beds 24f and above, efZn < 2. Zn is an essential micronutrient for marine phytoplankton (Conway and John, 2014). The change in efZn is coincident with the extinction horizon, implying a collapse of phytoplankton-linked productivity (c.f., Algeo et al., 2012: this drop of productivity is unique to South China PTB sections). Elevated Zn concentration in bed 24 is interpreted, from Zn isotopic data, to be due to magmatic inputs (Liu et al., 2017); the change of efZn then implies that these external inputs were less important in the beds above 24f. But elevated Zn in bed 24e is not accompanied by enrichments in other “magmatically-derived” elements, an observation that calls into question the magmatic provenance of Zn. V, Cr, Ni, and, to some extent, U show similar patterns. Because Zn, V, Cr, and Ni show ef ∼ 1 above bed 27, there is no continued input of an “excess” of these elements above the PTB. If input by volatilization during continuing volcanism were a primary control on their abundances, we would expect ef > 1 for these elements in the strata above bed 27. Co and Cu (not shown in Figure 8) also show ef ∼ 1 in bed 27 and above, but, unlike Zn, V, Cr, and Ni, do not show high ef in the section below 24f. Co, Cu, Ni, and Zn have low solubility products with sulfide, and are rapidly precipitated from sulfide-bearing (euxinic) waters, unlike V and Cr, which do not easily form sulfide compounds; a single mechanism involving euxinic fluids is unlikely to account for the behavior of all these trace elements. A large fraction of V and Cr is tied to the detrital fraction in most sedimentary systems (Cole et al., 2017).
The REE and Y show peaks in ef in beds 24e–24f and 27, with lower values in bed 26. Relative enrichment in the carbonates reflects low Al in these beds, and diagenetic increase of REE without an increase in Al.
Diagenesis
Diagenesis is prevalent in carbonate rocks, making it difficult to extract information from them about primary depositional conditions. Bulk rock major and trace element data are insensitive to when changes in concentrations might have occurred: distinguishing stages or phases of diagenesis from bulk rock geochemical data alone is rarely possible.
Diagenesis in carbonates is usually evaluated by examining relations between CaO, MgO, MnO, and, to a lesser extent, FeO and Sr (e.g., Brand et al., 2012). At Meishan, the most sensitive indicator of diagenesis is 87Sr/86Sr (Dudás et al., 2017). The least altered samples are expected to have 87Sr/86Sr < 0.7071, based on the secular trend of seawater 87Sr/86Sr in the late Permian. These compositions are found primarily in bed 24e (Figure 9). Low values of MgO/CaO, MnO/CaO and FeO/CaO are not systematically linked with low 87Sr/86Sr, indicating that Sr is more susceptible to post-depositional modification than are Mg, Mn and Fe. In our data, MnO/CaO above ∼0.001 in carbonates is an indicator of diagenetic influence. In bed 26 and beds above 28, MnO/CaO is not an indicator of diagenesis.
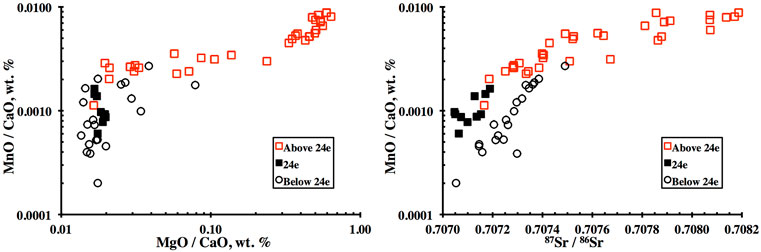
FIGURE 9. Potential tracers of carbonate diagenesis: MnO/CaO vs MgO/CaO and MnO/CaO vs 87Sr/86Sr.
The estimated abundances of calcite, dolomite, and rhodochrosite throughout the section (Figure 2) show that dolomitization was an important process in the beds above 24e. The MgO/CaO of most analyses below bed 24f is below 0.02 (Figure 9), an indication that low-Mg calcite is the dominant phase in these beds. That, in itself, is diagnostic of early diagenesis in which low-Mg calcite replaces likely primary carbonate phases (aragonite, high-Mg calcite, proto-dolomite; Morse, 2003). Above bed 24e, especially in bed 27, there are calcite-rich horizons, and there may well be low-Mg calcite, but the median whole-rock MgO/CaO is higher in bed 27 (0.237 ± 0.231) than in beds 24e and below (0.017 ± 0.015). Li et al. (2018) interpret the global pattern of dolomitization across the PTB to reflect the activity of sulfate-reducing bacteria in an anoxic environment.
Below bed 24e, the other sign of diagenesis is the formation of chert lenses. Silicification is reflected by variation in SiO2/Al2O3 (Figure 2). The siliciclastic detrital component has SiO2/Al2O3 below 8, but numerous samples below bed 24e have SiO2/Al2O3 well above 10. From the geochemical data, it is not clear whether this increase in silica content is due to accumulation of sponge spicules (Zheng et al., 2013) or to addition of SiO2 during diagenesis. The occurrence of chert lenses in the beds below 24e suggests that some variation in SiO2 is due to diagenesis. Chert is underrepresented in our whole rock sampling because our primary target was to interpret the geochemistry of the carbonates. Additional insight into trace element distributions, particularly, could be gained by systematic sampling of cherts in the Meishan section.
Numerous studies have examined the character and distribution of pyrite in the Meishan section (Jiang et al., 2006; Shen et al., 2007; Chen Z. Q. et al., 2015; Li G. et al., 2016). Syngenetic, framboidal pyrite (diameter <5 µm), and presumably diagenetic, larger framboids and euhedral pyrite cubes occur at Meishan. The role of diagenesis in the cycling of S is clearly indicated by multiple S isotopic study (Shen Y. et al., 2011). The pyritization of carbonate fossils (Chen Z. Q. et al., 2015) also indicates diagenetic mobility of both S and Fe. Thus, the inference of redox conditions in the seawater column, based on the occurrence and character of pyrite, is confounded by the evidence that pyrite distribution is affected by diagenesis that proceeds under conditions in the sediment - pore water system.
Field observations indicate that there is a non-deposition surface (“hardground” or “firmground”) at the top of bed 24d (Cao and Zheng, 2009; Zheng et al., 2013). This is reflected in the geochemical data as a zone of silicification, with 5 samples from 24d5 to 24d6 containing 29–45 wt% SiO2 and having SiO2/Al2O3 between 10 and 20, well above the five to eight range that characterizes siliciclastic input. More importantly, these samples show an anomalous increase in V, Co, Ni, Cu, Zn and Pb in both the whole rock and the acetic acid extract data (Figures 3,6). In the whole rock data, Ba is not noticeably enriched in bed 24d, whereas the acetic acid extracts show elevated Ba, supporting a diagenetic process for a suite of elements that characterizes the carbonate-hosted “Mississippi Valley” type Pb-Zn deposits (Sverjensky, 1986; Paradis et al., 2007). Though the “hardground” surface at the top of bed 24d is a depositional feature reflecting sea level fluctuation, apparently diagenetic silicification produced a hydrological cap that trapped upwelling solutions carrying dissolved transition metals. These solutions are interpreted to be oxic because most transition metals cannot be transported in reduced solutions. Because the transition element enrichment in bed 24d does not continue upward into bed 24e, it is possible that diagenesis of 24d predated deposition of 24e, or that silicification at the top of 24d effectively restricted upward flow of diagenetic waters into 24e. We did not sample the “hardground” zones in bed 27 to determine whether similar features occur there.
The REE patterns of primary, marine carbonates are expected to show LREE depletion, with gradually increasing concentrations toward the HREE (Nothdurft et al., 2004). This pattern broadly reflects the abundances of REE in ocean water (Alibo and Nozaki, 1999). Particularly in the acetic acid extracts, the bulk of the samples from Meishan show a bell-shaped pattern with distinct enrichment of the MREE (Figure 7). This pattern is attributed to diagenetic redistribution of REE (Bright et al., 2009), and is particularly pronounced in marine phosphates, including conodonts (Chen J. et al., 2015).
Indicators of Volcanic Input
As discussed above, some trace element data suggest that the factors controlling trace element abundances were different for beds above 24e and those below 24e. The simplest interpretation of these data is that, in the 24f–26 interval, there was significantly increased input from local, arc-related volcanism. Bed 25 is a volcanic ash that is linked to silicic, arc-related, volcanism (Gao et al., 2013; He et al., 2014). Silicic arc volcanism typically has relatively low Cr and V, but elevated Zr, Y, and REE compared with basaltic volcanism. The trace element patterns of beds 24f–26 reflect this local volcanic input. By contrast, continental flood basalt volcanism, though highly variable in trace element content in detail, would have Cr/Al and V/Al higher than those of silicic volcanics, and lower Zr, Y, and LREE—a pattern that is exactly opposite to that observed in our data. Similar changes in trace element abundances are not evident in the beds on either side of bed 28, which has a trace element profile that is very different from bed 25 (He et al., 2014). Hg abundances and isotopic data (Shen et al., 2021) provide a more complex picture. Of the four Hg abundance spikes in the South Chinese sections near the end-Permian extinction, the oldest three occur only in South Chinese PTB sections and can be linked to regional magmatism, whereas the fourth spike, associated with the extinction interval itself, is widely distributed and appears to include inputs both from regional sources and from the Siberian eruptions. If the trace element complement associated with Siberian magmatism derives primarily from burning of coal, and not from the magma itself, we cannot use the trace element systematics of igneous rocks as an interpretive framework for trace element distributions at Meishan.
Interpretation of Redox Conditions
Xiang et al. (2020) provide a framework, based on Fe speciation, for interpreting redox conditions within the Meishan section. It is not clear whether Fe speciation is a primary depositional marker or has been impacted by diagenesis. Xiang et al. (2020) argue that most of the section below bed 24e was oxic, with only brief episodes of anoxic conditions, as suggested by multiple S isotopic data (Shen Y. et al., 2011); that there is evidence of anoxia, with occasional euxinia, from bed 24e or 24f upward through bed 28; and that conditions were ferruginous (anoxic, but with Fe2+ in excess of available sulfide) in the beds above bed 28.
Our data are compatible with those of Xiang et al. (2020), and supplement them by adding information on the distributions of a broader range of trace elements. Our data, however, are insensitive markers of redox conditions, because they are limited by three factors: small sample size (∼10 mg), so that many elements have values below the limit of detection; relatively high DL (e.g., 20 ppm for Cr and Ni, 30 ppm for Zn) for critical elements; and sampling on a scale that may not capture high-frequency changes in redox conditions. The combination of these leads to missing values and an incomplete picture of elemental variation. Thus, out of 64 whole rock powders, only 9 were above DL for As, 17 for Mo, and 24 for Ni. Among the 9 values reported for As, four are in beds 24f and 26, but eight samples in 24f and 26 are BLOD; among the 17 values reported for Mo, 7 are in beds 24f and 26, but there are 5 additional samples in beds 24f and 26 that are BLOD. For both As and Mo, there are samples in bed 24d that are above the detection limit. By contrast, only 3 of 30 reported Zn values are in beds 24f and 26. Overall, our data are consistent with those reported by Zhou and Kyte (1988) for As, Sb, Zn, Th and U, and by Kaiho et al. (2001) for Ni and Mn.
Our data suggest that at least three factors affect abundances of redox-sensitive trace elements. The first is detrital input, signaled by increased Sc, V, Cr, Y, Zr, Nb and Ba in 24f3 and 26, where Sc, Y, Zr, and probably Nb, are not affected by redox conditions. The elevated V, Cr and Ba in beds 24f and 26 is thus partly due to detrital input. The second is redox state at the time of deposition, indicated by increased As, Mo, Sb and Tl in 24f7 and the black claystone of bed 26, which likely signal anoxic and possibly euxinic conditions. It is not clear whether these elements reflect redox conditions in the water column (primary) or in sediment pore waters (diagenetic). The third factor is diagenetic mobility of some of the redox-sensitive elements. We interpret transition metal enrichments in bed 24d to reflect diagenesis rather than primary depositional conditions, and suggest that trace metal distributions of at least some elements, including Ni, in the stratigraphy at Meishan cannot be used to infer redox conditions without assessing the extent of diagenetic mobility. Bennett and Canfield (2020) note that the behavior, during diagenesis, of some redox-sensitive trace metals, like V, is poorly understood.
Rothman et al. (2014) argued that the distribution of Ni in the Meishan section reflected trace element input from the eruptions of the Siberian Traps, and that Ni availability was a key prerequisite to a microbial methanogenesis event that could explain global carbon isotopic variations near the PTB. Two observations temper this interpretation. First, because individual horizons with elevated Ni content occur well below the extinction horizon (80–170 ppm in individual samples from beds 24a–24d, extending to ∼75 kyr prior to the extinction), the extinction in bed 24f, with Ni up to 170 ppm, is not uniquely linked with an increase in Ni supply. Our data do not constrain when and if there might have been an increase in Ni supply below bed 24. Our data show that Ni levels above bed 28, after the extinction interval, were lower than those in the section below the extinction horizon, consistently with Rothman et al.’s (2014) data. The increase in Ni is not consistently reflected in our data, in that not all samples in and immediately above the extinction horizon show increased Ni. Second, it is not possible to explain the increase of all of the trace elements in bed 24d—V, Co, Ni, Cu, Zn, Pb, and Ba—by appealing to aerosol input from the Siberian eruptions. Their erratic abundance distributions above bed 24d, especially their absence in bed 24e, is not consistent with a model of global aerosol input. A local diagenetic model for transition metal distributions is more consistent with our data.
In our data, there are no consistent correlations between the redox-sensitive trace elements and either Mn or Fe, contrary to expected patterns (Tribovillard et al., 2006; Lyons et al., 2009). In samples 24f7 and 24f7b, we sampled the pyrite layer with its admixed siliciclastic component (SiO2 in both samples is ∼18 wt%); As and Mo are elevated in both samples, whereas V, Cr, Ni, and Zn are above detection limits in only one of these two samples—the trace element enrichment is not consistent at our level of sampling. Though U commonly accompanies elevated Mo (Algeo and Lyons, 2006), this association is only weakly reflected in our data. The range of Mo that we measured is below that usually encountered in euxinic strata (>30 ppm), but is within the range observed in suboxic sediments (Lyons et al., 2009).
The distribution of Th is controlled primarily by detrital input: Th is closely correlated with Al2O3 (Figure 4). The major change in the rate of siliciclastic input occurs at the top of bed 24e, concurrently with the development of euxinic conditions in beds 24f and 26 (c.f., Xiang et al., 2020). This change in redox conditions is reflected in an increase in the U content in beds 24f and 26. Thus, in our data, there are two populations of samples, based on Th/U: samples above bed 26, dominated by siliciclastic input, have Th/U 2.68 ± 0.74 (n = 20), and Th/U here is not indicative of redox conditions. Samples below bed 24f have Th/U 0.39 ± 0.25 (n = 30), reflecting both U enrichment and the lower input of Th in siliciclastic materials. This difference between the upper part of the stratigraphy and the lower part again suggests that there is either a change in the provenance of the siliciclastics, or a change in the proportion of mechanical to chemical weathering across the extinction horizon. The acetic acid extracts for samples above bed 26 consistently have lower U than those below bed 26. The carbonate fraction in beds above 26 is depleted in U, a pattern that is consistent with global U depletion in carbonates above the PTB (e.g., Ehrenberg et al., 2008), yet whole rock U enrichment factors compared to PAAS remain well above one in samples above bed 26. In our whole rock data, the median U content in beds above 26 is 2.4 ppm (±1.5, 1σ), whereas the median U content for beds 24e and below is 3.3 ppm (±2.8, 1σ), a difference that is not statistically significant.
The distributions of Sb, W, and Tl are difficult to interpret. All are redox-sensitive. All are above DL in most samples, with mild enrichment in beds 24d, 24e, 24f, and 26. With As, they are usually correlated in low-temperature hydrothermal systems (i.e., epithermal gold systems; Berger and Bagby, 1993). Little is known about their biological cycling. In the absence of systematic data about the distribution of Sb, W, and Tl in variously oxidized sedimentary systems, these data are suggestive but not definitive of suboxic to euxinic conditions. Zhou and Kyte (1988) also show elevated Sb in bed 24f2.
Rare Earth Elements as a Redox Proxy and a Source Indicator
The low REE content of marine carbonates makes their REE patterns susceptible to large changes with even small admixture of REE from other sources (Nothdurft et al., 2004). Clean marine carbonates have REE patterns with low total REE content and low LREE (chondrite-normalized La/Yb < 1; Li and Jones, 2014). Admixture of REE from other sources typically increases both REE abundances and La/Yb so that REE patterns approach that of standard shales (e.g., Post-Archean Australian Shale, PAAS, Taylor and McLennan, 1985). In our data, REE profiles of the acetic acid extracts, i.e., carbonate-associated REE, mostly have La/Yb < 1 and elevated MREE, resulting in REE patterns that are bowed upward (Figure 7; Supplementary Figure 6) and typical of carbonates showing diagenetic enrichment of MREE (Bright et al., 2009). Whole rock REE concentrations are 100–1,000 times higher than in the acetic acid extracts, approach concentrations in average shale, and are relatively flat when normalized to PAAS (Figure 5): REE from detrital sources are controlling REE distributions in the whole rocks.
A suggested measure of the seawater component in carbonates is Y/Ho, for which the chondritic and crustal average value is 25–30, and the Y/Ho in oceanic carbonates is usually >45 (Song et al., 2012). Using this criterion, many of our samples have a detectable seawater component, but few have a dominantly seawater REE complement (Supplementary Figure 6). More significantly, the acetic acid extracts, nominally tracking the carbonate component, do not show Y/Ho much above the expected terrigenous average, and acetic acid extracts do not show a positive Y anomaly. Though Li and Jones (2014) do not provide Ho data, their REE patterns show no positive Y anomaly in marine aragonite (matrix and corals), but do show Y anomalies in calcitized - diagenetically modified - carbonate. Thus, Y/Ho itself is potentially tracking diagenetic reactions, not a primary seawater signal.
Within the range of oxidation conditions that occur near the earth's surface, Ce and Eu can change oxidation state. In seawater, changes in oxidation state affect the behavior and relative abundances of Ce and Eu with respect to other REE: chemical sediments formed in oxidizing marine environments typically show negative Ce and slight positive Eu anomalies. In our assessment of the REE data, we have adopted the computational formalisms of Bolhar et al. (2004) that account for possible positive La anomalies in calculating Ce/Ce* (the Ce anomaly), and for possible positive Gd anomalies in calculating Eu/Eu*.
The control of REE abundances by the siliciclastic fraction, and the diagenetic modification of carbonate REE, imply that variations in Ce and Eu are unlikely to be useful markers of the redox condition of the seawater column. Ce/Ce* < 1 indicates oxic conditions, and most of our samples show negative Ce anomalies (Figure 10). It is only in beds 29 and above, deposited under ferruginous conditions (Xiang et al., 2020), that Ce/Ce* is consistently above 1. This may reflect the association of Ce with Fe-bearing particulates (Alibo and Nozaki, 1999). In samples 24f7 and 24f7b, from the pyrite bed, Ce/Ce* is 1.07 and 0.91, with a value of 0.80 in the acetic acid extract from 24f7. Thus, even in the horizon in which euxinic conditions are indisputable, Ce/Ce* is recording a mixed signal. Zhao et al. (2013) have documented the same pattern in conodont albid crowns that are more resistant to diagenetic modification.
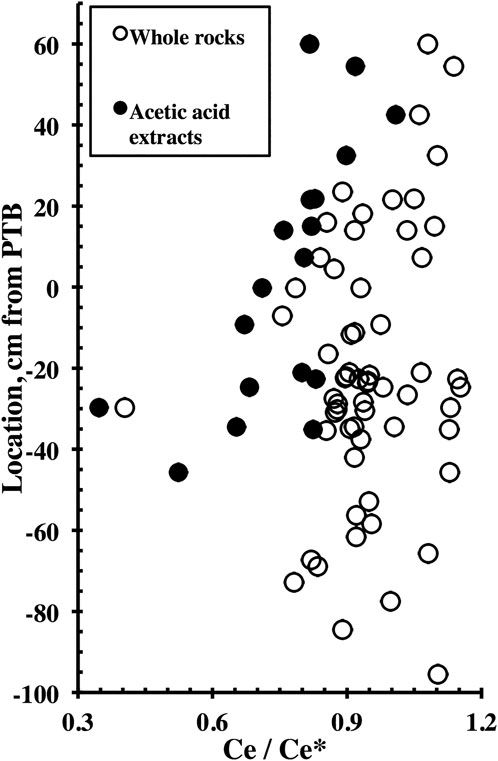
FIGURE 10. Stratigraphic pattern of Ce/Ce* calculated by the method of Bolhar et al. (2004), with data from whole rocks and acetic acid extracts. Acetic acid extracts systematically have lower Ce/Ce* than the corresponding whole rocks.
At Meishan, REE data do not distinguish between inputs from the continental tholeiites of the Siberian volcanic event and more local, arc-related volcanism. The mechanism of REE delivery would be different—aerosolized trace elements would be associated with the Siberian Traps, whereas trace elements in volcanic ash would be the mechanism of input from more local sources. Both would result in an overall increase in REE content, and in an increase in La/Yb, as observed upward in the stratigraphy at Meishan. Abundances of other trace elements like Cr, V, and Ti are higher in continental tholeiites, whereas those of Zr and Y are lower in continental tholeiites compared with silicic arc volcanics. These systematics suggest that input from a continental tholeiite source would result in elevated Cr, V, and Ti, with concomitant relative depletion of Zr and Y. This is opposite the observed changes in beds 24f–26, suggesting that the better option is input from local, arc-related volcanic sources. The interpretation is complicated by the contrasting trace element distributions measured in beds 25 and 28 at Meishan (He et al., 2014).
Conclusion
We report a survey of major and trace elements in the PTB section at Meishan, China. Our data track lithological changes at Meishan. There is a transition from carbonate-dominated sedimentation in beds 24e and below, to siliciclastic-dominated sediments in beds above 24f. Major element data show that bed 24e is the purest limestone in the section. Major element data indicate a change in carbonate mineralogy from low-Mg calcite in beds 24e and below, to dolomite or ankerite in beds 24f and above. Trace elements strongly correlated with Al2O3 (Sc, Ga, Rb, Ba, Th) characterize the siliciclastic fraction of the Meishan rocks. Transition metals and some related elements behave as a coherent group, and reflect three factors: changes in detrital input, diagenetic mobility, and changing redox conditions. Enrichment factors (ef) calculated with respect to Al in Post-Archean Australian Shale for most trace elements are ∼1 in samples above bed 27, indicating trace element control by the siliciclastic fraction in the Triassic part of the section. In beds 24f and 26, variation in ef is related both to increased detrital input and to anoxia.
Trace element data suggest that there was a change in either the provenance of the detrital fraction, or in the proportion of mechanical to chemical weathering coincidentally with the extinction beginning at the top bed 24e. The changes in trace element distributions cannot be conclusively linked with volcanic inputs from either the Siberian Traps or the more local arc-related volcanism, though relative abundances of Cr, V, Y, Zr, and LREE are more consistent with distributions in silicic, arc-related volcanics. REE patterns are not diagnostic of the potential source.
Our data also track diagenetic processes in the Meishan section. SiO2 in part varies independently of Al2O3 in beds below 24e, and shows diagenetic mobility of silica, or accumulations of sponge spicules. Silicification of a hardground horizon at the top of bed 24d is associated with elevated concentrations of V, Co, Ni, Cu, Zn, Pb, and Ba, indicating diagenetic concentration of transition metals under what may have been a hydrological cap. Thus, transition metals reflect diagenetic processes in addition to detrital input, and redox conditions.
The distributions of Ba, Zr, and Zn are anomalous. The ef of Ba is virtually invariant throughout the section, despite the expected sensitivity of Ba to both biological activity and redox conditions. Zr, usually considered to be immobile and to be controlled by detrital inputs, shows highly variable ef in the beds below 24e, which we attribute to diagenetic mobility. Zn shows a dramatic drop in ef in the extinction interval, exhibiting a dependence on biological activity.
In beds 24f and 26, the extinction interval, there are anomalous concentrations of V, Cr, Ni, Cu, As, Mo, and U. This is the clearest evidence of the impact of reducing conditions on element distributions. Yet elemental distributions are not consistent from sample to sample. Small sample size, high detection limits, and limited sampling make interpretation of redox conditions from our data difficult. Elevated concentrations of Sb, W, and Tl occur throughout the section, for which we have no explanation.
Throughout the Meishan section, REE concentrations are controlled by the siliciclastic fraction, and REE in the carbonate fraction show diagenetic enrichment of MREE. REE control by the detrital fraction and evidence for diagenetic modification of REE vitiate the utility of conventionally accepted REE markers of redox conditions, Ce/Ce* and Eu/Eu*.
Data Availability Statement
The original contributions presented in the study are included in the article/Supplementary Material, further inquiries can be directed to the corresponding author.
Author Contributions
SB suggested the outlines of this study. S-ZS provided the sample material from Meishan and considerable support during the early phases of this study. HZ assisted with field work. FD managed laboratory sampling, data acquisition, and preparation of the manuscript.
Funding
This study was supported by the Strategic Priority Research Program (B) of the Chinese Academy of Sciences (XDB18000000, XDB26000000) and NSFC (grant nos. 41290260, 41420104003) to SZS. It was also supported in part by NASA (United States) Astrobiology grant NNA08CN84A to Daniel Rothman and SAB.
Conflict of Interest
The authors declare that the research was conducted in the absence of any commercial or financial relationships that could be construed as a potential conflict of interest.
Acknowledgments
We acknowledge the assistance of Dan Shrag and Greg Eischeid at Harvard University in providing facilities for microdrilling of the carbonate samples. H. Yntema did much of the microdrilling. We thank two reviewers for their patience, for thoughtful and challenging reviews, and for directing us to additional resources. We thank our editor, Dr. Hajime Naruse, for his assistance and patience.
Supplementary Material
The Supplementary Material for this article can be found online at: https://www.frontiersin.org/articles/10.3389/feart.2021.637102/full#supplementary-material
References
Algeo, T. J., Henderson, C. M., Tong, J., Feng, Q., Yin, H., and Tyson, R. V. (2013). Plankton and Productivity during the Permian-Triassic Boundary Crisis: An Analysis of Organic Carbon Fluxes. Glob. Planet. Change 105, 52–67. doi:10.1016/j.gloplacha.2012.02.008
Algeo, T. J., and Lyons, T. W. (2006). Mo-total Organic Carbon Covariation in Modern Anoxic marine Environments: Implications for Analysis of Paleoredox and Paleohydrographic Conditions. Paleoceanography 21, PA1016. doi:10.1029/2004pa001112
Algeo, T. J., and Twitchett, R. J. (2010). Anomalous Early Triassic Sediment Fluxes Due to Elevated Weathering Rates and Their Biological Consequences. Geology 38, 1023–1026. doi:10.1130/g31203.1
Alibo, D. S., and Nozaki, Y. (1999). Rare Earth Elements in Seawater: Particle Association, Shale-Normalization, and Ce Oxidation. Geochim.t Cosmochim. Acta 63, 363–372. doi:10.1016/s0016-7037(98)00279-8
Bennett, W. W., and Canfield, D. E. (2020). Redox-sensitive Trace Metals as Paleoredox Proxies: A Review and Analysis of Data from Modern Sediments. Earth-Sci. Rev. 204, 103175. doi:10.1016/j.earscirev.2020.103175
Berger, B. R., and Bagby, W. C. (1993). “The Geology and Origin of Carlin-type Gold Deposits,” in Gold Metallogeny and Exploration. Editor R. P. Foster (Dordrecht: Springer), 210–248. doi:10.1007/978-94-011-2128-6_7
Black, B. A., Lamarque, J.-F., Shields, C. A., Elkins-Tanton, L. T., and Kiehl, J. T. (2014). Acid Rain and Ozone Depletion from Pulsed Siberian Traps Magmatism. Geology 42, 67–70. doi:10.1130/g34875.1
Bolhar, R., Kamber, B. S., Moorbath, S., Fedo, C. M., and Whitehouse, M. J. (2004). Characterisation of Early Archaean Chemical Sediments by Trace Element Signatures. Earth Planet. Sci. Lett. 222, 43–60. doi:10.1016/j.epsl.2004.02.016
Bolhar, R., and Vankranendonk, M. (2007). A Non-marine Depositional Setting for the Northern Fortescue Group, Pilbara Craton, Inferred from Trace Element Geochemistry of Stromatolitic Carbonates. Precambrian Res. 155, 229–250. doi:10.1016/j.precamres.2007.02.002
Brand, U., Posenato, R., Came, R., Affek, H., Angiolini, L., Azmy, K., et al. (2012). The end‐Permian Mass Extinction: A Rapid Volcanic CO2 and CH4‐climatic Catastrophe. Chem. Geol. 322-323, 121–144. doi:10.1016/j.chemgeo.2012.06.015
Bright, C. A., Cruse, A. M., Lyons, T. W., MacLeod, K. G., Glascock, M. D., and Ethington, R. L. (2009). Seawater Rare-Earth Element Patterns Preserved in Apatite of Pennsylvanian Conodonts? Geochim. Cosmochim. Acta 73, 1609–1624. doi:10.1016/j.gca.2008.12.014
Broecker, W. S., and Sanyal, A. (1998). Does Atmospheric CO2police the Rate of Chemical Weathering? Glob. Biogeochem. Cycles 12, 403–408. doi:10.1029/98GB01927
Burgess, S. D., and Bowring, S. A. (2015). High-precision Geochronology Confirms Voluminous Magmatism before, during, and after Earth’s Most Severe Extinction. Sci. Adv. 1, e1500470. doi:10.1126/sciadv.1500470
Burgess, S. D., Bowring, S., and Shen, S.-Z. (2014). High-precision Timeline for Earth's Most Severe Extinction. Proc. Natl. Acad. Sci. USA 111, 3316–3321. Erratum at. doi:10.1073/pnas.1317692111
Burgess, S. D., Muirhead, J. D., and Bowring, S. A. (2017). Initial Pulse of Siberian Traps Sills as the Trigger of the End-Permian Mass Extinction. Nat. Commun. 8, 1–4. doi:10.1038/s41467-017-00083-9
Cao, C., Love, G. D., Hays, L. E., Wang, W., Shen, S., and Summons, R. E. (2009). Biogeochemical Evidence for Euxinic Oceans and Ecological Disturbance Presaging the End-Permian Mass Extinction Event. Earth Planet. Sci. Lett. 281, 188–201. doi:10.1016/j.epsl.2009.02.012
Cao, C., and Zheng, Q. (2009). Geological Event Sequences of the Permian-Triassic Transition Recorded in the Microfacies in Meishan Section. Sci. China Ser. D-Earth Sci. 52, 1529–1536. doi:10.1007/s11430-009-0113-0
Censi, P., Cangemi, M., Brusca, L., Madonia, P., Saiano, F., and Zuddas, P. (2015). The Behavior of Rare-Earth Elements, Zr and Hf during Biologically-Mediated Deposition of Silica-Stromatolites and Carbonate-Rich Microbial Mats. Gondwana Res. 27, 209–215. doi:10.1016/j.gr.2013.09.014
Chen, J., Algeo, T. J., Zhao, L., Chen, Z.-Q., Cao, L., Zhang, L., et al. (2015). Diagenetic Uptake of Rare Earth Elements by Bioapatite, with an Example from Lower Triassic Conodonts of South China. Earth-Sci. Rev. 149, 181–202. doi:10.1016/j.earscirev.2015.01.013
Chen, J., Shen, S.-z., Li, X.-h., Xu, Y.-g., Joachimski, M. M., Bowring, S. A., et al. (2016). High-resolution SIMS Oxygen Isotope Analysis on Conodont Apatite from South China and Implications for the End-Permian Mass Extinction. Palaeogeogr. Palaeoclimatol. Palaeoecol. 448, 26–38. doi:10.1016/j.palaeo.2015.11.025
Chen, X. Y., Teng, F. Z., Huang, K. J., and Algeo, T. J. (2020). Intensified Chemical Weathering during Early Triassic Revealed by Magnesium Isotopes. Geochim. Cosmochim. Acta. doi:10.1016/j.gca.2020.02.035
Chen, Z.-Q., Yang, H., Luo, M., Benton, M. J., Kaiho, K., Zhao, L., et al. (2015). Complete Biotic and Sedimentary Records of the Permian-Triassic Transition from Meishan Section, South China: Ecologically Assessing Mass Extinction and its Aftermath. Earth-Sci. Rev. 149, 67–107. doi:10.1016/j.earscirev.2014.10.005
Clarkson, M. O., Kasemann, S. A., Wood, R. A., Lenton, T. M., Daines, S. J., Richoz, S., et al. (2015). Ocean Acidification and the Permo-Triassic Mass Extinction. Science 348, 229–232. doi:10.1126/science.aaa0193
Cole, D. B., Zhang, S., and Planavsky, N. J. (2017). A New Estimate of Detrital Redox-Sensitive Metal Concentrations and Variability in Fluxes to marine Sediments. Geochim. Cosmochim. Acta 215, 337–353. doi:10.1016/j.gca.2017.08.004
Conway, T. M., and John, S. G. (2014). The Biogeochemical Cycling of Zinc and Zinc Isotopes in the North Atlantic Ocean. Glob. Biogeochem. Cycles 28, 1111–1128. doi:10.1002/2014GB004862
Dudás, F. Ö., Yuan, D.-X., Shen, S.-Z., and Bowring, S. A. (2017). A Conodont-Based Revision of the 87Sr/86Sr Seawater Curve across the Permian-Triassic Boundary. Palaeogeogr. Palaeoclimatol. Palaeoecol. 470, 40–53. doi:10.1016/j.palaeo.2017.01.007
Ehrenberg, S. N., Svånå, T. A., and Swart, P. K. (2008). Uranium Depletion across the Permian-Triassic Boundary in Middle East Carbonates: Signature of Oceanic Anoxia. Bulletin 92, 691–707. doi:10.1306/02140807095
Feng, Z., Wei, H.-B., Guo, Y., He, X.-Y., Sui, Q., Zhou, Y., et al. (2020). From Rainforest to Herbland: New Insights into Land Plant Responses to the End-Permian Mass Extinction. Earth-Sci. Rev. 204, 103153. doi:10.1016/j.earscirev.2020.103153
Fielding, C. R., Frank, T. D., McLoughlin, S., Vajda, V., Mays, C., Tevyaw, A. P., et al. (2019). Age and Pattern of the Southern High-Latitude continental End-Permian Extinction Constrained by Multiproxy Analysis. Nat. Commun. doi:10.1038/s41467-018-07934-z
French, K. L., Tosca, N. J., Cao, C., and Summons, R. E. (2012). Diagenetic and Detrital Origin of Moretane Anomalies through the Permian-Triassic Boundary. Geochim. Cosmochim. Acta 84, 104–125. doi:10.1016/j.gca.2012.01.004
Ganino, C., and Arndt, N. T. (2009). Climate Changes Caused by Degassing of Sediments during the Emplacement of Large Igneous Provinces. Geology 37, 323–326. doi:10.1130/G25325A.1
Gao, Q., Zhang, N., Xia, W., Feng, Q., Chen, Z.-Q., Zheng, J., et al. (2013). Origin of Volcanic Ash Beds across the Permian-Triassic Boundary, Daxiakou, South China: Petrology and U-Pb Age, Trace Elements and Hf-Isotope Composition of Zircon. Chem. Geol. 360-361, 41–53. doi:10.1016/j.chemgeo.2013.09.020
Grasby, S. E., Shen, W., Yin, R., Gleason, J. D., Blum, J. D., Lepak, R. F., et al. (2017). Isotopic Signatures of Mercury Contamination in Latest Permian Oceans. Geology 45, 55–58. doi:10.1130/G38487.1
He, B., Zhong, Y.-T., Xu, Y.-G., and Li, X.-H. (2014). Triggers of Permo-Triassic Boundary Mass Extinction in South China: The Siberian Traps or Paleo-Tethys Ignimbrite Flare-Up? Lithos 204, 258–267. doi:10.1016/j.lithos.2014.05.011
Hinojosa, J. L., Brown, S. T., Chen, J., DePaolo, D. J., Paytan, A., Shen, S.-z., et al. (2012). Evidence for End-Permian Ocean Acidification from Calcium Isotopes in Biogenic Apatite. Geology 40, 743–746. doi:10.1130/g33048.1
Jenkyns, H. C. (2010). Geochemistry of Oceanic Anoxic Events. Geochem., Geophys. Geosystems 11, 1–30. doi:10.1029/2009gc002788
Jiang, Y. F., Tang, Y. G., and Chou, C. L. (2006). Research on Genesis of Pyrite Near the Permian-Triassic Boundary in Meishan, Zhejiang, China. J. China Univ. Min. Technol. 16 (4), 457–460. doi:10.1016/S1006-1266(07)60047-9
Joachimski, M. M., Alekseev, A. S., Grigoryan, A., and Gatovsky, Y. A. (2020). Siberian Trap Volcanism, Global Warming and the Permian-Triassic Mass Extinction: New Insights from Armenian Permian-Triassic Sections. GSA Bull. 132, 427–443. doi:10.1130/b35108.1
Joachimski, M. M., Lai, X., Shen, S., Jiang, H., Luo, G., Chen, B., et al. (2012). Climate Warming in the Latest Permian and the Permian-Triassic Mass Extinction. Geology 40, 195–198. doi:10.1130/g32707.1
Kaiho, K., Chen, Z.-Q., Kawahata, H., Kajiwara, Y., and Sato, H. (2006a). Close-up of the End-Permian Mass Extinction Horizon Recorded in the Meishan Section, South China: Sedimentary, Elemental, and Biotic Characterization and a Negative Shift of Sulfate Sulfur Isotope Ratio. Palaeogeogr. Palaeoclimatol. Palaeoecol. 239, 396–405. doi:10.1016/j.palaeo.2006.02.011
Kaiho, K., Kajiwara, Y., Chen, Z.-Q., and Gorjan, P. (2006b). A Sulfur Isotope Event at the End of the Permian. Chem. Geology. 235, 33–47. doi:10.1016/j.chemgeo.2006.06.001
Kaiho, K., Kajiwara, Y., Nakano, T., Miura, Y., Kawahata, H., Tazaki, K., et al. (2001). End-Permian Catastrophe by a Bolide Impact: Evidence of a Gigantic Release of Sulfur from the Mantle. Geol 29, 815–818. doi:10.1130/0091-7613(2001)029<0815:epcbab>2.0.co;2
Kamo, S. L., Czamanske, G. K., Amelin, Y., Fedorenko, V. A., Davis, D. W., and Trofimov, V. R. (2003). Rapid Eruption of Siberian Flood-Volcanic Rocks and Evidence for Coincidence with the Permian-Triassic Boundary and Mass Extinction at 251 Ma. Earth Planet. Sci. Lett. 214, 75–91. doi:10.1016/s0012-821x(03)00347-9
Kobayashi, T., and Sasaki, T. (2017). Solubility of Zr(OH)4(am) and the Formation of Zr(IV) Carbonate Complexes in Carbonate Solutions Containing 0.1-5.0 Mol·dm−3 NaNO3. J. Solution Chem. 46, 1741–1759. doi:10.1007/s10953-017-0599-6
Li, G., Wang, Y., Shi, G. R., Liao, W., and Yu, L. (2016). Fluctuations of Redox Conditions across the Permian-Triassic Boundary-New Evidence from the GSSP Section in Meishan of South China. Palaeogeogr. Palaeoclimatol. Palaeoecol. 448, 48–58. doi:10.1016/j.palaeo.2015.09.050
Li, M., Ogg, J., Zhang, Y., Huang, C., Hinnov, L., Chen, Z.-Q., et al. (2016). Astronomical Tuning of the End-Permian Extinction and the Early Triassic Epoch of South China and Germany. Earth Planet. Sci. Lett. 441, 10–25. doi:10.1016/j.epsl.2016.02.017
Li, M., Song, H., Algeo, T. J., Wignall, P. B., Dai, X., and Woods, A. D. (2018). A Dolomitization Event at the Oceanic Chemocline during the Permian-Triassic Transition. Geology 46, 1043–1046. doi:10.1130/G45479.1
Li, R., and Jones, B. (2014). Evaluation of Carbonate Diagenesis: A Comparative Study of Minor Elements, Trace Elements, and Rare-Earth Elements (REE+Y) between Pleistocene Corals and Matrices from Grand Cayman, British West Indies. Sediment. Geology. 314, 31–46. doi:10.1016/j.sedgeo.2014.10.004
Li, R., and Jones, B. (2017). Diagenetic Overprint on Negative δ13C Excursions across the Permian/Triassic Boundary: A Case Study from Meishan Section, China. Palaeogeogr. Palaeoclimatol. Palaeoecol. 468, 18–33. doi:10.1016/j.palaeo.2016.11.044
Liang, H. (2002). End-Permian Catastrophic Event of marine Acidification by Hydrated Sulfuric Acid: Mineralogical Evidence from Meishan Section of South China. Chin. Sci. Bull. 47, 1393–1397. doi:10.1360/02tb9307
Liu, S.-A., Wu, H., Shen, S.-z., Jiang, G., Zhang, S., Lv, Y., et al. (2017). Zinc Isotope Evidence for Intensive Magmatism Immediately before the End-Permian Mass Extinction. Geology 45, 343–346. doi:10.1130/G38644.1
Lyons, T. W., Anbar, A. D., Severmann, S., Scott, C., and Gill, B. C. (2009). Tracking Euxinia in the Ancient Ocean: A Multiproxy Perspective and Proterozoic Case Study. Annu. Rev. Earth Planet. Sci. 37, 507–534. doi:10.1146/annurev.earth.36.031207.124233
Meyer, K. M., and Kump, L. R. (2008). Oceanic Euxinia in Earth History: Causes and Consequences. Annu. Rev. Earth Planet. Sci. 36, 251–288. doi:10.1146/annurev.earth.36.031207.124256
Morse, J. W. (2003). “Formation and Diagenesis of Carbonate Sediments,” in Treatise on Geochemistry. Editor F. T. Mackenzie (Elsevier), Vol. 7, 67–85. doi:10.1016/B0-08-043751-6/07093-6
Nothdurft, L. D., Webb, G. E., and Kamber, B. S. (2004). Rare Earth Element Geochemistry of Late Devonian Reefal Carbonates, Canning Basin, Western Australia: Confirmation of a Seawater REE Proxy in Ancient Limestones. Geochim. Cosmochim. Acta 68, 263–283. doi:10.1016/S0016-7037(03)00422-8
Paradis, S., Hannigan, P., and Dewing, K. (2007). “Mississippi Valley-type lead-zinc Deposits,” in Mineral Deposits of Canada: A Synthesis of Major Deposit-Types, District Metallogeny, the Evolution of Geological Provinces, and Exploration Methods. Editor W. D. Goodfellow (Geological Association of Canada), Vol. 5, 185–203.
Payne, J. L., and Clapham, M. E. (2012). End-Permian Mass Extinction in the Oceans: An Ancient Analog for the Twenty-First century? Annu. Rev. Earth Planet. Sci. 40, 89–111. doi:10.1146/annurev-earth-042711-105329
Rampino, M. R., Baransky, E., and Rodriguez, S. (2020). Proxy Evidence from the Gartnerkofel-1 Core (Carnic Alps, Austria) for Hypoxic Conditions in the Western Tethys during the End-Permian Mass-Extinction Event. Chem. Geol. 533, 119434. doi:10.1016/j.chemgeo.2019.119434
Rampino, M. R., Self, S., and Stothers, R. B. (1988). Volcanic winters. Annu. Rev. Earth Planet. Sci. 16, 73–99. doi:10.1146/annurev.ea.16.050188.000445
Renne, P. R., Black, M. T., Zichao, Z., Richards, M. A., and Basu, A. R. (1995). Synchrony and Causal Relations between Permian-Triassic Boundary Crises and Siberian Flood Volcanism. Science 269, 1413–1416. doi:10.1126/science.269.5229.1413
Riccardi, A. L., Arthur, M. A., and Kump, L. R. (2006). Sulfur Isotopic Evidence for Chemocline Upward Excursions during the End-Permian Mass Extinction. Geochimica et Cosmochimica Acta 70, 5740–5752. doi:10.1016/j.gca.2006.08.005
Rothman, D. H., Fournier, G. P., French, K. L., Alm, E. J., Boyle, E. A., Cao, C., et al. (2014). Methanogenic Burst in the End-Permian Carbon Cycle. Proc. Natl. Acad. Sci. 111, 5462–5467. doi:10.1073/pnas.1318106111
Sanei, H., Grasby, S. E., and Beauchamp, B. (2015). Contaminants in Marine Sedimentary Deposits from Coal Fly Ash during the Latest Permian Extinction. Paleoenviron. Res. 18, 89–99. doi:10.1007/978-94-017-9541-8_5
Saunders, A., and Reichow, M. (2009). The Siberian Traps and the End-Permian Mass Extinction: A Critical Review. Chin. Sci. Bull. 54, 20–37. doi:10.1007/s11434-008-0543-7
Sephton, M. A., Looy, C. V., Brinkhuis, H., Wignall, P. B., de Leeuw, J. W., and Visscher, H. (2005). Catastrophic Soil Erosion during the End-Permian Biotic Crisis. Geol 33, 941–944. doi:10.1130/g21784.1
Shen, J., Algeo, T. J., Zhou, L., Feng, Q., Yu, J., and Ellwood, B. (2012). Volcanic Perturbations of the marine Environment in South China Preceding the Latest Permian Mass Extinction and Their Biotic Effects. Geobiology 10, 82–103. doi:10.1111/j.1472-4669.2011.00306.x
Shen, J., Chen, J., Algeo, T. J., Feng, Q., Yu, J., Xu, Y.-G., et al. (2021). Mercury Fluxes Record Regional Volcanism in the South China Craton Prior to the End-Permian Mass Extinction. Geology 49, 452–456. doi:10.1130/G48501.1
Shen, J., Yu, J., Chen, J., Algeo, T. J., Xu, G., Feng, Q., et al. (2019). Mercury Evidence of Intense Volcanic Effects on Land during the Permian-Triassic Transition. Geology 47, 1117–1121. doi:10.1130/G46679.1
Shen, S.-z., Crowley, J. L., Wang, Y., Bowring, S. A., Erwin, D. H., Sadler, P. M., et al. (2011). Calibrating the End-Permian Mass Extinction. Science 334, 1367–1372. doi:10.1126/science.1213454
Shen, S.-Z., Ramezani, J., Chen, J., Cao, C.-Q., Erwin, D. H., Zhang, H., et al. (2019). A Sudden End-Permian Mass Extinction in South China. Bull. Geol. Soc. Am. 131, 205–223. doi:10.1130/b31909.1
Shen, W., Lin, Y., Xu, L., Li, J., Wu, Y., and Sun, Y. (2007). Pyrite Framboids in the Permian-Triassic Boundary Section at Meishan, China: Evidence for Dysoxic Deposition. Palaeogeogr. Palaeoclimatol. Palaeoecol. 253, 323–331. doi:10.1016/j.palaeo.2007.06.005
Shen, Y., Farquhar, J., Zhang, H., Masterson, A., Zhang, T., and Wing, B. A. (2011). Multiple S-Isotopic Evidence for Episodic Shoaling of Anoxic Water during Late Permian Mass Extinction. Nat. Commun. 2, 210–215. doi:10.1038/ncomms1217
Shields, G., and Stille, P. (2001). Diagenetic Constraints on the Use of Cerium Anomalies as Palaeoseawater Redox Proxies: an Isotopic and REE Study of Cambrian Phosphorites. Chem. Geology. 175, 29–48. doi:10.1016/s0009-2541(00)00362-4
Sial, A. N., Chen, J., Lacerda, L. D., Korte, C., Spangenberg, J. E., Silva-Tamayo, J. C., et al. (2020). Globally Enhanced Hg Deposition and Hg Isotopes in Sections Straddling the Permian-Triassic Boundary: Link to Volcanism. Palaeogeogr. Palaeoclimatol. Palaeoecol. 540, 109537. doi:10.1016/j.palaeo.2019.109537
Smrzka, D., Zwicker, J., Bach, W., Feng, D., Himmler, T., Chen, D., et al. (2019). The Behavior of Trace Elements in Seawater, Sedimentary Pore Water, and Their Incorporation into Carbonate Minerals: a Review. Facies 65, 41. doi:10.1007/s10347-019-0581-4
Song, H., Wignall, P. B., Tong, J., Bond, D. P. G., Song, H., Lai, X., et al. (2012). Geochemical Evidence from Bio-Apatite for Multiple Oceanic Anoxic Events during Permian-Triassic Transition and the Link with End-Permian Extinction and Recovery. Earth Planet. Sci. Lett. 353-354, 12–21. doi:10.1016/j.epsl.2012.07.005
Song, H., Wignall, P. B., Tong, J., Song, H., Chen, J., Chu, D., et al. (2015). Integrated Sr Isotope Variations and Global Environmental Changes through the Late Permian to Early Late Triassic. Earth Planet. Sci. Lett. 424, 140–147. doi:10.1016/j.epsl.2015.05.035
Song, H., Wignall, P. B., Tong, J., and Yin, H. (2013). Two Pulses of Extinction during the Permian-Triassic Crisis. Nat. Geosci 6, 52–56. doi:10.1038/ngeo1649
Sun, H., Xiao, Y., Gao, Y., Zhang, G., Casey, J. F., and Shen, Y. (2018). Rapid Enhancement of Chemical Weathering Recorded by Extremely Light Seawater Lithium Isotopes at the Permian-Triassic Boundary. Proc. Natl. Acad. Sci. USA 115, 3782–3787. doi:10.1073/pnas.1711862115
Sun, Y., Joachimski, M. M., Wignall, P. B., Yan, C., Chen, Y., Jiang, H., et al. (2012). Lethally Hot Temperatures during the Early Triassic Greenhouse. Science 338, 366–370. doi:10.1126/science.1224126
Svensen, H., Planke, S., Polozov, A. G., Schmidbauer, N., Corfu, F., Podladchikov, Y. Y., et al. (2009). Siberian Gas Venting and the End-Permian Environmental Crisis. Earth Planet. Sci. Lett. 277, 490–500. doi:10.1016/j.epsl.2008.11.015
Sverjensky, D. A. (1986). Genesis of Mississippi Valley-type lead-zinc Deposits. Annu. Rev. Earth Planet. Sci. 14, 177–199. doi:10.1146/annurev.ea.14.050186.001141
Takahashi, S., Yamasaki, S.-i., Ogawa, Y., Kimura, K., Kaiho, K., Yoshida, T., et al. (2014). Bioessential Element-Depleted Ocean Following the Euxinic Maximum of the End-Permian Mass Extinction. Earth Planet. Sci. Lett. 393, 94–104. doi:10.1016/j.epsl.2014.02.041
Taylor, S. R., and McLennan, S. M. (1985). The Continental Crust: Its Composition and Evolution. Oxford, UK: Blackwell Scientific Publications.
Tribovillard, N., Algeo, T. J., Lyons, T., and Riboulleau, A. (2006). Trace Metals as Paleoredox and Paleoproductivity Proxies: An Update. Chem. Geol. 232, 12–32. doi:10.1016/j.chemgeo.2006.02.012
Wang, J., Jacobson, A. D., Zhang, H., Ramezani, J., Sageman, B. B., Hurtgen, M. T., et al. (2019). Coupled δ44/40Ca, δ88/86Sr, and 87Sr/86Sr Geochemistry across the End-Permian Mass Extinction Event. Geochim. Cosmochim. Acta 262, 143–165. doi:10.1016/j.gca.2019.07.035
Wang, X., Cawood, P. A., Zhao, H., Zhao, L., Grasby, S. E., Chen, Z.-Q., et al. (2018). Mercury Anomalies across the End Permian Mass Extinction in South China from Shallow and Deep Water Depositional Environments. Earth Planet. Sci. Lett. 496, 159–167. doi:10.1016/j.epsl.2018.05.044
Wei, H. Y., Shen, J., Schoepfer, S. D., Krystyn, L., Richoz, S., and Algeo, T. J. (2015). Environmental Controls on marine Ecosystem Recovery Following Mass Extinctions, with an Example from the Early Triassic. Earth Sci. Rev. 149, 104–131. doi:10.1016/j.earscirev.2014.10.007
Wei, H., Zhang, X., and Qiu, Z. (2020). Millennial-scale Ocean Redox and δ13C Changes across the Permian-Triassic Transition at Meishan and Implications for the Biocrisis. Int. J. Earth Sci. (Geol Rundsch) 109, 1753–1766. doi:10.1007/s00531-020-01869-x
Wignall, P. B., and Twitchett, R. J. (1996). Oceanic Anoxia and the End Permian Mass Extinction. Science 272, 1155–1158. doi:10.1126/science.272.5265.1155
Winnick, M. J., and Maher, K. (2018). Relationships between CO2, Thermodynamic Limits on Silicate Weathering, and the Strength of the Silicate Weathering Feedback. Earth Planet. Sci. Lett. 485, 111–120. doi:10.1016/j.epsl.2018.01.005
Wu, H., Zhang, S., Hinnov, L. A., Jiang, G., Feng, Q., Li, H., et al. (2013). Time-calibrated Milankovitch Cycles for the Late Permian. Nat. Commun. 4, 2452. doi:10.1038/ncomms3452
Xiang, L., Schoepfer, S. D., Zhang, H., Yuan, D.-x., Cao, C.-q., Zheng, Q.-f., et al. (2016). Oceanic Redox Evolution across the End-Permian Mass Extinction at Shangsi, South China. Palaeogeogr. Palaeoclimatol. Palaeoecol. 448, 59–71. doi:10.1016/j.palaeo.2015.10.046
Xiang, L., Zhang, H., Schoepfer, S. D., Cao, C.-q., Zheng, Q.-f., Yuan, D.-x., et al. (2020). Oceanic Redox Evolution Around the End-Permian Mass Extinction at Meishan, South China. Palaeogeogr. Palaeoclimatol. Palaeoecol. 544, 109626. doi:10.1016/j.palaeo.2020.109626
Xie, S., Pancost, R. D., Huang, J., Wignall, P. B., Yu, J., Tang, X., et al. (2007). Changes in the Global Carbon Cycle Occurred as Two Episodes during the Permian-Triassic Crisis. Geol 35, 1083–1086. doi:10.1130/G24224A.1
Xu, L., and Lin, Y. (2014). Analysis of Platinum-Group Elements in Drill Core Samples from the Meishan Permian-Triassic Boundary Section, China. Chin. J. Geochem. 33, 365–373. doi:10.1007/s11631-014-0699-6
Xu, L., Lin, Y., Shen, W., Qi, L., Xie, L., and Ouyang, Z. (2007). Platinum-group Elements of the Meishan Permian-Triassic Boundary Section: Evidence for Flood Basaltic Volcanism. Chem. Geol. 246, 55–64. doi:10.1016/j.chemgeo.2007.08.013
Yin, H., Xie, S., Luo, G., Algeo, T. J., and Zhang, K. (2012). Two Episodes of Environmental Change at the Permian-Triassic Boundary of the GSSP Section Meishan. Earth-Science Rev. 115, 163–172. doi:10.1016/j.earscirev.2012.08.006
Yin, H., Zhang, K., Tong, J., Yang, Z., and Wu, S. (2001). The Global Stratotype Section and Point (GSSP) of the Permian-Triassic Boundary. Episodes 24, 102–114. doi:10.18814/epiiugs/2001/v24i2/004
Yuan, D.-x., Shen, S.-z., Henderson, C. M., Chen, J., Zhang, H., and Feng, H.-z. (2014). Revised Conodont-Based Integrated High-Resolution Timescale for the Changhsingian Stage and End-Permian Extinction Interval at the Meishan Sections, South China. Lithos 204, 220–245. doi:10.1016/j.lithos.2014.03.026
Zhang, F. F., Lenton, T. M., del Rey, A., Romaniello, S. J., Chen, X. M., Planavsky, N. J., et al. (2020). Uranium Isotopes in marine Carbonates as a Global Ocean Paleoredox Proxy: A Critical Review. Geochim. Cosmochim. Acta. doi:10.1016/j.gca.2020.05.011
Zhang, F. F., Romaniello, S. J., Algeo, T. J., Lau, K. V., Clapham, M. E., Richoz, S., et al. (2018). Multiple Episodes of Extensive marine Anoxia Linked to Global Warming and continental Weathering Following the Latest Permian Mass Extinction. Sci. Adv. 4, e1602921. doi:10.1126/sciadv.1602921
Zhang, H., Cao, C. Q., Liu, X. L., Mu, L., Zheng, Q. F., Liu, F., et al. (2015). The Terrestrial End-Permian Mass Extinction in South China. Palaeogeogr. Palaeoclimatol. Palaeoecol. 448, 108–124. doi:10.1016/j.palaeo.2015.07.002
Zhao, L., Chen, Z.-Q., Algeo, T. J., Chen, J., Chen, Y., Tong, J., et al. (2013). Rare-earth Element Patterns in Conodont Albid Crowns: Evidence for Massive Inputs of Volcanic Ash during the Latest Permian Biocrisis? Glob. Planet. Change 105, 135–151. doi:10.1016/j.gloplacha.2012.09.001
Zheng, Q., Cao, C., and Zhang, M. (2013). Sedimentary Features of the Permian-Triassic Boundary Sequence of the Meishan Section in Changxing County, Zhejiang Province. Sci. China Earth Sci. 56, 956–969. doi:10.1007/s11430-013-4602-9
Keywords: Meishan, Permian-Triassic boundary, rare earth elements, diagenesis, major and trace elements
Citation: Dudás FÖ, Zhang H, Shen S-Z and Bowring SA (2021) Major and Trace Element Geochemistry of the Permian-Triassic Boundary Section at Meishan, South China. Front. Earth Sci. 9:637102. doi: 10.3389/feart.2021.637102
Received: 08 December 2020; Accepted: 28 June 2021;
Published: 20 July 2021.
Edited by:
Hajime Naruse, Kyoto University, JapanReviewed by:
Haijun Song, China University of Geosciences Wuhan, ChinaRyosuke Saito, The University of Tokyo, Japan
Copyright © 2021 Dudás, Zhang, Shen and Bowring. This is an open-access article distributed under the terms of the Creative Commons Attribution License (CC BY). The use, distribution or reproduction in other forums is permitted, provided the original author(s) and the copyright owner(s) are credited and that the original publication in this journal is cited, in accordance with accepted academic practice. No use, distribution or reproduction is permitted which does not comply with these terms.
*Correspondence: Francis Ö. Dudás, ZmR1ZGFzQG1pdC5lZHU=
†Deceased