 Songhe Yu
 Zhaoyun Zong
 Xingyao Yin1,2
94% of researchers rate our articles as excellent or good
Learn more about the work of our research integrity team to safeguard the quality of each article we publish.
Find out more
ORIGINAL RESEARCH article
Front. Earth Sci., 22 April 2021
Sec. Solid Earth Geophysics
Volume 9 - 2021 | https://doi.org/10.3389/feart.2021.633930
This article is part of the Research TopicRock Physics and Geofluid DetectionView all 27 articles
Rock physical model and amplitude variation with offset (AVO) patterns considering the content of organic matter and the composition of minerals have a wider significance for guiding the identification and prediction of the mud-rich source rock. A rock physical model is proposed for describing the elastic properties of kerogen in different maturity stages. The proposed rock physical model builds an intrinsic connection between the elastic properties and physical parameters of the mud-rich source rock, thereby providing a theoretical basis for a seismic inversion and a seismic forward modeling. To overcome the limitations of laboratory measurement, a combination-four-parameter regression (CFPR) method is further proposed to estimate the continuous total organic carbon (TOC) values for the verification and analysis of the rock physical model. The modeling results reveal that the P-wave velocity and P-wave impedance will decrease with an increase in TOC, and the Poisson ratio and Poisson impedance will increase as the mud content increases, which are consistent with the conclusions of the cross plot using the actual well data. Based on the proposed rock physical model, the seismic responses of the mud-rich source rock are further modeled. The synthetic seismic records are consistent with the well-side seismic records, the top reflection of the mud-rich source rock behaves as a stronger negative event dimming with an incident angle corresponding to a class IV AVO pattern, and the bottom reflection exhibits a class I AVO anomaly. In addition, a two-layer model is constructed to analyze an effect of the TOC content and mud content on the AVO characteristics. The results indicate that increasing the TOC content and mud content will significantly increase the interceptions and slightly change the gradients of the P-P reflection coefficients. These results help to guide the identification and evaluation of the mud-rich source rock.
Given the importance of the spatial distribution of source rocks and the abundance of organic matter in source rocks on the prospect of petroleum plays, a plenty of methods are discussed to predict and determine source rocks by using the seismic data in the literature. Løseth et al. (2011) described and explained the seismic section characteristics of source rocks based on the relationship between the total organic carbon (TOC) content and acoustic impedance, and the spatial distribution of source rocks could be identified by the seismic data only. Carcione (2001) analyzed the amplitude variation with offset (AVO) effects caused by kerogen in source rocks, and verified the ability and applicability of determining the TOC content in the source rock layers by using an AVO technique. del Monte et al. (2018) compared the conventional methods including seismic impedance inversion, AVO technique, and seismic attribute analysis for detecting source rocks. From this study, seismic inversion could predict a lateral variation of source rocks, and the AVO response of source rocks was a strong class IV anomaly. In particular, the AVO and seismic attribute analysis did not need the well-information, and could be used to investigate source rocks in undrilled basins. Kiswaka and Felix (2020) utilized a combination analysis of amplitude versus angle/offset (AVA)/AVO to determine the distribution of the organic carbon-rich deposits in the deeper basin areas, and the AVO class IV elements could be as an indicator of an organic carbon-rich layer. Besides, those methods were also well-discussed in the literature to guide the identification and evaluation of source rocks (Ogiesoba and Hammes, 2014; Badics et al., 2015; Ding et al., 2015; Lee et al., 2020). Therefore, revealing and characterizing the interaction between the seismic responses and the rock physical properties of source rocks is critical.
The rock physical model sets a fundamental basis for analyzing the elastic properties and seismic attributes caused by kerogen of source rocks and shales. Organic-rich shales behave as a transversely isotropic material due to a specific distribution of organic matter in the rock (Vernik and Nur, 1992). Vernik and Landis (1996) and Vernik and Liu (1997) described the velocity anisotropy due to kerogen of source rocks and shales using the Backus averaging method (Backus, 1962). The seismic-velocity attenuation caused by the conversion of kerogen to oil was interpreted by Carcione (2000, 2001) using the Backus averaging and Kuster–Toksöz model, and the AVO effects of source rocks were further analyzed. Carcione et al. (2011) and Carcione and Avseth (2015) further characterized the effects of the kerogen content on the seismic velocity by the Backus averaging and the Krief/Gassmann models. The elastic anisotropy and AVO responses caused by kerogen of the organic shales were also described by Sayers (2013a,b) based on the developed rock physical model. However, it is still challenging to investigate the elastic properties and AVO responses of the mud-rich source rock, especially the effects of the TOC content and mud content. Therefore, an appropriate rock physical model of the mud-rich source rock is developed, and its AVO characteristics are analyzed in this study.
Generally, the mud-rich source rock is mainly formed in deep water and stable water, and consists of clay minerals, quartz particles, and organic matter (Pichevin et al., 2004; Jiang and Zha, 2005; Aplin and Macquaker, 2011; Ma et al., 2016), and it does not display the same strong anisotropy as shales. Therefore, we simplify the mud-rich source rock as a homogeneous and an isotropic rock. The elastic characteristics of the mud-rich source rock are not only sensitive to the kerogen content and mineral compositions, but also depending on the maturity of kerogen (Avseth and Carcione, 2015; Carcione and Avseth, 2015; Zhao L. et al., 2016). The effects of the maturity on the elastic properties of source rocks and shales were also well-investigated (Guo et al., 2013; Zargari et al., 2013; Zhao L. et al., 2016; Hansen et al., 2019). In particular, Zhao L. et al. (2016) summarized that kerogen played a load-bearing role in the immature and mature stages, and the overmatured kerogen could be treated as a filling inclusion instead of the load-bearing matrix. To highlight the effects of the kerogen content and to weaken the impact of the thermal maturity, we use the self-consistent approximate (SCA) theory (Berryman, 1980, 1995) to handle the effects of kerogen in the immature and mature stages, and utilize the solid substitution equation (Ciz and Shapiro, 2007) to model the overmatured kerogen based on the assumptions of Zhao L. et al. (2016).
While verifying the accuracy and validity of the proposed rock physical model, well logs can be used in the absence of the laboratory data, which can provide more abundant and continuous rock stratum information under real geological conditions than the laboratory data (Xu and White, 1995; Xu et al., 2020; Yin et al., 2020). Moreover, the TOC logs are also required in the application and analysis of actual well logs. However, the accurate TOC values measured through laboratory geochemical analyses are almost discontinuous and insufficient because of the limitations of experimental samples (Fertl and Chilingar, 1988; Khoshnoodkia et al., 2011; Kenomore et al., 2017; Zhao et al., 2017). Therefore, many researchers estimated the TOC content curves using conventional well logs, including the formation-density logs, gamma-ray logs, sonic logs, and resistivity logs (Schmoker, 1979, 1981; Fertl and Chilingar, 1988; Zhao et al., 2016; Alshakhs and Rezaee, 2017). The common methods for calculating the continuous TOC curves involve traditional linear fit methods (Schmoker, 1981; Schmoker and Hester, 1983; Fertl and Chilingar, 1988), the Δ log R model and its modifications (Passey et al., 1990; Kenomore et al., 2017; Rahmani et al., 2019), multiparameter regression and multivariate statistical methods (Mendelzon and Toksoz, 1985; Zhu and Jin, 2003; Tan et al., 2015), and artificial neural network methods (Khoshnoodkia et al., 2011; Tan et al., 2015; Shi et al., 2016; Mahmoud et al., 2017, 2020).
In the case of the mud-rich source rock, the thermal maturation is mainly immature or mature. The background values of the TOC content are close to zero. The rock formation is normally compacted, and most of the non-source rocks are sandstones or igneous rocks (Cui et al., 2019). Therefore, the Δ log R model is suitable to predict the continuous TOC curves in the mud-rich source rock (Passey et al., 1990; Cui et al., 2019). To eliminate the uncertainty of the artificially selected baselines and avoid the difficulties caused by the unknown maturity in using the Δ logR model, Zhu and Jin (2003) proposed a three-parameter regression method by considering a strong relation between organic matter and bulk density. On the basis of the kerogen characteristics, including a high-gamma value, high-sonic transit time, high resistivity, and low density, we also propose a combination-four-parameter regression (CFPR) method to improve the accuracy of the TOC estimation in the mud-rich source rock based on the Δ logR model and Zhu's revision (Fertl and Rieke, 1980; Fertl and Chilingar, 1988; Khoshnoodkia et al., 2011).
In this study, to interpret how the rock physical parameters change the elastic properties and thereby affecting the seismic responses of the mud-rich source rock, a rock physical model is initially presented in detail, and kerogen of different maturity stages is modeled. Furthermore, a CFPR method is further introduced and used to estimate the TOC curves. In addition, the elastic responses of the TOC content and mud content are illustrated by using a numerical modeling and the crossplot of the actual well data. Based on the proposed rock physical model, the seismic responses and AVO patterns of the mud-rich source rock are introduced. The synthetic seismic records are compared with the well-side seismic records to verify the validity and reliability of a forward modeling process. Besides, a two-layer model is constructed to further analyze the effects of the TOC content and mud content on the AVO responses of the mud-rich source rock. Finally, we end with discussions and conclusions.
Different from the published methods for a rock physics modeling (Vernik and Landis, 1996; Vernik and Liu, 1997; Carcione, 2000; Vernik and Milovac, 2011; Sayers, 2013a,b; Carcione and Avseth, 2015; Zhao L. et al., 2016; Ba et al., 2017; Tan et al., 2020; Pang et al., 2021), a rock physical model is proposed in this study by focusing on the effects of the kerogen content and kerogen maturity of the mud-rich source rock. The main processes and modeling methods used in the rock physical model are illustrated in Figure 1.
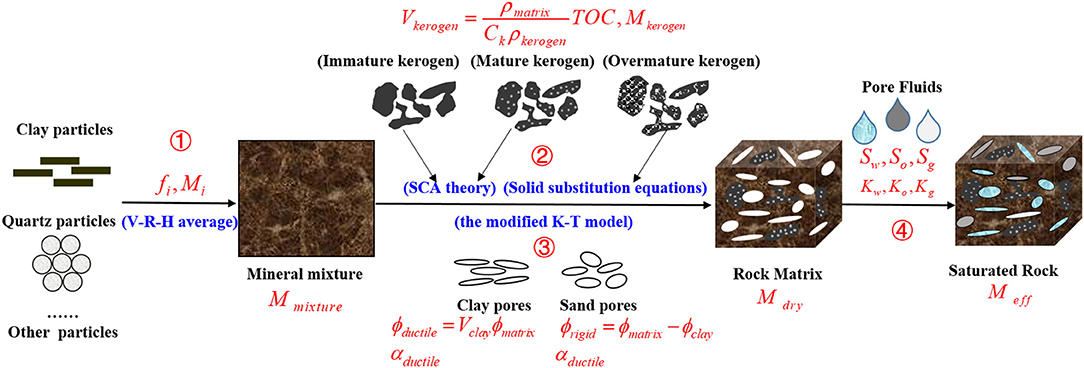
Figure 1. Schematic diagram of rock physical modeling in the mud-rich source rock.
First, the Voigt-Reuss-Hill average is used to estimate the effective moduli of a mineral mixture, which is assumed to be a homogeneous and an isotropic medium consisting of clay particles, quartz particles, and other solid grains. The elastic moduli of the mineral mixture are (Hill, 1952; Mavko et al., 2009),
where Mmixture represents the equivalent modulus of a mineral mixture, including Kmixture and μmixture. Mi and fi are the elastic moduli and volume fractions of the ith component, respectively. N is the sum of total types of solid mineral components.
It is clearly known that the thermal maturation of kerogen strongly affects the effective elastic properties of the mud-rich source rock (Modica and Lapierre, 2012; Guo et al., 2013; Zargari et al., 2013; Zhao L. et al., 2016). Figure 1 displays that the immature and mature kerogen appear as solid inclusions and play a load-bearing role. During the thermal maturation, the mature kerogen decomposes into hydrocarbon, and organic pores are gradually formed in solid kerogen. Overmatured kerogen and generated hydrocarbons constitute a solid–liquid mixture, which is regarded as filling inclusions instead of the load-bearing matrix. Considering different elastic properties and occurrence forms of kerogen, the appropriate effective medium theories are used in different maturity stages. More specifically, the effects of kerogen are described by using the SCA theory in the immature and mature stages, and the elastic moduli of the rock matrix are (Berryman, 1980, 1995),
where Kmixture and μmixture are the equivalent bulk and shear moduli of mineral mixtures, respectively. Ki and μi are the bulk and shear moduli of the ith material, respectively. fi is the volume fraction of the ith inclusion component. N is the sum of total types of solid mineral components. The factors β*i and ξ*i represent the geometry parameters and are the functions of the aspect ratios and the equivalent moduli of inclusions and background medium (Berryman, 1995; Mavko et al., 2009).
The solid substitution equations are then used to model the effect of overmatured kerogen, the equations for the isotropic case are (Ciz and Shapiro, 2007),
where and represent the bulk and shear moduli of the rock saturated with an inclusion-filling material, respectively. Kdry and μdry are the bulk and shear moduli of the inorganic matrix, respectively. Kgr and μgr denote the bulk and shear moduli of a solid grain material of matrix frame, respectively. Kϕ and μϕ are the bulk and shear moduli of the inclusion pore space, respectively. Kin and μin are the bulk and shear moduli of the pores filled by a mixed material of hydrocarbons and kerogen, respectively.
The effective elastic properties of clay-sand rocks are calculated by Xu and White (1995), which assumed that the matrix pores involved clay pores and sand pores. For the mud-rich source rock, the matrix pores also can be divided into ductile pores (related to the clay minerals) and rigid pores (related to the sand minerals) by referring to the Xu–White model (Xu and White, 1995),
where Vclay is the volume fraction of the clay mineral normalized by the total volume fraction of an inorganic matrix.
Assuming the Poisson's ratio of the dry rock skeleton as constant, Keys and Xu (2002) simplified the dry rock approximation based on the Kuster–Toksöz and differential effective medium (DEM) theories used in the Xu–White model, and derived two direct and efficient formulations to calculate the elastic moduli of a dry rock skeleton,
where Kdry and μdry are the bulk and shear moduli of a dry rock skeleton, respectively. Km and μm are the matrix bulk and shear moduli, respectively. p and q are the geometric factors depending on the shapes of the pore inclusions. ϕ is the rock porosity.
In view of that the pore-filling materials depend on the kerogen type and maturity (Tissot et al., 1974, 1987; Espitalié et al., 1977), the effective moduli of the saturated rock are (Gassmann, 1951; Mavko et al., 2009),
where α = 1 − Kd/Km, Ks,Kd, Kf, and Km are the bulk moduli of the saturated rock, dry rock frame, pore-filling material, and rock matrix, respectively. μs andμd are the shear moduli of the saturated rock and dry rock frame, respectively.
Continuous TOC content curves are necessary for the verification and application of the proposed rock physical model, especially for the analysis of actual well logs. The TOC value is an important factor (weight percent) for evaluating the abundance of organic matter in source rocks and can be transformed to the kerogen volumetric content (Vernik and Nur, 1992; Vernik and Landis, 1996; Carcione, 2000; Vernik and Milovac, 2011; Carcione and Avseth, 2015; Vernik, 2016),
where ρmatrix and ρkerogen are the density of the dry rock matrix and solid kerogen, respectively. Ck is the carbon concentration of the solid organic matter and depends on the kerogen maturity ranging from 0.7 to 0.85 (Vernik and Milovac, 2011; Carcione and Avseth, 2015; Vernik, 2016).
The accurate TOC values measured by using a rock pyrolysis analysis (Rock-Eval) are almost discontinuous and insufficient (Fertl and Chilingar, 1988; Khoshnoodkia et al., 2011; Kenomore et al., 2017; Zhao et al., 2017). Therefore, it is of great significance and demand to estimate the continuous curves of the TOC content using the common well logs. The Δ log R method proposed by Passey et al. (1990) is one of the most common methods to determine the continuous TOC curves. The TOC value is calculated by using the Δ log R method by a logarithmic separation between the sonic and resistivity values and depending on the maturity (Passey et al., 2010),
where Rt is the resistivity log value (ohm). Δt is the sonic log value (μs/ft). R0 and Δt0 are the baseline value of the resistivity logs and sonic logs coincided in a non-source rock, respectively. LOM represents the level of organic maturity, such as vitrinite reflectance, R0.
However, there are many uncertainties and difficulties caused by artificially selecting baselines and lacking of the maturity formation in using the Δ log R method. To avoid the shortcomings of the Δ log R method, Zhu and Jin (2003) proposed a three-parameter regression method by modifying the Δ log R model and considering a strong correlation of organic matter and bulk density. The modified TOC calculation equation is,
where a, b, and c are the coefficients to be estimated by the regression analysis using the measured TOC values and well logs.
By modifying the Δ log R model and Zhu's revision, a CFPR method is further proposed based on the characteristics of organic matter, which involve a high-gamma value, high-sonic transit time, high resistivity, and low density (Fertl and Rieke, 1980; Fertl and Chilingar, 1988; Khoshnoodkia et al., 2011), the estimating equation of TOC value is,
where GR is the gamma-ray value (API) of the source rock. ρ is the rock density value ing/cm3. a, b, c, d, and e are the coefficients to be determined by the multiple regression analysis.
The same four parameters (Rt, Δt, GR, and ρ) can also be used to linearly calculate the TOC curves (Fertl and Chilingar, 1988; Alshakhs and Rezaee, 2017), defined as a simple-four-parameter regression (SFPR) method, the calculation equation is
Different from the SFPR method, the CFPR method utilizes the four combination parameters, which are logRt/ρ, Δt/ρ, GR/ρ, and 1/ρ, to predict the TOC values. Because organic matter exhibits a high-gamma value, a high-sonic transit time, high resistivity, and low-density characteristics, the combination parameters logRt/ρ, Δt/ρ, and GR/ρ have stronger positive correlations and are more sensitive to the TOC values than the simple parameters Rt, Δt, GR, and ρ. In addition, the combination parameter logRt/ρ can also avoid the large-scale changes of Rt logs.
The Δ log R method, the Zhu's method, the SFPR method, and the CFPR method are utilized for the actual well L1 including 47 measured TOC samples from the Zhu I depression in the South of China, and the results are illustrated in Figure 2. The estimated TOC values from the SFPR and CFPR methods are more accurate and reasonable than those from the Δ log R method and Zhu's method. Because the TOC curves calculated by four parameters can bring more wiggles and have higher matching rates than those of two or three used parameters. The fitting goodness (denoted as R2) of the CFPR method is 89.5%, which is 23.2% higher than that of the SFPR method, 35.2% higher than that of Zhu's method, and 102.6% higher than that of the Δ log R method. Moreover, the root mean square error (RMSE) of the estimated results using the CFPR method is 20.24%, which is 38.0% less than that of the SFPR method, 44.3% less than that of Zhu's method, and 56.6% less than that of the Δ log R method. The satisfactory R2 and RMSE indicate that the CFPR method can reliably and accurately predict the TOC content curves of the mud-rich source rock.
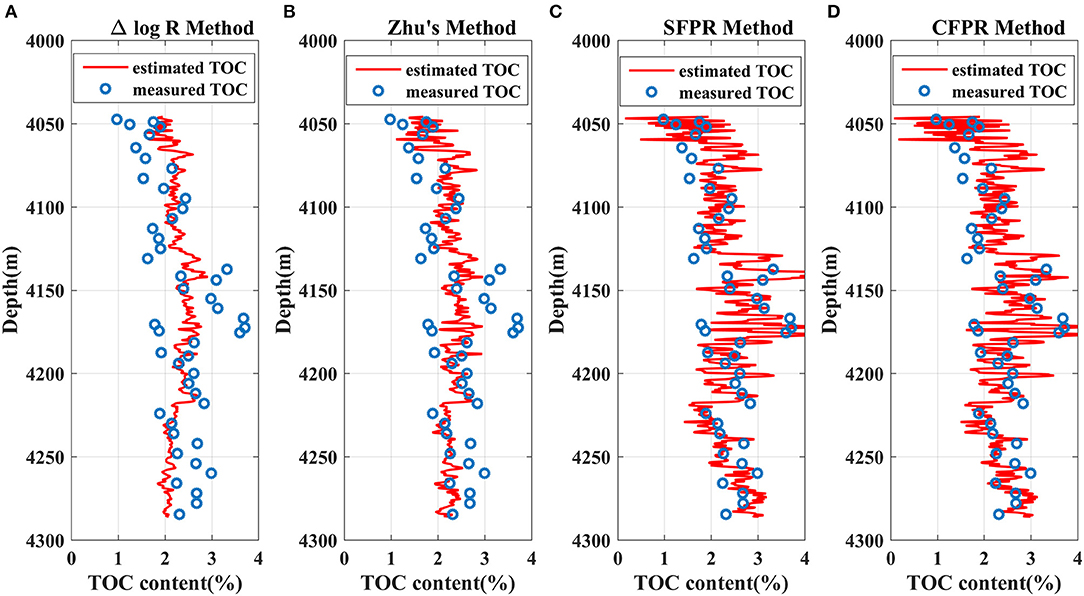
Figure 2. A comparison of estimated TOC using different methods of the mud-rich source rock. (A) The Δ method, (B) the Zhu's method, (C) the SFPR method, (D) the CFPR method. The red lines represent estimated TOC values, and the blue scatters represent measured TOC values.
Figure 3 displays the regression residual analysis of the CFPR method. The residuals are mainly distributed in the interval [-0.3, 0.3], and the residual distribution is consistent with the normal distribution, which also verifies the effectivity and reliability of the CFPR method.
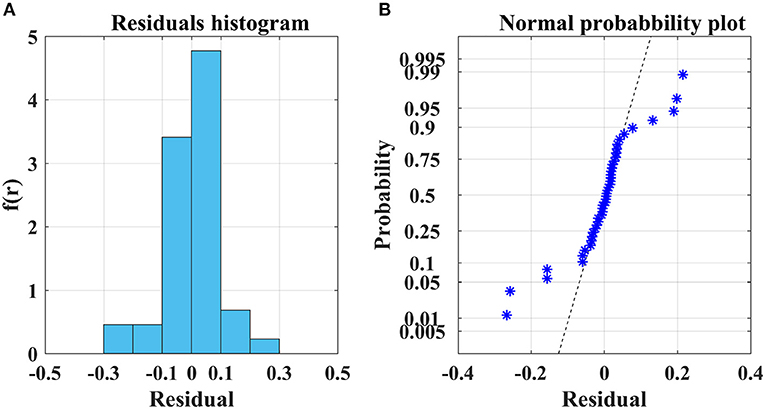
Figure 3. Residuals analysis of estimated TOC from the CFPR method. (A) Residuals distribution histogram, (B) Residuals probability graph.
Compared with the laboratory data, well logs can provide a large amount of continuous rock formation information taken under real geological conditions and can also be used to verify the validity and applicability of the proposed rock physical model in the absence of the laboratory data (Xu and White, 1995; Xu et al., 2020; Yin et al., 2020). Figure 4 illustrates that the actual well L2 is used to verify the proposed rock physical model of the mud-rich source rock. The P-wave velocity and S-wave velocity estimated by using the proposed rock physical model are consistent with the measured well log values, and the fitting goodness of the calculated S-wave velocity is 90.08%. Figure 5 displays the errors of the calculated P-wave velocity and S-wave velocity. The relative errors of S-wave velocity are <10% and demonstrate a normal distribution, which demonstrates that the proposed rock physical model can reliably and effectively characterize the elastic properties of the mud-rich source rock.
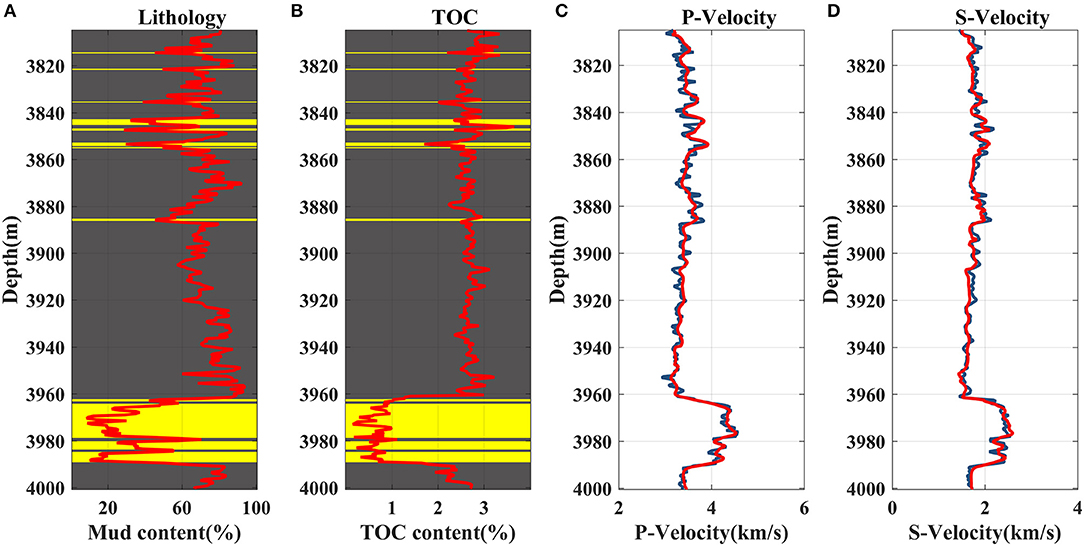
Figure 4. The comparison of the estimated (in red) and the actual (in blue) P-wave and S-wave velocity of the actual well L2. (A) Lithology information (the mud-rich source rock in gray and sandstones in yellow) and mud content, (B) Lithology information and TOC content, (C) P-wave velocity, (D) S-wave velocity.
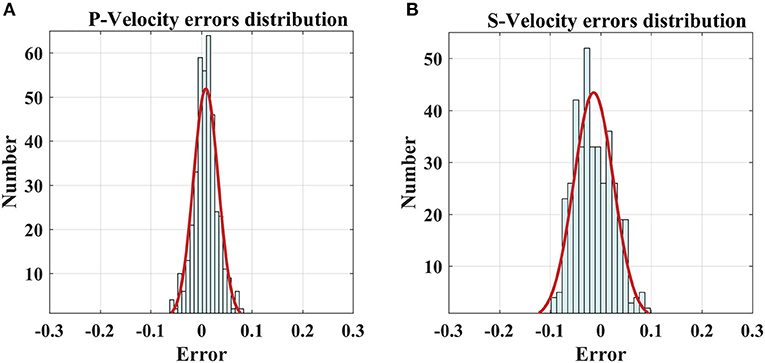
Figure 5. Errors between the estimated P-wave/S-wave velocity and measured values. (A) The errors distribution of P-wave velocity, (B) the errors distribution of S-wave velocity.
Clay minerals and kerogen are the most abundant compositions in the mud-rich source rock. The rock will become ductile due to the clay minerals, and the compressional elasticity and density of rock will decrease by the existence of kerogen. Therefore, the TOC content and mud content can be regarded as two dominant factors of affecting the elastic responses of the mud-rich source rock. Using the proposed rock physical model, the elastic responses of the mud content and TOC content are quantified and illustrated in Figures 6, 7. For simplicity, the mud-rich source rock is considered to be composed of kerogen, clay, and quartz. The aspect ratios of ductile pores and rigid pores are supposed to be 0.015 and 0.22, respectively. The matrix pores are filled by water.
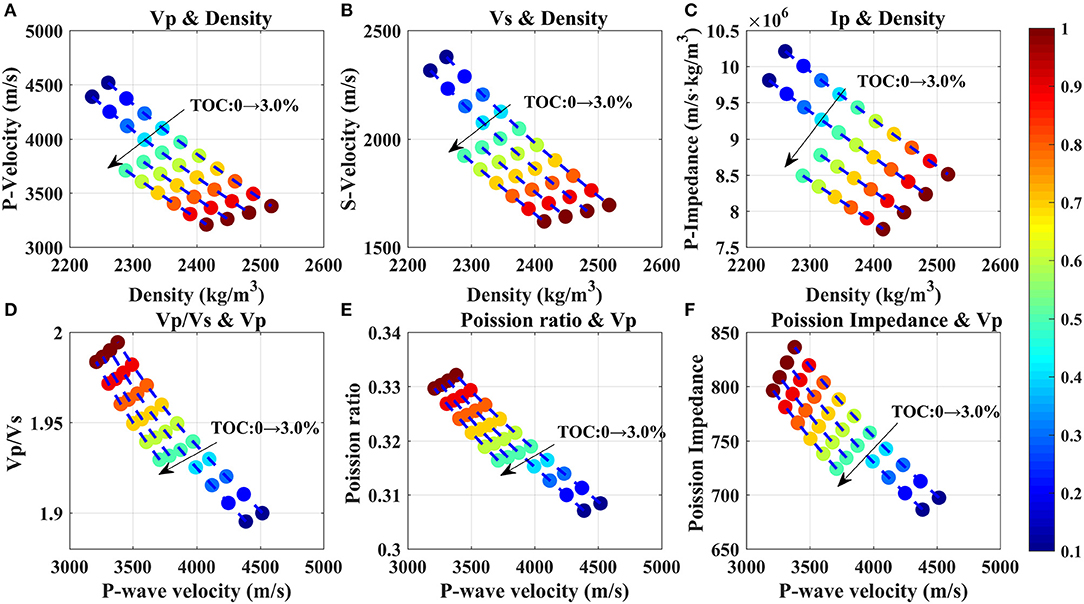
Figure 6. Crossplot of elastic parameters versus mud content at different TOC values based on the rock physical model of the mud-rich source rock. (A) Vp and ρ, (B) Vs and ρ, (C) Ip and ρ, (D) Vp/Vs and Vp, (E) Poisson's ratio and Vp, (F) Poisson impedance and Vp. The color bar on the right represents the mud content.
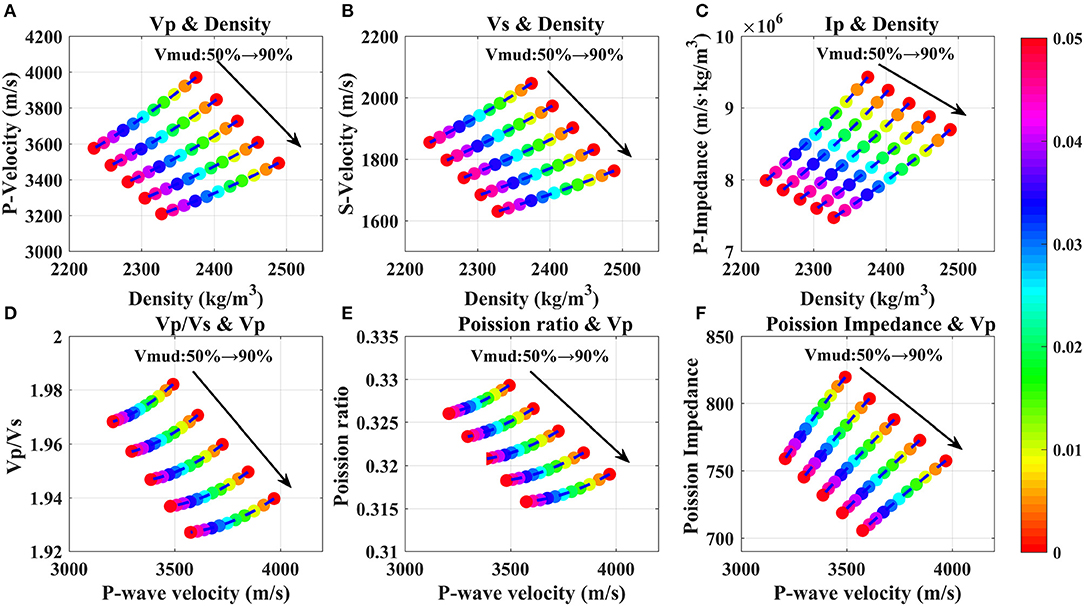
Figure 7. Crossplot of elastic parameters versus TOC content at different mud content based on the rock physical model of the mud-rich source rock. (A) Vp and ρ, (B) Vs and ρ, (C) Ip and ρ, (D) Vp/Vs and Vp, (E) Poisson's ratio and Vp, (F) Poisson impedance and Vp. The color bar on the right represents the TOC content.
Figure 6 indicates that the P-wave velocity (Vp), S-wave velocity (VS), and P-wave impedance (Ip) decrease with an increase of the mud content, and the density, the ratio of P-wave velocity and S-wave velocity (Vp/Vs), Poisson's ratio, and Poisson impedance increase as the mud content increases. As the mud content grows from 10 to 100%, the relative decrements of Vp are 25.2 and 23.0% when TOC is set to 0 and 3.0%, respectively. And the same relative decrements of VS are 28.7 and 26.6%, and of Ip are 16.7 and 15.0%, respectively. The decrement magnitude of Ip is lower than that of Vp or VS because of the high bulk density of clay minerals. Moreover, a varying TOC content will slightly change the decrement magnitudes of the elastic parameters.
Figures 6D–F prove that Vp/Vs, Poisson's ratio and Poisson impedance all have positive correlations with the mud content. As the mud content grows from 10 to 100%, the relative increments of Vp/Vs are 5.0 and 4.9% when TOC is set to 0 and 3.0%, respectively. The same relative increments of Poisson's ratio are 7.7 and 26.6%, and of Poisson impedance are 19.9 and 19.1% when TOC is set to 0 and 3.0%, respectively. The decrement magnitude of the Poisson impedance is higher than those of Vp/Vs and Poisson ratio because the bulk density increases with the mud content. In conclusion, increasing the mud content will make Vp, VS, and Ip to decrease, and cause Vp/Vs, Poisson ratio, and Poisson impedance to increase in the mud-rich source rock.
In Figure 7, all elastic parameters decrease with increasing the TOC content. From no organic matter up to 5.0% TOC content, the relative decrements of Vp are 10.0 and 8.1% when the mud content is 50 and 90%, respectively. And the same relative decrements of VS are 9.3 and 7.5%, respectively, and they are equivalent to the relative decrements of Vp. The same relative decrements of Ip are 15.3 and 14.1%, respectively, which are larger than those of Vp and Vs. However, the change magnitudes of Vp/Vs and Poisson's ratio caused by the TOC content are lower than 1.0%, which demonstrates that TOC will slightly affect Vp/Vs and Poisson's ratio. In summary, Vp, VS, and Ip of the mud-rich source rock will significantly decrease with an increase of the TOC content, and in particular, Ipis more sensitive to the TOC content because of the low elastic moduli and density of kerogen.
Figures 8, 9 display that the real data of the actual wells from the Zhu I depression in the South of China are utilized to verify the relation between the elastic parameters and the TOC content and mud content simulated by the proposed rock physical model. Figure 8 illustrates that the crossplot of the elastic parameters for the mud content, the combinations of elastic parameters including Vp/Vs with Vp, Poisson's ratio with Vp, and Poisson impedance with Vp, can well-distinguish the mud content. The indicating abilities of Vp/Vs, Poisson's ratio, and Poisson impedance for the mud content are equivalent. More specifically, the mud content is in positive correlation with Vp/Vs, Poisson's ratio, and Poisson impedance, and negatively related to Vp. Figure 9 indicates that the combinations involving Vp with density, Vs with density, and Ipwith density have better indicating abilities to the TOC content, and Vp, Vs, and Ip exhibit significantly low values at high TOC content.
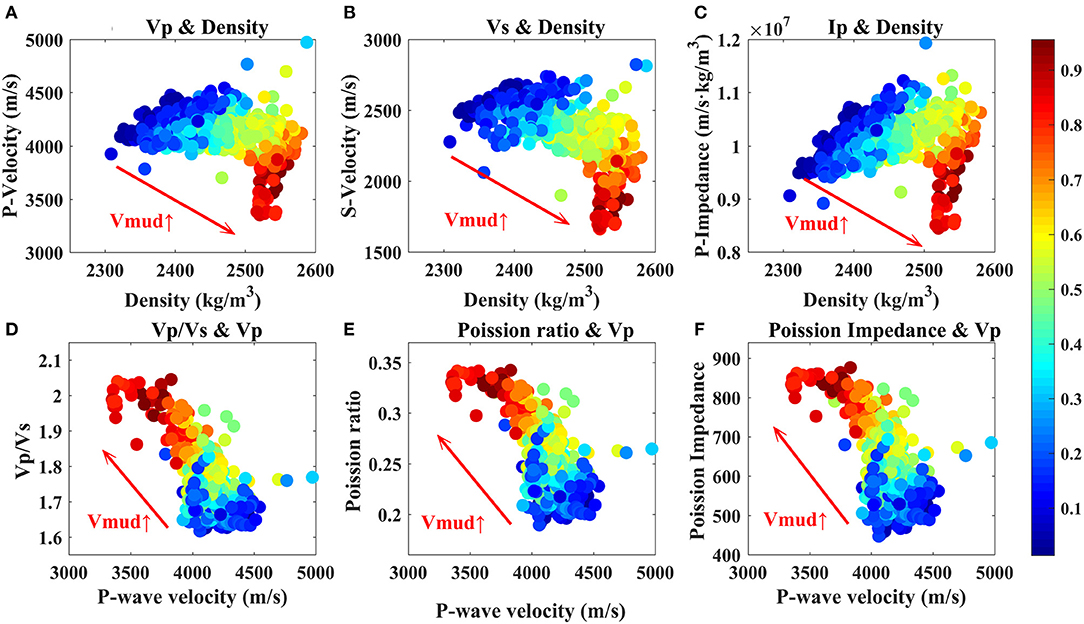
Figure 8. Crossplot of elastic parameters versus mud content using actual well L2 data. (A) Vp and ρ, (B) Vs and ρ, (C) Ip and ρ, (D) Vp/Vs and Vp, (E) Poisson's ratio and Vp, (F) Poisson impedance and Vp. The color bar on the right represents the mud content.
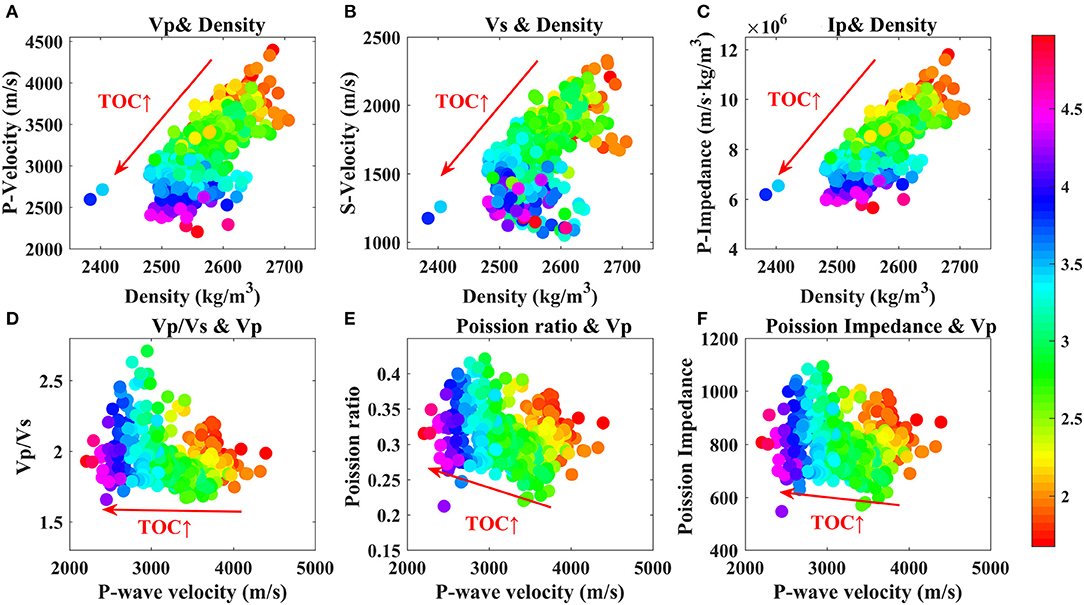
Figure 9. Crossplot of elastic parameters versus TOC content using actual well L2 data. (A) Vp and ρ, (B) Vs and ρ, (C) Ip and ρ, (D) Vp/Vs and Vp, (E) Poisson's ratio and Vp, (F) Poisson impedance and Vp. The color bar on the right represents the TOC content.
The actual well data used in the crossplots are also utilized to test the sensitivities of different elastic parameters to the mud content and TOC content. Sensitivities to the mud content and TOC content can also be understood as the indicating abilities of elastic parameters to the mudstone and high-quality source rock. In the mud-rich source rock, we assume the mudstone with the TOC content higher than 1.5% as the high-quality source rock. The sensitivity coefficient of each elastic parameter is defined as the ratio of the difference in the mean values and the standard deviation (SD) of the parameter value at the mudstone (or high-quality source rock), is (Yin et al., 2015; Zong et al., 2015),
where S* is the sensitivity coefficient of the elastic parameter for the mudstone or high-quality source rock. and are the mean values of the elastic parameters at the mudstone (or high-quality source rock) and sandstone (or non-high-quality source rock), respectively. is the SD of the elastic parameter at the mudstone (or high-quality source rock).
Figure 10 displays the sensitivity coefficients for discriminating the high-quality source rock and mudstone of different elastic parameters, including VP, VS, IP, VP/VS, Poisson's ratio (denotes as σ), and Poisson impedance (denotes as σρ), respectively. VP and IP have better sensitivities to the high-quality source rock, and the Poisson's ratio and Poisson impedance are more sensitive to the mudstone. Therefore, the Poisson's ratio and Poisson impedance can be considered as indicators for discriminating the mudstone, and then VP and IP are used to identify the high-quality source rock from the distribution of the mudstone.
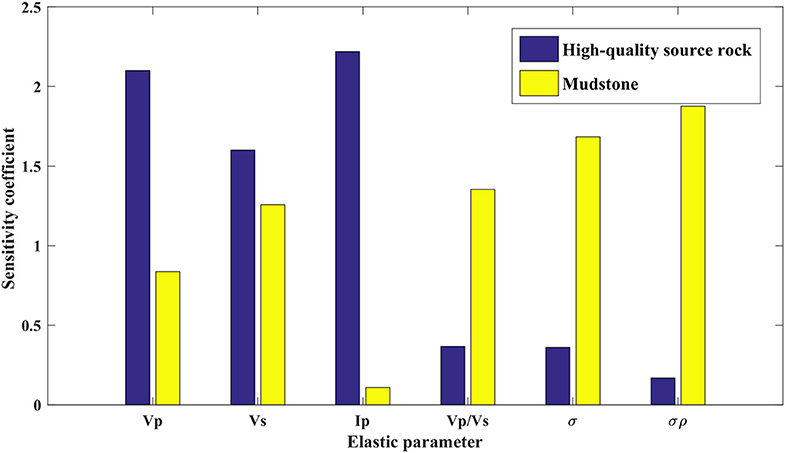
Figure 10. Sensitivity coefficients of different elastic parameters to the mudstone (in yellow) and the high-quality source rock (in blue).
Using the proposed rock physical model, the impact of the TOC content and mud content on the Poisson impedance and P-impedance of the mud-rich source rock are illustrated in Figure 11. As the mud content increases, the P-wave impedance generally decreases, and the Poisson impedance significantly increases, which is due to a high Poisson's ratio and the density of clay minerals in the mud-rich source rock. In contrast, the TOC content trends to make both the P-wave impedance and Poisson impedance decrease, which is caused by the very low modulus and density of kerogen in the mud-rich source rock.
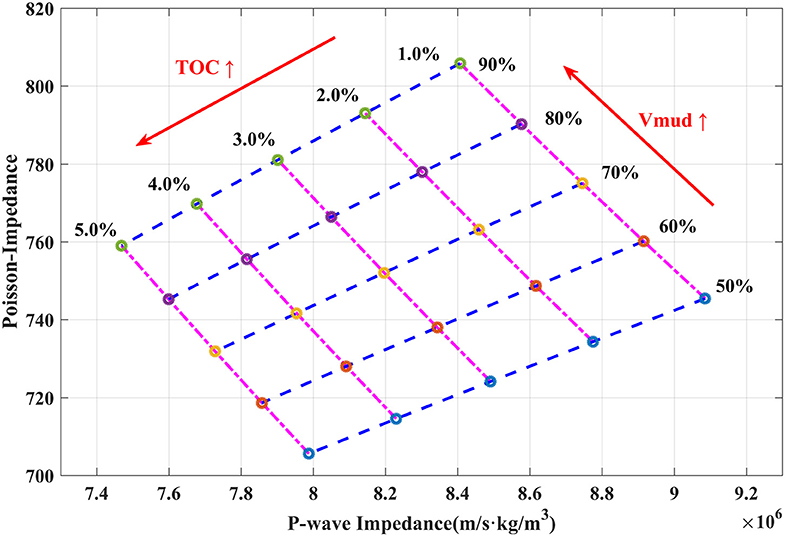
Figure 11. Diagram of the P-wave impedance versus Poisson impedance of varying TOC content and mud content based on the rock physical model of the mud-rich source rock.
Figure 11 demonstrates that the TOC content and mud content have a synergic effect on a decrease of the P-impedance, which will bring difficulties to determine the mud-rich source rock based on the interpretation of the P-wave impedance alone. However, the TOC content and mud content have a competing effect on an increase of the Poisson impedance. Moreover, the Poisson impedance is more sensitive to the mud content than the TOC content. Therefore, the Poisson impedance can be considered as an indicator to identify the spatial distribution of the mudstone. And then, the P-impedance can be further used to distinguish the mud-rich source rock from the determined mudstone. In addition, the P-impedance also can be used to evaluate the TOC content and discriminate the high-quality source rock. These results can help to interpret the seismic inversion results and guide the identification and evaluation of the mud-rich source rock.
In this section, the seismic responses of the mud-rich source rock are analyzed by using the proposed rock physical model to interpret the effects of the TOC content and mud content on the AVO characteristics.
The elastic parameters of the actual well L3 are calculated by using the proposed rock physical model. When the TOC content is higher than 1.0%, the mudstone is defined as the mud-rich source rock. From Figures 12A,B, the mud content and TOC content logs indicate that the mud-rich source rock has a thickness up to 300–400 m, and mainly consists of thick mudstones with less amount of thin sandstones. Figures 12C,D demonstrate that the calculated P-wave velocity and S-wave velocity (represented by green curves) are in good agreement with the measured well logs (represented by blue curves), which verifies the accuracy of the proposed rock physical model and thereby implies the feasibility and reliability of the seismic forward modeling. Moreover, the variations of P-wave velocity and S-wave velocity with depth give that the mud-rich source rock has significantly low velocity compared with sandstones. Figure 12E indicates the density of the mud-rich source rock is higher than the shallow sandstones and lower than the base sandstones due to the increasing formation compaction.
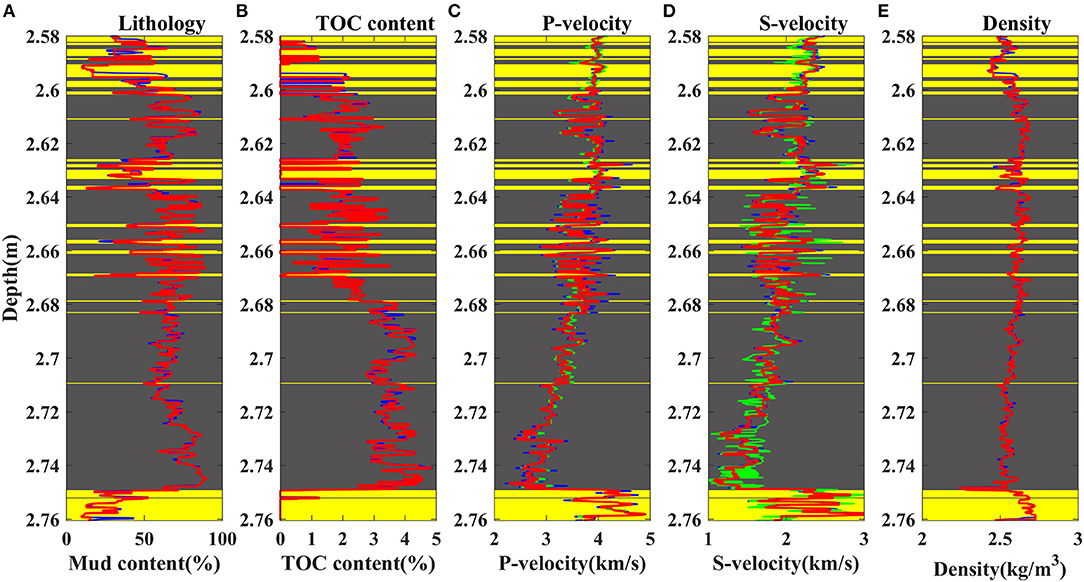
Figure 12. The lithology information (the mud-rich source rock in gray and sandstones in yellow), actual physical properties (blue curves), and estimated elastic properties (green curves) of actual well L3. (A) Mud content, (B) TOC content, (C) P-wave velocity, (D) S-wave velocity (E) Density.
The well-seismic-calibration process is divided into two main steps. The first one is blocking well logs, and is aimed to match the frequencies of the well logs and seismic data. The well log is stratified and blocked based on the minimum-stratification-thickness principle and minimum-velocity-difference principle (Zhou et al., 2015). In this study, the minimum-stratification-thickness is set at twice the seismic sampling interval, and the minimum-velocity-difference is set to 30 m/s for the actual well L3. The second main stage is the conventional well-seismic-calibration process.
The Aki–Richards approximation of the exact Zoeppritz equation is used to calculate the P-wave reflection coefficients for the AVO modeling (Aki and Richards, 1980),
where VP, VS, and ρ are the average values of P-wave velocity, S-wave velocity and density on both sides of the reflection interface, respectively. ΔVP, ΔVS, and Δρ are the difference of P-wave velocity, S-wave velocity, and density on both sides of the reflection interface, respectively. θ is an incident angle.
Figure 13 displays the synthetic seismic records that are consistent with the actual seismic records (on the side of well L3), which verifies the accuracy and effectivity of a seismic forward modeling. Both synthetic and well-side seismic records have four obvious strong reflection events, which sequentially match the top and bottom reflections of the upper and lower mud-rich source rock in the well L3, due to an obvious impedance contrast of the mud-rich source rock with respect to the background sandstones.
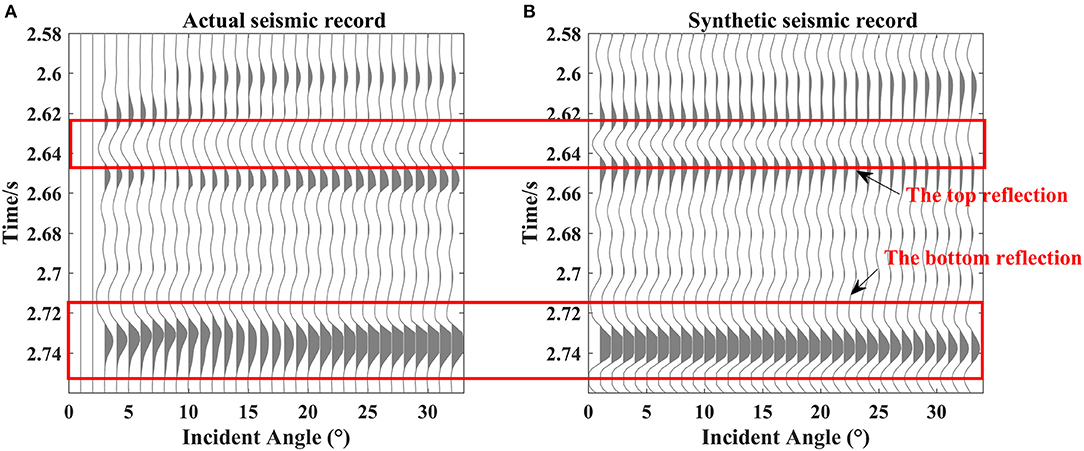
Figure 13. (A,B) A comparison of actual seismic records and synthetic seismic records.
The top and bottom reflection events of the lower mud-rich source rock are picked to analyze the AVO characteristics of the mud-rich source rock. Figure 13 displays that the top reflection of the mud-rich source rock has a strong negative reflection event dimming with an incident angle. Figure 14A indicates that the P-P reflection coefficient curves of the top reflection behave as negative interceptions and positive gradients, which demonstrate the class IV AVO pattern. This is mainly because the mud-rich source rock has lower P-wave impedance and higher Poisson's ratio than the upper sandstone (Ostrander, 1984; Avseth et al., 2010). The similar behaviors were also described in the previous researches on source rocks and organic-rich shales (Carcione, 2001; Sayers, 2013a; Ogiesoba and Hammes, 2014; del Monte et al., 2018; Kiswaka and Felix, 2020). Conversely, Figures 13, 14B display that the bottom reflection of the mud-rich source rock present a strong positive reflection event and the P-P reflection coefficient curves exhibit positive interceptions and negative gradients, which are consistent with the class I AVO characteristics. This is because the base sandstone have higher P-wave impedance and lower Poisson's ratio than the upper mud-rich source rock (Ostrander, 1984; Avseth et al., 2010). Moreover, Figure 14 displays that the AVO characteristics of the P-P reflection coefficient curves picked from the synthetic seismic records are in agreement with the fitting curves of the well-side seismic records, which also confirms the reliability of AVO modeling.
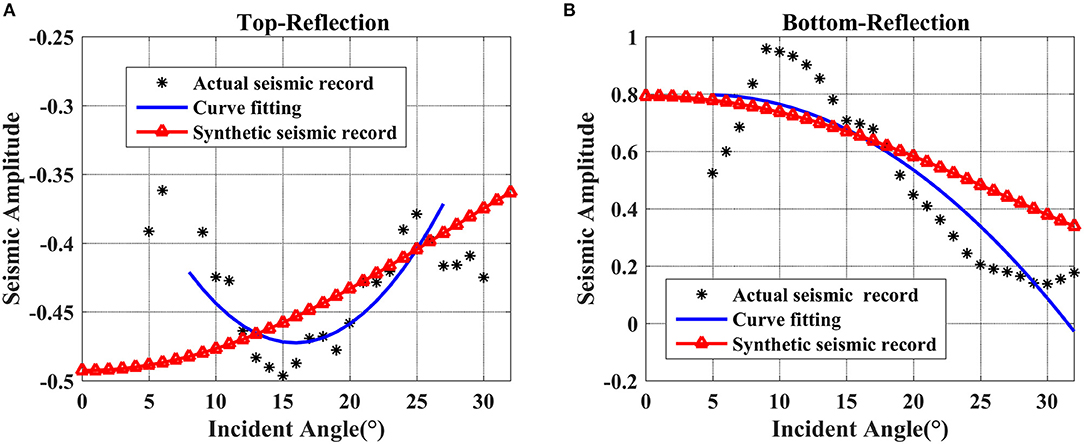
Figure 14. AVO characteristics analysis of the top and bottom reflection events picked from the well-side seismic records and synthetic seismic records. (A) Top reflection, (B) bottom reflection.
Furthermore, the average physical properties of the mud-rich source rock and background sandstone in the well L3 are selected to construct a two-layer model for analyzing the effects of the TOC content and mud content on the AVO characteristics. The upper layer is set to the sandstone with no kerogen, and the lower layer consists of the mud-rich source rock with a varying TOC content and mud content. Figures 15A,B display that the P-P reflection coefficients for the TOC content increase from 1.0 to 4.0%. In agreement with the conclusions of Carcione (2001), the P-P reflection coefficients remain negative, and the absolute values of the reflection coefficients gradually decrease within 40°, and then sharply increase in the range of 40–60°. Figure 15B highlights the variation of P-P reflection coefficients between 0° and 35°. As the TOC content increases, the interceptions of the P-P reflection coefficients decrease and the absolute values of the interceptions increase. This is because of an increase of the TOC content, which will make the elastic impedance of the mud-rich source rock to decrease and the impedance difference between the mud-rich source rock and sandstone to increase. As the TOC content increases from 1.0 to 4.0%, the interceptions of P-P reflection coefficients change from −0.221 to −0.237, and the relative change rate is 6.7%. When TOC is 4.0%, the P-P reflection coefficients vary from −0.237 to −0.173 as an incident angle changes from 0° to 35°, and the relative change rate is 27.0%. In conclusion, the TOC content has a significant effect on the P-P reflection coefficients because the presence of kerogen will largely weaken the elastic impedance of the mud-rich source rock.
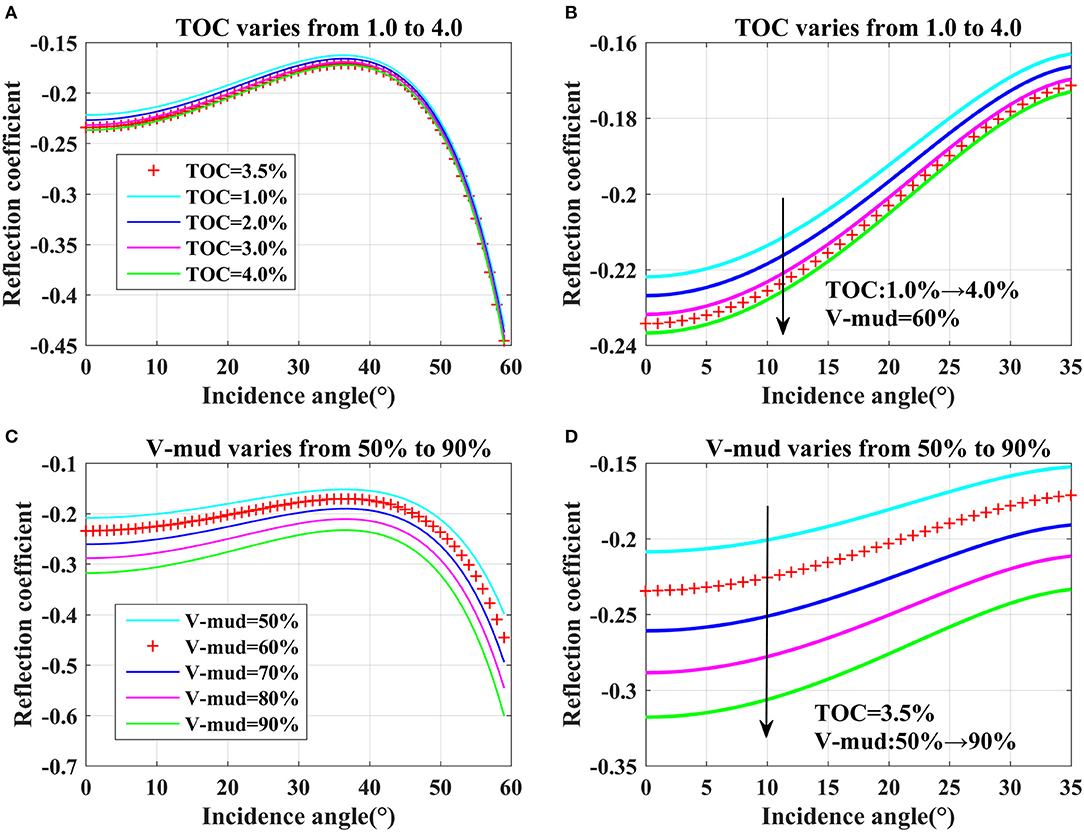
Figure 15. The PP-reflection coefficients vary with incident angle (denoted as θ) for different TOC content and mud content. (A) TOC content increases from 1.0 to 4.0%, θ is 0–60°, (B) TOC content increase from 1.0 to 4.0%, θ is 0–35°, (C) mud content increase from 50 to 90 %, θ is 0–60°, (D) mud content increases from 50% to 90%, θ is 0–35°. (Red crosses represent the PP-reflection coefficients calculated by the average elastic properties of the actual well L3.).
Similarly, Figures 15C,D display that the P-P reflection coefficients change as the mud content increases from 50 to 90%, and their variation characteristics are similar to those of increasing the TOC content. As the mud content increases from 50.0 to 90.0%, the P-P reflection coefficients decrease from −0.209 to −0.318, and the relative change rate is 52.4%. When the mud content is 90.0%, the P-P reflection coefficients increase from −0.318 to 0.236 with an incident angle changing from 0° to 35°, and the relative change rate is 25.8%. The effects of the mud content are more significant than the TOC content on the AVO responses, which is due to a larger variation of the mud content than the TOC content in the mud-rich source rock.
In conclusion, the AVO responses of the top reflections of the mud-rich source rock are consistent with the class IV AVO patterns, and the bottom reflections display a class I AVO anomaly. Moreover, the AVO characteristics can be strongly affected by the TOC content and mud content, and the TOC content and mud content will significantly decrease the interception and slightly change the gradient of the P-P reflection coefficients. In particular, the effects of the mud content are stronger than the TOC content.
In this study, we initially develop a rock physical model to reveal an inherent mechanism of the mud-rich source rock by focusing on the effects of the TOC content and mud content on the elastic properties and seismic responses. The rock physical modeling results and the crossplots of the actual well logs reveal that the TOC content and mud content have a synergic effect on a decrease of the P-wave impedance, and have an opposite impact on an increase of the Poisson impedance. In particular, the Poisson impedance is more sensitive to the mud content, and the P-wave impedance is more sensitive to the TOC content, which can help to interpret the seismic inversion results and guide the identification and evaluation of the mud-rich source rock. In addition, a CFPR method is also presented to acquire the continuous TOC curves for the application and analysis of the proposed rock physical model.
The seismic responses of the mud-rich source rock are later analyzed by using a seismic forward modeling. The synthetic seismic records and the well-side seismic records exhibit the same characteristics. Specifically, the top reflections of the mud-rich source rock behave as stronger negative events and their amplitudes decrease with an incident angle corresponding to a class IV AVO pattern, and the bottom reflections present class I AVO anomalies.
The AVO characteristics are a function of the TOC content and mud content, which is interpreted by using a two-layer model. Both the TOC content and mud content will significantly increase the interceptions and slightly change the gradients of the P-P reflection coefficients. Moreover, the effects of the mud content on the AVO responses are greater than those of the TOC content on the AVO responses due to a larger variation of the mud content in comparison to the TOC content in the mud-rich source rock.
In the conclusion, we concern that the mud-rich source rock has the same elastic properties and seismic responses as the mudstone. To avoid the confusion about the mudstone, the spatial distribution of mudstones can first be identified, and then the TOC content is estimated to further discriminate the mud-rich source rock from the determined mudstone. Besides, the interference of the mudstone to the mud-rich source rock will be solved by decoupling the elastic responses of the mud content and TOC content in the future studies.
The data analyzed in this study is subject to the following licenses/restrictions: National confidential data. Requests to access these datasets should be directed to emhhb3l1bnpvbmdAeWFob28uY29t.
ZZ and XY provided the ideas and experimental data of this paper, constructive comments for the paper, and reviewed and revised the manuscript. SY proposed the rock physical model of the mud-rich source rock, realized the numerical modeling and analysis of the rock physical model, completed the seismic forward modeling and AVO pattern analysis, and organized the content of article. All authors contributed to the article and approved the submitted version.
We would like to acknowledge the sponsorship of National Natural Science Foundation of China (41974119 and 42030103) and Science Foundation from Innovation and Technology Support Program for Young Scientists in Colleges of Shandong province and Ministry of Science and Technology of China.
The authors declare that the research was conducted in the absence of any commercial or financial relationships that could be construed as a potential conflict of interest.
Aki, K., and Richards, P. G. (1980). Quantitative Seismology: Theory and Methods. San Francisco, CA: W.H. Freeman.
Alshakhs, M., and Rezaee, M. R. (2017). A new method to estimate total organic carbon (TOC) content, an example from goldwyer shale formation, the canning basin. Open Petrol. Eng. J. 10, 118–133. doi: 10.2174/1874834101710010118
Aplin, A. C., and Macquaker, J. H. S. (2011). Mudstone diversity: origin and implications for source, seal, and reservoir properties in petroleum systems. AAPG Bull. 95, 2031–2059. doi: 10.1306/03281110162
Avseth, P., and Carcione, J. M. (2015). Rock-physics analysis of clay-rich source rocks on the Norwegian Shelf. Lead. Edge 34, 1340–1348. doi: 10.1190/tle34111340.1
Avseth, P., Mukerji, T., and Mavko, G. (2010). Quantitative Seismic Interpretation: Applying Rock Physics Tools to Reduce Interpretation Risk. Cambridge, MA: Cambridge University Press.
Ba, J., Xu, W., Fu, L., Carcione, J. M., and Zhang, L. (2017). Rock anelasticity due to patchy saturation and fabric heterogeneity: a double double-porosity model of wave propagation. J. Geophys. Res. 122, 1949–1976. doi: 10.1002/2016JB013882
Backus, G. (1962). Long-wave elastic anisotropy produced by horizontal layering. J. Geophys. Res. 67, 4427–4440. doi: 10.1029/JZ067i011p04427
Badics, B., Avu, A., and Mackie, S. (2015). Assessing source rock distribution in heather and draupne formations of the Norwegian North Sea: a workflow using organic geochemical, petrophysical, and seismic character. Interpretation 3, SV45–SV68. doi: 10.1190/INT-2014-0242.1
Berryman, J. G. (1980). Long-wavelength propagation in composite elastic media II. Ellipsoidal inclusions. J. Acoust. Soc. Am. 68, 1820–1831. doi: 10.1121/1.385172
Berryman, J. G. (1995). Mixture theories for rock properties. Rock Phys. Phase Relat. 3, 205–228. doi: 10.1029/RF003p0205
Carcione, J. M. (2000). A model for seismic velocity and attenuation in petroleum source rocks. Geophysics 65, 1080–1092. doi: 10.1190/1.1444801
Carcione, J. M. (2001). AVO effects of a hydrocarbon source-rock layer. Geophysics 66, 419–427. doi: 10.1190/1.1444933
Carcione, J. M., and Avseth, P. (2015). Rock-physics templates for clay-rich source rocks. Geophysics 80, D481–D500. doi: 10.1190/geo2014-0510.1
Carcione, J. M., Helle, H. B., and Avseth, P. (2011). Source-rock seismic-velocity models: Gassmann versus Backus. Geophysics. 76:N37–N45. doi: 10.1190/geo2010-0258.1
Ciz, R., and Shapiro, S. A. (2007). Generalization of Gassmann equations for porous media saturated with a solid material. Geophysics 72, A75–A79. doi: 10.1190/1.2772400
Cui, J., Zhu, R., Li, S., Qi, Y., Shi, X., and Mao, Z. (2019). Development patterns of source rocks in the depression lake basin and its influence on oil accumulation: case study of the Chang 7 member of the Triassic Yanchang Formation, Ordos Basin, China. J. Natural Gas Geosci. 4, 191–204. doi: 10.1016/j.jnggs.2019.08.002
del Monte, A. A., Antonielli, E., De Tomasi, V., Luchetti, G., Paparozzi, E., and Gambacorta, G. (2018). Methods for source rock identification on seismic data: an example from the Tanezzuft Formation (Tunisia). Mar. Petrol. Geol. 91, 108–124. doi: 10.1016/j.marpetgeo.2017.12.015
Ding, J., Xiaozhi, C., Xiudi, J., Bin, W., and Jinmiao, Z. (2015). Application of AVF Inversion on Shale Gas Reservoir TOC Prediction, 2015 SEG Annual Meeting. New Orleans, LA: Society of Exploration Geophysicists.
Espitalié, J., Madec, M., Tissot, B., Mennig, J., and Leplat, P. (1977). “Source rock characterization method for petroleum exploration,” in Offshore Technology Conference (Houston, TX: OnePetro). doi: 10.4043/2935-MS
Fertl, W. H., and Chilingar, G. V. (1988). Total organic carbon content determined from well logs. SPE Form. Eval. 3, 407–419. doi: 10.2118/15612-PA
Fertl, W. H., and Rieke, H. H. (1980). Gamma ray spectral evaluation techniques identify fractured shale reservoirs and source-rock characteristics. J. Petrol. Technol. 32, 2053–2062. doi: 10.2118/8454-PA
Gassmann, F. (1951). Elastic waves through a packing of spheres. Geophysics 16, 673–685. doi: 10.1190/1.1437718
Guo, Z., Li, X., Ren, Y., Chapman, M., and Shen, Y. (2013). “A rock physics workflow for the modeling of the effect of kerogen content and maturity level in shales,” in SEG Technical Program Expanded Abstracts 2013 (Houston, TX: Society of Exploration Geophysicists), 2948–2952. doi: 10.1190/segam2013-0458.1
Hansen, J. A., Mondol, N. H., and Fawad, M. (2019). Organic content and maturation effects on elastic properties of source rock shales in the Central North Sea. Interpretation 7, T477–T497. doi: 10.1190/INT-2018-0105.1
Hill, R. (1952). The elastic behaviour of a crystalline aggregate. Proc. Phys. Soci. 65:349. doi: 10.1088/0370-1298/65/5/307
Jiang, Y., and Zha, M. (2005). Oil and Gas Geology and Exploration. Beijing: Petroleum Industry Press, 78–95.
Kenomore, M., Hassan, M., Dhakal, H., and Shah, A. (2017). Total organic carbon evaluation of the Bowland Shale Formation in the Upper Bowland of the Widmerpool Gulf. J. Petrol. Sci. Eng. 150, 137–145. doi: 10.1016/j.petrol.2016.11.040
Keys, R. G., and Xu, S. (2002). An approximation for the Xu-White velocity model. Geophysics 67, 1406–1414. doi: 10.1190/1.1512786
Khoshnoodkia, M., Mohseni, H., Rahmani, O., and Mohammadi, A. (2011). TOC determination of Gadvan Formation in South Pars Gas field, using artificial intelligent systems and geochemical data. J. Petrol. Sci. Eng. 78, 119–130. doi: 10.1016/j.petrol.2011.05.010
Kiswaka, E. B., and Felix, M. (2020). Norwegian Sea area Permo-Triassic organic-carbon-rich deposits from seismic. Mar. Petrol. Geol. 119:104463. doi: 10.1016/j.marpetgeo.2020.104463
Lee, J., Lim, U. Y., and Lumley, D. (2020). “Improved TOC and lithology prediction for Wolfcamp shales using AVO attribute analysis,” Unconventional Resources Technology Conference. Unconventional Resources Technology Conference (URTeC) (Denver, CO). doi: 10.15530/urtec-2020-1028
Løseth, H., Wensaas, L., Gading, M., Duffaut, K., and Springer, M. (2011). Can hydrocarbon source rocks be identified on seismic data? Geology. 39, 1167–1170. doi: 10.1130/G32328.1
Ma, Y., Fan, M., Lu, Y., Guo, X., Hu, H., Chen, L., et al. (2016). Geochemistry and sedimentology of the Lower Silurian Longmaxi mudstone in southwestern China: Implications for depositional controls on organic matter accumulation. Mar. Petrol. Geol. 75, 291–309. doi: 10.1016/j.marpetgeo.2016.04.024
Mahmoud, A. A., Elkatatny, S., Ali, A., Abdulraheem, A., and Abouelresh, M. (2020). “Estimation of the total organic carbon using functional neural networks and support vector Machine,” in International Petroleum Technology Conference (Dhahran: OnePetro). doi: 10.2523/IPTC-19659-MS
Mahmoud, A. A., Elkatatny, S., Mahmoud, M., Abouelresh, M., Abdulraheem, A., and Ali, A. (2017). Determination of the total organic carbon (TOC) based on conventional well logs using artificial neural network. Int. J. Coal Geol. 179, 72–80. doi: 10.1016/j.coal.2017.05.012
Mavko, G., Mukerji, T., and Dvorkin, J. (2009). The Rock Physics Handbook: Tools for Seismic Analysis of Porous Media. Cambridge, MA: Cambridge University press. doi: 10.1017/CBO9780511626753
Mendelzon, J. D., and Toksoz, M. N. (1985). “Source rock characterization using multivariate analysis of log data,” in SPWLA 26th Annual Logging Symposium (Dallas, TX: Society of Petrophysicists and Well-Log Analysts).
Modica, C. J., and Lapierre, S. G. (2012). Estimation of kerogen porosity in source rocks as a function of thermal transformation: example from the Mowry Shale in the Powder River Basin of Wyoming. AAPG Bull. 96, 87–108. doi: 10.1306/04111110201
Ogiesoba, O., and Hammes, U. (2014). Seismic-attribute identification of brittle and TOC-rich zones within the Eagle Ford Shale, Dimmit County, South Texas. J. Petrol. Explor. Product. Technol. 4, 133–151. doi: 10.1007/s13202-014-0106-1
Ostrander, W. J. (1984). Plane-wave reflection coefficients for gas sands at nonnormal angles of incidence. Geophysics 49, 1637–1648. doi: 10.1190/1.1441571
Pang, M., Ba, J., Carcione, J. M., Zhang, L., Ma, R., and Wei, Y. (2021). Seismic identification of tight-oil reservoirs by using 3D rock-physics templates. J. Petrol. Sci. Eng. 201:108476. doi: 10.1016/j.petrol.2021.108476
Passey, Q., Moretti, F., Kulla, J., Creaney, S., and Stroud, J. (1990). Practical model for organic richness from porosity and resistivity logs. AAPG Bull. 74, 1777–1794. doi: 10.1306/0C9B25C9-1710-11D7-8645000102C1865D
Passey, Q. R., Bohacs, K., Esch, W. L., Klimentidis, R., and Sinha, S. (2010). “From oil-prone source rock to gas-producing shale reservoir - geologic and petrophysical characterization of unconventional shale gas reservoirs,” in International Oil and Gas Conference and Exhibition in China (Beijing: Society of Petroleum Engineers). doi: 10.2118/131350-MS
Pichevin, L., Bertrand, P., Boussafir, M., and Disnar, J. R. (2004). Organic matter accumulation and preservation controls in a deep sea modern environment: an example from Namibian slope sediments. Organic Geochem. 35, 543–559. doi: 10.1016/j.orggeochem.2004.01.018
Rahmani, O., Khoshnoodkia, M., Kadkhodaie, A., Beiranvand Pour, A., and Tsegab, H. (2019). Geochemical analysis for determining total organic carbon content based on Δ LogR technique in the south pars field. Minerals 9:735. doi: 10.3390/min9120735
Sayers, C. M. (2013a). The effect of kerogen on the AVO response of organic-rich shales. Lead. Edge 32, 1514–1519. doi: 10.1190/tle32121514.1
Sayers, C. M. (2013b). The effect of kerogen on the elastic anisotropy of organic-rich shales. Geophysics 78, D65–D74. doi: 10.1190/geo2012-0309.1
Schmoker, J. W. (1979). Determination of organic content of appalachian devonian shales from formation-density logs. AAPG Bull. 63, 1504–1537. doi: 10.1306/2F9185D1-16CE-11D7-8645000102C1865D
Schmoker, J. W. (1981). Determination of organic-matter content of appalachian devonian shales from gamma-ray logs. AAPG Bull. 65, 1285–1298. doi: 10.1306/03B5949A-16D1-11D7-8645000102C1865D
Schmoker, J. W., and Hester, T. C. (1983). Organic carbon in Bakken formation, United States portion of Williston basin. AAPG Bull. 67, 2165–2174. doi: 10.1306/AD460931-16F7-11D7-8645000102C1865D
Shi, X., Wang, J., Liu, G., Yang, L., Ge, X., and Jiang, S. (2016). Application of extreme learning machine and neural networks in total organic carbon content prediction in organic shale with wire line logs. J. Natural Gas Sci. Eng. 33, 687–702. doi: 10.1016/j.jngse.2016.05.060
Tan, M., Song, X., Yang, X., and Wu, Q. (2015). Support-vector-regression machine technology for total organic carbon content prediction from wireline logs in organic shale: a comparative study. J. Natural Gas Sci. Eng. 26, 792–802. doi: 10.1016/j.jngse.2015.07.008
Tan, W., Ba, J., Müller, T., Fang, G., and Zhao, H. (2020). Rock physics model of tight oil siltstone for seismic prediction of brittleness. Geophys. Prospect. 68, 1554–1574. doi: 10.1111/1365-2478.12938
Tissot, B., Durand, B., Espitalié, J., and Combaz, A. (1974). Influence of nature and diagenesis of organic matter in formation of petroleum1. AAPG Bull. 58, 499–506. doi: 10.1306/83D91425-16C7-11D7-8645000102C1865D
Tissot, B. P., Pelet, R., and Ungerer, P. H. (1987). Thermal history of sedimentary basins, maturation indices, and kinetics of oil and gas generation. AAPG Bull. 71, 1445–1466. doi: 10.1306/703C80E7-1707-11D7-8645000102C1865D
Vernik, L. (2016). Seismic Petrophysics in Quantitative Interpretation. Tulsa: Society of Exploration Geophysicists. doi: 10.1190/1.9781560803256
Vernik, L., and Landis, C. (1996). Elastic anisotropy of source rocks: implications for hydrocarbon generation and primary migration. AAPG Bull. 80, 531–544. doi: 10.1306/64ED8836-1724-11D7-8645000102C1865D
Vernik, L., and Liu, X. (1997). Velocity anisotropy in shales: a petrophysical study. Geophysics 62, 521–532. doi: 10.1190/1.1444162
Vernik, L., and Milovac, J. (2011). Rock physics of organic shales. Lead. Edge 30, 318–323. doi: 10.1190/1.3567263
Vernik, L., and Nur, A. (1992). Ultrasonic velocity and anisotropy of hydrocarbon source rocks. Geophysics 57, 727–735. doi: 10.1190/1.1443286
Xu, M., Yin, X., Zong, Z., and Li, H. (2020). Rock-physics model of volcanic rocks, an example from Junggar Basin of China. J. Petrol. Sci. Eng. 195:107003. doi: 10.1016/j.petrol.2020.107003
Xu, S., and White, R. E. (1995). A new velocity model for clay-sand mixtures1. Geophys. Prospect. 43, 91–118. doi: 10.1111/j.1365-2478.1995.tb00126.x
Yin, L., Yin, X., Zong, Z., Chen, B., and Chen, Z. (2020). A new rock physics model method for shale on the theory of micro-nanopores. Chin. J. Geophys. 63, 1642–1653. doi: 10.3997/2214-4609.202010308
Yin, X., Zong, Z., and Wu, G. (2015). Research on seismic fluid identification driven by rock physics. Sci. China Earth Sci. 58, 159–171. doi: 10.1007/s11430-014-4992-3
Zargari, S., Prasad, M., Mba, K. C., and Mattson, E. D. (2013). Organic maturity, elastic properties, and textural characteristics of self resourcing reservoirs. Geophysics 78, D223–D235. doi: 10.1190/geo2012-0431.1
Zhao, L., Qin, X., Han, D. H., Geng, J., Yang, Z., and Cao, H. (2016). Rock-physics modeling for the elastic properties of organic shale at different maturity stages. Geophysics 81, D527–D541. doi: 10.1190/geo2015-0713.1
Zhao, P., Ma, H., Rasouli, V., Liu, W., Cai, J., and Huang, Z. (2017). An improved model for estimating the TOC in shale formations. Mar. Petrol. Geol. 83, 174–183. doi: 10.1016/j.marpetgeo.2017.03.018
Zhao, P., Mao, Z., Huang, Z., and Zhang, C. (2016). A new method for estimating total organic carbon content from well logs. AAPG Bull. 100, 1311–1327. doi: 10.1306/02221615104
Zhou, J., Yin, X., and Cao, D. (2015). Research on fine layering method of acoustic log data in the process of scale matching between acoustic log data and seismic data. Comput. Tech. Geophys. Geochem. Explor. 37, 242–248.
Zhu, G., and Jin, Q. (2003). Using logging information to evaluate the geochemical characteristics of source rocks. Geosci. Front. 10, 494–494.
Keywords: rock physical model, AVO pattern, mud-rich source rock, TOC, mud content
Citation: Yu S, Zong Z and Yin X (2021) Rock Physical Model and AVO Patterns for the Mud-Rich Source Rock. Front. Earth Sci. 9:633930. doi: 10.3389/feart.2021.633930
Received: 26 November 2020; Accepted: 18 March 2021;
Published: 22 April 2021.
Edited by:
Jing Ba, Hohai University, ChinaCopyright © 2021 Yu, Zong and Yin. This is an open-access article distributed under the terms of the Creative Commons Attribution License (CC BY). The use, distribution or reproduction in other forums is permitted, provided the original author(s) and the copyright owner(s) are credited and that the original publication in this journal is cited, in accordance with accepted academic practice. No use, distribution or reproduction is permitted which does not comply with these terms.
*Correspondence: Zhaoyun Zong, emhhb3l1bnpvbmdAeWFob28uY29t
Disclaimer: All claims expressed in this article are solely those of the authors and do not necessarily represent those of their affiliated organizations, or those of the publisher, the editors and the reviewers. Any product that may be evaluated in this article or claim that may be made by its manufacturer is not guaranteed or endorsed by the publisher.
Research integrity at Frontiers
Learn more about the work of our research integrity team to safeguard the quality of each article we publish.