 Giridas Maiti
 Nibir Mandal
95% of researchers rate our articles as excellent or good
Learn more about the work of our research integrity team to safeguard the quality of each article we publish.
Find out more
ORIGINAL RESEARCH article
Front. Earth Sci. , 26 February 2021
Sec. Structural Geology and Tectonics
Volume 9 - 2021 | https://doi.org/10.3389/feart.2021.632806
Low-viscosity channel flow, originating from a melt-weakened mid-crustal layer, is one of the most popular tectonic models to explain the exhumation of deep-seated rocks in the Greater Himalayan Sequence (GHS). The driving mechanism of such channel flow, generally attributed to focused erosion in the mountain front, is still debated, and yet to be resolved. Moreover, the channel flow model cannot explain eclogites in the GHS. In this study, we present a new two-dimensional thermo-mechanical numerical model, based on lubrication dynamics to demonstrate the exhumation process of deep crustal rocks in GHS. The model suggests that a dynamic-pressure drop in the Himalayan wedge, following a large reduction in the India-Asia convergence velocity (15 cm/yr at 50 Ma to nearly 5 cm/yr at ∼22 Ma) localized a fully developed extrusion zone, which controlled the pressure-temperature-time (P-T-t) path of GHS rocks. We show that the wedge extrusion, originated in the lower crust (∼60 km), was initially bounded by two oppositely directed ductile shear zones: the South Tibetan Detachment systems (STDS) at the top and the Higher Himalayan Discontinuity (HHD) at the bottom. With time the bottom shear boundary of the extrusion zone underwent a southward migration, forming the Main Central Thrust (MCT) at ∼17 Ma. Our model successfully reproduces two apparently major paradoxical observations in the Himalaya: syn-convergence extension and inverted metamorphic isograds. Model peak P (10–17 kb) and T (700–820°C) and the exhumation P-T-t path estimated from several Lagrangian points, traveling through the extrusion zone, are largely compatible with the petrological observations in the GHS. The model results account for the observed asymmetric P-T distribution between the MCT and STDS, showing peak P-T values close to the MCT. The lubrication dynamics proposed in this article sheds light on the fast exhumation event (>1 cm/yr) in the most active phase of crustal extrusion (22-17 Ma), followed by a slowed-down event. Finally, our model explains why the extrusion zone became weak in the last 8-10 Ma in the history of India-Asia collision.
Understanding the exhumation mechanism of high pressure (HP) and ultra-high pressure (UHP) rocks, such as eclogites is the key to modeling the crustal recycling processes in convergent plate boundaries (Ernst et al., 1997; Agard et al., 2009). The Himalaya represents an archetype collisional orogen, displaying HP rocks within the high-grade metamorphic terrain of the Greater (or Higher) Himalayan Sequence (GHS) (Figure 1A). There are two contrasting types of eclogites reported from the GHS (Lombardo and Rolfo, 2000; Corrie et al., 2010; Grujic et al., 2011; O’Brien, 2019). The eclogites in northwestern Himalaya (Kaghan and Tso Morari) are of Early Tertiary age, and their peak pressure (P = 26–28 kb) temperatures (T = 580–600°C) suggest UHP metamorphism (Lombardo and Rolfo, 2000; O’Brien, 2019). On the other hand, those in the eastern Himalaya (Ama Drime/Arun valley/Kharta, north Sikkim, NW Bhutan) are much younger in age (25-16 Ma), and the calculated peak P (= 10–15 kb) and T (= ∼780°C) indicate their exhumation depths of 50 km or more (Lombardo and Rolfo, 2000; Corrie et al., 2010; Kohn, 2014; O’Brien, 2019). Extrusion mechanism of HP rocks from such depths has emerged as a stimulating topic of research in geosciences, giving way to a remarkable conceptual development in convergent tectonics (Mancktelow, 1995; Chemenda et al., 2000; Burov and Yamato, 2008; Warren et al., 2008; Li and Gerya, 2009). Diverse types of mechanical and thermo-mechanical models have been proposed to explain the extrusion tectonics of high-grade rocks in the GHS (Montomoli et al., 2013) and the development of fold-thrust belts in the Himalaya. These include the coulomb wedge model (Dahlen et al., 1984), the wedge extrusion model (Burchfiel and Royden, 1985; Hodges et al., 1992), the slab break-off model of the Indian crustal lithosphere during 25-20 Ma (Chemenda et al., 2000), the channel flow model (Grujic et al., 1996; Beaumont et al., 2001), the critical taper model (Kohn, 2008), and the in-sequence shearing model (Carosi et al., 2016; Carosi et al., 2018). However, the channel flow model, which explains the formation of GHS as a focused exhumation of low-viscosity mid-crustal materials through a channel-like passage between the Main Central Thrust (MCT) on the south and the South Tibetan Detachment System (STDS) on the north (Beaumont et al., 2001; Grujic et al., 2002) (Figure 1B), revolutionized the idea about the Himalayan tectonics. According to this model, the pressure gradient between the thick elevated Tibetan plateau and a relatively thin foreland resulted in a Poiseuille flow in the large hot orogens, coupled with active erosion at the mountain fronts to facilitate the exhumation of mid-crustal rocks. Similarly, Clark and Royden, 2000 conceptualized channel flow dynamics of low-viscosity mid-crustal materials (∼1018 Pa s), driven by lateral pressure gradients, to interpret the variations in topography building at the northeastern, southeastern, and eastern margins of the Tibetan plateau. Several studies predicted the occurrence of similar narrow extrusion zones in subduction settings, which mediate the return flows and exhumation of ultra-high pressure rocks (Warren et al., 2008; Li and Gerya, 2009; Malusà et al., 2015) in convergent plate margins.
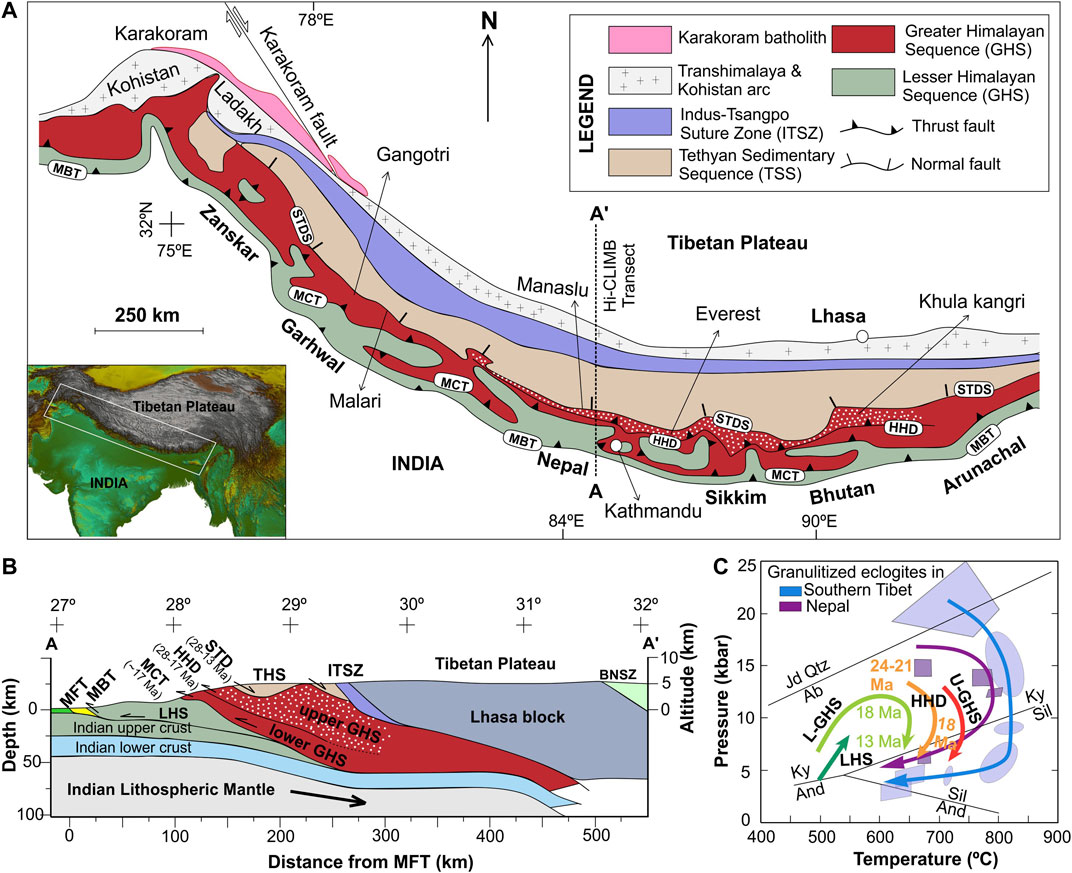
FIGURE 1. (A) A geological map of the Himalaya showing the major tectonic units and their boundaries (after Carosi et al., 2018; Wang et al., 2016). MBT: main boundary thrust; MCT: main central thrust; STDS: south tibetan detachment system. (B) Lithospheric-scale cross-section of the Himalaya-Tibet system at 85°E used to show depth-wize dispositions of the tectonic units (after Godin and Harris, 2014; Carosi et al., 2018). (C)P-T-t path of exhumed high-pressure rocks in the GHS (Kohn, 2014; Iccarino et al., 2017; Waters, 2019).
The channel flow model of Beaumont et al., (2001), although it gained enormous popularity in the context of Himalayan tectonics, has triggered counter-arguments in the light of various geological issues, as presented in the special volume on the Channel Flow conference (Godin et al., 2006; Harrison, 2006) and discussed in later studies (Kohn 2008; Carosi et al., 2018). For example, its validity essentially demands the existence of a mechanically weak middle crust, with viscosity in the order of 1019 Pa s. Such a mechanical stratification is expected to cause decoupling of the Tibetan upper crust from the stronger lower part (lower crust and mantle) of the lithosphere (Copley et al., 2011). In fact, several workers invoked a diametrically opposite view, considering strong mechanical coupling between the upper crust and the underlying lithosphere, and thereby a coherent deformation for the whole Tibetan lithosphere (Zhang et al., 2004; Flesch et al., 2005; Copley et al., 2011). Another important condition required to sustain the channel flow is focused surface-erosion at the mountain front. Geochronological and geological evidence suggests that the extrusion process in the Himalaya was most active during the Oligocene-Miocene time. Despite the availability of data for high erosion rates in this time interval (Thiede et al., 2005; Clift, 2017), there is an uncertainty with the spatial correlations between the high orogenic precipitation and the exact location of focused exhumation (Corrie et al., 2010). Another line of modeling suggests the possibility of focused extrusion in subduction wedges, which excludes the surface erosion as a pre-requisite factor for the deep-crustal exhumation process (Brun and Faccenna, 2008; Malusà et al., 2015; Piccolo et al., 2018). It is thus necessary to re-address the question-can channel-like extrusion occur in the Himalaya without any significant contribution of focused surface erosion at the mountain front? Also, the channel flow model does not account for the occurrence of high-pressure eclogites in the GHS, where their peak metamorphic conditions indicate pressures in excess of 1.5 GPa and exhumation depths >50 km, as pointed out by Grujic et al., 2011 (Figure 1C). According to the channel flow model, the GHS exhumation occurred between two synchronous shear zones, the STDS on the north and the MCT on the south. However, many recent field studies suggest that GHS were exhumed between 27 to 17 Ma, prior to the activation of MCT (Wang et al., 2016; Carosi et al., 2018). These studies recognized a more than 1000 km long new shear zone, called High Himalayan Discontinuity (HHD) within the GHS (Figures 1A,B) (Montomoli et al., 2013; Cottle et al., 2015; Khanal et al., 2015; Zeiger et al., 2015; Agustsson et al., 2016; Wang et al., 2016; Iaccarino et al., 2017; Walters and Kohn, 2017; Carosi et al., 2018). The HHD holds a cogenetic relation with the STDS and GHS exhumation event (Wang et al., 2016). All these open-ended issues motivate us to re-visit the dynamics of deep-crustal extrusion and the pressure-temperature evolution of GHS rocks in the Himalaya. Geological records suggest that the phase of most rapid GHS exhumation (Ganguly et al., 2000; White et al., 2002; Najman et al., 2009; Thiede et al., 2009; Grujic et al., 2011; Carrapa et al., 2014; Clift, 2017) occurred when India-Asia convergence velocity dropped to ∼5 cm/yr at ∼22 Ma from∼15 cm/yr at 50 Ma (Molnar and Stock, 2009; Copley et al., 2010). Interestingly, this timing marks the onset of gravitational collapse (extensional deformations, manifested in widely distributed N-S and E-W normal faulting) in the Tibetan plateau, following a prolonged period of compressional deformation since 50 Ma (Wang et al., 2014; Li et al., 2015). The two events: gravitational collapse in the Tibetan plateau and exhumation of GHS rocks in the Himalayan wedge then appear to be broadly synchronous, indicating a dynamic connection between them.
In this study, we develop a thermo-mechanical geodynamic model within the premises of lubrication theory (Hamrock, 1991; Mancktelow, 1995; Maiti and Mandal, 2020) to provide an alternative explanation for the exhumation dynamics of high-pressure rocks in the Himalaya, and constrain their P-T paths during the extrusion. The model shows the drop in dynamic pressure in the Himalayan wedge as the key factor in driving the extrusion of deep-crustal materials from a depth of 55–60 km, that accounts for the occurrence of high-pressure rocks (>1.5 GPa) in the GHS (Grujic et al., 2011). Moreover, many petrological studies deciphered a fast exhumation (>1 cm/yr) event at 22-17 Ma, followed by a phase of slowed-down rates (Najman et al., 2009). We use the thermo-mechanical model to explore the cause of such an unsteady exhumation history in the GHS. We also present an analysis of the pressure (P) and temperature (T) profiles across the GHS in the light of the available P-T estimates from different transects in the Higher Himalaya. Our model estimates yield a peak P∼17 kb and T∼820°C, fairly in agreement with the petrological data reported from exhumed rocks.
We conceptualize the Himalaya-Tibet coupled dynamics in the framework of a subduction model, where the subducting plate motion builds a dynamic pressure in the tectonic wedge to support the load in the overriding crust (Figure 2A). Many petrological studies reported that subduction wedges (the interface between two colliding plates) consist of fluid-rich relatively low viscosity and density crustal materials (Duarte et al., 2015; Bebout and Penniston-Dorland, 2016; Bayet et al., 2018). Moreover, spontaneously evolved subduction models (Burov and Yamato, 2008; Warren et al., 2008; Li and Gerya, 2009) show the development of low-viscosity downward-tapered wedges, filled with crushed materials of upper and mid crustal rocks. Based on these evidences, we consider the Himalayan wedge as a mechanically weak region with viscosity (∼1021 to 1020 Pa s) and density (2600–3050 kg/m3) lower than the colliding plates (∼1022-1021 Pa s and 2700–3200 kg/m3). Such a system is mechanically analogues to engineering thrust or pad bearing devices (Hamrock, 1991), in which two inclined plates remain separated by a relatively low-density viscous wedge (Figures 2A,B). The upper load-bearing plate is held stationary, whereas the lower plate moves at a tangential velocity and produces a flow-induced dynamic pressure (PDy) in the intervening viscous wedge. The PDy supports the load of the upper plate and keeps the two plates separated from each another. PDy is calculated using lubrication approximation (Hamrock, 1991).
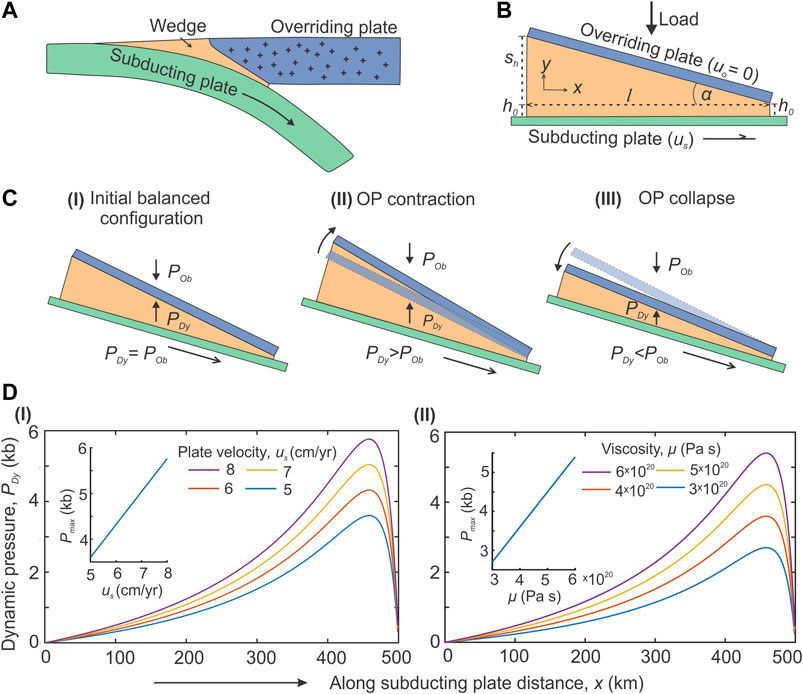
FIGURE 2. (A) Schematic presentation of an orogenic wedge, forming the interface between the subducting and overriding plates in a subduction system. (B) Geometrical parameters of an orogenic wedge considered for the analysis of dynamic pressure within the wedge, where h0 and (h0+ Sh) are the opening widths at the two converging ends of the wedge, l is the along-plate length of the wedge, and α is convergence angle. The overriding plate is kept stationary (uo = 0) and the subducting plate moves at velocity us (cm/yr). (C) Three dynamic states of a subduction system. I: Wedge dynamic pressure (PDy) equals to overburden pressure (POb), acting on the wedge-overriding plate interface; the system is in a balanced state. II: PDy>POb; the overriding plate (OP) undergoes contractional deformation. III. PDy<POb; the OP undergoes rotational collapse. (D) Graphical plots of PDy as a function of I) subduction plate velocity, us and II) wedge viscosity, µ.
Maiti and Mandal (2020) have shown the applicability of lubrication approximation in calculating PDy in subduction wedges with large convergence angle (α) up to 15°. The lubrication dynamics suggests that the subducting plate motion can develop a dynamic pressure (PDy) in the subduction wedge (Hamrock, 1991; Mancktelow, 1995; Maiti and Mandal, 2020), which supports the excess gravitational load of the overriding plate (POb) to maintain a stable state (PDy = POb) (Figure 2Ci). In case PDy > POb, the system tends to achieve the equilibrium either by increasing the inter-plate distance and/or by transferring compressive stresses into the overriding plate (Figure 2Cii). In contrast, when PDy < POb, the system would reduce the inter-plate distance to raise the dynamic pressure level in order to restore a stable state (Figure 2Ciii). The latter condition triggers a collapse of the overriding plate onto the wedge and forces the buoyant wedge rocks to extrude out of the plate confinement zone.
For a given tapered geometry of the viscous wedge (Figure 2B), the dynamic pressure (PDy) is obtained from Reynold’s equation as a function of subducting plate velocity (us), and wedge viscosity (µ) (Maiti and Mandal, 2020) as,
where h0 and (h0+ Sh) are the opening widths at the two converging ends of the wedge, l is the along-plate wedge length. Eq. 1 shows that PDy holds a positive linear relation with us and μ. A decrease either in us or μ would reduce the wedge dynamic pressure. For example, in a subduction wedge (l = 500 km; ho = 10 km, Sh = 110 km) with μ = 4 × 10²⁰ Pa s, a drop of us from 8 to 5 cm/yr lowers the maximum dynamic pressure (Pmax), localizing near the narrow convergence ends of the two plates, from 5.7 to 3.6 kb (Figure 2Di). For us = 5 cm/yr, increase in μ by two times (i.e., 3 × 10²⁰ to 6 ×10²⁰ Pa s) raises Pmax also by two times (2.7–5.4 kb) (Figure 2Dii). Under the set of chosen model parameters, the variation of PDy in the wedge ranges from 2 to 6 kb. Recent field evidence also suggests that a subduction-collision zone can produce non-lithostatic pressure of large magnitudes, reaching even 15 kb (Luisier et al., 2019; Cutts et al., 2020).
The India-Asia collision history tracks a temporally non-uniform convergence motion, beginning with a high rate (∼15 cm/yr) at ∼ 50 Ma, which remarkably slowed down to ≤5 cm/yr at ≤ 22 Ma (Molnar and Stock, 2009; Copley et al., 2010). The analytical solution of lubrication theory (Eq. 1) indicates that a reducing India-Asia collision rate might have lowered the dynamic pressure in the Himalayan wedge, and resulted in a collapse of the Tibetan overriding block, forcing the deep-crustal rocks to extrude in the form of Greater Himalayan sequence, as shown earlier by Maiti and Mandal, 2020 from a simple mechanical consideration. However, to obtain a complete picture of the peak pressure-temperature condition of exhumed high-pressure rocks, its P-T-t path, shape and active phase of the orogenic channel, spatial variations of peak P-T data in the Himalayan wedge, it is necessary to develop a time-dependent thermo-mechanical modeling approach, incorporating the natural complexity of the Himalaya-Tibet system and its rheological variations. In this study, we build two-dimensional thermo-mechanical numerical models within the framework of lubrication dynamics presented above.
Assuming a steady-state incompressible flow, our thermo-mechanical modeling involves three conservation equations for mass, momentum, and energy in the following forms:
where u, μ, ρ, p, F, denote velocity vector, viscosity, density, pressure, and body force term, respectively. In Eq. 4, the thermodynamic parameters T, Cp, k, Qsh represent temperature, specific heat, thermal conductivity, and heat source respectively. The mechanical part of the computation (Eqs 2, 3) calculates the velocity field, stress, strain-rate, and deformation subjected to specified mechanical boundary conditions. On the other hand, the thermal computation solves the heat balance equation (Eq. 4) on an Eulerian grid subjected to mechanical velocity field and thermal boundary conditions. The mechanical and thermal properties are coupled through the temperature-dependent viscous power-law rheology used in model materials. Shear heating in the model is considered to make a small contribution to the total thermal budget of a subduction system and therefore it has been neglected. It has been shown that shear heating in the low-strength materials of the subduction system contributes to an increase in temperature of no more than 50°C (Warren et al., 2008). The values of different model parameters and material properties chosen in our models are described in Table 1. We solved the three governing equations using a finite element code (COMSOL Multiphysics, 2015), which has been benchmarked by earlier workers for studying temperature-dependent Newtonian as well as non-Newtonian rheology in fluid mechanics (van Keken et al., 2008). Moreover, the code has been used to simulate a wide range of large-scale geodynamic processes such as the mid-oceanic ridge system (Montési and Behn, 2007), subduction zone modeling (Rodríguez-González et al., 2012; Dasgupta and Mandal, 2018), magma upwelling (Shahraki and Schmeling, 2012), mantle convection (He, 2014), Rayleigh-Taylor instabilities (Ghosh et al., 2020), continental deformations (Bischoff and Flesch, 2019).
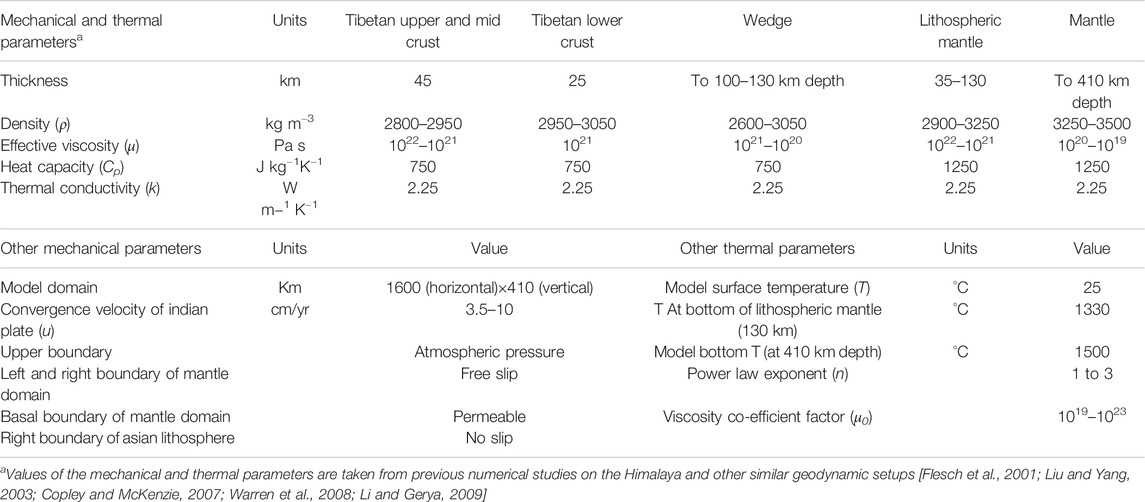
TABLE 1. Parameters used in models.
We have employed Arbitrary Lagrangian and Eulerian method (ALE) (Fullsack, 1995; Dasgupta and Mandal, 2018) in our time-dependent model runs to advect the model upper surface with the flow and to measure the development of model topography. The most remarkable advantage of ALE is that it can explicitly track free surfaces, internal boundaries, and any moving material interfaces applicable to multiphase flow simulations. Moreover, ALE can efficiently measure large strains in simulating continuum scale deformations. The ALE method has been implemented in simulating a wide range of geodynamic processes including coupled crust-mantle dynamics and intra-cratonic deformations (Pysklywec and Cruden, 2004), slab detachment processes ((Pysklywec et al., 2003), surface topography in bi-vergent subduction (Dasgupta and Mandal, 2018) and coupled crust-mantle systems (Crameri et al., 2012). Dasgupta and Mandal (2018) benchmarked the ALE scheme for computational fluid dynamics (CFD) simulations using COMSOL Multiphysics.
Our initial/reference model is approximated to the Himalayan wedge geometry (discussed above) and adjoining Tibetan plateau topography with an average elevation of 5 km, which is supposed to have attained by 26 Ma in the collision history (DeCelles et al., 2007; Wang et al., 2014). The 2D model geometry, chosen in Cartesian space, has a horizontal and a vertical dimension of 2500 km and 410 km respectively, considered significantly larger than the region of interest to avoid the influence of model boundaries in the simulation results (Figure 3A). The model replicates the Himalayan wedge in between the hinge line and the Indus-Tsangpo suture zone, with a width of approximately 300–350 km on the surface, as estimated from trans-orogen topographic profiles in the Himalayan Mountain belt (Mandal et al., 2015), extending down to the Asian lithospheric base. We use available lithospheric cross-sections of the Himalaya-Tibet system to constrain the tapered wedge geometry (Hauck et al., 1998; Jiménez-Munt et al., 2008; Godin and Harris, 2014), and varied the subduction angle of the Indian plate between 6° to 15° with depth (Kumar et al., 2006; Jiménez-Munt et al., 2008; Gloaguen and Ratschbacher, 2011). The thicknesses of the Indian and overriding Asian lithosphere are chosen 110 and 130 km, respectively (Jiménez-Munt et al., 2008; Gloaguen and Ratschbacher, 2011). The Tibetan lithosphere is treated as a three-layer structure: upper to middle crust (45 km), lower crust (25 km), and mantle lithosphere (70–130 km). To reproduce the Himalaya-Tibet collision tectonics, we allowed the Indian lithosphere to subduct beneath the stationary Tibetan lithosphere (Beaumont et al., 2001), which had a stable northern boundary since 50-34 Ma (Meyer et al., 1998). The plate convergence is accommodated by the upper crust of the Indian plate, accreting into the Himalayan wedge and indenting into the Asia plate (Yakovlev and Clark, 2014).
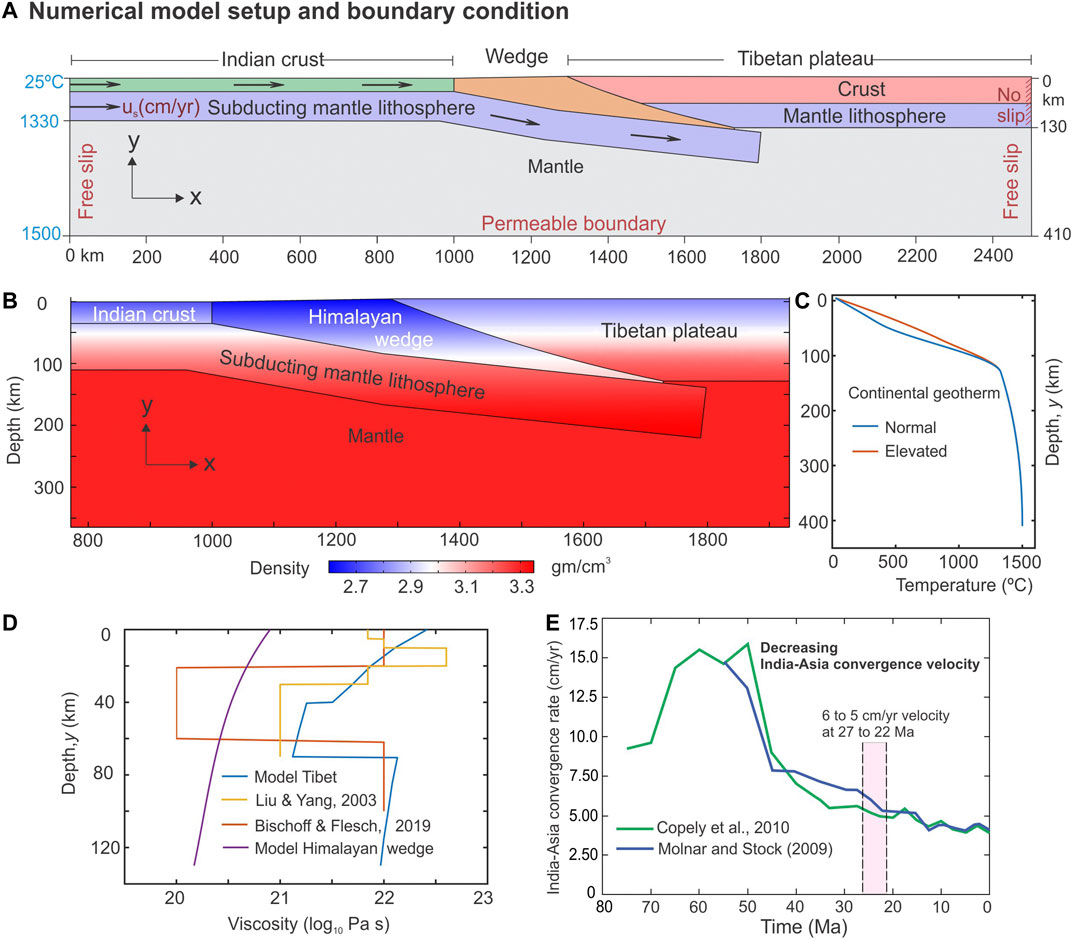
FIGURE 3. (A) Numerical model setup with thermal and kinematic boundary conditions used for the simulations. (B) The density profiles in the reference model. Note that we have considered materials of relatively lower density to constitute the model Himalayan wedge. This is based on the results of earlier spontaneously evolved numerical models, suggesting that the wedge consists of crushed materials derived from upper and mid-crustal rocks, therefore buoyant compared to the lithospheric plates (Burov and Yamato, 2008; Warren et al., 2008; Li and Gerya, 2009). (C) A comparative plot of normal and elevated geotherm in the Himalaya-Tibet system. Due to thermal equilibrium and radioactive heat production, the geotherm is considered to be elevated by 20 Ma (Beaumont et al., 2001). (D) The viscosity profiles for our model Tibet and Himalayan wedge have been plotted against previous studies for the same system (E).
We impose a set of mechanical and thermal boundary conditions in the initial/reference model (Figure 3A). The top model boundary is subjected to an atmospheric pressure condition that allows the top surface to deform and crustal materials to extrude upward. The left end of the Indian plate is subjected to an inflow velocity u (cm/yr), whereas the right end of the Tibetan lithosphere is assigned a fixed boundary (i.e., u = 0, stationary condition). The lower boundary of the mantle is permeable, which allows the material to flow out of the model domain and maintain the mass balance. The left and right vertical boundaries of the mantle are assigned to a free-slip condition.
Following the approach used in previous Himalaya-Tibet models (Jamieson et al., 2004; Rey et al., 2010), we consider two configurations of the thermal structure for our modeling (Figure 3C). In the case of the initial model (us = 8 cm/yr, before 30 Ma), the thermal structure is defined by the normal geotherm (Figure 3C) for continental lithosphere with T = 25°C at the surface, T = 400°C at 40 km depth, T = 600°C at 70 km depth, and T = 1,330°C at the lithosphere-asthenosphere boundary, 130 km depth (Turcotte and Schubert, 2002), which is assumed to have prevailed in the Himalaya-Tibet system earlier than 30 Ma. This inference gets support from the triaxial experiments of Rey et al., (2010) that predict the Moho temperature beneath the Tibetan plateau (at 70 km depth) must be around 500–600°C to develop a topographic elevation of 5 km in the Tibetan plateau by 30 Ma. However, the thermal gradient steepened subsequently due to crustal thickening and radiogenic heat production, and the Moho temperature beneath the plateau (at 70 km depth) possibly attained a higher value, ∼850°C at ∼25 Ma (Rey et al., 2010). In the second case (us = 5 cm/yr at 22 Ma), we thus choose an elevated geotherm (Figure 3B) with T = 25°C at surface, T = 550°C at 40 km depth, T = 850°C at 70 km depth, and T = 1,330°C at the lithosphere-asthenosphere boundary (130 km depth). In both cases, the bottom model boundary (410 km depth) is set at T = 1,500°C (Turcotte and Schubert, 2002; Li et al., 2011). The right and the left model boundaries are insulated, allowing no lateral heat outflux or influx into the model. Based on earlier numerical model data and geophysical estimates, the three principal layers of the Tibetan lithosphere: upper/middle crust, lower crust, and mantle lithosphere are assigned varying densities and viscosities (Table 1). We consider a power-law decay function (Sarkar et al., 2014) to represent decreasing viscosities (μ) of model materials with temperature (T):
where
We ran a series of two-dimensional thermo-mechanical numerical model experiments (Figure 3A), to find how reducing convergence rates, from 15 cm/yr to ≤5 cm/yr at ≤22 Ma controlled the deep-crustal extrusion processes and associated thermal structures in the Himalayan wedge. To investigate this, our initial/reference model is first subjected to a high-convergence velocity (8 cm/yr) condition, simulating the collision kinematics before 30 Ma (Copley et al., 2010). We then reduced the convergence velocity to 5 cm/yr, as applicable to the kinematic condition for 22 Ma (Molnar and Stock, 2009).
The reference model run with a high convergence velocity (8 cm/yr) showed no sign of crustal extrusion (v ∼ 0) in the Himalayan wedge, but dominated by sub-horizontal flows (u = 2–4 cm/yr) in the convergence direction (Figure 4A). The Himalayan wedge mediated the compressive stresses from the subducting plate to the overriding plate, resulting in wide-spread horizontal crustal shortening in the latter with high contractional strain rates (−6 × 10⁻¹⁴ s−1) (Figure 4B). The model suggests that the India-Asia collision at us = 8 cm/yr gave rise to a global crustal shortening without any appreciable focused uplift in the Himalayan wedge.
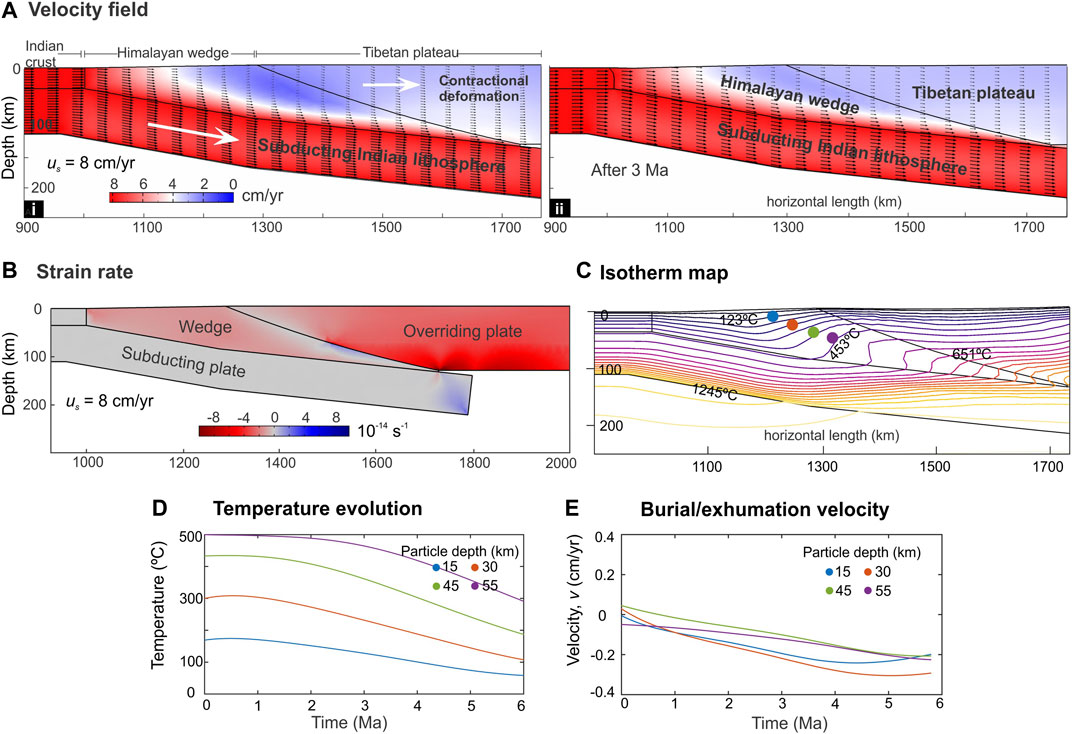
FIGURE 4. (A) Calculated plots of the magnitudes of velocity vectors, obtained from numerical simulations with us = 8 cm/yr. (B) Graphical plots of the horizontal strain rates (
At this high convergence rate, the subducting slab drags the crustal materials deep into the wedge, resulting in downward advection of isotherms, as typically reported from subduction zones (Figure 4C). We consider a set of locations at varying depths (15–55 km) in the model wedge for quantitative analysis of the spatio-temporal changes of temperature (T) and burial/extrusion rates. T at selected locations decreases in agreement with the downward advection of isotherms (Figure 4D). For example, at a depth of 30 km, the initial temperature (300°C) decreases to 100°C on a simulation run time of 6 Ma. We also plot spatio-temporal variations of the burial/extrusion rates in the model wedge for this high-velocity condition (Figure 4E). The subducting slab drags crustal materials downward for burial (negative vertical velocity components) at rates of −0.2 to −0.0.3 cm/yr measured in locations of 15–55 km depth.
There is a spectacular change in the crustal flow pattern in the Himalaya-Tibet system, marked by the appearance of a well-developed extrusion zone in the Himalayan wedge as the collision rate is reduced to a threshold value of 5 cm/yr (Figure 5A). At this stage, the overriding plate undergoes gravitational collapse to set in crustal flows counter to the convergence direction (∼1–1.5 cm/yr), leading to a transition from contraction to extensional deformation at a strain rate of 2 × 10⁻¹⁴ s−1 in adjacent to the wedge. On the other hand, the horizontal shortening mostly concentrates in the foreland region of the Himalayan wedge at rates of −6 × 10⁻¹⁴ s−1 (Figure 5B). We use this us = 5 cm/yr model to study the extrusion flow kinematics (discussed separately later). The crustal flow in the extrusion zone is found to occur at high velocities (3.5–4 cm/yr), which scale nearly to the subduction velocity, as also suggested by previous workers (e.g., Grujic et al., 2011). The wedge extrusion originates from a deep-crustal region (model estimate: ∼55–60 km) and meets the surface along an inclined (∼15°) trajectory (Figure 5A).
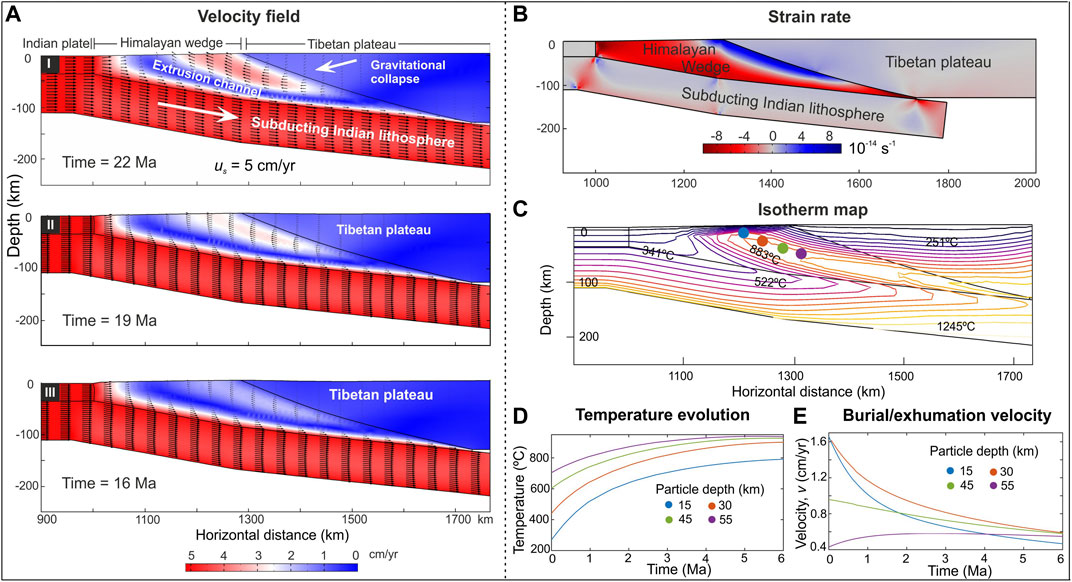
FIGURE 5. (A) Calculated plots of the magnitudes of velocity vectors, obtained from numerical simulations with us = 5 cm/yr. (B) Graphical plots of the horizontal strain rates (
The thermo-mechanical simulations with us = 5 cm/yr show visually contrasting isotherm structures compared to us = 8 cm/yr in the model Himalayan wedge, where the extrusion driven heat advection heavily folds the isotherms to convex upward, leading to an inverted thermal stratification (Figure 5C), reported as metamorphic inversion from the Greater Himalayan Sequence (Le Fort, 1975; Vannay and Grasemann, 2001). In the same set of locations, as chosen for us = 8 cm/yr in the model Himalayan wedge, a quantitative analysis of the spatio-temporal changes of temperature (T) and burial/extrusion rates shows that T reverses to follow positive trends with time, where the extrusion assisted heat advection largely contributes to heating at shallow depths (Figure 5D). For example, at a depth of 30 km, the initial temperature (300°C) increases to more than 800°C on the run time of 6 Ma (Figure 5D). Similarly, T at 45 km and 55 km increases from ∼600 to 910°C and ∼700 to 930°C, respectively, for the same time interval since the initiation of the wedge extrusion (Figure 5D).
The burial process is replaced by crustal extrusion (positive vertical velocity components) in those points when us = 5 cm/yr, and the extrusion rates range from 1.7 to 0.4 cm/yr (Figure 5E). Another important model observation is that the extrusion rates, in overall, show decreasing trends with time, e.g., the highest extrusion rate drops from an initial value of ∼1.6 cm/yr to 0.6 cm/yr on a time span of 6 Ma.
To study how the first-order surface topography in the Himalaya-Tibet system might respond to reducing convergence rates, we calculated the vertical velocity components at the top surface of our thermo-mechanical models (Figure 6A). The graphical plots show that the high-convergence rate gives rise to topographic upliftment mostly in the overriding plate, where the uplift rates (0.8 cm/yr) far exceed that occurring in the Himalayan wedge (0.2–0.4 cm/yr) (Figure 6Ai). But, the scenario dramatically changes following the appearance of a fully developed extrusion zone at us = 5 cm/yr when the topographic upliftment mainly concentrates in the Himalaya at 0.8–1.6 cm/yr, leaving the adjoining part in the overriding plate to subside at rates varying from −0.7 to 0.0 cm/yr (Figure 6Aii).
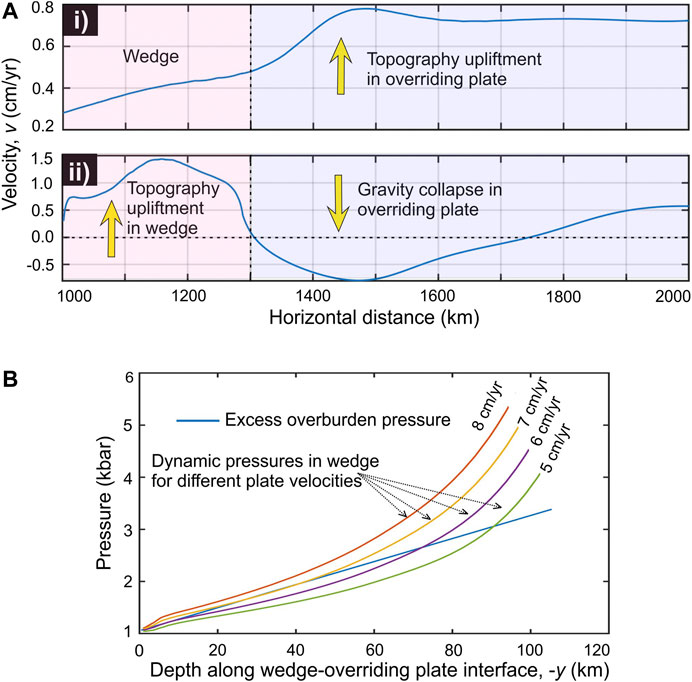
FIGURE 6. (A) Plots of the vertical velocity component measured on the top model surface, showing the topography evolution in the models for i) us = 8 cm/yr and ii) us = 5 cm/yr. (B) Calculated dynamic pressure (PDy) in the model orogenic wedge for varying subduction velocity (us). Note, at us = 6 cm/yr, PDy drops below the overburden pressure (POb) within a small part of the wedge. But, for us = 5 cm/yr, PDy becomes significantly less than POb over a large part of the wedge, resulting in a fully developed large-scale extrusion zone within the wedge.
From the analysis of lubrication dynamics, presented in Conceptualization of the Himalaya-Tibet Dynamic Coupling, we showed how a decreasing convergence velocity can significantly reduce the dynamic pressure in the wedge. In our thermo-mechanical numerical models, we observe that the initiation of wedge extrusion in the Himalaya does not occur unless the convergence rate (us) decreases to a threshold value (Figure 6B). Employing the concept of flow-induced dynamic pressure, as predicted from the lubrication mechanics, we explain here the underlying dynamics of it. The analytical solution (Eq. 1) of lubrication theory, for us = 8 cm/yr the dynamic pressure in the wedge is found to be high enough (PDy = 1–5.5 kb) to overcome the overburden pressure (POb = 1–3.5 kb) at the wedge-overriding plate interface (Figure 6B), and thereby support the gravity load of the overriding block. The POb estimate takes into account both the density difference between the wedge and overriding plate, and the topographic elevation of Tibet. This dynamic condition (PDy > POb) allows the Himalayan wedge to propagate the horizontal motion into the Tibetan crust, resulting in spatially distributed contractional deformations, but without forming any extrusion zone in the Himalayan wedge (Figure 4A). With us reduced to 5 cm/yr, there is a significant drop in PDy (1–2.6 kb) in the upper to middle region of the wedge (0–80 km; Figure 6B), which fails to support the overlying load, POb (1–2.9 kb). The unstable state (PDy < POb) eventually causes the overriding block to collapse till the stable condition, PDy = POb is attained in the system (Figure 2C). The collapse forces the crustal materials in the Himalaya to extrude toward the low-pressure region along a narrow zone (discussed separately in Exhumation of Deep-Crustal Rocks), and at the same time, extensional deformations initiate in the elevated Tibetan plateau, as revealed from the horizontal flow velocity field and extensional strain rates in the models (Figures 5A,B).
In our Himalaya-Tibet collision model, the wedge extrusion originates from a depth of around 55–65 km in the wedge (Figure 5A), and widens upward to cover a horizontal distance of ∼80 km on the surface. The extrusion zone is bounded by two crustal-scale ductile shear zones, comparable to the STDS and the HHD in the GHS (Figure 1B) (Montomoli et al., 2013; Wang et al., 2016; Carosi et al., 2018). The deeper (∼20–60 km) section of the extrusion zone runs nearly parallel to the wedge-overriding plate interface but attains an inclination of 8 to 10° while emerging to the surface. We have constructed three velocity profiles (A1, A2, and A3) across the extrusion zone in its lower (55 km), middle (35 km), and upper (20 km) segments (Figure 7B), primarily to study the extrusion flow kinematics. The velocity profiles show nearly a parabolic (Poiseuille type) flow velocities (maximum extrusion velocity: 3–3.5 cm/yr at the axis of extrusion zone), implying that the extrusion process is driven by a pressure gradient. The bottom portions of the velocity profiles describe a Couette type of flow occurring below the wedge extrusion zone, where the down-going plate drag takes control in setting the simple shear flow kinematics.
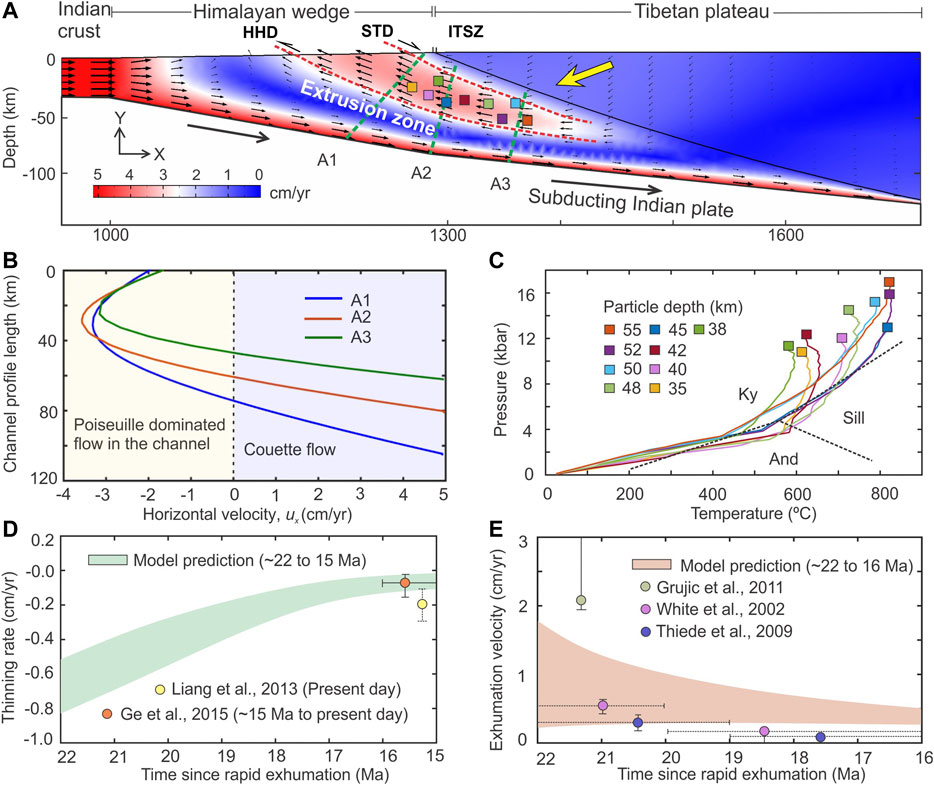
FIGURE 7. (A) Geometry of the wedge extrusion zone and interpreted positions of important tectonic boundaries in the Himalaya-Tibet system from our thermomechanical model (MCT; Main Central Thrust; STD; South Tibetan Detachments; ITSZ; Indus Tsangpo Suture Zones). (B) Velocity profiles measured along A1, A2, and A3 transects (dotted green lines shown in panel (A) suggest a hybrid flow kinematics within the extrusion zone. The flow kinematics is mainly dominated by Poiseuille flow, whereas by Couette flow at the base of the extrusion zone. (C) Model P-T paths derived from several Lagrangian particles (initial positions shown in panel (A), exhumed to the ground surface through the extrusion zone. (D) Temporal variation of vertical thinning rate in the overriding Tibet estimated from our model, which are compared with the available field data. (E) Model estimate showing the change in exhumation velocity from fast to slow with time, which are compared with available petrological data.
Using a Lagrangian approach, we track the material particles, located at varying depths along the extrusion zone to reconstruct the P-T-t paths of deep-crustal materials exhuming to the surface (Figure 7C). A particle located close to the base of the extrusion zone (depth: 55 km) attains a peak metamorphic condition with a pressure and temperature of ∼17 kb and ∼820°C, respectively, and its exhumation to the surface takes a time of 5.2 Ma (Supplementary Figure S2). On the other end, material particles located at relatively shallower depths (30–40 km) show a peak P and T in the range of 8–11 kb and 500–650°C, respectively, and they are exhumed to the surface in a lesser time (2–3.5 Ma). The time scale for the exhumation of deep-crustal materials thus ranges from 2 to 5.5 Ma (Supplementary Figure S2). From the P-T paths, it is evident that the peak P-T data of exhumed particles mostly fall in the kyanite stability field and some of them also pass through the sillimanite stability field (Figure 7B). Our model also allows us to constrain the most active phase of the exhumation process, which occurred at 22 Ma with convergence velocity 5 cm/yr as a short-lived 4 to 6 Ma event (Figure 5A). The wedge extrusion is expected to slow down afterward because the overriding plate collapse would progressively increase the dynamic pressure to attain a stable (PDy = POB) dynamic coupling between the Himalayan wedge and the overburden (Figure 2C). For the extrusion process to remain active, the unstable condition (PDy < POB) has to prevail in the Himalayan wedge, which can happen due to either a continued decrease in the Himalayan wedge viscosity or reduction of the subduction velocity further below 5 cm/yr (Figure 2D).
Our thermomechanical model as well as lubrication theory suggest that the extrusion event in the Himalaya was accompanied by gravitational collapse of the overriding block, resulting in vertical thinning in the Tibetan part. We have estimated a temporal variation of the vertical thinning rate in the model, which indicates that the thinning rate was maximum (∼0.8 cm/yr) during the initial stage of extrusion, which gradually decreased to <0.2 cm/yr over a time span of 6 Ma (Figure 7D). Another remarkable model finding is the transition from fast to slow exhumation process, where the rate of exhumation drops from 1.8 to 0.6 cm/yr (Figure 7E). The model estimates are validated with the available geophysical and petrological data, which we discuss in the next section.
By combining lubrication theory and thermo-mechanical numerical simulations, the alternative tectonic model we have presented in this paper explains the extrusion mechanics of deep-crustal rocks in the Himalaya and the spatio-temporal variations of their pressure-temperature conditions. The lubrication dynamics indicates that a slow-down of the India-Asia collision rate (15 cm/yr to <5 cm/yr) appears to be the causal factor in triggering the extrusion process in the form of a south-vergent extrusion zone in the Himalaya (Figures 5A, 7A), as proposed by earlier workers (Grujic et al., 1996; Vannay and Grasemann, 2001). However, unlike the previous models that account for focused surface erosion at the mountain front to show the GHS extrusion in the form of a channel (Beaumont et al., 2001), the present model suggests that the extrusion process has been entirely controlled by the coupled tectonics of the Himalayan wedge and the Tibetan plateau, where the collapse of the plateau forced the deep-crustal materials in the Himalaya to extrude along a narrow zone, without any necessary involvement of localized rheological weakening or focused surface erosion. The surface erosion probably influenced the size and shape of the surface expression of the extrusion zone (Figure 1A), and also facilitated the removal process to exhume the extruded materials to the surface. Recently, Piccolo et al., 2018 have shown that the channel flow of hot partially melted mid-crustal rocks in the Himalaya is not sensitive to enhanced surface erosion in the mountain front, and the erosion is not a necessary condition for GHS exhumation. Moreover, several workers have reported exhumation of deep crustal materials from other types of subduction settings without any role of focused surface erosion (Brun and Faccenna, 2008; Li et al., 2011; Malusa et al., 2015; Piccolo et al., 2018). These models suggest that the extrusion of high-pressure rocks is indeed possible without any active participation of localized surface erosion in convergent boundaries. To sum up this discussion, we propose along the same line that the wedge extrusion of HP rocks in the GHS is a consequence of the collapse of the Tibetan plateau in response to the reducing India-Asia convergence velocity. The extrusion process became most active when the convergence velocity dropped down to ∼5 cm/yr at ∼22 Ma, which falls within the activity period of HHD (27-17 Ma) (Figure 8A; Montomoli et al., 2013; Cottle et al., 2015; Khanal et al., 2015; Wang et al., 2016; Agustsson et al., 2016; Walters and Kohn, 2017; Carosi et al., 2018).
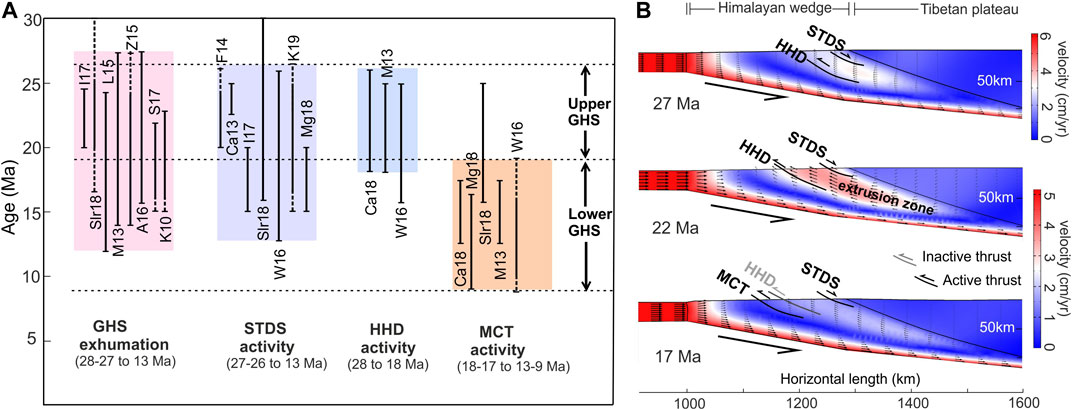
FIGURE 8. (A) Graphical plots of the geological ages of GHS exhumation and associated crustal scale shear zones (STDS, HHD, and MCT) in the Himalaya, compiled from available recent literature (I17: Iaccarino et al., 2017; Slr18: Soucy La Roche et al., 2018; L15: Leloup et al., 2015; M13: Montomoli et al., 2013; Z15: Zeiger et al., 2015; A16: Agustsson et al., 2016; S17: Shrestha et al., 2017; K10: Kellet et al., 2010; F14: Finch et al., 2014; Ca13: Carosi et al., 2013; W16: Wang et al., 2016; K18: Kellett et al., 2019; Mg18: Montemagni et al., 2018; Ca18: Carosi et al., 2018). (B) Numerical model showing initiation of the GHS exhumation zone, with STDS (extensional) and HHD (thrust) as the northern and southern bounding surfaces, followed by southward migration of its southern shear boundary to form MCT at 17 Ma. The convergence velocity was 6-5.5 cm/yr at 27 Ma, and 5 cm/yr at 22 Ma.
In the proposed Himalaya-Tibet model the wedge extrusion originates at a depth of around 50–60 km, and appears as a downward tapering narrow zone, bounded by an extensional shear zone (STDS) in north and a pair of thrust type shear zones (HHD and MCT) on south (Figure 8B). Available seismic sections of the Himalaya-Tibet system also show a similar tapered-wedge geometry for the GHS, traceable down to a depth of at least 55 km; it possibly goes beyond (Hauck et al., 1998; Jiménez-Munt et al., 2008; Godin and Harris, 2014; Clift, 2017). The model extrusion zone widens upward to expose deep-crustal materials on the surface over a stretch of ∼80 km (Figure 7A). Composite geological maps of the Himalaya show a large along-strike variation of the exposed width (25–120 km) of the GHS belt (Kellett et al., 2010; Spencer et al., 2012; Cooper et al., 2013). However, several lithospheric scale cross-sections of the Himalayan wedge provide a persistent thickness of the GHS to be in average 40 km (e.g., Godin and Harris, 2014) (Figure 1B), in good agreement with our model estimate (Figure 7A). But, our 2D model does not account for the lateral variations of the GHS width, mentioned above (Figure 1A; Carosi et al., 2018), which we infer to be the influence of some higher-order geological factors, such as local scale faulting, folding, and up-doming of gneissic rocks (Beaumont et al., 2001; Kellett et al., 2010). In addition, according to Piccolo et al., (2018) the varying upper crustal strength can significantly influence the exhumation patterns of metamorphic rocks in orogen. All these complexities in the tectonic processes in the brittle upper crust (top 5 km), coupled with surface erosion can result in strong spatial heterogeneity in the surface manifestation of the extrusion zone.
Our thermo-mechanical model shows Poiseuille-type l flows within the extrusion zone, where the velocity magnitude is maximum (3.4 cm/yr) along the axis of the extrusion zone, decreasing to its upper and bottom boundaries. There is a narrow zone of Couette flow below the extrusion zone. By combining the two types of crustal flow, we obtain a hybrid flow in the model (Figure 7B). Interestingly, several workers have proposed from the kinematic analyses of GHS rocks a similar hybrid flow model, dominated by the Poiseuille type (pipe-flow effect) (Grujic et al., 1996; Vannay and Grasemann, 2001; Grujic et al., 2002). The hybrid flow kinematics causes the isotherms to overturn, and ultimately gives rise to inverted metamorphic isograds (Figure 5C), a phenomenon extensively studied over many decades (Le Fort, 1975; Kohn, 2014 and references therein).
The timing of rapid GHS exhumation in the Himalaya has been extensively worked out; most of the data, available in the literature, point to early Miocene (23-21 Ma) (Hodges et al., 1992; Grujic et al., 1996; Catlos et al., 2002; White et al., 2002; Daniel et al., 2003; Najman et al., 2009). For example, using monazite geochronology of the GHS rocks from the Annapurna region of Central Nepal, Corrie and Kohn (2011) have shown the attainment of their peak metamorphic conditions at 25 to 23 Ma. The Bhutan Himalaya also records the peak temperatures dating back to 23 Ma, which continued at least to 16 Ma (Kellett et al., 2010). A similar metamorphic history (26-23 Ma) is established from the Sikkim Himalaya (Sorcar et al., 2014). However, many recent P-T-t and geochronological data (U-Th-Pb on monazite) demonstrated that exhumation in the GHS started as late as 28-27 Ma (Montomoli et al., 2013) or even older in Central Nepal (41 Ma in the uppermost GHS; Carosi et al., 2016). All these data presented above converge to the fact that the main phase of exhumation in the GHS occurred in between 22 to 28-27 Ma (Figure 8A). In earlier tectonic models the two bounding shear zones, the MCT and the STDS were considered to be synchronously active to show the exhumation of GHS rocks at 22 Ma (Burchfiel and Royden, 1985; Hodges et al., 1992, Beaumont et al., 2001). But, many recent studies seriously questioned their contemporaneous relation (Kohn, 2008; Carosi et al., 2013; Finch et al., 2014; Weinberg, 2016; Iaccarino et al., 2017, Carosi et al., 2018; Montemagni et al., 2019; Montemagni et al., 2020). It has been shown that the STDS initiated before 24-25 Ma (Figure 8A), as reported from western Nepal (Carosi et al., 2013; Soucy La Roche et al., 2018; Kellett et al., 2019), whereas the activity of MCT took place in a much later stage (18-17 Ma) (Montomoli et al., 2013; Wang et al., 2016; Montemagni et al., 2019). It seems more probable that the HHD, which is reported to have been active from 28 to 27 Ma to 18-17 Ma (Montomoli et al., 2013; Wang et al., 2016; Carosi et al., 2018) (Figure 8A), acted as a southern shear boundary of the GHS exhumation.
From our numerical simulations we have shown that a fully developed wedge-extrusion zone appeared at 22 Ma when the convergence velocity reduced to 5 cm/yr (Figure 5Ai). We ran simulations with higher convergence velocities (discussed in Supplementary) to constrain the timing of extrusion initiation. Models at 6 to 5.5 cm/yr show localization of an incipient extrusion zone (Supplementary Figure S3; Figure 8B), which clearly represents a juvenile stage of the fully developed extrusion zone discussed above. It is to be noted that the Indian-Asia convergence took place at the rates of 6 to 5.5 cm/yr during 28-27 Ma (Figure 3E). Our model thus predicts the GHS exhumation process (onset of retrograde metamorphism) to have initiated at around 27-22 Ma, and the associated P-T-t path, as reported in many recent works (Leloup et al., 2015; Zeiger et al., 2015; Wang et al., 2016; Iaccarino et al., 2017) (Figure 8A). The wedge extrusion evolved to attain a fully developed state at 22 Ma, resulting in the most active phase of rapid exhumation process, which subsequently slowed down to a large extent at 18 Ma (Figures 5A, 7A). The present model results also allow us to interpret that the extrusion zone in this time interval (28–18 Ma) was bounded by two crustal scale shear zones: STDS (extensional shear) in the north and HHD (thrust shear) in the south (Wang et al., 2016; Carosi et al., 2018). After 18 Ma, the southern shear boundary the wedge extrusion zone migrated southward, eventually resulting in initiation of the MCT after the most active phase of the GHS exhumation event (Figure 8B). This late initiation of MCT in the GHS evolution has been extensively reported in the recent publications (Montomoli et al., 2013; Carosi et al., 2016, Carosi et al., 2018; Wang et al., 2016; Montemagni et al., 2018) (Figure 8A).
The present lubrication model also establishes the extrusion zone formation in the Himalaya as a crustal process coupled with the gravity collapse and extensional tectonics in the Tibetan plateau (Figures 7A, D). Geological evidence suggests that most of the active thrusts in the central Tibet became dormant, implying a complete cessation of contractional deformations in Tibet by ∼23 Ma (Wang et al., 2014; Li et al., 2015). After 23 Ma, there was a dramatic tectonic inversion from contraction to extension, as documented from the widespread occurrence of extensional faults in the Tibetan upper crust (Wang et al., 2014; Ge et al., 2015). On the other hand, the activity of fully developed extrusion zone in the Himalayan wedge is found to prevail at ∼22 Ma, as discussed above. These two lines of observations imply a synchronous relation between the two tectonic processes, as seen in our thermo-mechanical model simulations (Figure 7A). Previous studies also inferred the collapse of Tibet as a driving factor for the southward migration of contractional deformation from the plateau interior toward the Himalayan wedge (Wang et al., 2014; Li et al., 2015). Based on the present-day data in Southern Tibet, Ge et al., (2015) estimated the thinning strain rate for the entire thick Tibetan crust (70 km) to be around 8 nanostrain/yr, assuming that the crustal thinning began at ∼15 Ma. This estimate corresponds to a vertical thinning rate of 0.56 mm/yr since 15 Ma. According to our model estimates, the overriding Tibetan plateau underwent vertical thinning at ∼8 mm/yr rates at the initial stage (∼22-Ma) of its collapse, but weakened gradually to 0.5 mm/yr after 6 Ma (Figure 7D), in good agreement with the estimation of Ge et al., 2015.
We also provide an estimate for the exhumation velocity (vertical extrusion rate) within the extrusion zone. The calculated exhumation velocity is found to be ∼18 mm/yr at ∼22 Ma and slowed down to ∼6 mm/yr within a time span of 6 Ma (Figure 7E). Petrological calculations of GHS rocks also suggest for the fast exhumation (>10 mm/yr) event during the period from 22 to 17 Ma (Ganguly et al., 2000; White et al., 2002; Najman et al., 2009; Thiede et al., 2009; Grujic et al., 2011; Carrapa et al., 2014; Clift, 2017). Although the actual magnitude of calculated exhumation rates varies to some extent (Figure 7E), they broadly agree upon a point that the exhumation in the Himalaya was rapid at ∼22 Ma, and then slowed down significantly after 17 Ma (i.e., the time of MCT initiation). Interestingly, this transition coincides with the timing of vorticity decrease during the southward migration of the deformation front, as estimated by Montemagni et al., (2020). The Himalayan wedge subsequently underwent a major reorganization of its tectonics, leading to a shift of the deformation front to the south of the MCT (White et al., 2002; Wang et al.2014).
Looking at the spatial dispositions of metamorphic grades in the Himalaya, one can find the GHS as a high-grade metamorphic belt, sandwiched between two low-grade metamorphic terrains: the Lower Himalayan Sequence (LHS) on the south and the Tethyan Himalayan Sequence (THS) on the north. In the LHS-GHS-THS package, the grade of metamorphism shows an asymmetrical spatial variation, with the highest grade located closer to the MCT (i.e. GHS-LHS boundary) (Metcalfe, 1993; Corrie and Kohn, 2011; Kohn, 2014). We validate our model results using this asymmetrical pattern. The model-calculated pressure (P) and temperature (T) are plotted as a function of horizontal distance across the channel and compared with available petrological data from the exhumed high-pressure rocks (Figures 9A,B) in the GHS. The plots are strikingly asymmetrical; the temperature steeply increases across the MCT, (from T = 550–600°C in LHS to T = 700–820°C in the GHS) to attain a peak temperature (T = 820°C) at a location (20 km from the MCT) in the GHS, and it then decreases at a gentle gradient toward the north (T = 650–700°C at the STDS) (Figure 9A). The pressure plot for exhumed materials shows a similar asymmetrical trend: P = 6–8 kb in the LHS, which reaches a peak value of 10–15 kb within the GHS, then dropping to around 7–8 kb near STDS (Figure 9B). It is interesting to note that the location of peak P coincides with that of peak T. We have compared our model P-T profiles with the petrological data reported for the LHS-GHS-THS litho-packet from several sections in the Himalaya, such as eastern Garhwal, central Nepal, Langtang region in Bhutan and Sikkim (Figures 9A,B) (Kohn, 2008; Kellett et al., 2010; Spencer et al., 2012; Sorcar et al., 2014). Our model estimates tally well with the petrological calculations, where both pressure and temperature of exhumed HP rocks near the MCT region (P = 8–15 kb and T = 700–800°C) grossly higher than that adjacent to STDS (P = 5–10 kb and T = 600–750°C). This P-T variation across the GHS can be explained from the kinematics of wedge extrusion in the present model. Above the MCT, the extrusion zone exhumes crustal materials from relatively deeper depths than below the STDS (Figure 7A).
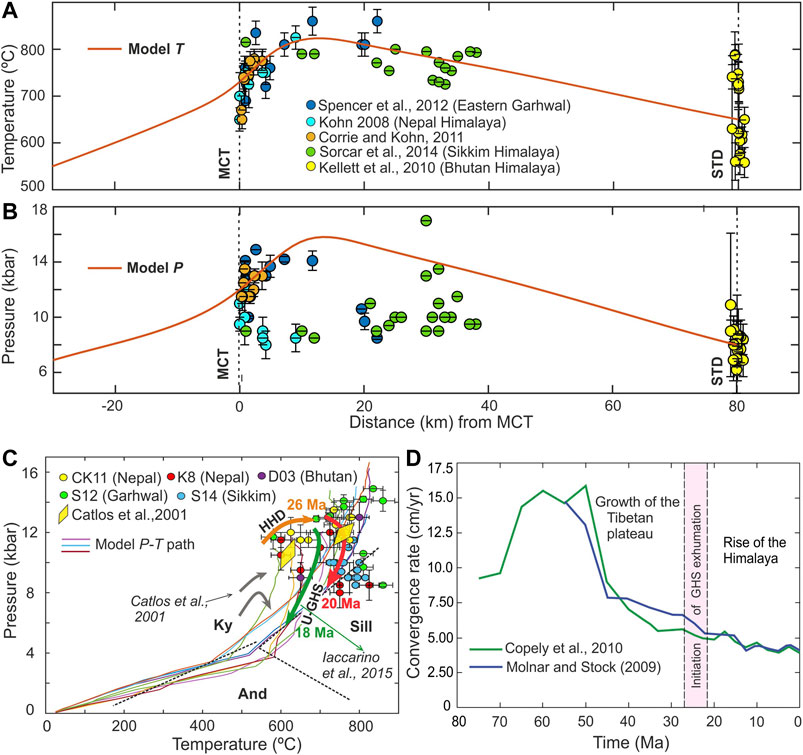
FIGURE 9. Spatial variations of model (A) temperature and (B) pressure (orange lines) calculated from exhumed particles, initially located at different positions within the extrusion zone. The model estimates are compared with the petrological data (circles with error bar) reported from different regions of the Himalaya. (C) Comparison between model and petrological peak P-T-t data. Bold colored lines indicate exhumed P-T paths of several Lagrangian particles. The black dashed lines show the stability field of kyanite (Ky), andalusite (And), and sillimanite (Sill) aluminosilicate phases (Abbreviations CK11: Corrie and Kohn, 2011; K8: Kohn, 2008; D13: Daniel et al., 2003; S12: Spencer et al., 2012; S14: Sorcar et al., 2014). (D) Variation in India-Asia convergence velocity with time. When us ≥ 6 cm/yr (before 27 Ma) there was major contractional deformation in the Tibetan plateau, which resulted in an increase of Tibetan plateau elevation. At us ≤ 5 cm/yr (after 22 Ma) the plateau started to collapse, while Himalaya began to rise at its southern margin.
In our model, the peak P-T data of extruded HP rocks mostly fall in the kyanite stability field, and few in the sillimanite stability field (Figure 9C). This finding is supported by the petrological data reported from different regions of GHS in the Himalaya. Most of the petrological peak P-T data, compiled from the north-western Himalaya, the central Himalaya (Kumaun to Langtang), and Bhutan track the kyanite stability field (Catlos et al., 2001; Daniel et al., 2003; Kohn, 2008; Corrie and Kohn, 2011; Spencer et al., 2012; Kohn, 2014). But some rocks in the Nyalum to Sikkim Himalaya, including structurally highest rocks in the Langtang region plot well within the sillimanite stability field (Kohn, 2014; Sorcar et al., 2014). The corresponding model P-T paths, on average, fall in the line of the petrological calculations (Catlos et al., 2001; Kohn, 2014; Iaccarino et al., 2015; Wang et al., 2016; Iaccarino et al., 2017; Waters, 2019) (Figure 9C). Our model peak P-T data provide an interpretation for the occurrence of eclogites (P > 1.5 GPa) in the central and eastern Himalaya (Lombardo and Rolfo, 2000; Corrie et al., 2010). However, the present study does not account for the western Himalayan eclogites (coesite bearing) of the Kaghan valley and Tso Morari nappe, which records a different exhumation history with the peak pressures, going up to 3 GPa (O’Brien et al., 2001; O’Brien, 2019). The reason is that our modeling is based on a low-dip subduction setting for the Indian lithosphere, as applicable to the India-Asia collision system since 40–45 Ma (Chemenda et al., 2000; Jiménez-Munt et al., 2008; Gloaguen and Ratschbacher, 2011), and it cannot justify the exhumation of crustal rocks from depths ≥100 km. Before 40–45 Ma, the oceanic Tethyan lithosphere most probably had a steeper subduction angle (Figure 10A). Such steep subduction of the Tethyan lithosphere at high velocity (>15 cm/yr) (Figures 4A,E) could drag crustal materials to greater depths (>100 km). A subduction velocity drop to 10 cm/yr during the oceanic to continental collisional tectonic transition (Figure 10B) might favor an exhumation of deep crustal rocks, as predicted from lubrication theory (Figure 2D) (Maiti and Mandal, 2020). We extrapolate our model results to suggest that a sharp velocity drop during 45–50 Ma (Figure 9D) could facilitate the exhumation of coesite bearing eclogites (P ≈ 3 GPa) to shallower levels (40 km) in the western Himalaya (Kohn and Parkinson, 2002). During the second event (around 22 Ma) of significant subduction velocity drop (to 5 cm/yr; Figure 9D) and consequent thermal heating of the Himalayan wedge, these rocks were exhumed to the surface (Figure 10C).
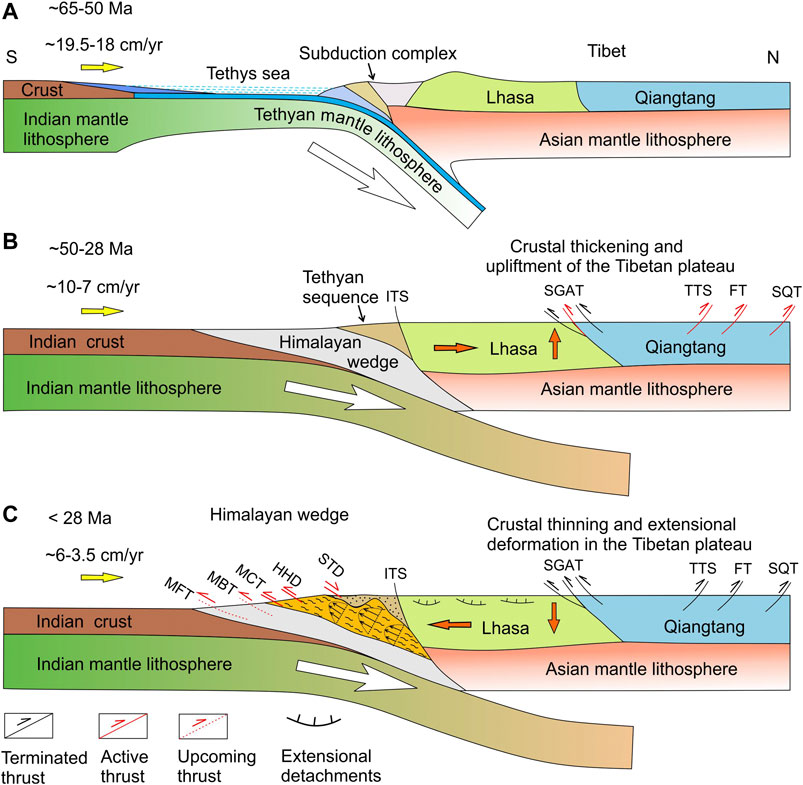
FIGURE 10. A schematic presentation of the tectonic evolution in the India-Asia collision system (after Wang et al., 2014; Li et al., 2015). (A) Subduction of the Tethyan lithosphere against the Asian continental plate. (B) Disappearance of the Tethys sea and development of the India-Asia continental contact. At this stage, the Himalayan wedge started to grow along with the upliftment of the Tibetan plateau. (C) Collapse of the Tibetan plateau and initiation of extrusion zone in the Himalayan wedge. Bold orange arrows show crustal-flow directions. ITS, indus tsangpo suture zone; FT, fenghuo shan–nangqian thrust belt; MBT, main boundary thrust; MCT, main central thrust; MFT, main frontal thrust; SGAT, shiquanhe–gaize–amdo thrust belt; STD, south tibetan detachment systems; SQT, Southern Qaidam thrust belt; TTS, Tanggula Shan thrust belt.
The lubrication dynamics allows us to decipher that the collapse of the overriding plate would progressively weaken on a time span of 4–6 Ma, as discussed earlier, eventually causing the extrusion process to slow down for the same convergence velocity of 5 cm/yr (Figure 5A). This time-dependent weakening of the wedge extrusion, predicted from our theoretical calculations as well as numerical model, is indeed reflected in the geological records that indicate the rapid phase of GHS exhumation to phase out at around 17 Ma (Ganguly et al., 2000; White et al., 2002; Najman et al., 2009; Clift, 2017). For example, using Sr-Nd isotope analysis of sediments and 40Ar˗39Ar ages of detrital micas, White et al., 2002 suggested that the rocks in lower Dharamsala groups (21-17 Ma) were derived from a rapidly exhumed high-grade metamorphic slab of GHS, whereas the Upper Dharamsala groups (17-13 Ma) of rocks were from low-grade metamorphic rocks. Based on these geological evidence, they postulated southward shifting of the active deformation zone, following weakening of the rapid exhumation process in the GHS after 17 Ma Similarly, Najman et al., (2009) showed exceptionally fast exhumation of high-grade rocks in the GHS during 21 to 17 Ma, witnessing nearly zero lag time between the cooling of exhumed rocks in GHS and their subsequent deposition in the mountain front. On the contrary, the lag time increased substantially, by around 6 Ma during the period of 17 to12 Ma, pointing to a remarkable slowdown of the exhumation process in the Himalaya after 17 Ma. The lag time then stretched more, implying a further slowdown in the exhumation process after 12 Ma (Clift, 2017). Our model suggests that the wedge extrusion, after its fully developed form at ∼22 Ma, remained active to sustain deep-crustal exhumation at high rates (>1 cm/yr) for a time duration of 4–6 Ma. After this active phase, it started to weaken as the system tended to restore its stable state. The wedge extrusion could continue to operate steadily, had the convergence velocity dropped at higher rates. It is to note here, one can see in the India-Asia collision history that the convergence velocity has dropped from ∼5 cm/yr at ∼22 Ma to ∼3.5 cm/yr at around 10 Ma (Molnar and stock, 2009; Copley et al., 2010); since then the change in the collision rate occurred at a much slow pace (Figure 9D). Based on the lubrication dynamics, we thus suggest that the most active phase of exhumation lasted till 17 Ma, and then it started to slow down with southward migration of the deformation front and initiation of the MCT. Finally, we combine the geological history with our thermo-mechanical model results to show the evolution of the Himalaya-Tibetan tectonics in three stages in Figure 10.
From the thermo-mechanical model results, supported largely with petrological, seismic, and field data from the Himalaya-Tibet system, we conclude the following. 1) High-pressure rocks in the Greater Himalaya Sequence underwent extrusion from a deeper region in the rheologically coherent ductile Himalayan wedge, rather than from a melt weakened mid-crustal layer beneath Tibet, proposed in earlier models. 2) The wedge extrusion was driven primarily by the gravity collapse of the overriding Tibet and it became most active when the Indian-Asia convergence velocity to ∼5 cm/yr at ∼22 Ma. According to our model, the erosion does not seem to be the driving factor for deep-crustal extrusion, although it might have controlled the ultimate surface manifestation of the extruded GHS rocks. 3) The wedge-extrusion zone in its most active phase (22-17 Ma) had a downward tapered geometry, bounded by two ductile-shear zones: an extensional (STDS) zone in the north and a thrust (HHD) in the south, which subsequently migrated southward to form MCT at 17 Ma. 4) Our thermo-mechanical model successfully explains the inverted metamorphic isograds observed in the GHS. The inversion is a consequence of the hybrid flow kinematics, dominated by a Poiseuille flow within the extrusion zone and a Couette flow at its base. 5) The estimated peak pressures (10–17 kb) and temperatures (700–820°C) of exhumed GHS rocks and their asymmetric pattern, characterized by P-T peaks close to the southern boundary (above MCT) are consistent with petrologic data. 6) The lubrication dynamics presented here accounts for the fast exhumation (>1 cm/yr) event (22-17 Ma) in the GHS, which falls within the activity period of HHD (28-17 Ma) before the initiation of MCT, as reported in the literature. Finally, our model suggests that the extrusion process in the GHS slowed down further after 10 Ma as the India-Asia convergence velocity did not significantly drop anymore.
All the necessary information to reproduce the results are presented in the article/Supplementary Material and listed in Table 1. Petrological data used for comparison of model results are from Spencer et al., (2012), Khon (2008), Corrie and Khon (2011), Sorcar et al., (2014), Kellett et al., (2010), and Daniel et al., (2003). Further inquiries can be directed to the corresponding authors
All authors listed have made a substantial, direct, and intellectual contribution to the work and approved it for publication.
This work has been supported by the DST-SERB through JC. Bose fellowship (SR/S2/JCB-36/2012) to NM and CSIR Senior Research Fellowship to GM.
We thank two reviewers and Editor Guillermo Booth-Rea for their excellent comments and constructive suggestions to improve the interpretation and presentation of our model results. Our study has greatly benefitted from their valuable discussions. Commercial finite element code COMSOL Multiphysics (2015) has been used to conduct the numerical simulations presented in this article. All the necessary information to reproduce the results are presented in the text and listed in Table 1. Petrological data used for comparison of model results are from Spencer et al., (2012), Khon (2008), Corrie and Khon (2011), Sorcar et al., (2014), Kellett et al., (2010), and Daniel et al., (2013).
The authors declare that the research was conducted in the absence of any commercial or financial relationships that could be construed as a potential conflict of interest.
The Supplementary Material for this article can be found online at: https://www.frontiersin.org/articles/10.3389/feart.2021.632806/full#supplementary-material.
Agard, P., Yamato, P., Jolivet, L., and Burov, E. (2009). Exhumation of oceanic blueschists and eclogite in subduction zones: timing and mechanisms. Earth-Science Rev. 92 (1–2), 53–79. doi:10.1016/j.earscirev.2008.11.002
Agustsson, K. S., Gordon, S. M., Long, S. P., Seward, G. G. E., Zeiger, K., and Penfold, M. (2016). Pressure–temperature–structural distance relationships within Greater Himalayan rocks in eastern Bhutan: implications for emplacement models. J. Metamorph. Geol. 34, 641–662. doi:10.1111/jmg.12197
Bayet, L., John, T., Agard, P., Gao, J., and Li, J. L. (2018). Massive sediment accretion at ∼80 km depth along the subduction interface: evidence from the southern Chinese Tianshan. Geology 46 (6), 495–498. doi:10.1130/G40201.1
Beaumont, C., Jamieson, R. A., Nguyen, M. H., and Lee, B. (2001). Himalayan tectonics explained by extrusion of a low-viscosity crustal channel coupled to focused surface denudation. Nature 414 (6865), 738–742. doi:10.1038/414738a
Bebout, G. E., and Penniston-Dorland, S. C. (2016). Fluid and mass transfer at subduction interfaces-The field metamorphic record. Lithos 240–243, 228–258. doi:10.1016/j.lithos.2015.10.007
Bischoff, S., and Flesch, L. (2019). Impact of lithospheric strength distribution on India-eurasia deformation from 3-D geodynamic models. J. Geophys. Res.: Solid Earth 124, 1084–1105. doi:10.1029/2018JB015704
Brun, J. P., and Faccenna, C. (2008). Exhumation of high-pressure rocks driven by slab rollback. Earth Planet. Sci. Lett. 272 (1–2), 1–7. doi:10.1016/j.epsl.2008.02.038
Burchfiel, B. C., and Royden, L. H. (1985). North-south extension within the convergent Himalayan region. Geology 13, 679–682. doi:10.1130/0091-7613(1985)13<679:NEWTCH>2.0.CO;2
Burov, E., and Yamato, P. (2008). Continental plate collision, P-T-t-z conditions and unstable vs. stable plate dynamics: insights from thermo-mechanical modelling. Lithos 103 (1–2), 178–204. doi:10.1016/j.lithos.2007.09.014
Carosi, R., Montomoli, C., and Iaccarino, S. (2018). 20 years of geological mapping of the metamorphic core across Central and Eastern Himalayas. Earth-Science Rev. 177, 124–138. doi:10.1016/j.earscirev.2017.11.006
Carosi, R., Montomoli, C., Iaccarino, S., Massonne, H. J., Rubatto, D., Langone, A., et al. (2016). Middle to late eocene exhumation of the greater himalayan sequence in the central himalayas: progressive accretion from the Indian plate. Bull. Geol. Soc. Am. 128, 1571–1592. doi:10.1130/B31471.1
Carosi, R., Montomoli, C., Rubatto, D., and Visonà, D. (2013). Leucogranite intruding the south Tibetan detachment in western Nepal: implications for exhumation models in the himalayas. Terra Nov. 25, 478–489. doi:10.1111/ter.12062
Carrapa, B., Orme, D. A., DeCelles, P. G., Kapp, P., Cosca, M. A., and Waldrip, R. (2014). Miocene burial and exhumation of the India-Asia collision zone in southern Tibet: response to slab dynamics and erosion. Geology 42 (5), 443–446. doi:10.1130/G35350.1
Catlos, E. J., Harrison, T. M., Kohn, M. J., Grove, M., Ryerson, F. J., Manning, C. E., et al. (2001). Geochronologic and thermobarometric constraints on the evolution of the main central thrust, central Nepal himalaya. J. Geophys. Res.: Solid Earth. 106, 16177–16204. doi:10.1029/2000jb900375
Catlos, E. J., Harrison, T. M., Manning, C. E., Grove, M., Rai, S. M., Hubbard, M. S., et al. (2002). Records of the evolution of the Himalayan orogen from in situ Th-Pb ion microprobe dating of monazite: eastern Nepal and western Garhwal. J. Asian Earth Sci. 20, 459–479. doi:10.1016/S1367-9120(01)00039-6
Chemenda, A. I., Burg, J. P., and Mattauer, M. (2000). Evolutionary model of the Himalaya-Tibet system: geopoem based on new modelling, geological and geophysical data. Earth Planet. Sci. Lett. 174 (3–4), 397–409. doi:10.1016/S0012-821X(99)00277-0
Clark, M. K., and Royden, L. H. (2000). Topographic ooze: building the eastern margin of Tibet by lower crustal flow. Geology 28 (8), 703–706. doi:10.1130/0091-7613(2000)28<703:TOBTEM>2.0.CO;2
Clift, P. D. (2017). Cenozoic sedimentary records of climate-tectonic coupling in the Western Himalaya. Prog. Earth Planet. Sci. 4 (1), 39. doi:10.1186/s40645-017-0151-8
Cooper, F. J., Hodges, K. V., and Adams, A. (2013). Metamorphic constraints on the character and displacement of the south Tibetan fault system, central bhutanese himalaya. Lithosphere 5 (1), 67–81. doi:10.1130/L221.1
Copley, A., Avouac, J. P., and Wernicke, B. P. (2011). Evidence for mechanical coupling and strong Indian lower crust beneath southern Tibet. Nature 472 (7341), 79–81. doi:10.1038/nature09926
Copley, A., Avouac, J. P., and Royer, J. Y. (2010). India-Asia collision and the Cenozoic slowdown of the Indian plate: implications for the forces driving plate motions. J. Geophys. Res. Solid Earth 115 (3), 1–14. doi:10.1029/2009JB006634
Copley, A., and Mckenzie, D. (2007). Models of crustal flow in the India-Asia collision zone. Geophys. J. Int. 169 (2), 683–698. doi:10.1111/j.1365-246X.2007.03343.x
Corrie, S. L., and Kohn, M. J. (2011). Metamorphic history of the central Himalaya, Annapurna region, Nepal, and implications for tectonic models. Bull. Geol. Soc. America 123 (9–10), 1863–1879. doi:10.1130/B30376.1
Corrie, S. L., Kohn, M. J., and Vervoort, J. D. (2010). Young eclogite from the greater himalayan sequence, Arun valley, eastern Nepal: P-T-t path and tectonic implications. Earth Planet. Sci. Lett. 289 (3–4), 406–416. doi:10.1016/j.epsl.2009.11.029
Cottle, J. M., Larson, K. P., and Kellett, D. A. (2015). How does the mid-crust accommodate deformation in large, hot collisional orogens? A review of recent research in the Himalayan orogen. J. Struct. Geol., 78, 119–133. doi:10.1016/j.jsg.2015.06.008
Crameri, F., Schmeling, H., Golabek, G. J., Duretz, T., Orendt, R., Buiter, S. J. H., et al. (2012). A comparison of numerical surface topography calculations in geodynamic modelling: an evaluation of the “sticky air” method. Geophys. J. Int. 189, 38–54. doi:10.1111/j.1365-246X.2012.05388.x
Cutts, J. A., Smit, M. A., and Vrijmoed, J. C. (2020). Evidence for non-lithostatic pressure in subducted continental crust. Contrib. Mineralogy Petrology 175 (1), 1–15. doi:10.1007/s00410-019-1633-z
Dahlen, F. A., Suppe, J., and Davis, D. (1984). Mechanics of fold-and-Thrust belts and accretionary wedges: cohesive coulomb theory. J. Geophys. Res. 89 (B12), 10087–10101. doi:10.1029/JB089iB12p10087
Daniel, C. G., Hollister, L. S., Parrish, R. R., and Grujic, D. (2003). Exhumation of the main central thrust from lower crustal depths, Eastern Bhutan Himalaya. J. Metamorph Geol. 21 (4), 317–334. doi:10.1046/j.1525-1314.2003.00445.x
Dasgupta, R., and Mandal, N. (2018). Surface topography of the overriding plates in bi-vergent subduction systems: a mechanical model. Tectonophysics 746, 280–295. doi:10.1016/j.tecto.2017.08.008
DeCelles, P. G., Quade, J., Kapp, P., Fan, M., Dettman, D. L., and Ding, L. (2007). High and dry in central Tibet during the late Oligocene. Earth Planet. Sci. Lett. 253 (3–4), 389–401. doi:10.1016/j.epsl.2006.11.001
Duarte, J. C., Schellart, W. P., and Cruden, A. R. (2015). How weak is the subduction zone interface? Geophys. Res. Lett. 42 (8), 2664–2673. doi:10.1002/2014GL062876
Ernst, W. G., Maruyama, S., and Wallis, S. (1997). Buoyancy-driven, rapid exhumation of ultrahigh-pressure metamorphosed continental crust. Proc. Natl. Acad. Sci. USA 94 (18), 9532–9537. doi:10.1073/pnas.94.18.9532
Finch, M., Hasalová, P., Weinberg, R. F., and Fanning, C. M. (2014). Switch from thrusting to normal shearing in the Zanskar shear zone, NW Himalaya: Implications for channel flow. Bull. Geol. Soc. Am., 126, 892–924. doi:10.1130/B30817.1
Flesch, L. M., Holt, W. E., Silver, P. G., Stephenson, M., Wang, C. Y., and Chan, W. W. (2005). Constraining the extent of crust-mantle coupling in central Asia using GPS, geologic, and shear wave splitting data. Earth Planet. Sci. Lett. 238 (1–2), 248–268. doi:10.1016/j.epsl.2005.06.023
Flesch, L. M., John, H. A., and Holt, E. (2001). Dynamics of the India‐Eurasia collision zone. J. Geophys. Res.: Solid Earth 106, 435–460. doi:10.1029/2001JB000208
Fullsack, P. (1995). An arbitrary Lagrangian‐Eulerian formulation for creeping flows and its application in tectonic models. Geophys. J. Int. 120, 1–23. doi:10.1111/j.1365-246X.1995.tb05908.x
Ganguly, J., Dasgupta, S., Cheng, W., and Neogi, S. (2000). Exhumation history of a section of the Sikkim Himalayas, India: records in the metamorphic mineral equilibria and compositional zoning of garnet. Earth Planet. Sci. Lett. 183, 471–486. doi:10.1016/S0012-821X(00)00280-6
Ge, W. P., Molnar, P., Shen, Z. K., and Li, Q. (2015). Present-day crustal thinning in the southern and northern Tibetan Plateau revealed by GPS measurements. Geophys. Res. Lett. 42 (13), 5227–5235. doi:10.1002/2015GL064347
Gloaguen, R., and Ratschbacher, L. (2011). Growth and collapse of the Tibetan plateau: introduction. Geol. Soc. Spec. Publ. 353, 1–8. doi:10.1144/SP353.1
Godin, Laurent., and Harris, L. B. (2014). Tracking basement cross-strike discontinuities in the Indian crust beneath the Himalayan orogen using gravity data—relationship to upper crustal faults. Geophys. J. Int. 198 (1), 198–215. doi:10.1093/gji/ggu131
Godin, L., Grujic, D., Law, R. D., and Searle, M. P. (2006). Channel flow, ductile extrusion and exhumation in continental collision zones: an introduction. Geol. Soc. Spec. Publ. 268, 1–23. doi:10.1144/GSL.SP.2006.268.01.01
Ghosh, D., Maiti, G., and Mandal, N. (2020). Slab-parallel advection versus Rayleigh-Taylor instabilities in melt-rich layers in subduction zones: a criticality analysis. Phys. Earth Planet. Inter., 307, 106560. doi:10.1016/j.pepi.2020.106560
Grujic, D., Casey, M., Davidson, C., Hollister, L. S., Ktindig, R., Pavlis, T., et al. (1996). Ductile extrusion of the Higher Himalayan Crystalline in Bhutan: evidence from quartz microfabrics. Tectonophysics. 260, 21–43. doi:10.1016/0040-1951(96)00074-1
Grujic, D., Hollister, L. S., and Parrish, R. R. (2002). Himalayan metamorphic sequence as an orogenic channel: insight from Bhutan. Earth Planet. Sci. Lett. 198 (1–2), 177–191. doi:10.1016/S0012-821X(02)00482-X
Grujic, D., Warren, C. J., and Wooden, J. L. (2011). Rapid synconvergent exhumation of Miocene-aged lower orogenic crust in the eastern Himalaya. Lithosphere. 3 (5), 346–366. doi:10.1130/L154.1
Hamrock, B. J. (1991). Fundamentals fluid film lubrication. Washington, DC: NASA Publication, 301–318.
Harrison, T. M. (2006). Did the Himalayan crystallines extrude partially molten from beneath the Tibetan Plateau? Geol. Soc. Spec. Publ. 268, 237–254. doi:10.1144/GSL.SP.2006.268.01.11
Hauck, M. L., Nelson, K. D., Brown, L. D., Zhao, W., and Ross, A. R. (1998). Crustal structure of the Himalayan orogen at −90° east longitude from project INDEPTH deep reflection profiles. Tectonics. 17 (4), 481–500. doi:10.1029/98TC01314
He, L. (2014). Numerical modeling of convective erosion and peridotite-melt interaction in big mantle wedge: implications for the destruction of the North China Craton. J. Geophys. Res.: Solid Earth. 119, 3662–3677. doi:10.1002/2013JB010657
Hodges, K. V., Parrish, R. R., Housh, T. B., Lux, D. R., Burchfiel, B. C., Royden, L. H., et al. (1992). Simultaneous Miocene extension and shortening in the himalayan orogen. Science. 258, 1466–1470. doi:10.1126/science.258.5087.1466
Iaccarino, S., Montomoli, C., Carosi, R., Massonne, H. J., Langone, A., and Visonà, D. (2015). Pressure-temperature-time-deformation path of kyanite-bearing migmatitic paragneiss in the Kali Gandaki valley (Central Nepal): investigation of Late Eocene-Early Oligocene melting processes. Lithos. 231, 103–121. doi:10.1016/j.lithos.2015.06.005
Iaccarino, S., Montomoli, C., Carosi, R., Massonne, H. J., and Visonà, D. (2017). Geology and tectono-metamorphic evolution of the himalayan metamorphic core: insights from the mugu karnali transect, western Nepal (central himalaya). J. Metamorph. Geol. 35, 301–325. doi:10.1111/jmg.12233
Jamieson, R. A., Beaumont, C., Medvedev, S., and Nguyen, M. H. (2004). Crustal channel flows: 2. Numerical models with implications for metamorphism in the Himalayan-Tibetan orogen. J. Geophys. Res. Solid Earth. 109 (6), 1–24. doi:10.1029/2003JB002811
Jiménez-Munt, I., Fernàndez, M., Vergés, J., and Platt, J. P. (2008). Lithosphere structure underneath the Tibetan Plateau inferred from elevation, gravity and geoid anomalies. Earth Planet. Sci. Lett. 267 (1–2), 276–289. doi:10.1016/j.epsl.2007.11.045
Kellett, D. A., Cottle, J. M., and Larson, K. P. (2019). The South Tibetan detachment system: history, advances, definition and future directions. Geol. Soc. Spec. Publ. 483, 377–400. doi:10.1144/SP483.2
Kellett, D. A., grujic, D., Warren, C., Cottle, J., Jamieson, R., and Tenzin, T. (2010). Metamorphic history of a syn-convergent orogen-parallel detachment: the South Tibetan detachment system, Bhutan Himalaya. J. Metamorph Geol. 28 (8), 785–808. doi:10.1111/j.1525-1314.2010.00893.x
Khanal, S., Robinson, D. M., Kohn, M. J., and Mandal, S. (2015). Evidence for a far-traveled thrust sheet in the Greater Himalayan thrust system, and an alternative model to building the Himalaya. Tectonics. 34, 31–52. doi:10.1002/2014TC003616
Kohn, M. J. (2014). Himalayan metamorphism and its tectonic implications. Annu. Rev. Earth Planet. Sci. 42, 381–419. doi:10.1146/annurev-earth-060313-055005
Kohn, M. J. (2008). P-T-t data from central Nepal support critical taper and repudiate large-scale channel flow of the Greater Himalayan Sequence. Bull. Geol. Soc. America. 120 (3–4), 259–273. doi:10.1130/B26252.1
Kohn, M. J., and Parkinson, C. D. (2002). Petrologic case for Eocene slab breakoff during the Indo-Asian collision. Geology. 30 (7), 591–594. doi:10.1130/0091-7613(2002)030<0591:PCFESB>2.0.CO;2
Kumar, P., Yuan, X., Kind, R., and Ni, J. (2006). Imaging the colliding Indian and Asian lithospheric plates beneath Tibet. J. Geophys. Res. Solid Earth. 111 (6), 1–11. doi:10.1029/2005JB003930
Le Fort, P. (1975). Himalayas: the collided range. Present knowledge of the continental arc. Am. J. Sci. 134 (1–3), 75–90. doi:10.1016/0040-1951(87)90250-2
Leloup, P. H., Liu, X., Mahéo, G., Paquette, J. L., Arnaud, N., Aubray, A., et al. (2015). New constraints on the timing of partial melting and deformation along the Nyalam section (Central Himalaya): implications for extrusion models. Geol. Soc. Spec. Publ. 412, 131–175. doi:10.1144/SP412.11
Li, Y., Wang, C., Dai, J., Xu, G., Hou, Y., and Li, X. (2015). Propagation of the deformation and growth of the Tibetan-Himalayan orogen: a review. Earth-Science Rev. 143, 36–61. doi:10.1016/j.earscirev.2015.01.001
Li, Z., and Gerya, T. V. (2009). Polyphase formation and exhumation of high- to ultrahigh-pressure rocks in continental subduction zone: numerical modeling and application to the Sulu ultrahigh-pressure terrane in eastern China. J. Geophys. Res.: Solid Earth 114 (9), 1–27. doi:10.1029/2008JB005935
Li, Z. H., Xu, Z. Q., and Gerya, T. V. (2011). Flat versus steep subduction: contrasting modes for the formation and exhumation of high- to ultrahigh-pressure rocks in continental collision zones. Earth Planet. Sci. Lett. 301, 65–77. doi:10.1016/j.epsl.2010.10.014
Liu, M., and Yang, Y. (2003). Extensional collapse of the Tibetan Plateau: results of three-dimensional finite element modeling. J. Geophys. Res. 108 (8), 2361. doi:10.1029/2002jb002248
Lombardo, B., and Rolfo, F. (2000). Two contrasting eclogite types in the Himalayas: implications for the Himalayan orogeny. J. Geodynamics 30 (1–2), 37–60. doi:10.1016/S0264-3707(99)00026-5
Luisier, C., Baumgartner, L., Schmalholz, S. M., Siron, G., and Vennemann, T. (2019). Metamorphic pressure variation in a coherent Alpine nappe challenges lithostatic pressure paradigm. Nat. Commun. 10 (1), 4734. doi:10.1038/s41467-019-12727-z
Maiti, G., and Mandal, N. (2020). How far does a subduction wedge follow lubrication dynamics? Phys. Earth Planet. Interiors 298, 106346. doi:10.1016/j.pepi.2019.106346
Malusà, M. G., Faccenna, C., Baldwin, S. L., Fitzgerald, P. G., Rossetti, F., Balestrieri, M. L., et al. (2015). Contrasting styles of (U)HP rock exhumation along the cenozoic adria-europe plate boundary (western alps, calabria, corsica). Geochem. Geophys. Geosystems 16 (6), 1786–1824. doi:10.1002/2015GC005767
Mancktelow, N. S. (1995). Nonlithostatic pressure during sediment subduction development exhumation high pressure metamorphic rocks. J. Geophys. Res.: Solid Earth 100 (94), 571–583. doi:10.1029/94JB02158
Mandal, N., Bose, S., Baruah, A., and Sarkar, S. (2015). First-order topography of the Himalayan mountain belt: a deep-crustal flow analysis. Geol. Soc. Spec. Publ. 412, 5–23. doi:10.1144/SP412.9
Metcalfe, R. P. (1993). Pressure, temperature and time constraints on metamorphism across the main central thrust zone and high himalayan slab in the garhwal himalaya. Geol. Soc. Spec. Publ. 74, 485–509. doi:10.1144/GSL.SP.1993.074.01.33
Meyer, B., Tapponnier, P., Bourjot, L., Métivier, F., Gaudemer, Y., Peltzer, G., et al. (1998). Crustal thickening in Gansu-Qinghai, lithospheric mantle subduction, and oblique, strike-slip controlled growth of the Tibet Plateau. Geophys. J. Int. 135 (1), 1–47. doi:10.1046/j.1365-246X.1998.00567.x
Molnar, P., and Stock, J. M. (2009). Slowing of India’s convergence with Eurasia since 20 Ma and its implications for Tibetan mantle dynamics. Tectonics 28 (3), 1–11. doi:10.1029/2008TC002271
Montemagni, C., Carosi, R., Fusi, N., Iaccarino, S., Montomoli, C., Villa, I. M., et al. (2020). Three-dimensional vorticity and time-constrained evolution of the main central thrust zone, garhwal himalaya (NW India). Terra Nov. 32, 215–224. doi:10.1111/ter.12450
Montemagni, C., Iaccarino, S., Montomoli, C., Carosi, R., Jain, A. K., and Villa, I. M. (2018). Age constraints on the deformation style of the south Tibetan detachment system in garhwal himalaya. Ital. J. Geosci. 137, 175–187. doi:10.3301/IJG.2018.07
Montemagni, C., Montomoli, C., Iaccarino, S., Carosi, R., Jain, A. K., Massonne, H. J., et al. (2019). Dating protracted fault activities: microstructures, microchemistry and geochronology of the vaikrita thrust, main central thrust zone, garhwal himalaya, nw India. Geol. Soc. Spec. Publ. 481, 127–146. doi:10.1144/SP481.3
Montési, L. G. J., and Behn, M. D. (2007). Mantle flow and melting underneath oblique and ultraslow mid-ocean ridges. Geophys. Res. Lett. 34, 1–5. doi:10.1029/2007GL031067
Montomoli, C., Iaccarino, S., Carosi, R., Langone, A., and Visonà, D. (2013). Tectonometamorphic discontinuities within the greater himalayan sequence in western Nepal (central himalaya): insights on the exhumation of crystalline rocks. Tectonophysics 608, 1349–1370. doi:10.1016/j.tecto.2013.06.006
Najman, Y., Bickle, M., Garzanti, E., Pringle, M., Barfod, D., Brozovic, N., et al. (2009). Reconstructing the exhumation history of the Lesser Himalaya, NW India, from a multitechnique provenance study of the foreland basin Siwalik group. Tectonics 28 (5), TC5018. doi:10.1029/2009tc002506
O’Brien, P. J. (2019). Eclogites and other high-pressure rocks in the Himalaya: a review. Geol. Soc. Spec. Publ. 483 (5), SP483.13. doi:10.1144/SP483.13
O’Brien, P. J., Zotov, N., Law, R., Khan, M. A., and Jan, M. Q. (2001). Coesite in Himalayan eclogite and implications for models of India-Asia collision. Geology 29 (5), 435–438. doi:10.1130/0091-7613(2001)029<0435:CIHEAI>2.0.CO;2
Piccolo, A., Faccenda, M., Carosi, R., Montomoli, C., and Visonà, D. (2018). Crustal strength control on structures and metamorphism in collisional orogens. Tectonophysics 746, 470–492. doi:10.1016/j.tecto.2017.09.018
Pysklywec, R. N., and Cruden, A. R. (2004). Coupled crust-mantle dynamics and intraplate tectonics: two-dimensional numerical and three-dimensional analogue modeling. Geochemistry, Geophys Geosystems 5(10), 1–22. doi:10.1029/2004GC000748
Pysklywec, R. N., Mitrovica, J. X., and Ishii, M. (2003). Mantle avalanche as a driving force for tectonic reorganization in the southwest Pacific. Earth Planet. Sci. Lett. 209, 29–38. doi:10.1016/S0012-821X(03)00073-6
Rey, P. F., Teyssier, C., and Whitney, D. L. (2010). Limit of channel flow in orogenic plateaux. Lithosphere 2 (5), 328–332. doi:10.1130/L114.1
Rodríguez-González, J., Negredo, A. M., and Billen, M. I. (2012). The role of the overriding plate thermal state on slab dip variability and on the occurrence of flat subduction. Geochemistry, Geophys. Geosystems. 13, 1–21. doi:10.1029/2011GC003859
Sarkar, S., Baruah, A., Dutta, U., and Mandal, N. (2014). Role of random thermal perturbations in the magmatic segmentation of mid-oceanic ridges: insights from numerical simulations. Tectonophysics 636, 83–99. doi:10.1016/j.tecto.2014.08.008
Shahraki, M., and Schmeling, H. (2012). Plume-induced geoid anomalies from 2D axi-symmetric temperature- and pressure-dependent mantle convection models. J. Geodyn 59–60, 193–206. doi:10.1016/j.jog.2012.01.006
Shrestha, S., Larson, K. P., Guilmette, C., and Smit, M. A. (2017). The P–T–t evolution of the exhumed Himalayan metamorphic core in the Likhu Khola region, East Central Nepal. J. Metamorph. Geol. 35, 663–693. doi:10.1111/jmg.12250
Sorcar, N., Hoppe, U., Dasgupta, S., and Chakraborty, S. (2014). High-temperature cooling histories of migmatites from the High Himalayan Crystallines in Sikkim, India: rapid cooling unrelated to exhumation? Contrib. Mineral. Petrol 167 (2), 1–34. doi:10.1007/s00410-013-0957-3
Soucy La Roche, R., Godin, L., Cottle, J. M., and Kellett, D. A. (2018). Preservation of the early evolution of the himalayan middle crust in foreland klippen: insights from the karnali klippe, west Nepal. Tectonics 37, 1161–1193. doi:10.1002/2017TC004847
Spencer, C. J., Harris, R. A., and Dorais, M. J. (2012). The metamorphism and exhumation of the Himalayan metamorphic core, eastern Garhwal region, India. Tectonics 31 (1), 1–18. doi:10.1029/2010TC002853
Thiede, R. C., Arrowsmith, J. R., Bookhagen, B., McWilliams, M. O., Sobel, E. R., and Strecker, M. R. (2005). From tectonically to erosionally controlled development of the Himalayan orogen. Geology 33 (8), 689–692. doi:10.1130/G21483.1
Thiede, R. C., Ehlers, T. A., Bookhagen, B., and Strecker, M. R. (2009). Erosional variability along the northwest Himalaya. J. Geophys. Res. Earth Surf. 114 (1), F01015. doi:10.1029/2008JF001010
Turcotte, D. L., and Schubert, G. (2002). Geodynamics. 2nd Edn. Cambridge: Cambridge University Press
van Keken, P. E., Currie, C., King, S. D., Behn, M. D., Cagnioncle, A., He, J., et al. (2008). A community benchmark for subduction zone modeling. Phys. Earth Planet. Interiors 171 (1–4), 187–197. doi:10.1016/j.pepi.2008.04.015
Vannay, J. C., and Grasemann, B. (2001). Himalayan inverted metamorphism and syn-convergence extension as a consequence of a general shear extrusion. Geol. Mag. 138 (3), 253–276. doi:10.1017/S0016756801005313
Walters, J. B., and Kohn, M. J. (2017). Protracted thrusting followed by late rapid cooling of the Greater Himalayan Sequence, Annapurna Himalaya, Central Nepal: Insights from titanite petrochronology. J. Metamorph. Geol., 35, 897–917. doi:10.1111/jmg.12260
Wang, C., Dai, J., Zhao, X., Li, Y., Graham, S. A., He, D., et al. (2014). Outward-growth of the Tibetan plateau during the cenozoic: a review. Tectonophysics 621, 1–43. doi:10.1016/j.tecto.2014.01.036
Wang, J. M., Zhang, J. J., Liu, K., Zhang, B., Wang, X. X., Rai, S. M., et al. (2016). Spatial and temporal evolution of tectonometamorphic discontinuities in the central Himalaya: constraints from P-T paths and geochronology. Tectonophysics 679, 41–60. doi:10.1016/j.tecto.2016.04.035
Warren, C. J., Beaumont, C., and Jamieson, R. A. (2008). Formation and exhumation of ultra-high-pressure rocks during continental collision: role of detachment in the subduction channel. Geochem. Geophys. Geosystems 9 (4), 1–33. doi:10.1029/2007GC001839
Waters, D. J. (2019). Metamorphic constraints on the tectonic evolution of the high Himalaya in Nepal: the art of the possible. Geol. Soc. Spec. Publ. 483 (1), SP483-2018-187. doi:10.1144/SP483-2018-187
Weinberg, R. F. (2016). Himalayan leucogranites and migmatites: nature, timing and duration of anatexis. J. Metamorph. Geol., 34, 821–843. doi:10.1111/jmg.12204
White, N. M., Pringle, M., Garzanti, E., Bickle, M., Najman, Y., Chapman, H., et al. (2002). Constraints on the exhumation and erosion of the High Himalayan Slab, NW India, from foreland basin deposits. Earth Planet. Sci. Lett. 195 (1–2), 29–44. doi:10.1016/S0012-821X(01)00565-9
Yakovlev, P. V., and Clark, M. K. (2014). Conservation and redistribution of crust during the Indo-Asian collision. Tectonics 33 (6), 1016–1027. doi:10.1002/2013TC003469
Zeiger, K., Gordon, S. M., Long, S. P., Kylander-Clark, A. R. C., Agustsson, K., and Penfold, M. (2015). Timing and conditions of metamorphism and melt crystallization in Greater Himalayan rocks, eastern and central Bhutan: insight from U–Pb zircon and monazite geochronology and trace-element analyses. Contrib. Mineral. Petrol 169, 47. doi:10.1007/s00410-015-1143-6
Keywords: himalayan wedge, lubrication dynamics, P-T-t path, high-pressure rocks, eclogites, wedge extrusion
Citation: Maiti G and Mandal N (2021) Early Miocene Exhumation of High-Pressure Rocks in the Himalaya: A Response to Reduced India-Asia Convergence Velocity. Front. Earth Sci. 9:632806. doi: 10.3389/feart.2021.632806
Received: 24 November 2020; Accepted: 25 January 2021;
Published: 26 February 2021.
Edited by:
Guillermo Booth-Rea, University of Granada, SpainReviewed by:
Rodolfo Carosi, University of Turin, ItalyCopyright © 2021 Maiti and Mandal. This is an open-access article distributed under the terms of the Creative Commons Attribution License (CC BY). The use, distribution or reproduction in other forums is permitted, provided the original author(s) and the copyright owner(s) are credited and that the original publication in this journal is cited, in accordance with accepted academic practice. No use, distribution or reproduction is permitted which does not comply with these terms.
*Correspondence: Giridas Maiti, Z2lyaWRhc21haXRpLnJzQGphZGF2cHVydW5pdmVyc2l0eS5pbg==; Nibir Mandal, bmliaXIubWFuZGFsQGphZGF2cHVydW5pdmVyc2l0eS5pbg==
Disclaimer: All claims expressed in this article are solely those of the authors and do not necessarily represent those of their affiliated organizations, or those of the publisher, the editors and the reviewers. Any product that may be evaluated in this article or claim that may be made by its manufacturer is not guaranteed or endorsed by the publisher.
Research integrity at Frontiers
Learn more about the work of our research integrity team to safeguard the quality of each article we publish.