 Jun Ma1,2,3,4
 Jinming Song1,2,3,4*Xuegang Li1,2,3,4*Qidong Wang1,2,3,4Guorong Zhong1,2,3,4
 Huamao Yuan1,2,3,4Ning Li1,2,3,4Liqin Duan1,2,3,4
- 1CAS Key Laboratory of Marine Ecology and Environmental Sciences, Chinese Academy of Sciences, Institute of Oceanology, Qingdao, China
- 2Laboratory for Marine Ecology and Environmental Science, Qingdao National Laboratory for Marine Science and Technology, Qingdao, China
- 3College of Oceanic Sciences, University of Chinese Academy of Sciences, Beijing, China
- 4Center for Ocean Mega-Science, Chinese Academy of Sciences, Qingdao, China
The hypoxia problem in the ocean is worsening, and the oxygen minimum zone (OMZ) continues to expand. The Tropical Western Pacific Ocean is one of the most sensitive areas in response to climate change and human activities, and the OMZ in this area has also expanded significantly. Based on a survey conducted in March 2018, the characteristics of OMZ in the Kocebu seamount area of the Tropical Western Pacific Ocean and its biogeochemical effects are discussed. The results showed that DO in the Kocebu seamount area first decreased and then increased, and the lowest value was 2.49 mg/L at a water depth of 750 m. Based on the oxycline and the threshold of 3.20 mg/L, OMZ in this area was located in the water column of 590–1,350 m. With the increase in water depth, the POC concentration decreased gradually and remained stable in the water column deeper than 1,000 m. The presence of OMZ reduced the decomposition rate of POC, causing more POC to sink into deeper waters. 38.77% of POC was decomposed in the water column of 150–300 m, whereas only 16.25% of POC was decomposed in the OMZ. In contrast to the vertical distribution of POC, δ13C-POC decreased rapidly in the water columns of 100–150 and 300–500 m, indicating the rapid decomposition of POC. This result suggests that POC and δ13C-POC should be combined in the evaluation of POC decomposition.
Introduction
The oxygen minimum zone (OMZ) refers to the water column in the ocean where dissolved oxygen (DO) is below a specific threshold. The existence of OMZ shows a low-oxygen environment in the ocean; however, there is no universal standard for its threshold. For different research areas and objects, the DO threshold of the OMZ varied from 0 to 100 μmol/kg. At present, it is generally believed that the main structure of the OMZ in the ocean is located in the water column of 200–1,500 m, and there is a significant oxycline between the OMZ and the upper or lower waters (Paulmier and Ruiz-Pino, 2009; Breitburg et al., 2018).
OMZ is widely distributed in the Central Atlantic Ocean, Northern Indian Ocean, Eastern Pacific Ocean, and Western Pacific Ocean and has important effects on marine organisms, global climate change, and matter cycles (Wright et al., 2012; Yao et al., 2020). OMZ causes some oxygen-sensitive organisms to escape from the area, which affects the diversity of marine organisms (Stramma et al., 2012). The low-oxygen environment in the OMZ affects the valence states of many elements and has a decisive impact on the matter cycles. OMZ responds to global warming and plays an important role in maintaining constant O2 in the atmosphere (Baroni et al., 2020).
OMZ has been an important route for transferring the organic matter to deep waters in the tropical ocean (Van Mooy et al., 2002; Kiko et al., 2016). In a low-oxygen environment, the microbial community transitions from aerobic to anaerobic, resulting in a significantly slower decomposition of organic matter (Weber and Bianchi, 2020; Cisternas-Novoa et al. (2019) pointed out that the low-oxygen environment in the Baltic Sea reduced the decomposition rate of particulate organic carbon (POC) and accelerated the settlement and burial of POC. Cavan et al. (2017) reported that 70% of the remineralization of POC in the OMZ in the Eastern Tropical North Pacific was caused by microbial respiration. Keil et al. (2016) further found that the combined effect of various factors, such as the composition of the microbial community, vertical movement of zooplankton, and the change in temperature in the OMZ, caused a significantly lower decomposition rate of POC than that in the upper waters. However, although the importance of OMZ for the settlement of POC has reached a consensus, studies on OMZ and POC in the Tropical Western Pacific Ocean is still insufficient.
The Tropical Western Pacific Ocean, with the most significant air-sea interaction in the ocean, has a very complex hydrological environment, which has always been a hot area for oceanographic research in the world (Hu et al., 2015; Ma et al., 2019; Ma et al., 2020c). However, current studies on OMZ have mainly concentrated on the Eastern Pacific Ocean and the Northern Indian Ocean. There are few studies on OMZ in the Tropical Western Pacific Ocean. Although OMZ in the Tropical Western Pacific Ocean is weaker than in other sea areas, it is a low-oxygen environment with important ecological effects. For example, large marine mammals may be restricted with DO concentrations lower than 1.92 mg/L (Stramma et al., 2008; Vaquer-Sunyer and Duarte (2008) reported that the DO concentrations causing mortality varied in different marine animals with a mean value of 2.05 mg/L. When assessing the thresholds of oxygen at which lethal and sublethal impacts occur for benthic organisms, hundreds of experiments have been conducted to form a threshold range of 0.28–4 mg/L (Paerl, 2006). Thus, a study on the OMZ of the Tropical Western Pacific Ocean is necessary, although the threshold is higher in this area.
Furthermore, the hypoxia problem in the ocean has become more severe in recent years, and OMZ has expanded rapidly (Ito et al., 2017; Stramma et al. (2008) reported that OMZs in the eastern Pacific Ocean and northern Indian Ocean were very intense and mature, whereas those in the Western Pacific and Atlantic Ocean were weak; however, their expansion was more significant. As one of the most sensitive sea areas in response to climate change and human activities, the OMZ in the Tropical Western Pacific Ocean undoubtedly has greater growth “potential” than other sea areas. Therefore, the Western Pacific Ocean is an ideal “test field” for studying the origin, development, and ecological effects of OMZ.
The Kocebu seamount area is located in the Tropical Western Pacific Ocean, which is a representative region for the study of the OMZ. This study focuses on the OMZ in this area, discusses the relationship between OMZ and POC, and analyzes its impact on the POC settlement, providing a reference for further study on the impact of OMZ on the key processes of the carbon cycle in the Tropical Western Pacific Ocean.
Materials and Methods
Study Area
The Kocebu seamount area (152.54–153.42°E, 17.16–17.78°N) in the Tropical Western Pacific Ocean was investigated onboard the R/V Science in March 2018. During the investigation, 19 stations were set up above the Kocebu seamount. There were 10 stations in Section A and 8 stations in Section B. Sections A and B intersect Station O at a water depth of 1,195 m above the east summit of the seamount (Figure 1).
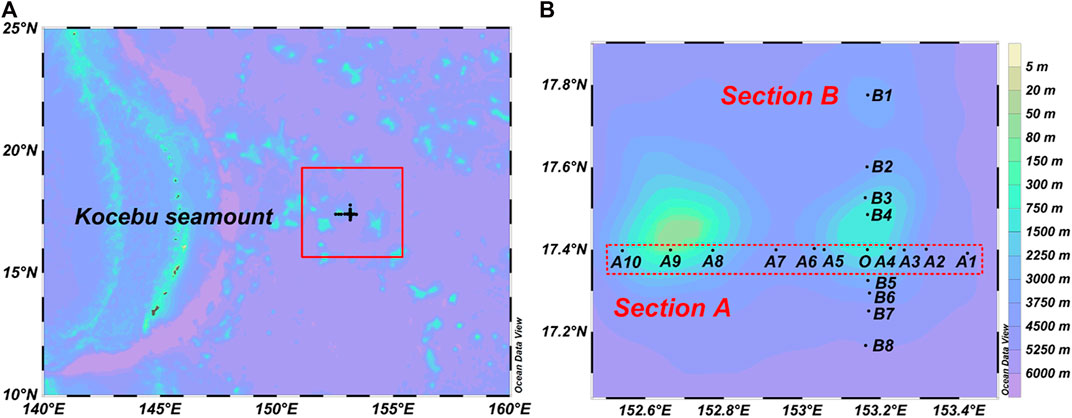
FIGURE 1. Sampling stations in the Kocebu seamount area of the Tropical Western Pacific Ocean. (A) The Kocebu seamount area was marked by the red square, which was located on the right side of the Mariana Trench. (B) There were two sections, and the red rectangle represented Section A. 19 stations were set up above the Kocebu seamount. The two sections intersect Station O at a water depth of 1,195 m above the east summit of the seamount. This figure was created using Ocean Data View.
According to the distance from the seamount summit to the sea level, the seamounts in the ocean are divided into shallow (0–200 m), middle (200–400 m), and deep (>400 m) seamounts. The Kocebu seamount is a typical deep seamount, which has a slight impact on the upper waters (Genin, 2004; Ma et al., 2018; Ma et al. (2020c) stated that upwelling was only found at Stations O and A9 near the Kocebu seamount summit in the water column of 750–1,500 m, which affected the distribution of parameters such as POC; however, there was no upwelling and no “seamount effect” at the other stations. Since this study mainly focused on the relationship between OMZ and POC in this area, Stations O and A9 were excluded from the following discussion. Therefore, although the study area was located in the Kocebu seamount area, it had no relationship with the seamount terrain.
Methods
To reduce the influence of tidal movement on the survey, sample collection was performed from 8 to 6 p.m. the next day. Water samples from each station were collected at 0, 30, 50, 75, 100, deep chlorophyll maximum layer (DCML), 200, 300, 500, 750, 1,000, 1,500, 2000, and 3,000 m using a Niskin water collector (KC-Denmark, Denmark). The temperature, salinity, DO, POC, stable carbon isotope composition of POC (δ13C-POC), and chlorophyll a (Chl a) were collected and measured. The collection, analysis, and measurement methods were as follows.
Temperature and salinity: A CTD (Sea-bird SBE911, United States) was used to measure simultaneously during water sample collection.
DO: a 50 ml brown iodine flask was used for sampling from each water depth, manganese sulfate and alkaline potassium iodide solution was added for the fixation of oxygen, and Winkler iodometry was used to measure DO at the site with a relative standard deviation of ≤2% (Ma et al., 2020a).
POC and δ13C-POC: For each sample, 3 L of water was taken and filtered with a 0.7 μm filter (Whatman GF/F, United Kingdom) (before use, the filter was burned at 450°C for 4 h, soaked in 0.5/L hydrochloric acid for 24 h, washed with ultrapure water to neutrality, and dried), and then placed in a refrigerator at −20°C and brought back to the laboratory for measurement. In the laboratory, the samples were rinsed with 0.5/L hydrochloric acid, washed with ultrapure water to neutrality, and dried. An elemental analyzer and stable isotope mass spectrometer (Thermo Fisher Scientific Flash EA 1112 HT-Delta Ⅴ Advantages, United States) were used to measure the POC concentration and δ13C-POC, with accuracies of ±0.8‰ and ±0.2‰, respectively (Yin et al., 2014; Ma et al., 2020c).
Chl a: For each sample, 2 L of water was filtered through a 200 μm sieve to remove zooplankton. Thereafter, it was filtered with a 0.7 μm filter (Whatman GF/F, United Kingdom), after which the filter was wrapped with aluminum foil and placed in the refrigerator at −20°C and brought back to the laboratory for measurement. In the laboratory, the samples were extracted with 90% acetone for 12–24 h, and the concentration was measured using a Turner fluorometer (Turner Designs, United States) (Ma et al., 2020a).
Results
Hydrological Characteristics
The temperature at each station showed a similar trend with the increase in water depth (Figure 2A). The temperature was high in the upper 0–100 m water column, and the average temperature of the surface waters had the highest value of 27.22. In the water column of 100–500 m, the temperature decreased sharply to form a thermocline. Thereafter, the temperature decreased slowly and decreased to a minimum of 1.63°C at a water depth of 3,000 m. The salinity at each station also showed a similar trend with the increase in water depth; however, it had more complicated changes than temperature (Figure 2B). The salinity remained stable in the water column of 0–100 m, then increased sharply to form a high-salinity zone, and the average salinity reached 35.07 and 35.06 in the water column of 150 and 200 m, respectively. In the water column of 200–500 m, the salinity decreased sharply to form a halocline. Subsequently, the salinity increased gradually and remained stable, reaching 34.66% at a water depth of 3,000 m.
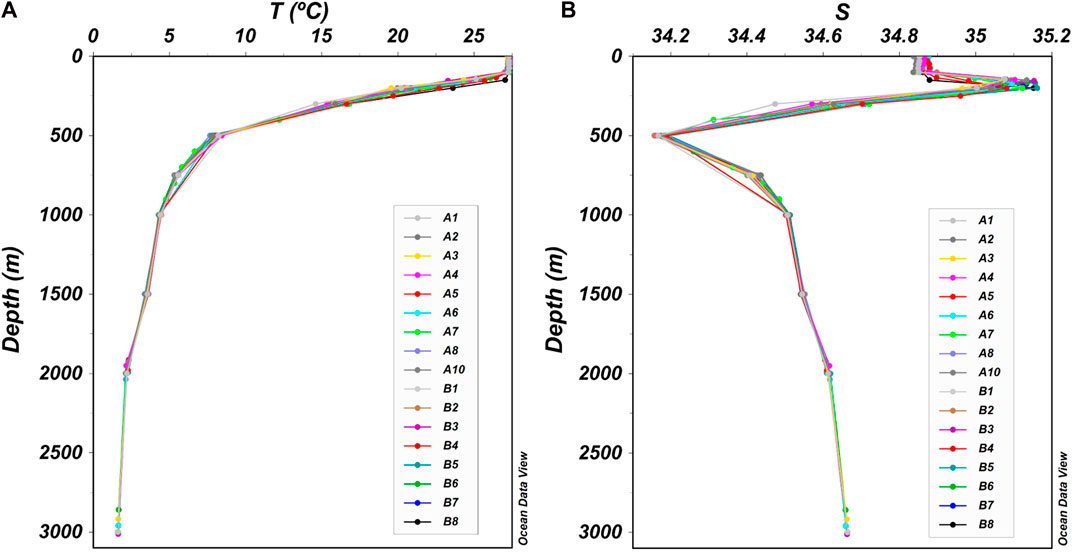
FIGURE 2. Vertical distribution of temperature (T) and salinity (S) in the Kocebu seamount area. Different colors represented different stations. The T and S at each station showed a similar trend, respectively. (A) The T at each station. There was a thermocline in the water column of 100–500 m. (B) The S at each station. There was a high-salinity zone in the water column of 150–200 m.
Seawater stratification in the Kocebu seamount area is evident. In the water column of 0–100 m, the temperature and salinity were high and stable. The high-salinity zone and the salinity halocline correspond to the upper and lower parts of the thermocline, respectively. In the water column deeper than 500 m, the temperature and salinity remained stable. This vertical distribution of temperature and salinity conformed to the general rule of the Tropical Western Pacific Ocean. The Kocebu seamount area was located on the edge of the Western Pacific Ocean warm pool area (125−165ºE, 0−16ºN) (Gan and Wu, 2012; Ma et al., 2019), where the sea surface temperature was close to or higher than 28°C. Moreover, due to the control of the North Pacific Tropical Water with high salinity (Wang et al., 2013; Ma et al., 2020b), there was a high-salinity zone in the water column of 100–200 m. Seawater stratification restricts the upward transportation of biogenic elements and affects the distribution of environmental parameters such as DO and pH, and controls the depth and range of OMZ (Schmidtko et al., 2017; Ma et al., 2020b; Li et al., 2020).
The Distribution of DO
The DO at each station also showed a similar trend with the increase in water depth, which first decreased and then increased (Figure 3A). In the water column of 0–100 m, based on relatively stable temperature and salinity, it could be inferred that there was a mixed layer under the action of wind, leading to relatively stable DO with an average concentration of >6.50 mg/L. In the water column of 100–300 m, the decomposition of organic matter consumed DO; however, the photosynthesis of phytoplankton could supply DO, causing a slow decrease in DO. Thereafter, the photosynthesis disappeared gradually, and the decomposition of organic matter consumed massive DO in the water column of 300–750 m to form an oxycline. In the water column of 750–3,500 m, the decomposition of organic matter weakened gradually and tended to stop. The DO concentration increased gradually to 4.54 mg/L at a water depth of 3,000 m because of the control of DO-rich Antarctic Bottom Water (Lumpkin and Speer, 2007; Kawabe and Fujio, 2010).
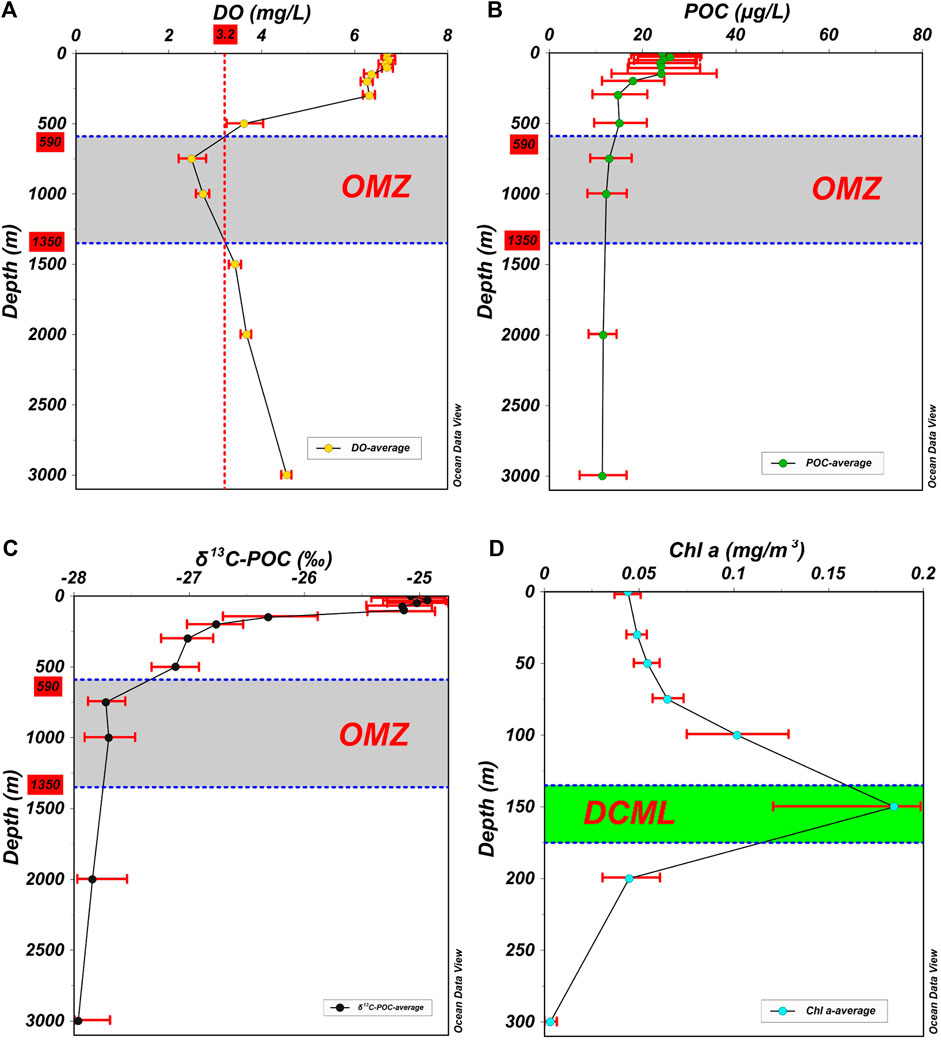
FIGURE 3. Vertical distribution of average DO, POC, δ13C-POC, and Chl a in the Kocebu seamount area. (A) The average DO of all stations. There was an oxycline in the water column of 300–750 m. The grey area represented OMZ, which was located in the water column of 590–1,350 m based on the DO threshold of 3.20 mg/L. (B) The average POC of all stations. In the OMZ, the decomposition rate of POC was lower than that in the water column of 150–300 m. (C) The average δ13C-POC of all stations. The δ13C-POC showed similar characteristics as POC, which was heavier in the water column of 0–100 m, then decreased rapidly in the water column of 100–500 m. In the OMZ, δ13C-POC was significantly lower than that in the water column of 100–500 m. (D) The average Chl a of all stations. The green area represented DCML, which was located in the water column of 135–175 m. The good seawater mixing and the existence of DCML caused a high POC concentration in the water column of 0–100 m. In these figures, the red bars represented the standard deviation of different parameters.
The Distribution of POC and δ13C-POC
The POC at each station also showed a similar trend with the increase in water depth (Figure 3B), which had a gradual downward decrease in general and remained stable in the water column deeper than 1,000 m. In the water column of 0–150 m, the POC concentration was higher than 23.50 μg/L. In the water column of 150–500 m, the POC concentration rapidly decreased from 23.99 to 15.01 μg/L. In the water column of 500–1,000 m, the POC concentration continued to decrease to 12.21 μg/L at a water depth of 1,000 m. Thereafter, the POC concentration remained stable at 11.35 μg/L at a water depth of 3,000 m. In this study, the δ13C-POC showed a vertical distribution similar to that of POC (r = 0.792, p < 0.01, n = 212) (Figures 3B,C, 4). In the water column of 0–100 m, δ13C-POC was heavier than −25.50‰. In the water column of 100–500 m, δ13C-POC decreased rapidly from −25.14 to −27.12‰, indicating that the decomposition rate of POC in this area was relatively high. In the OMZ, δ13C-POC decreased from −27.31‰ at a water depth of 590 m to −27.75‰ at a water depth of 1,350 m, indicating that the decomposition rate of POC in this area was significantly lower than that in the water column of 100–500−m. Below the OMZ, the δ13C-POC remained stable.
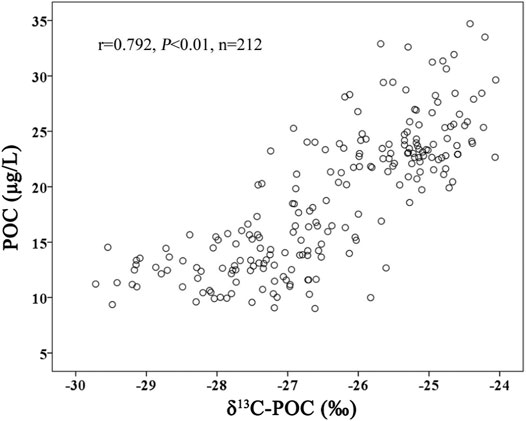
FIGURE 4. Relationship between POC and δ13C-POC. The POC and δ13C-POC showed a significantly positive correlation (r = 0.792, p < 0.01, n = 212), indicating that they had a similar vertical distribution.
Discussion
The OMZ in the Kocebu Seamount Area
The vertical distribution of DO is closely related to primary productivity, seawater stratification, and the hydrological environment in this area. In tropical and subtropical waters, there is always a water column with DO below a certain threshold, called the OMZ (Paulmier and Ruiz-Pino, 2009; Keeling et al., 2010; Lam and Kuypers, 2010). However, there is no uniform standard for the DO threshold of the OMZ, which is often determined according to the needs (Table 1). For example, Karstensen et al. (2008) used a DO threshold of 2.88 mg/L to define OMZ in the Atlantic Ocean and the Eastern Pacific Ocean. Helly and Levin (2004) set a DO threshold of 0.64 mg/L when defining OMZ in the marginal sea. In a study on the requirement of a specific fish for DO, the DO threshold decreased to a very low level of 0.13 mg/L (Li et al., 2017). At present, the generally accepted view was that the DO threshold was 100 μmol/L (3.20 mg/L) in most sea areas of the global ocean, and there was a significant oxycline between OMZ and the upper or lower waters (Paulmier and Ruiz-Pino, 2009).
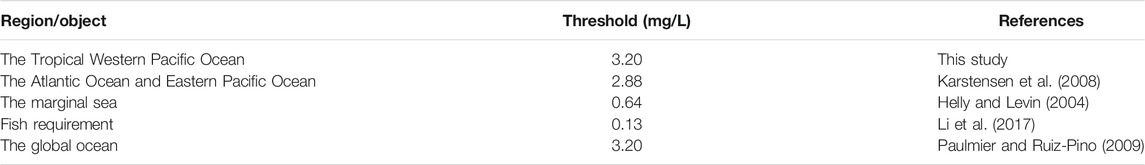
TABLE 1. DO threshold of OMZ in different areas.
The Eastern Tropical North Pacific and the Tropical Indian Ocean are typical distribution areas of OMZ, where the intensity of OMZ is relatively high (Figures 5A,C) (Karstensen et al., 2008; Breitburg et al., 2018; Hernandez-Ayon et al., 2019; D’Asaro et al., 2020). However, the intensity of the OMZ in the Western Pacific Ocean and the Tropical Atlantic Ocean is relatively weak (Figures 3A, 5B). In this study, the lowest DO concentration appeared at a water depth of 750 m with a value of 2.49 mg/L. According to the standard of Paulmier and Ruiz-Pino (2009), the OMZ in the Kocebu seamount area was located in the water column of 590–1,350 m, and the upper oxycline was in the water column of 300–750 m, whereas the lower oxycline was not evident (Figure 3A). It can be observed that the OMZ in the Kocebu seamount area was just below the thermocline and halocline, and the upper oxycline overlapped with them (Figures 2, 3), indicating that the formation of OMZ may be closely related to seawater stratification. The decomposition of organic matter in the ocean continuously consumes DO. It is difficult for DO to be supplied effectively in time, which is one of the main factors in the formation of the OMZ (Chronopoulou et al., 2017; Schmidtko et al., 2017). The thermocline and high-salinity zone severely restrict the exchange between the upper and lower waters, making it difficult to exchange the high DO in the upper waters and the low DO in the lower waters. In a study of the Y3 seamount area in the Tropical Western Pacific Ocean, Ma et al. (2020b) also reported that the dual role of the thermocline and the high-salinity zone in the water column of 50–125 m hindered the exchange of water, leading to the appearance of lower nutrient concentrations in the upper part of the euphotic zone. Schmidtko et al. (2017) reported that the strengthening of seawater stratification caused by global warming in the past 50 years has further restricted the exchange of upper and lower waters, resulting in a continuous increase in OMZ intensity in the global ocean. Therefore, these studies indicate that seawater stratification may be one of the most important factors controlling the range of OMZ.
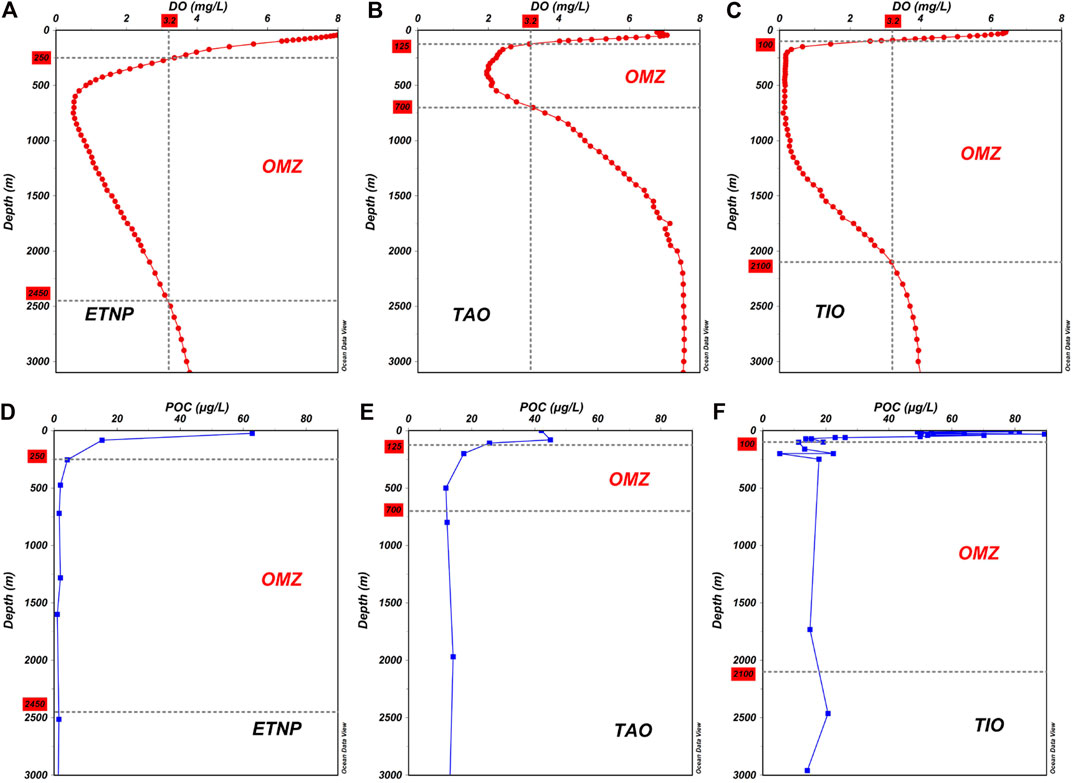
FIGURE 5. Vertical distribution of DO and POC in different areas. (A) The annual average DO in the Eastern Tropical North Pacific (ETNP). The OMZ was located in the water column of 250–2,450 m based on the DO threshold of 3.20 mg/L.(B) The annual average DO in the Tropical Atlantic Ocean (TAO). The OMZ was located in the water column of 125–700 m. (C) The annual average DO in the Tropical Indian Ocean (TIO). The OMZ was located in the water column of 100–2,100 m. All the annual average DO data were downloaded from the World Ocean Atlas 2018. (D) The vertical distribution of POC in the ETNP. (E) The vertical distribution of POC in the TAO. (F) The vertical distribution of POC in the TIO. All the POC data were cited from (Martiny et al., 2014).
The Production and Decomposition of POC
The vertical distribution of POC is closely related to the biogeochemical processes at each water depth. Photosynthesis is the main source of POC in the upper waters of the ocean (Song, 2010; Close and Henderson, 2020). In this study, POC and Chla concentrations showed a significant positive correlation in the water column of 0–300 m (r = 0.339, p < 0.01, n = 139), which further indicated the close relationship between POC and phytoplankton in the upper waters of the Kocebu seamount area. In addition, owing to the good seawater mixing in the water column of 0–100 m and the existence of DCML in the water column of 135–175 m (Figure 3D), the POC concentration was high in the water column of 0–100 m. In the water column of 150–300 m, the Chla concentration decreased from 0.184 to 0.003 mg/m3. With the disappearance of photosynthesis, the decomposition of organic matter took the leading role, causing the POC concentration to decrease sharply. In the water column of 500–1,000 m, although the POC continued to decrease, its decomposition rate was significantly lower than that in the water column of 150–300m. The reason for this phenomenon may be that the easily degradable POC was decomposed in the shallower water column, whereas the remaining POC in the deeper water column was difficult to decompose (Close and Henderson, 2020; Weber and Bianchi, 2020). In addition, it may also be caused by a significant decrease in the seawater temperature and DO. The temperature and DO decreased to 4.39°C and 2.73 mg/L at a water depth of 1,000 m, respectively, which may reduce the activity of microbial enzymes to a certain extent (Lopez-Urrutia et al., 2006; Iversen and Ploug, 2013; Laufkötter et al., 2017). In the water column deeper than 1,000 m, the decomposition of POC tended to stop, and its concentration remained relatively stable.
The generation of POC is accompanied by a decomposition process. During this process, the microorganisms continuously consume DO. Therefore, POC and DO are closely related (Yao et al., 2014; Mcdonnell et al., 2015; Laufkötter et al., 2017). In this study, with the decomposition of POC, DO changed accordingly. However, the changes in POC and DO were not consistent (Figure 6). In the water column of 0–150 m, photosynthesis was vigorous, and POC and DO were at high levels. In particular, in the water column of 150–500 m, there was a rapid decrease in POC, whereas DO only decreased slowly. In the water column of 500–1,000 m, POC slowly decreased, whereas DO first decreased and then increased at a relatively low level. In the water column deeper than 1,000 m, the POC remained stable; however, DO increased slowly.
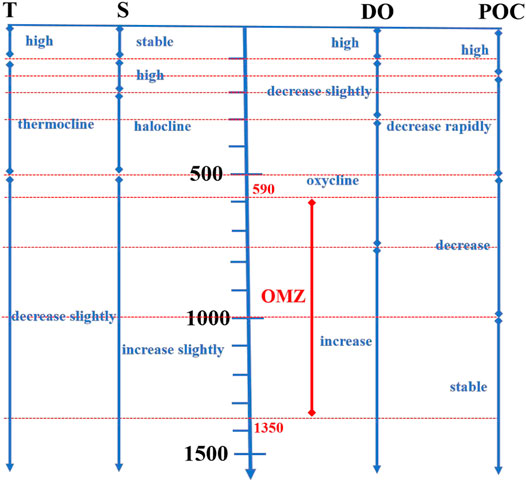
FIGURE 6. Relationship among OMZ, T, S, DO, and POC. The red line represented OMZ. This figure showed changes of these parameters with the increase in water depth. These parameters were all stable in the water column of 0–100 m due to the seawater mixing. Meanwhile, these parameters were also stable in the water column deeper than 1,000 m. OMZ was exactly located below the thermocline and halocline, and the DO in the OMZ first decreased and then increased. The decomposition rate of POC in the OMZ was significantly lower than that in the upper waters.
In general, the water depth of the rapid decomposition of POC was shallower than that of the rapid reduction of DO; that is, POC decomposed rapidly above the OMZ, slowly decreased in the OMZ, and remained stable below the OMZ. As previously mentioned, POC is produced in the upper part of the euphotic zone and is in a state of continuous decomposition with the increase in water depth. Microorganisms play a vital role in the decomposition of POC, and the intensity of their activities is directly related to the decomposition rate of POC (Wu et al., 1999; Druffel et al., 2003). DO is one of the most important factors affecting the activity of microorganisms. Many studies have reported that when DO and POC were abundant at the same time, microorganism activities reached the highest level; when DO was lower than 3.20 mg/L, microorganism activities were restricted, and the decomposition rate of POC decreased significantly (Paulmier and Ruiz-Pino, 2009; Keil et al., 2016). In the water column of 150–300 m, DO was still abundant, which was beneficial to the decomposition of organic matter by microorganisms (Wu et al., 1999; Druffel et al., 2003), causing rapid decomposition of POC. The POC concentration decreased from 23.99 μg/L at a water depth of 150 m to 14.69 μg/L at a water depth of 300 m, indicating that 38.77% of POC was decomposed, equating to a 6.2 μg/L decrease every 100 m. In the OMZ, DO was at a low level, which was not conducive to the reproduction of microorganisms and the decomposition of organic matter (Hwang et al., 2006; Keil et al., 2016). In this study, 16.25% of POC was decomposed, equating to a 0.31 μg/L decrease every 100 m. Below the OMZ, the easily decomposable POC was exhausted, and the POC concentration remained stable, and only 5.4% of POC was decomposed in the water column of 1,350–m-3000 m, equating to a 0.04 μg/L decrease every 100 m. The above information confirmed that the presence of OMZ reduced the decomposition rate of POC, causing more POC to settle into deeper waters. This phenomenon has been confirmed in many studies (Table 2; Figures 5D–F). Weber and Bianchi (2020) used remineralization tracers to study the deposition flux of particulate matter in the OMZ and reported that particulate matter in the OMZ in the Eastern Pacific Ocean and Indian Ocean showed a slower attenuation. Devol and Hartnett (2001) also confirmed that the decomposition rate of POC in the OMZ along the Mexican coast decreased significantly. This study was similar to the above studies, further indicating that the OMZ in the Tropical Western Pacific Ocean was of great significance for the transport of POC to deeper waters.
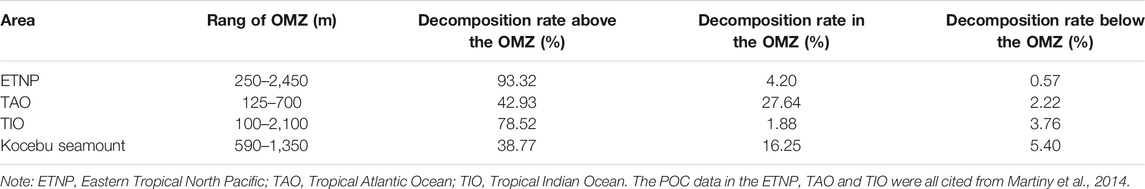
TABLE 2. Relationship between decomposition rate of POC and OMZ in different areas.
δ13C can reflect the source, cycle, and transformation of substances, which is of great significance for the study of the carbon cycle in marine ecosystems (Jeffrey et al., 1983; Hwang et al., 2006; Yao et al., 2015; Ding et al., 2020). It is worth noting that in the water column of 100–150 m, POC still remained at a high level; however, δ13C-POC rapidly decreased from −25.14 to −26.32‰. This difference may be caused by interactions among organisms, POC, and δ13C-POC. The mixed layer in the Kocebu seamount area was located in the water column of 0–100 m, and the activities and distribution of phytoplankton make POC and δ13C-POC at a high level in this area. Below the mixed layer, the POC began to decrease rapidly, causing a rapid decrease in δ13C-POC. However, there was DCML at a water depth of 150 m, and the rapid supplementation of POC by phytoplankton kept POC at a high level. Thus, these factors caused the distribution difference between POC and δ13C-POC in the water column of 100–150 m. Moreover, in the water column of 300–500 m, POC increased slightly due to the vertical movement of zooplankton, whereas δ13C-POC continued to decrease, indicating that the decomposition rate of POC in this water column was still high. These results indicate that the activities and distribution of organisms in the ocean have an important impact on the vertical distribution of POC, and the distribution of POC could not fully demonstrate the changes in its decomposition. Changes in δ13C-POC should be considered when exploring the decomposition of POC. In a study on the vertical distribution of δ13C-POC in the eastern tropical North Pacific, Jeffrey et al. (1983) also reported a consistent conclusion with this study, that is, δ13C-POC was relatively uniform and heavier in the upper waters, and it became lighter gradually and remained stable in the deep waters. Based on the analysis of δ13C-POC in 51 profiles in the global ocean, Close and Henderson (2020) reported that δ13C-POC had the abovementioned vertical distribution rule in most regions. Microorganisms first decompose the heavier δ13C components in the POC, such as amino acids and carbohydrates, resulting in lighter δ13C components, and this fractionation process of δ13C-POC is one of the main reasons for the lighter δ13C-POC with the increase in water depth (Close and Henderson, 2020; Kharbush et al., 2020). These results indicate that δ13C-POC could be an important reference for the study of POC decomposition.
Conclusion
The existence of OMZ shows a low-oxygen environment in the ocean, which has an important impact on marine organisms, global climate change, and the matter cycle. This study clarified the characteristics of OMZ in the Kocebu seamount area of the Tropical Western Pacific Ocean and revealed the relationship between OMZ and POC.
The vertical distribution of DO in the Kocebu seamount area was closely related to the primary productivity, seawater stratification, and water masses in this area, which first decreased and then increased with the lowest value of 2.49 mg/L at a water depth of 750 m. Based on the upper and lower oxycline and the DO threshold of 3.20 mg/L, OMZ in the Kocebu seamount area was located in the water column of 590–1,350 m.
The POC at each station showed a similar trend with the increase in water depth, which decreased gradually and remained stable at depths greater than 1,000 m. The vertical distribution of POC was closely related to the biogeochemical processes in each water layer, such as the photosynthesis of phytoplankton, decomposition of microorganisms, day and night migration of zooplankton, decomposition of easily degradable POC, and changes in temperature and DO in the seawater.
OMZ in the Kocebu seamount area could reduce the decomposition rate of POC, causing more POC to sink to deeper waters. In the water column of 150–300 m, 38.77% of POC was decomposed, equating to a 6.2 μg/L decrease for every 100 m. In the OMZ, only 16.25% of POC was decomposed, equating to a 0.31 μg/L decrease every 100 m. POC concentration remained stable under the OMZ, and only 5.4% of POC was decomposed in the water column of 1,350–3,000 m, equating to a 0.04 μg/L decrease every 100 m. In contrast to the vertical distribution of POC, δ13C-POC still rapidly decreased in the water column of 100–150 m and 300–500 m, indicating the rapid decomposition of POC. Therefore, the vertical distribution of POC was affected by many biological factors, and POC and δ13C-POC should be combined to evaluate the decomposition of POC for a better understanding.
Data Availability Statement
The original contributions presented in the study are included in the article/Supplementary Material, further inquiries can be directed to the corresponding authors.
Author Contributions
JM, JS, and XL designed the study and analyzed the results. JM wrote the manuscript. QW and HY collected the data. NL, LD, and GZ analyzed the data and prepared the figures. All authors contributed to the article and approved the submitted version.
Funding
This work was supported by the Science and Technology Basic Resources Investigation Program of China (Grant No. 2017FY100802), the Strategic Priority Research Program of the Chinese Academy of Sciences (Grant No. XDA19060401), and the National Natural Science Foundation of China (Grant No. 91958103) awarded to XL.
Conflict of Interest
The authors declare that the research was conducted in the absence of any commercial or financial relationships that could be construed as a potential conflict of interest.
Acknowledgments
We thank Xiaoxia Sun for providing Chl a data. We also thank the crew in “Science” Survey Vessel for their support in data collection and help in the cruise.
References
Baroni, I. R., Palastanga, V., and Slomp, C. P. (2020). Enhanced Organic Carbon Burial in Sediments of Oxygen Minimum Zones upon Ocean Deoxygenation. Front. Mar. Sci. 6, 839. doi:10.3389/fmars.2019.00839
Breitburg, D., Levin, L. A., Oschlies, A., Grégoire, M., Chavez, F. P., Conley, D. J., et al. (2018). Declining Oxygen in the Global Ocean and Coastal Waters. Science 359, eaam7240. doi:10.1126/science.aam7240
Cavan, E. L., Trimmer, M., Shelley, F., and Sanders, R. (2017). Remineralization of Particulate Organic Carbon in an Ocean Oxygen Minimum Zone. Nat. Commun. 8, 14847. doi:10.1038/ncomms14847
Chronopoulou, P.-M., Shelley, F., Pritchard, W. J., Maanoja, S. T., and Trimmer, M. (2017). Origin and Fate of Methane in the Eastern Tropical North Pacific Oxygen Minimum Zone. ISME J. 11, 1386–1399. doi:10.1038/ismej.2017.6
Cisternas-Novoa, C., Le Moigne, F. A. C., and Engel, A. (2019). Composition and Vertical Flux of Particulate Organic Matter to the Oxygen Minimum Zone of the central Baltic Sea: Impact of a Sporadic North Sea Inflow. Biogeosciences 16, 927–947. doi:10.5194/bg-16-927-2019
Close, H. G., and Henderson, L. C. (2020). Open-Ocean Minima in δ13C Values of Particulate Organic Carbon in the Lower Euphotic Zone. Front. Mar. Sci. 7, 540165. doi:10.3389/fmars.2020.540165
D'Asaro, E., Altabet, M., Kumar, N. S., and Ravichandran, M. (2020). Structure of the Bay of Bengal Oxygen Deficient Zone. Deep Sea Res. Part Topical Stud. Oceanography 179, 104650. doi:10.1016/j.dsr2.2019.104650
Devol, A. H., and Hartnett, H. E. (2001). Role of the Oxygen-Deficient Zone in Transfer of Organic Carbon to the Deep Ocean. Limnol. Oceanogr. 46, 1684–1690. doi:10.4319/lo.2001.46.7.1684
Ding, L., Qi, Y., Shan, S., Ge, T., Luo, C., and Wang, X. (2020). Radiocarbon in Dissolved Organic and Inorganic Carbon of the South China Sea. J. Geophys. Res. Oceans 125, e2020JC016073. doi:10.1029/2020JC016073
Druffel, E. R. M., Bauer, J. E., Griffin, S., and Hwang, J. (2003). Penetration of Anthropogenic Carbon into Organic Particles of the Deep Ocean. Geophys. Res. Lett. 30, 1744. doi:10.1029/2003GL017423
Gan, B., and Wu, L. (2012). Possible Origins of the Western pacific Warm Pool Decadal Variability. Adv. Atmos. Sci. 29, 169–176. doi:10.1007/s00376-011-0193-6
Genin, A. (2004). Bio-physical Coupling in the Formation of Zooplankton and Fish Aggregations over Abrupt Topographies. J. Mar. Syst. 50, 3–20. doi:10.1016/j.jmarsys.2003.10.008
Helly, J. J., and Levin, L. A. (2004). Global Distribution of Naturally Occurring marine Hypoxia on continental Margins. Deep Sea Res. Oceanographic Res. Pap. 51, 1159–1168. doi:10.1016/j.dsr.2004.03.009
Hernandez-Ayon, J. M., Paulmier, A., Garcon, V., Sudre, J., Montes, I., Chapa-Balcorta, C., et al. (2019). Dynamics of the Carbonate System across the Peruvian Oxygen Minimum Zone. Front. Mar. Sci. 6, 617. doi:10.3389/fmars.2019.00617
Hu, D., Wu, L., Cai, W., Gupta, A. S., Ganachaud, A., Qiu, B., et al. (2015). Pacific Western Boundary Currents and Their Roles in Climate. Nature 522, 299–308. doi:10.1038/nature14504
Hwang, J., Druffel, E. R. M., Eglinton, T. I., and Repeta, D. J. (2006). Source(s) and Cycling of the Nonhydrolyzable Organic Fraction of Oceanic Particles. Geochimica et Cosmochimica Acta 70, 5162–5168. doi:10.1016/j.gca.2006.07.020
Ito, T., Minobe, S., Long, M. C., and Deutsch, C. (2017). Upper Ocean O 2 Trends: 1958-2015. Geophys. Res. Lett. 44, 4214–4223. doi:10.1002/2017GL073613
Iversen, M. H., and Ploug, H. (2013). Temperature Effects on Carbon-specific Respiration Rate and Sinking Velocity of Diatom Aggregates – Potential Implications for Deep Ocean export Processes. Biogeosciences 10, 4073–4085. doi:10.5194/bg-10-4073-2013
Jeffrey, A. W. A., Pflaum, R. C., Brooks, J. M., and Sackett, W. M. (1983). Vertical Trends in Particulate Organic Carbon 13C: 12C Ratios in the Upper Water Column. Deep Sea Res. A. Oceanographic Res. Pap. 30, 971–983. doi:10.1016/0198-0149(83)90052-3
Karstensen, J., Stramma, L., and Visbeck, M. (2008). Oxygen Minimum Zones in the Eastern Tropical Atlantic and Pacific Oceans. Prog. Oceanography 77, 331–350. doi:10.1016/j.pocean.2007.05.009
Kawabe, M., and Fujio, S. (2010). Pacific Ocean Circulation Based on Observation. J. Oceanogr. 66, 389–403. doi:10.1007/s10872-010-0034-8
Keeling, R. F., Körtzinger, A., and Gruber, N. (2010). Ocean Deoxygenation in a Warming World. Annu. Rev. Mar. Sci. 2, 199–229. doi:10.1146/annurev.marine.010908.163855
Keil, R. G., Neibauer, J. A., Biladeau, C., van der Elst, K., and Devol, A. H. (2016). A Multiproxy Approach to Understanding the "enhanced" Flux of Organic Matter through the Oxygen-Deficient Waters of the Arabian Sea. Biogeosciences 13, 2077–2092. doi:10.5194/bg-13-2077-2016
Kharbush, J. J., Close, H. G., Van Mooy, B. A. S., Arnosti, C., Smittenberg, R. H., Le Moigne, F. A. C., et al. (2020). Particulate Organic Carbon Deconstructed: Molecular and Chemical Composition of Particulate Organic Carbon in the Ocean. Front. Mar. Sci. 7, 518. doi:10.3389/fmars.2020.00518
Kiko, R., Hauss, H., Buchholz, F., and Melzner, F. (2016). Ammonium Excretion and Oxygen Respiration of Tropical Copepods and Euphausiids Exposed to Oxygen Minimum Zone Conditions. Biogeosciences 13, 2241–2255. doi:10.5194/bgd-12-17329-201510.5194/bg-13-2241-2016
Lam, P., and Kuypers, M. M. M. (2011). Microbial Nitrogen Cycling Processes in Oxygen Minimum Zones. Annu. Rev. Mar. Sci. 3, 317–345. doi:10.1146/annurev-marine-120709-142814
Laufkötter, C., John, J. G., Stock, C. A., and Dunne, J. P. (2017). Temperature and Oxygen Dependence of the Remineralization of Organic Matter. Glob. Biogeochem. Cycles 31, 1038–1050. doi:10.1002/2017GB005643
Li, G., Cheng, L., Zhu, J., Trenberth, K. E., Mann, M. E., and Abraham, J. P. (2020). Increasing Ocean Stratification over the Past Half-century. Nat. Clim. Change 10, 1116–1123. doi:10.1038/s41558-020-00918-2
Li, X., Song, J., Yuan, H., Li, N., Duan, L., and Wang, Q. (2017). The Oxygen Minimum Zones (OMZs) and its Ecoenvironmental Effects in Ocean. Mar. Sci. 41, 127–138. doi:10.11759/hykx20170821003(in Chinese with English abstract).
Lopez-Urrutia, A., San Martin, E., Harris, R. P., and Irigoien, X. (2006). Scaling the Metabolic Balance of the Oceans. Proc. Natl. Acad. Sci. 103, 8739–8744. doi:10.1073/pnas.0601137103
Lumpkin, R., and Speer, K. (2007). Global Ocean Meridional Overturning. J. Phys. Oceanogr. 37, 2550–2562. doi:10.1175/jpo3130.1
Ma, J., Song, J., Li, X., Yuan, H., Li, N., Duan, L., et al. (2020b). Effects of Y3 Seamount on Nutrients and its Coupling Relationships with Ecological Environment in the Western Pacific Ocean. Earth Sci. Front. 27, 322–331. doi:10.13745/j.esf.sf.2019.8.16(in Chinese with English abstract)
Ma, J., Song, J., Li, X., Yuan, H., Li, N., Duan, L., et al. (2020c). Geochemical Characteristics of Particulate Organic Carbon in the Kocebu Seamount Waters of the Western Pacific Ocean in spring 2018. Adv. Earth Sci. 35, 731–741. doi:10.11867/j.issn.1001-8166.2020.057(in Chinese with English abstract)
Ma, J., Song, J., Li, X., Yuan, H., Li, N., Duan, L., et al. (2018). Research Progress on Oceanic Seamounts and Their Ecoenvironmental Characteristics. Mar. Sci. 42, 150–160. doi:10.11759/hykx20180222001(in Chinese with English abstract)
Ma, J., Song, J., Li, X., Yuan, H., Li, N., Duan, L., et al. (2020a). Control Factors of DIC in the Y3 Seamount Waters of the Western Pacific Ocean. J. Ocean. Limnol. 38, 1215–1224. doi:10.1007/s00343-020-9314-3
Ma, J., Song, J., Li, X., Yuan, H., Li, N., Duan, L., et al. (2019). Environmental Characteristics in Three Seamount Areas of the Tropical Western Pacific Ocean: Focusing on Nutrients. Mar. Pollut. Bull. 143, 163–174. doi:10.1016/j.marpolbul.2019.04.045
Martiny, A. C., Vrugt, J. A., and Lomas, M. W. (2014). Concentrations and Ratios of Particulate Organic Carbon, Nitrogen, and Phosphorus in the Global Ocean. Sci. Data 1, 140048. doi:10.1038/sdata.2014.48
Mcdonnell, A. M. P., Boyd, P. W., and Buesseler, K. O. (2015). Effects of Sinking Velocities and Microbial Respiration Rates on the Attenuation of Particulate Carbon Fluxes through the Mesopelagic Zone. Glob. Biogeochem. Cycles 29, 175–193. doi:10.1002/2014GB004935
Paerl, H. W. (2006). Assessing and Managing Nutrient-Enhanced Eutrophication in Estuarine and Coastal Waters: Interactive Effects of Human and Climatic Perturbations. Ecol. Eng. 26, 40–54. doi:10.1016/j.ecoleng.2005.09.006
Paulmier, A., and Ruiz-Pino, D. (2009). Oxygen Minimum Zones (OMZs) in the Modern Ocean. Prog. Oceanography 80, 113–128. doi:10.1016/j.pocean.2008.08.001
Schmidtko, S., Stramma, L., and Visbeck, M. (2017). Decline in Global Oceanic Oxygen Content during the Past Five Decades. Nature 542, 335–339. doi:10.1038/nature21399
Song, J. (2010). Biogeochemical Processes of Biogenic Elements in China Marginal Seas. Berlin: Springer Science & Business Media, 1–137. doi:10.1007/978-3-642-04060-3_1
Stramma, L., Johnson, G. C., Sprintall, J., and Mohrholz, V. (2008). Expanding Oxygen-Minimum Zones in the Tropical Oceans. Science 320, 655–658. doi:10.1126/science.1153847
Stramma, L., Prince, E. D., Schmidtko, S., Luo, J., Hoolihan, J. P., Visbeck, M., et al. (2012). Expansion of Oxygen Minimum Zones May Reduce Available Habitat for Tropical Pelagic Fishes. Nat. Clim Change 2, 33–37. doi:10.1038/nclimate1304
Van Mooy, B. A. S., Keil, R. G., and Devol, A. H. (2002). Impact of Suboxia on Sinking Particulate Organic Carbon: Enhanced Carbon Flux and Preferential Degradation of Amino Acids via Denitrification. Geochimica et Cosmochimica Acta 66, 457–465. doi:10.1016/S0016-7037(01)00787-6
Vaquer-Sunyer, R., and Duarte, C. M. (2008). Thresholds of Hypoxia for marine Biodiversity. Pnas 105, 15452–15457. doi:10.1073/pnas.0803833105
Wang, F., Li, Y., Zhang, Y., and Hu, D. (2013). The Subsurface Water in the North Pacific Tropical Gyre. Deep Sea Res. Part Oceanographic Res. Pap. 75, 78–92. doi:10.1016/j.dsr.2013.01.002
Weber, T., and Bianchi, D. (2020). Efficient Particle Transfer to Depth in Oxygen Minimum Zones of the Pacific and Indian Oceans. Front. Earth Sci. 8, 376. doi:10.3389/feart.2020.00376
Wright, J. J., Konwar, K. M., and Hallam, S. J. (2012). Microbial Ecology of Expanding Oxygen Minimum Zones. Nat. Rev. Microbiol. 10, 381–394. doi:10.1038/nrmicro2778
Wu, J., Calvert, S. E., Wong, C. S., and Whitney, F. A. (1999). Carbon and Nitrogen Isotopic Composition of Sedimenting Particulate Material at Station Papa in the Subarctic Northeast Pacific. Deep Sea Res. Part Topical Stud. Oceanography 46, 2793–2832. doi:10.1016/S0967-0645(99)00084-3
Yao, P., Wang, X. C., Bianchi, T. S., Yang, Z. S., Fu, L., Zhang, X. H., et al. (2020). Carbon Cycling in the World's Deepest Blue Hole. J. Geophys. Res. Biogeosci. 125, e2019JG005307. doi:10.1029/2019JG005307
Yao, P., Yu, Z., Bianchi, T. S., Guo, Z., Zhao, M., Knappy, C. S., et al. (2015). A Multiproxy Analysis of Sedimentary Organic Carbon in the Changjiang Estuary and Adjacent Shelf. J. Geophys. Res. Biogeosci. 120, 1407–1429. doi:10.1002/2014JG002831
Yao, P., Zhao, B., Bianchi, T. S., Guo, Z., Zhao, M., Li, D., et al. (2014). Remineralization of Sedimentary Organic Carbon in Mud Deposits of the Changjiang Estuary and Adjacent Shelf: Implications for Carbon Preservation and Authigenic mineral Formation. Continental Shelf Res. 91, 1–11. doi:10.1016/j.csr.2014.08.010
Keywords: oxygen minimum zone, POC, δ 13 C-POC, Tropical Western Pacific Ocean, seamount
Citation: Ma J, Song J, Li X, Wang Q, Zhong G, Yuan H, Li N and Duan L (2021) The OMZ and Its Influence on POC in the Tropical Western Pacific Ocean: Based on the Survey in March 2018. Front. Earth Sci. 9:632229. doi: 10.3389/feart.2021.632229
Received: 22 November 2020; Accepted: 04 June 2021;
Published: 16 June 2021.
Edited by:
Peng Yao, Ocean University of China, ChinaReviewed by:
Qinsheng Wei, First Institute of Oceanography, ChinaTetjana Ross, Institute of Ocean Sciences, Canada
Copyright © 2021 Ma, Song, Li, Wang, Zhong, Yuan, Li and Duan. This is an open-access article distributed under the terms of the Creative Commons Attribution License (CC BY). The use, distribution or reproduction in other forums is permitted, provided the original author(s) and the copyright owner(s) are credited and that the original publication in this journal is cited, in accordance with accepted academic practice. No use, distribution or reproduction is permitted which does not comply with these terms.
*Correspondence: Jinming Song, am1zb25nQHFkaW8uYWMuY24=; Xuegang Li, bGl4dWVnYW5nQHFkaW8uYWMuY24=