
95% of researchers rate our articles as excellent or good
Learn more about the work of our research integrity team to safeguard the quality of each article we publish.
Find out more
ORIGINAL RESEARCH article
Front. Earth Sci. , 15 July 2021
Sec. Geochemistry
Volume 9 - 2021 | https://doi.org/10.3389/feart.2021.631190
This article is part of the Research Topic Gas Geochemistry: New Progresses and Applications View all 24 articles
 Gladys V. Melián1,2,3*
 Pedro A. Hernández1,2,3
 Nemesio M. Pérez1,2,3
 María Asensio-Ramos1Eleazar Padrón1,2,3Mar Alonso1,2Germán D. Padilla1,2José Barrancos1,2Francesco Sortino4Hirochicka Sumino5Fátima Rodríguez1Cecilia Amonte1Sonia Silva6Nadir Cardoso6José M. Pereira7
We report the results of the geochemical monitoring of the fumarolic discharges at the Pico do Fogo volcano in Cape Verde from 2007 to 2016. During this period Pico do Fogo experienced a volcanic eruption (November 23, 2014) that lasted 77 days, from a new vent ∼2.5 km from the fumaroles. Two fumaroles were sampled, a low (F1∼100°C) and a medium (F2∼300°C) temperature. The variations observed in the δ18O and δ2H in F1 and F2 suggest different fluid source contributions and/or fractionation processes. Although no significant changes were observed in the outlet fumarole temperatures, two clear increases were observed in the vapor fraction of fumarolic discharges during the periods November 2008–2010 and 2013–2014. Also, two sharp peaks were observed in CO2/CH4 ratios at both fumaroles, in November 2008 and November 2013. This confirms that gases with a strong magmatic component rose towards the surface within the Pico do Fogo system during 2008 and 2013. Further, F2 showed two CO2/Stotal peaks, the first in late 2010 and the second after eruption onset, suggesting the occurrence of magmatic pulses into the volcanic system. Time series of He/CO2, H2/CO2 and CO/CO2 ratios are low in 2008–2009, and high in 2013–2014 period, supporting the hypothesis of fluid input from a deeper magmatic source. Regarding to the isotopic composition, increases in air-corrected 3He/4He ratios are observed in both fumaroles; F1 showed a peak in 2010 from a minimum in 2009 during the first magmatic reactivation onset and another in late 2013, while F2 displayed a slower rise to its maximum in late 2013. The suite of geochemical species analyzed have considerably different reactivities, hence these integrated geochemical time-series can be used to detect the timing of magmatic arrivals to the base of the system, and importantly, indicate the typical time lags between gas release periods at depth and their arrival at the surface. The high 3He/4He ratios in both fumaroles in the range observed for mid-ocean ridge basalts, indicating that He is predominantly of upper mantle origin. This work supports that monitoring of the chemical and isotopic composition of the fumaroles of the Pico do Fogo volcano is a very important tool to understand the processes that take place in the magmatic-hydrothermal system and to be able to predict future episodes of volcanic unrest and to mitigate volcanic risk.
Volcanoes are the main degassing windows of the planet, even, in a state of quiescence, are able to degas continuously. Volcanic gases are emitted to the atmosphere both as diffuse degassing (Chiodini et al., 1996; Hernández et al., 2001; Pérez et al., 2011; Melián et al., 2014, 2019; Cardellini et al., 2017; Padrón et al., 2021) and visible emanations (e.g., fumaroles, plumes; Giggenbach, 1975; Fisher et al., 1996; Hilton et al., 2002; Melián et al., 2012; Gresse et al., 2018). The composition of the fluids discharged by volcanoes are a reflection of 1) deep processes such as the injection of new magma, degassing of deep mafic magma in the lower crust etc. and 2) secondary processes, as for example gas re-equilibrium, interaction with meteoric water-fed, water-rock interaction etc. (Giggenbach, 1980, 1984, 1987, 1993; Chiodini and Marini 1998; Taran and Giggenbach, 2003; Oppenheimer et al., 2012). Increases of the volatile content in magma plays a fundamental role in pre-eruptive pressurization of volcanic systems (Wallace, 2001). Indeed, dissolved gases in magma are the driving force behind eruptions (Symonds et al., 1994).
Direct in situ sampling of fumaroles has been the commonly used technique for determining the chemical and isotopic composition of volcanic gases (Giggenbach 1975), due to its reliability and the possibility to extensively investigate the main, minor, trace and ultra-trace compounds to isotopic investigation (e.g., Symond et al., 1994; Giggenbach, 1992, Hilton et al., 2002; Chiodini, 2009; Melián et al., 2014). The main disadvantage of this sampling method is that continuous real-time monitoring is not yet feasible. Nevertheless, it is a valuable geochemical tool for evaluating the volcanic activity of those systems where there is no real-time monitoring, or remote sensing observation, of visible volcanic gas emissions (Giggenbach, 1987; Fischer et al., 1996; Melián et al., 2012; Padrón et al., 2012; Caliro et al., 2015). Variations in the relative content of magmatic fluids from fumarole discharges provide us with valuable information about processes that are affecting the volcanic-hydrothermal system at depths (Giggenbach, 1987; Fischer et al., 1996; Taran et al., 1998; Hilton et al., 2010). Likewise, the study of magmatic-hydrothermal fluids is crucial to understand and compare the origin and evolution of volcanoes worldwide (Javoy et al., 1986; Hilton et al., 2002; Aiuppa et al., 2005a, 2005b; Zelenski and Taran, 2011; Chiodini et al., 2012; Melián et al., 2014). The early detection of changes in volcanic activity are fundamental when establishing the necessary criteria to activate early warning protocols for civil protection (Tilling, 1995).
Pico do Fogo (2829 m a.s.l.), which is located on the island of Fogo, is the only currently active stratovolcano in Cabo Verde archipelago. The summit crater of Pico do Fogo is characterized by a wide field of active fumaroles and high emission rates of volcanic gases (Dionis et al., 2015a, 2015b; Aiuppa et al., 2020). During recent years, several volcanic gas studies have been carried out in Pico do Fogo volcano, mainly focused on the diffuse degassing of carbon dioxide (CO2), hydrogen sulphide (H2S), and on thermal energy release (Dionis et al., 2015a, 2015b). More recently, Alonso et al. (2021) estimated the diffuse helium (He) degassing and thermal energy from the summit crater of Pico do Fogo during 2007–2018 period observed. Alonso et al. (2021) observes significant increases in 3He/4He isotopic ratio, 3He, mantle 4He emission rates and thermal energy in 2010 and 2013, and drawsa relationship between magmatic intrusions 4 years and 1 year before the eruptive period 2014–2015. However, very few studies of Fogo volcano fumarolic geochemistry have been reported. Recently, Aiuppa et al. (2020) estimated the emission of volatiles from Pico do Fogo fumaroles by combining measurements of the fumarole composition (direct sample and portable Multi-GAS) and SO2 flux (near-vent UV Camera recording). Aiuppa et al. (2020) showed that the CO2 emitted from fumarolic vents of Fogo volcano (1,060 ± 340 t·d−1) is larger than current diffuse CO2 degassing (828 ± 5 t·d−1; Dionis et al., 2015a) of Fogo Island, evidencing the continuous contribution of deep magmatic gases to the system.
This work presents the first study of the temporal evolution (2007–2016) of fumarole chemistry from Pico do Fogo volcano, and describes the observed changes in the chemical and isotopic composition fumarolic discharges as geochemical precursory signals of the effusive volcanic eruption that commenced on 23 November 2014.
The Cape Verde islands are located about 800 km west of Senegal, at 14–17° latitude and 21–25° longitude. The archipelago consists of a volcanic chain of 10 major islands and eight minor islands (Figure 1A). The Cape Verde islands are located over Mesozoic oceanic crust and their origin is related to the existence of a mantle plume (Courtney and White, 1986). Volcanic activity is driven by the existence of a hot spot beneath the oceanic crust (Fonseca et al., 2003). Pico do Fogo volcano is the most active volcano of the Cabo Verde Island, with approximately 30 recorded volcanic eruptions since 1500 A.D. (Day et al., 1999). During the 20th century, two eruptions occurred, one in 1951 and the other in 1995, while the last and most recent eruption commenced in late 2014. One of the most striking features of Fogo island is the Cha das Caldeiras (Figure 1B), a caldera with a diameter of ∼9 km, and surrounded by a wall (Bordeira) that reaches 1000 m in height at some points. The caldera opens towards the sea on its eastern side, caused by a massive flank collapse at ∼73 ka (Day et al., 1999; Ramalho et al., 2015). Pico do Fogo volcano is located in the center of the caldera, which gave rise to several eruptions from its summit between 1500 and 1750 A.D. (Torres et al., 1997). Magmatism is dominated by silica-undersaturated alkaline melts of basanitic through phonolitic composition with the occurrence of carbonatites (Jørgensen and Holm 2002; Hildner et al., 2011; Mourão et al., 2012; Klügel et al., 2020). Escrig et al. (2005) reported that erupted lavas span a compositional spectrum from basanites to tephrites and nephelinites, with the 1995 eruption producing cogenetic basanites and phonotephrites (Hildner et al., 2011). The petrological study of lavas during the 2014–2015 volcanic eruption, showed somewhat evolved an alkaline composition ranging from tephrites to phonotephrites (Mata et al., 2017).
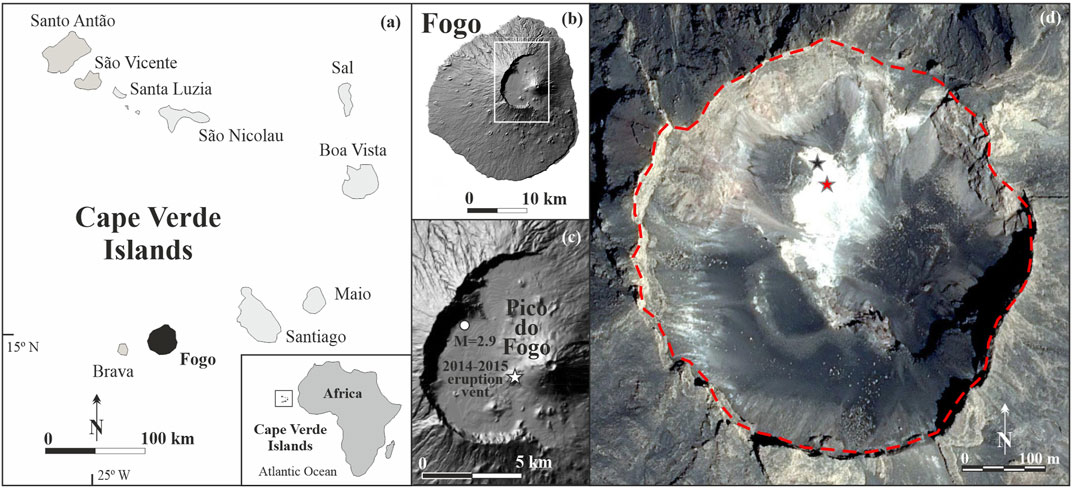
FIGURE 1. (A) Geographical location of Fogo Island in Cape Verde. (B) Shaded relief map of Fogo Island with the location of Cha das Caldeiras (white square). (C) Shaded relief map of Cha das Caldeiras showing Pico do Fogo volcano. The white star indicates the location of the main vent of the 2014–2015 eruption. The white circle indicates the location of the earthquake (M = 2.9) occurred on April 12, 2012 (Pérez et al., 2015). (D) Aerial view of Pico do Fogo crater with the location of F1 (black star) and F2 (red star) fumaroles.
Fogo Island generally only experiences minor seismic activity (Leva et al., 2019). The Volcanological Institute of Cape Verde (OVCV), within the framework of the MAKAVOL research project in collaboration with Spanish institutions (INVOLCAN, ITER and University of Granada) and Cape Verdean institutions (University of Cape Verde, Civil Protection Service and Civil Engineering Laboratory), installed a seismic network on the island in April 2012 (Carrion et al., 2012). This seismic network was operational for 2 months and registered a significant seismic event of magnitude 2.9 on April 12, 2012 (Figure 1C; Pérez et al., 2015). The epicenter was located within Cha das Caldeira and was felt by the inhabitants of the island. Seismic activity is also recorded by the Fogo seismic network of the Cape Verde National Institute of Meteorology and Geophysics (INMG), who also alerted Civil Protection authorities one day before the start of the eruption (Cape Verde Civil Protection, personal communication).
Cape Verde archipelago has semi-arid climatic conditions, with the southern region being drier. Due to its geographical location, close to the equator, and thermal mass of the surrounding ocean, the average annual temperature of Fogo Island is about 25°C, with variation of the average daily temperature only 5°C in the year (Heilweil et al., 2009). However, the temperature can decrease to 0°C in Chã das Caldeiras (Mota Gomes, 2006). Rainfall varies throughout the year, with long dry spells, concentrating mainly between July and October (equatorial monsoon; Vailleux and Bourguet 1974), and ranging from 550 mm·y−1 for the northern regions to 150 mm·y−1 for the southern regions, being extremely variable from one year to another. As in other volcanic oceanic island, precipitation is lost primarily through evapotranspiration and runoff to the sea, as a consequence of warm weather, the thickness and type of soil cover, and steep topographic gradients (Langworthy and Finan, 1997). In general, most of infiltration and groundwater recharge occurs in the higher-altitude areas of the island, where precipitation rates are highest, high-permeability basalts, and closed-basin calderas are combined (Barmen et al., 1984; Kallrén and Schreiber 1988; Barmen et al., 1990; Heilweil et al., 2009). In contrast to other active oceanic hotspots, environmental tracers show that deep geothermal circulation does not strongly affect groundwater of Fogo Island (Heilweil et al., 2009). However, there are no comprehensive geochemical studies available in the literature for this hydrothermal system.
On November 23, 2014, a volcanic eruption began at the west flank of Pico do Fogo (González et al., 2015; Cappello et al., 2016; Richter et al., 2016; Calvari et al., 2018; Klügel et al., 2020). The eruption started from a fissure which opened along the southwest flank of the volcano, very close to the site of the previous 1995 eruptive fissure (white star in Figure 1C). The 2014 lava flows caused the evacuation of ∼1000 residents living in the vicinity of the volcano, and the closure of a local airport. The 2014 event is well documented by a variety of field observations (Gonzalez et al., 2015; Cappello et al., 2016; Richter et al., 2016; Klügel et al., 2020). After 77 days of activity, the eruption ended on February 8, 2015.
Several studies have been published that characterize the 2014–2015 volcanic eruption. Mata et al. (2017) carried out a petrological study of lavas to investigate the magma plumbing system, reporting somewhat evolved alkaline compositions ranging from tephrites to phonotephrites. The lavas transported clinopyroxene and kaersutite phenocrysts and megacrysts to the surface, suggesting the main stages of magma evolution took place possibly at mantle depth (25.6 ± 5.5 km b.s.l.). The presence of kaersutite that has been extensively replacement by rhönite indicates that, assuming these crystals are phenocrystic, magma stalled at a shallower depth (<1.5 km b.s.l.) for at least a month prior eruption (Mata et al., 2017). Should these crystals be related to older, more evolved, pockets of phonotephrite magma that were intersected by the tephrite (Klügel et al., 2020) stalling at these depths may not be a salient feature of the principle magmatic pathway. Clinopyroxene and olivine crystals have been examined (Klügel et al., 2020) and feature ubiquitous 10–50 µm wide rims on clinopyroxene crystals, implying they grew in a few days or weeks during the ongoing eruption at upper mantle pressures ∼600 MPa (21 km depth), as a consequence of H2O loss from the melt. According to those authors, the effect of the loss of H2O could be due to magma degassing after its movement towards more superficial levels, or the exsolution of CO2 at depth. Ultimately, they concluded that rim zonation of olivine phenocrysts are indicative of magma rising to the surface in less than half a day after leaving this deep stall zone.
The eruption gave rise to a three-branch lava flow of rapid expansion that almost entirely destroyed the Portela and Bangeira villages within the Cha das Caldeiras (Calvari et al., 2018). Bagnardi et al. (2016) used high-resolution tri-stereo optical imagery acquired by the Pleiades-1 satellite constellation to generate a 1 m resolution DEM to quantify topographic changes associated with the 2014–2015 eruption at Fogo. They obtained a lava flow volume of 45.83 ± 0.02 × 10⁶ m3, emplaced over an area of 4.8 km2 at a mean rate of 6.8 m3·s−1. Cappello et al. (2016) used the HOTSAT satellite thermal monitoring system and the MAGFLOW lava flow emplacement model to forecast lava flow hazards during the 2014–2015 Fogo eruption. González et al. (2015) observed deformation at the summit of Fogo Island associated with the last eruption occurred in Pico do Fogo by means of Bayesian inversion of Sentinel-1 TOPS interferometry.
Direct gas sampling was performed at two fumarole vents located in the northwest sector inside the summit crater of Pico do Fogo (F1 and F2; stars in Figure 1D). Fumarole gas samples were collected during the period 2007–2016, over 14 (F1) and 8 (F2) field surveys (Figure 1D). F1 fumarole was characterized by a lower outlet temperature (62–140°C) during the period 2007–2014, whereas the F2 fumarole was characterized by a higher outlet temperature (266–354°C) during the entire sampling period (2008–2016). After 2014, the gas flow rate from fumarole F1 decreased significantly.
During sampling, a glass funnel was introduced into the fumarolic vent and buried to prevent atmospheric air entering into the sampling system. Fumarolic gas was collected in a vacuum pre-evacuated glass flask filled with 50 ml of a 4N KOH solution (Giggenbach and Gougel, 1989a, 1989b). The H2O vapour condenses, and the acidic gases (CO2, H2S, SO2, HCl) are absorbed into the alkaline solution, while the non-condensable gases (N2, O2, He, H2, CH4, CO) are concentrated in the gas phase of the sampling flask. Different aliquots of the discharging of gases were also collected in separate high-vacuum Pb glass containers for the analysis of C and He isotopes and a sample of the vapor condensate was collected with an ice-cooled condenser in order to analyze O and H isotopes.
The non-condensable gases were analyzed by a Varian 3800 gas-chromatograph equipped with a thermal conductivity detector (TCD) for the analysis of N2, O2, He and H2, and a flame ionization detector (FID) for the analysis of CH4 and CO (converted to CH4 at 400°C with a methanizer). Separation was carried out in a 20 m Molecular Sieve 5A packed column using argon as the carrier gas. Analytical error was estimated as <5% for the main gas components and <10% for minor gas compounds.
An aliquot of the alkaline liquid phase was oxidized with H2O2 for the determination of CO2, total sulfur (Stotal) and HCl. The determination of CO2 was accomplished through the analysis of CO3−2 performed by titration with diluted HCl using an automatic titration system (Metrohm 716 DMS Titrino, Metrohm). Stotal and HCl content were determined through the analysis of SO42− and Cl−, respectively, by means of ion chromatography coupled to a conductivity detector (Dionex DX-500 system).
The isotopic signature of C in CO2 (δ13C-CO2) from fumarolic gas was determined with an isotope-ratio mass spectrometer (IRMS) (Finnigan MAT 253, Thermo Fisher Scientific) equipped with a dual inlet system. The results are reported in δ units per mil vs. Vienna Pee Dee Belemnite standard (VPDB). The analytical error for δ13C-CO2 in the fumarolic gases was estimated in ±0.01‰.
Helium concentration and 3He/4He ratios were analyzed with a high-precision noble gas mass spectrometer (VG Isotech modified VG-5400) using the method described by Sumino et al. (2001). The analytical error for 3He/4He determination was <2%. The correction factor for the He isotope ratio was determined by measurements of inter-laboratory He standard named HESJ, with a recommended 3He/4He value of 20.63 ± 0.10 RA (Matsuda et al., 2002). The measured 3He/4He ratios were corrected for the addition of air on the basis of the 4He/20Ne ratios measured by mass spectrometry, assuming that Ne has an atmospheric origin (Craig and Lupton, 1976). The error in the reported 4He/20Ne ratios is 14%, which is estimated from stability of sensitivity of the mass spectrometer during repeated measurements of the air standard.
The isotopic signatures of hydrogen (2H/1H, δ2H) and oxygen (18O/16O, δ18O) in the fumarole condensate were determined using an IRMS (Finnigan MAT 253, Thermo Fisher Scientific) after a certain time of isotopic equilibrium with helium containing a known concentration of H2 and CO2, respectively, at 25°C (Epstein and Mayeda, 1953). In the case of 2H/1H ratio the use of platinum was necessary to catalyse the reaction (Coplen and Wildman, 1991). The results are reported in δ units per mil vs. Vienna standard mean ocean water (VSMOW) with a precision of ±0.1 and ±1‰ for δ18O and δ2H, respectively.
The complete chemical composition of Pico do Fogo sampled fumaroles is reported in Table 1. Two groups of fumaroles, F1 and F2, can be distinguished on the basis of measured outlet temperatures and gas contents. F1 fumarolic gases show low (<150°C) outlet temperatures, whereas F2 shows intermediate higher temperatures (>300°C up to 354°C), suggesting active magmatic degassing at the time of this study, and potentially more oxidizing conditions. Both fumaroles are water-dominated, with compositions ranging from 538.4 to 881.1 mmol/mol for F1 and 511.3–902.6 mmol/mol for F2. In the F1 fumarole, the concentration of CO2 in the total gas reaches 455.5 mmol/mol, followed by N2 (0.50–8.22 mmol/mol), H2 (0.01–0.83 mmol/mol) and HCl (0.60 mmol/mol). The concentration of O2, He, CO and CH4 reached 0.86, 0.007, 0.007 and 1.4 × 10⁻⁴ mmol/mol, respectively. For the F2 fumarole, CO2 concentration in the total gas reaches 483.7 mmol/mol, again followed by N2 (0.18–2.22 mmol/mol), H2 (0.04–0.61 mmol/mol) and HCl (0.38 mmol/mol) The concentration of O2, He, CO and CH4 concentrations are 0.27, 0.05, 0.038 and 1.5 × 10⁻⁴ mmol/mol, respectively.
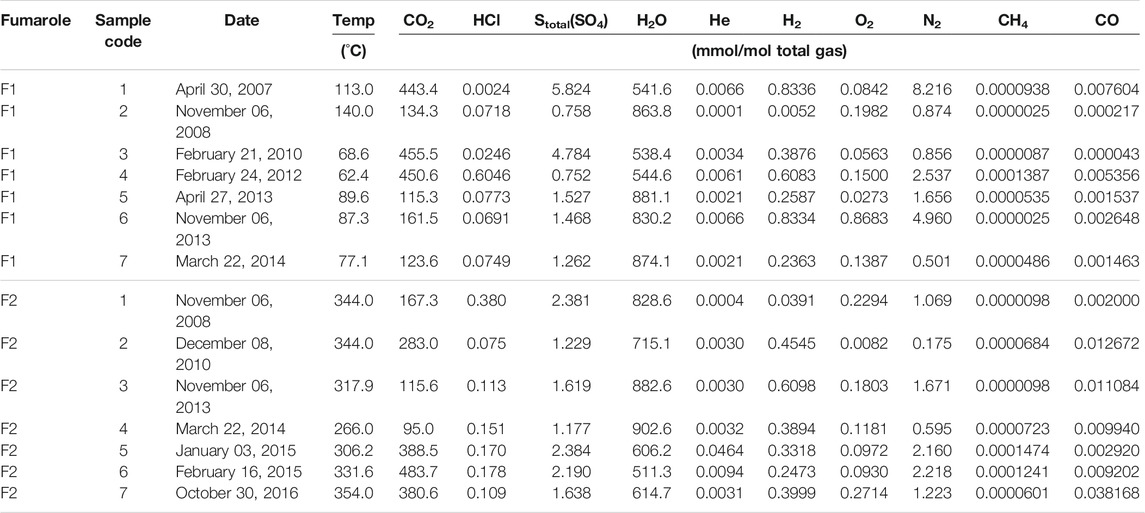
TABLE 1. Outlet temperatures (in degree Celsius) and chemical composition (dry gas fraction in mmol/mol total gas) of fumarolic gases from Pico do Fogo volcano.
Table 2 reports the oxygen and hydrogen isotopic composition of fumarole condensates, as well as carbon and helium isotopic composition of fumarole gas samples. The values obtained for water stable isotopes (δ units per mil vs. VSMOW) show much heavier δ18O values at the F2 fumarole (−3.1 to −1.1‰; average −1.9‰) compared to fumarole F1 (−11.8 to −5.2‰; average −8.2‰). F1 fumarole presents a range of δ2H values from −40 to −22‰, with an average value of −30‰, while F2 fumarole δ2H values range from −30 to −18‰ with an average of −24‰. The carbon isotopic composition of Pico do Fogo fumarolic CO2 (δ13C vs. VPDB) varies from −4.62 ± 0.02 to −3.61 ± 0.02‰ (average −4.23‰) at the F1 fumarole, and from −4.54 ± 0.07 to −3.78 ± 0.01‰ (average −4.17‰) at the F2 fumarole.
TABLE 2. δ18O and δ2H isotope ratios (‰ vs.VSMOW) in fumarole condensates, air-corrected 3He/4He and 4He/20Ne ratios, and fraction of He source (air, magma and crust) in fumarole gas samples. δ13C-CO2 (‰ vs.VPDB), CO2/3He ratios and fraction of C source (L = limestone, S = organic sediment and M = mantle sources) in fumarole gas samples. M/(L + S) refers to the fraction of components of Pico do Fogo fumaroles are also present.
The 3He/4He isotopic ratios of the fumarolic gases were measured for all samples collected in the study period. The air-corrected 3He/4He (R/RA)corr ranged from 7.66 to 8.63 (Alonso et al., 2021) and from 7.73 to 8.82 for F1 and F2, respectively. Based on three-component mixture of magmatic He (8.82 ± 0.09 RA), crust He (0.01 RA; Sano et al., 1985) and air He (1 RA), the proportion of magmatic He at Pico do Fogo varies between 86.7 and 97.9% for F1 and 71.0 and 100%, for F2 (Table 2).
The relative contents of CO2 and He (given as CO2/3He in Table 2) are in the range 7.8–12.7 × 10⁹ and 8.9–12.0 × 10⁹ for F1 and F2, respectively, which are higher than mid-ocean ridge basalt (MORB) source mantle (∼2 × 10⁹; Marty and Jambon, 1987). Based on a mass balance calculation proposed by Sano and Marty (1995), a significant contribution of mantle carbon (12–19% for F1, 12–17% for F2) can be estimated for Pico do Fogo volcano.
The fumarolic samples collected during this study provide important insights into the magmatic composition of gas discharge. In this section we focus on the major gaseous species, H2O, CO2, and other minority species such as CO and H2, which are essential to understand the thermodynamic processes occurring within the magmatic-hydrothermal system of the volcano. Two fumaroles with different characteristics were sampled, low temperature (F1) representing a hydrothermal end-member and a medium temperature (F2) representing a magmatic member (higher CO2/St, H2/H2O ratios and lower St/Cl ratios), giving rise to the possibility that equilibrium conditions of the hydrothermal gas in the H2O-H2-CO2-CO-CH4 system might not be the same in both cases. In Figure 2A, F1 gas samples (except sample 2F1) plot close to the rock buffer, indicating that the H2–H2O–H2S–SO2–CO–CO2 system at Fogo is controlled by reactions involving the rock buffer and not the H2S/SO2 gas buffer. The separate position of sample 2F1 may be due to the extra addition of H2O which results in more negative RH factor [RH = log(fH2/fH2O) ∼ log(XH2/XH2O); Giggenbach, 1987]. However, the samples from the F2 fumarole, although close to the rock buffer line (H2–H2O–H2S–SO2–CO–CO2 system is controlled by reaction involving the rock buffer), are also close to the SO2–H2S buffer, which involves contribution of elemental sulfur and SO2. Among the samples analyzed, 2F1 and 1F2 have the lowest RH, implying more oxidizing conditions (Giggenbach, 1987). These samples were collected in 2008, when the first magmatic intrusion of the period studied is assumed to have occurred. Therefore, the chemical composition of the majority of the gases in the fumarole discharges of the Pico do Fogo volcano are dominantly controlled by the rock buffer (FeO–FeO1.5) at 50°C<T<100°C, with a possible influence of gas phase reactions involving sulfur species at higher (>200°C) temperatures. These indices underscore that this system is characterized by extensive exchange of reactive chemical species between phases within the hydrothermal system, and so strongly implies that deep changes in the system will be detected at the surface after some delay.
FIGURE 2. (A) RH = log(XH2/XH2O) (where X is the mole fraction) vs. outlet fumarole temperatures from Pico do Fogo volcano. Buffer lines from Giggenbach (1987). (B) log(XH2/XH2O) vs. log(XCO/XCO2) for different redox conditions (Giggenbach, 1987). Compositions of the vapor phase separated in a single-step (SSVS) at different temperatures from a liquid phase initially at To = 150, 200, 250, 300 and 350°C are also shown (thin solid lines), as well as the compositions resulting from single-step vapor separation at 100°C starting from any initial temperature (dashed lines). Acronyms as used by Chiodini and Marini (1998). Green dots represent data from Aiuppa et al. (2020). Codes from Table 1.
As in Figure 2A and Figure 2B shows the redox conditions in the gas equilibration zone are controlled by the FeO–FeO1.5 hydrothermal buffer (Giggenbach, 1987) at relatively high H2/H2O ratios. Except for samples 3F1 and 4F2, all values plot between the vapor line and the composition resulting from single-step vapor separation at two fixed Ts temperatures (100 and 200°C) starting from an initial temperature (dashed lines in Figure 2B), indicating the vapours are generated through a single-step steam separation from boiling liquids of different initial temperatures (Chiodini and Marini, 1998). The position of the points along the single-step vapor separation (SSVS) lines is indicative of the extent of the boiling process. Values located near the vapor line have relatively high separation temperatures and low fractions of separated vapor, whereas values close to the 100°C Ts line are related to more energetic boiling processes, i.e., higher fractions of separated vapor (Chiodini and Marini, 1998). Sample 3F1 can be considered representative of equilibrated vapors, while sample 4F2 represents a pure equilibrated liquid phase. In general terms, there are significant variations in equilibrium temperatures between samples and they plot along different SSVS lines. F2 samples in particular have a wide range of separation temperatures indicative of changes in the physico-chemical conditions e.g., changes in the emission rates of magmatic fluids from the magmatic reservoir.
Estimated equilibrium temperatures for Pico do Fogo fumaroles based on the slow-reaction CH4, CO-CO2 (Figure 3; Giggenbach, 1987) thermometer show a range from 205 to 428°C at F1, and from 341 to 524°C at F2 in agree with temperatures estimated in Figure 2B. Two maximum values in F1 are observed: the first in 2007 and the second sustained over time (since 2010) and reaching its maximum value in November 2013, one year before the start of the most recent eruption. No data were estimated after 2014 for F1 fumarole. F2 fumarole, measured for the first time in 2009, records a constant increase in the equilibrium temperature until also reaching its maximum value in November 2013, before decreasing rapidly until January 2015, when equilibrium temperatures began increasing again. The changes observed in the equilibrium temperatures of F1 and F2 were likely due to an increase of volatile pressure in the magmatic-hydrothermal system of Pico do Fogo volcano, as is suggested by other geochemical and geophysical signals observed during the same period (González et al., 2015; Cappello et al., 2016; Richter et al., 2016; Calvari et al., 2018; Klügel et al., 2020; Alonso et al., 2021). Temporal variations of equilibria temperature estimated during the period of study showed similar behavior than CO/CO2 ratio, with a decreasing trend towards the magmatic reactivation onset of 2009–2010, and an increasing trend towards the volcanic eruption onset. Injections of deep-seated CO2 into the Fogo magmatic-hydrothermal system might have caused the observed variations in the fumarole CO/CO2 ratio. Magma ascended, decompression caused exsolution of vapor and magmatic gases, which were subsequently injected into the hydrothermal system, producing the observed increase in the temperature and He flux, and later the CO2 flux (Alonso et al., 2021), of the system.
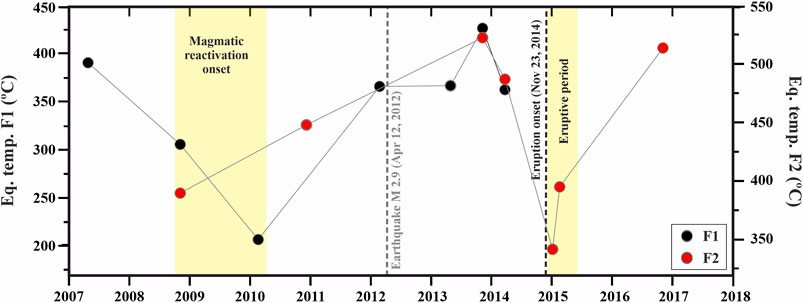
FIGURE 3. Temporal evolution of the temperature evaluated in the equilibrium conditions CH4, CO–CO2 (Giggenbach, 1987) of the Pico do Fogo volcano hydrothermal system.
The Pico do Fogo Fumaroles present, in general, compositions that are less hydrous than the fumaroles of others volcanic systems of the Macaranosia (Aippa et al., 2020). This can be explained be the long periods without significant rainfall at Fogo Island, and rainfall can be said to not play an important role in fumarole gas chemistry of Pico do Fogo (Vailleux and Bourguet 1974). This matches the observably weaker hydrothermal system of Pico do Fogo Volcano weak when compared to those present on geologically comparable, yet wetter, volcanic islands.
Figure 4 presents the main volatile compositions (CO2, He, N2, HCl, Stotal and H2O) measured in the F1 and F2 fumaroles. A CO2–N2–He ternary diagram (Figure 4A) shows that fumarolic gas samples are dominated by a magmatic component rich in CO2, except for one sample (5F2), which falls between the CO2 and He end-member. The CO2–H2O–He ternary diagram (Figure 4B) is used to distinguish between the magmatic and hydrothermal components of volcanic gases, corroborating the above interpretation by showing a strong magmatic component for most fumarolic samples. Figure 4C (CO2–H2O–St) and Figure 4D (CO2–St–HCl) provide further information about the chemical compositions of volcanic gases. Figure 4C evidences an extensive steam condensation process, probably reflecting the relatively low temperature conditions of the fumaroles’ conduits (Aiuppa et al., 2020) and/or a relatively weak hydrothermal system present at Pico do Fogo volcano (discussed above). The condensation process favors the scrubbing of Stotal and HCl as the magmatic gases rise to the surface as are observed in Figures 4C,D. The similar trends observed in the C:S:Cl ratios suggest that the sources for the major constituents and processes affecting their concentrations are similar. We note that F2 values seems to have a shallower component in 2008 during the first magmatic reactivation onset, and in 2013–2014, one year before the volcanic eruption onset.
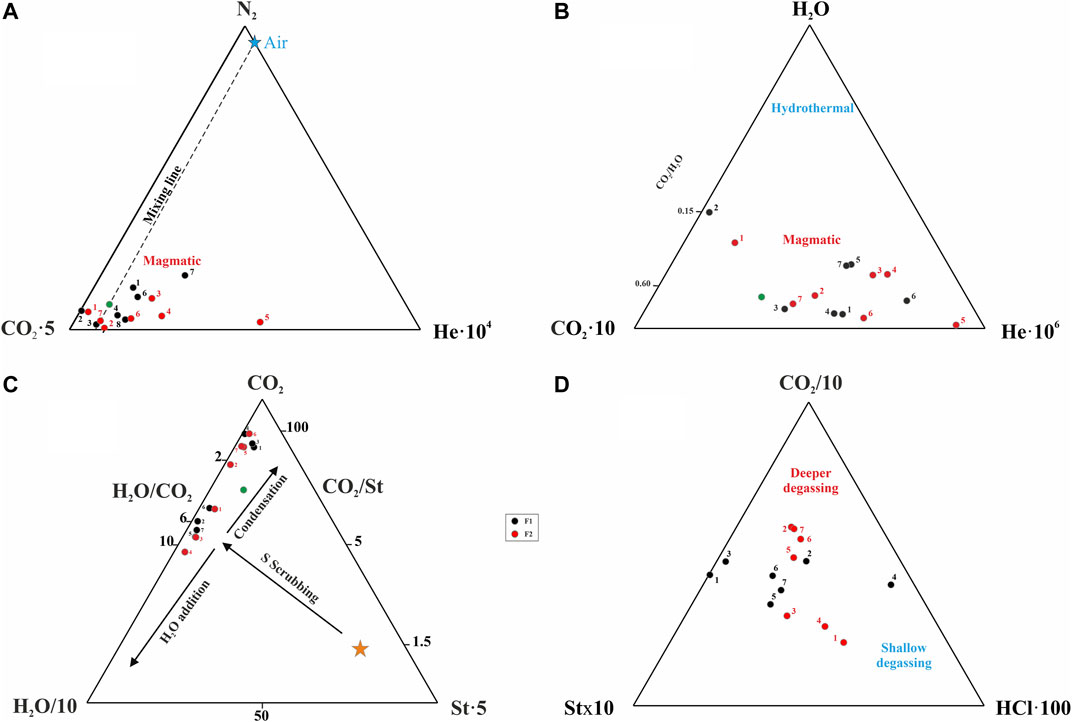
FIGURE 4. Ternary chemical composition diagrams for Pico do Fogo fumarole samples: (A) CO2-N2-He, (B) CO2-H2O-He, (C) CO2-H2O-St and (D) CO2-St-HCl. The green circle shows the mean values of composition summit fumaroles of Pico do Fogo from Aiuppa et al. (2020). The orange star indicates composition of the 2014–2015 Fogo eruptive plume from Hernández et al. (2015). Codes from Table 1.
Although only minor changes were observed in the outlet fumarole temperatures (Figure 5A), two clear increases were observed in the vapor fraction of fumarolic discharges during the periods 2008–2010 and 2013–2014 (Figure 5B). The increase in one order of magnitude in the steam/gas ratio supports two hypotheses: increasing temperature of the hydrothermal aquifer due to the input of magmatic gases and/or exolution of gases from the volcanic hydrothermal system as a consequence of depressurization of the system.
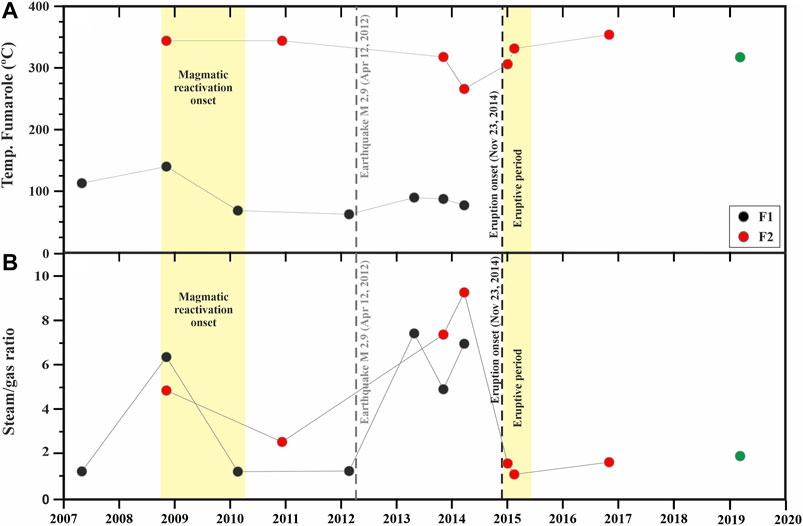
FIGURE 5. Temporal evolution of (A) fumarole temperatures (°C) and (B) steam/gas ratios measured in the Pico do Fogo fumaroles discharges. Green dots represent data from Aiuppa et al. (2020).
The steam/gas increases were accompanied by increases in concentrations of gas species that are poorly soluble in magma, such as He (see below), and are supported by the temporal evolution of equilibrium temperatures of the hydrothermal system (Figure 3), with two clearly differentiated peaks coinciding with the magmatic reactivation and pre-eruptive periods. An increase of equilibrium temperature at depth (see Figure 3) may cause a decrease in the coefficients of vapor-liquid gas distribution, and consequently an increase in the steam fraction of the fluids leaving the hydrothermal system (Cioni et al., 1984). The relative low values of the steam/gas ratio in the fumarolic discharges at the Pico do Fogo volcano compared to those observed in other volcanic systems in Macaronesia (Caliro et al., 2015; Ferreira et al., 2005; Melián et al., 2012) suggest poor shallow boiling hydrothermal aquifer underneath Fogo summit and therefore a greater magmatic signature evidence with a lower CO2/Stotal ratios and higher SO2/H2S ratios (Aiuppa et al., 2020). The equilibrium temperatures estimated for Pico do Fogo magmatic-hydrothermal system reached their highest values during the initial magmatic reactivation episode and then prior to eruption (Figure 3). Following this hypothesis would suggest that the relatively lower steam/gas ratios observed in 2008–2010 suggest that at that time, fumaroles were fed by a deeper and non-degassed magma source.
The increase of steam/gas ratio in Pico do Fogo volcano could be explained as a consequence of increase of permeability at depth due to increased fracturing, leading to more efficient gas escape and hence decompression. Both processes could have occurred in the Pico do Fogo hydrothermal volcanic system in the study period. The presence of a weak hydrothermal system and agreement between thermal and thermally sensitive geochemical indices suggests that the degree of magmatic contribution is the factor that better explains the observed variations. The steam/gas ratio therefore may be an effective parameter for the detection of changes in heat flow at depth at Fogo.
Oxygen and hydrogen isotopic ratios in fumarole condensates, together with carbon and helium isotopic ratios are given in Table 2. Figure 6 reports δ2H and δ18O values, the Local Meteoric Water Line (LMWL; δ2H = 7.8 × δ18O + 6.8; Sacchi et al., 1995), which is slightly lower than the Global Meteoric Water Line (GMWL; δ2H = 8 × δ18O + 10; Craig, 1961). Condensates have a wider range of δ2H isotopic values (F1 from −40 to −22‰ and F2 from −30 to −18‰) than δ18O (F1 from −11.8 to −5.2‰ and F2 from −3.1 to −1.1‰). F1 samples are depleted in δ18O relative to the LMWL by up to −7‰, whereas F2 samples are enriched by up to +3.5‰. All samples are depleted in δ2H relative to SMOW. Rainfall and well waters from Fogo Island (Heilweil et al., 2009) have a δ2H range similar to that of fumarole condensates, but a much narrower range of δ18O values (Figure 6).
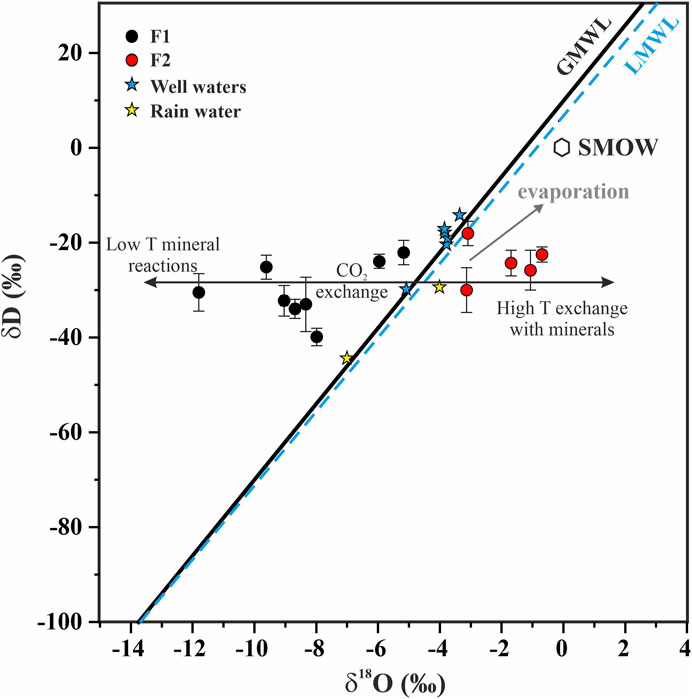
FIGURE 6. δ2H -H2O vs. δ18O-H2O for condensates collected in F1 and F2 fumaroles at Pico do Fogo volcano. The Global Meteoric Water Line (GMWL; Craig, 1961) and the Local Meteoric Water Line (LMWL; Sacchi et al., 1995) are shown. Blue and yellow stars correspond to ground waters collected from wells, and rain water, respectively (Mosteiros Basin, Fogo Island; Heilweil et al., 2009). Black arrows adapted from D’Amore and Panichi (1987).
Depletion/enrichment in δ18O relative to the meteorological LMWL, without changes in δ2H, are caused by the isotopic exchange of oxygen with CO2 and bedrock minerals at low and high temperature (black arrows in Figure 6; Karolyte et al., 2017), or by the separation of water and steam under geothermal conditions (Giggenbach, 1992). In natural fluids where the vapor phase coexists with abundant CO2, the exchange of δ18O between H2O and CO2 can be significant as long as the isotopic exchange rate and/or the residence time of the fluids are sufficiently long (Chiodini et al., 2000). The variations observed between F1 and F2 fumaroles suggest their fluid source contributions and/or fractionation processes are different. Samples plotting close to the LMWL probably have a stronger component of heated local water. F2 gas condensates are shifted towards heavier δ18O isotope values, indicating water-rock interaction and/or mixing with volcanic fluids. δ18O exchange between steam and CO2, the principal components of volcanic–hydrothermal vapors, can be mainly considered for fumarole F1 (Chiodini et al., 2000; Heilweil et al., 2009), since δ18O exchange between both components have a significant bearing on the interpretation of δ18O data (Chiodini et al., 2000).
The 3He/4He ratios are normalized to that in the atmosphere (RA = 1.4 × 10⁻⁶; Ozima and Podosek 2002). 3He/4He and 4He/20Ne ratios are displayed in Figure 7 and listed in Table 2. The air-corrected 3He/4He ratios at Pico do Fogo volcano (Table 2) range from 7.66 to 8.63 RA in Fumarole F1, and between 7.73 and 8.82 RA for F2, while 4He/20Ne ratios fluctuate significantly, ranging from 18 to 406 at F1 and 1 to 519 at F2. Fumarole F1 measurements are in agreement with those previously reported by Dionis et al. (2015b). All fumarolic samples fall on or close to a single mixing line between Air and MORB, with relatively constant 3He/4He indicating that variation in the 3He/4He ratios is dominated by the level of atmospheric contamination of the magmatic component (Figure 7) and indicating that magmatic He is predominantly of MORB-source like, upper mantle origin.
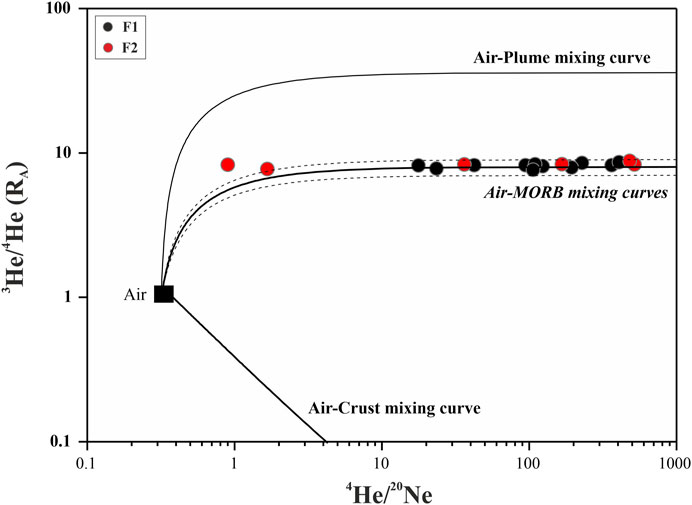
FIGURE 7. 4He/20Ne ratios and 3He/4He (RA) ratios observed in Pico do Fogo fumarole samples. Air has 3He/4He of 1xRA and 4He/20Ne ratios of 0.318 (Ozima and Podosek, 2002). Curves represent theoretical mixing lines between air and other end-members.
Based on Figure 7, mixing between three sources of He has been considered: magmatic, atmospheric, and crustal endmembers. We assume 3He/4He value of the magmatic endmember to be 8.82 RA based on the highest air-corrected 3He/4He ratio observed in this study. Although this value is slightly higher than average 3He/4He ratio (8.5 ± 0.2 RA) of olivine phenocrysts in 126 ka ankaramite lava from Fogo Island (Foeken et al., 2012), they are similarly in the range of MORBs (8 ± 1 RA, Graham, 2002), indicating almost negligible contribution of a plume-type endmember associated with higher 3He/4He ratio than the MORB range. The He contribution from the crust is required, since some air-corrected 3He/4He data are significantly lower than the magmatic 3He/4He value. The proportion of these three reservoirs considered can be calculated using the following equations:
where subscripts “a”, “m” and “c” indicate atmospheric, magmatic and crustal sources respectively, and A, M and C are the fraction of helium from atmospheric, magmatic and crustal respectively (Sano et al., 1985; Sano and Wakita, 1985). Using the following values: (3He/4He)a = 1 RA, (4He/20Ne)a = 0.318, (3He/4He)m = 8.82 RA, (4He/20Ne)m = 1000, (3He/4He)c = 0.01 RA, (4He/20Ne)c = 1000, the fraction of atmospheric, magmatic and crustal components can be calculated (Sano and Wakita, 1985), and are given in Table 2. Fumarole F1 contains a magmatic component between 86.7 and 97.9%, while the atmospheric component ranges from 0.1 to 1.8%, and the crust component from 2.0 to 13.0%. Fumarole F2 has a magmatic component between 71.0 and 100%, and atmospheric and crust components from 0 to 35.4% and 0–10.0% respectively. The atmospheric contamination is significant in the F2 samples of May 2009 and April 2013 that present a low 4He/20Ne ratio (19 and 35%, respectively).
In order to further explore potential sources for the fumarole gases, relationships among CO2, 3He and 4He were investigated (Figure 8). F1 and F2 samples form a cluster of points, with a MORB-like composition due to high 3He/4He ratios (7.66–8.82 RA, air-corrected) and CO2/3He ratios (7.76–14.9 × 10⁹). The sample cluster shows a slightly linear trend, extending towards the CO2 vertex, with an average 3He/4He ratio of 8.2 RA. Two samples show a slightly higher contribution of crustal-derived 4He with respect to the main sample cluster.
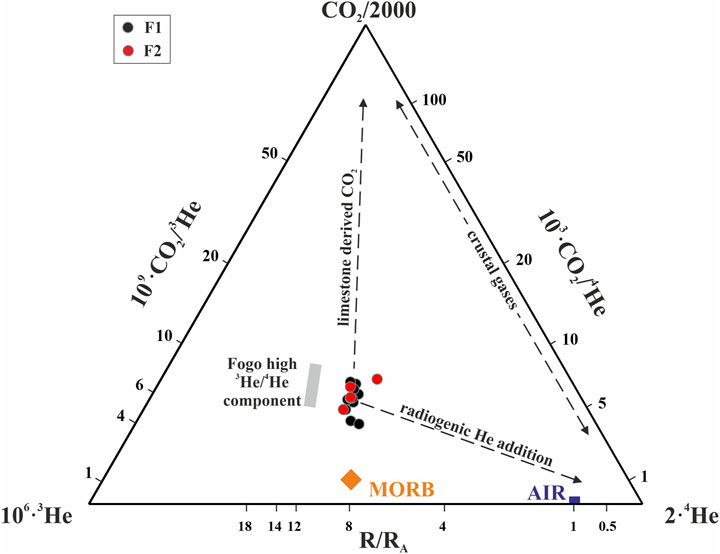
FIGURE 8. CO2, 3He and 4He relative compositions of the fumarolic samples from Fogo volcano (Giggenbach et al., 1993;Barry et al., 2013). MORB (8 ± 1 RA, Graham, 2002; CO2/3He = 2 ± 1×10⁹, Marty and Jambon, 1987) and Air (1 RA, Graham, 2002; CO2/3He = 1×10⁹, Marty and Jambon, 1987) are also reported. Gray rectangle represents the Fogo high 3He/4He component.
Fumarole fluid contributions can be further differentiated using isotopic He, C, and CO2 gas (Figure 9). F1 and F2 have δ13C–CO2 ranging from −4.62 ± 0.02 to −3.61 ± 0.02‰ (vs. VPDB) and CO2/3He ratios between 7.8 and 12.7 × 10⁹, indicating a strong limestone contribution, as can be expected based on the previous studies (Jørgensen and Holm, 2002), but with different mantle contribution in the range 12–19%. The variation in CO2/3He is likely linked to the addition of 3He-poor, CO2-rich gases (i.e., limestone-derived CO2), and radiogenic He (Figure 9). Figure 9A confirms this interpretation that Pico do Fogo fumarole samples are a mixture of a mantle-derived (MORB-like) component and a crustal component enriched in 13C, with high CO2/3He (addition of limestone-derived CO2), and lower CO2/4He at the same CO2/3He ratio (because of the addition of crust-derived, radiogenic He; Figure 9B). F1 and F2 samples show a trend towards more positive δ13C–CO2 values and lower CO2/4He ratios (Figure 9B), confirming an increase in radiogenic 4He and CO2 due to the addition of fluids of crustal origin.
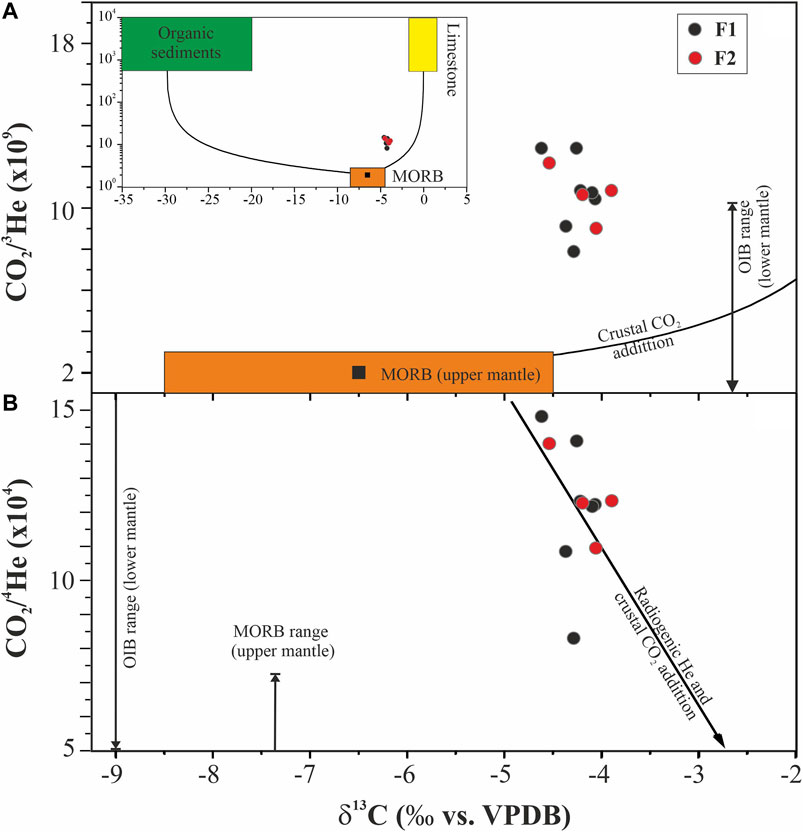
FIGURE 9. (A) CO2/3He ratio vs. δ13C–CO2 values for F1 and F2 fumarole samples. MORB, organic sediments and marine limestone end-members are shown. Solid lines represent binary mixing curves for mantle-organic sediments, and mantle-marine limestone. Endmembers: MORB δ13C–CO2 = −6.5 ± 2‰ and CO2/3He = 2 × 10⁹; organic sediments δ13C–CO2 −30 ± 10‰ and CO2/3He 1 × 10¹³; marine limestone (including slab carbonates): δ13C–CO2 0 ± 2‰ and 1 × 10¹³ (Marty et al., 1989; Sano and Marty, 1995; Sano and Williams, 1996). (B) CO2/4He vs. δ13C–CO2 for F1 and F2 fumarole samples [modified from Caliro et al. (2015)].
Temporal variations recorded in the chemical and isotopic composition of the fumarolic discharges of the Pico do Fogo volcano can be used to understand the relationship between the magmatic-hydrothermal system, and the volcanic activity observed during the study period. The reactive species CH4 and CO are excellent indicators of T-P redox conditions (Chiodini et al., 1993). Figure 10A shows the temporal evolution of CO/CO2 ratios (a robust proxy for temperature variations at depth; Chiodini, 2009) measured in the Pico do Fogo fumarole discharges. A gradual increase in CO/CO2 is observed starting in 2010, before the large earthquake on April 12, 2012, and continuing to increase up until the onset of the eruption on November 23, 2014.
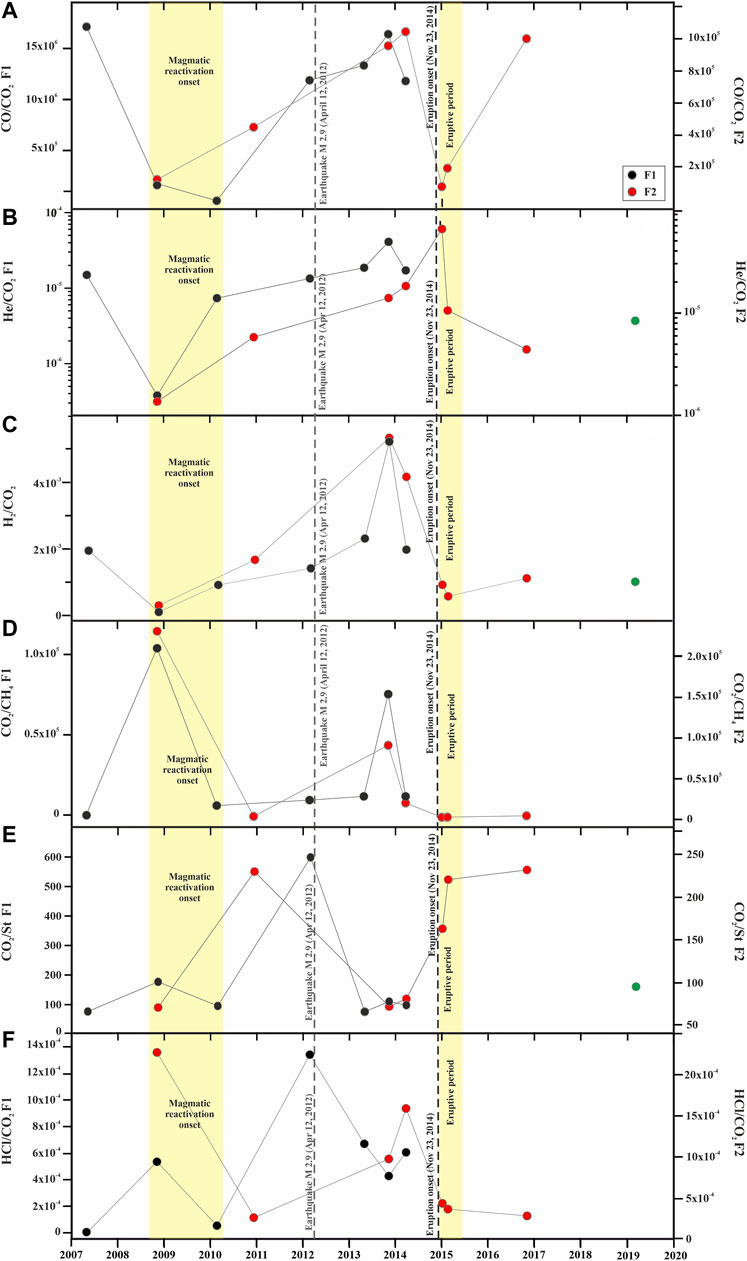
FIGURE 10. Temporal evolution of (A) CO/CO2, (B) He/CO2, (C) H2/CO2, (D) CO2/CH4, (E) CO2/Stotal(F) HCl/CO2, ratios measured in the Pico do Fogo F1 and F2 fumarole discharges. The green dot represents data from Aiuppa et al. (2020).
Relative abundances of gases with a magmatic origin, such as He, increase during magmatic intrusion episodes. Helium is chemically inert, non-biogenic, highly mobile, and relatively insoluble in water (the opposite behavior to CO2). H2 is a well-known geochemical tracer in volcanic systems. H2 plays a role in key redox reactions that occur in magmatic gases, because of its relationship to fO2 via the water dissociation reaction (e.g., Giggenbach 1987; Oppenheimer et al., 2012). Time series of He/CO2 and H2/CO2 for the Pico do Fogo fumaroles are given in Figures 10B,C. Both ratios are low in the period 2008–2009, and high in the 2013–2014 period. The geochemical anomalies reported here in the chemical composition of the fumarolic gases in 2009 indicate fluid input from a deeper magmatic intrusion, and so an increase in the emission of He (and therefore He/CO2) is expected at that time. However, He/CO2 and H2/CO2 ratios were higher in 2007, before the magmatic reactivation period of 2009. A similar pattern is seen in the CO/CO2 ratio (Figure 10A). He degassed from new, volatile-rich magma ascends easily to the surface, giving rise to the observed increase (Padrón et al., 2013) before other geochemical markers of magmatic reactivation in the system. This fact is confirmed by an obvious contribution of mantle-derived gases before 2009, for example 3He/4He (see following paragraph). The peaks observed in H2/CO2 are likely due to the relative increase of H2 emission because water-rock reactions are enhanced once magma enters the Pico do Fogo volcanic system.
CH4 is an excellent indicator of T-P redox conditions (Chiodini et al., 1993) and it is widely accepted that an injection of magmatic fluids to a hydrothermal system causes an increase in the CO2/CH4 of fumarolic discharges (Chiodini, 2009), albeit with some time delay due to aforementioned interactions and exchanges. The CO2 concentration in magmatic fluids is much higher than the concentration of CH4, which in turn is more abundant in hydrothermal fluids than in magmatic fluids. The exsolution of volcanic gases with a strong magmatic component rich in SO2 (due to higher oxidizing conditions) can dilute the CH4 content, increasing the CO2/CH4 ratio. Figure 10D shows the temporal evolution of CH4/CO2 ratios measured in the Pico do Fogo fumarole discharges. Pulses in the CO2/CH4 ratio are indicative of punctual of injection of magmatic fluids of deep origin (Chiodini, 2009). Two sharp peaks occur in CO2/CH4 ratios at both fumaroles, in November 2008 and November 2013.
The temporal evolution of the CO2/Stotal ratio in Fumaroles F1 and F2 of Pico do Fogo volcano is shown in Figure 10E. CO2/Stotal is commonly used to study variations in volcanic activity because CO2 and S have different solubilities in magma (Carroll and Webster, 1994; Holloway and Blank, 1994). When magma rises towards the surface, the least soluble gases (i.e., CO2) are first exsolved, producing an increase in the CO2/St. The measured CO2/Stotal ratio in the fumarolic discharges at Pico do Fogo volcano are in general higher than the observed in other intraplate volcanoes (Aiuppa, 2015) and from gases emitted in the 2014 eruption (Hernández et al., 2015), suggesting intense scrubbing in the deep S compound (Aiuppa et al., 2020). At Fumarole F1, a peak in the CO2/St ratio was observed 48 days before the 2.9 earthquake on April 12, 2012. In Fumarole F2, two clear peaks are observed in CO2/St, the first in late 2010 and the second after eruption onset.
During the ascent of magma to shallower levels, the solubility of volatiles in the magma marks the chemical composition of the magmatic fluid, the exsolution of the most insoluble gases occurs in the initial depressurisation phases (CO2 and He), followed by the most soluble (HCl, HF and H2O; Gerlach, 1986; Aiuppa et al., 2007; Burton et al., 2007; López et al., 2013). The HCl/CO2 ratio for the F1 and F2 fumarole for the period 2013–2016 is shown in Figure 10E. At Fumarole F1, a peak in the HCl/CO2 ratio was observed 48 days before the 2.9 earthquake on April 12, 2012. In Fumarole F2, a sharp increase in HCl/CO2 was observed in March 2014, which correlates with both the increase in CO/CO2 (Figure 10A) and the maximum value of the steam/gas ratio (heat flux; Figure 5B). This peak in HCl/CO2 corresponds to minima in the CO2/Stotal measured ratio (Figure 10D). The subsequent increase in the HCl/CO2 ratio in 2014 supports the exsolution of magmatic HCl rich gases in the magmatic plumbing system of Pico do Fogo volcano.
In general, the CO/CO2, He/CO2 and H2/CO2 ratios showed the best correlation with the variations in magmatic activity, with increases before the magmatic intrusion occurred in 2010 and the onset of the volcanic eruption in November 2014. The CH4/CO2, St/CO2 and HCl/CO2 ratios showed different temporal variabilities, although they generally increased prior to the volcanic eruption.
Peaks in the air-corrected 3He/4He ratios are a strong indicator for the contribution of magmatic He from a deep magmatic system (Barry et al., 2013). The temporal evolution of air-corrected 3He/4He ratios in both F1 and F2 fumaroles is illustrated in Figure 11A. Clear increases in air-corrected 3He/4He ratios are visible in both fumaroles: F1 shows a peak in 2010, from a minimum in 2009 during the magmatic reactivation onset (2008–2009) and another in late 2013, while F2 displays a slower rise to its maximum in late 2013, one year before the eruption.
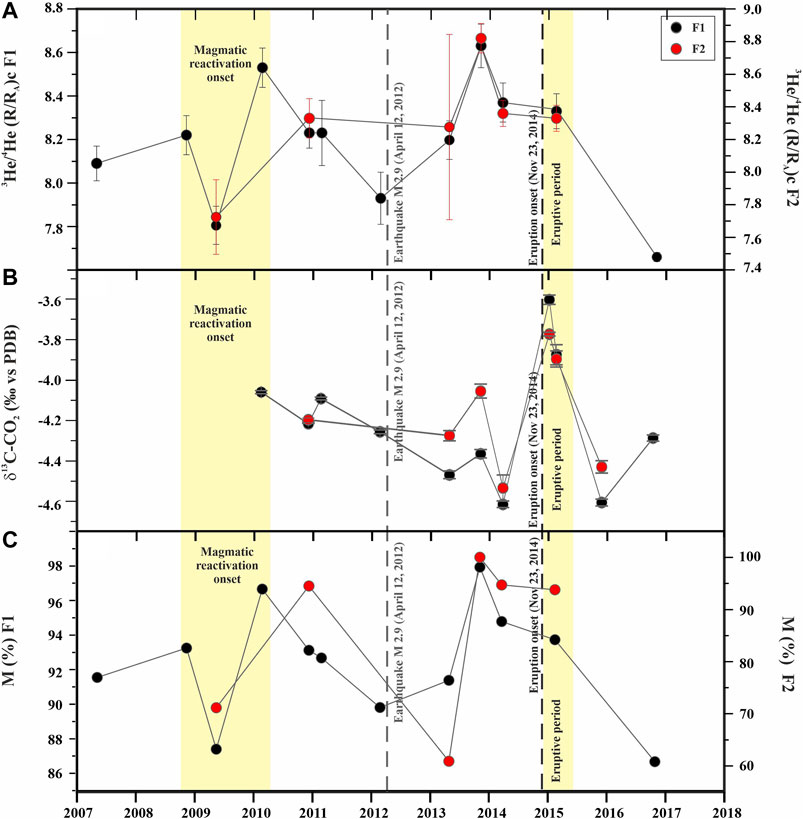
FIGURE 11. Temporal evolution of (A)3He/4He (R/RA)corr, (B) δ13C–CO2 (‰ vs. VPDB) and (C) magmatic He contribution (M), measured in the Pico do Fogo fumaroles discharges.
The temporal evolution of the isotopic composition of CO2 (expressed as δ13C–CO2‰ vs. VPDB, Figure 11B) shows a decreasing trend towards lighter values from 2010 to 2014, with heavier (13C/12C) δ13C–CO2 values measured just after the eruption (–4.62‰ and –4.54‰ vs. VPDB for F1 and F2, respectively). Once the eruption finished, δ13C–CO2 returned to lighter values. The temporal evolution indicates enrichment in carbon from a deeper source during the eruption onset, due to the volatile rich-magma associated to the extruded eruptive magma.
Observed variations in the air-corrected 3He/4He ratios at both fumaroles are in general well accompanied by coeval increases in CO2/3He (Figure 12), with a peak in 2012. The observed changes in the CO2/3He ratio coupled with variations in the isotopic composition of CO2, as well as variations in the 3He/4He ratio, are consistent with injections of magmatic fluids from depth. Figure 11C show the temporal evolution of magmatic He fraction (M) calculated based on the model proposed by Sano et al. (1985). The magmatic He fraction presents a similar behavior for F1 and F2 fumaroles with values of M slightly lower for F1 fumaroles than for F2 fumarole. The maximum M values were observed in 2010 and 2013–2014, when the first magmatic reactivation onset occurred and 1 year before of volcanic eruptions onset, respectively. These peaks are coincident with pulses in H2/CO2, He/CO2, CO2/Stotal and CO/CO2 ratios. These temporal variations of magmatic He fractions are indicative of the occurrence of magmatic fluid pulses from magma.
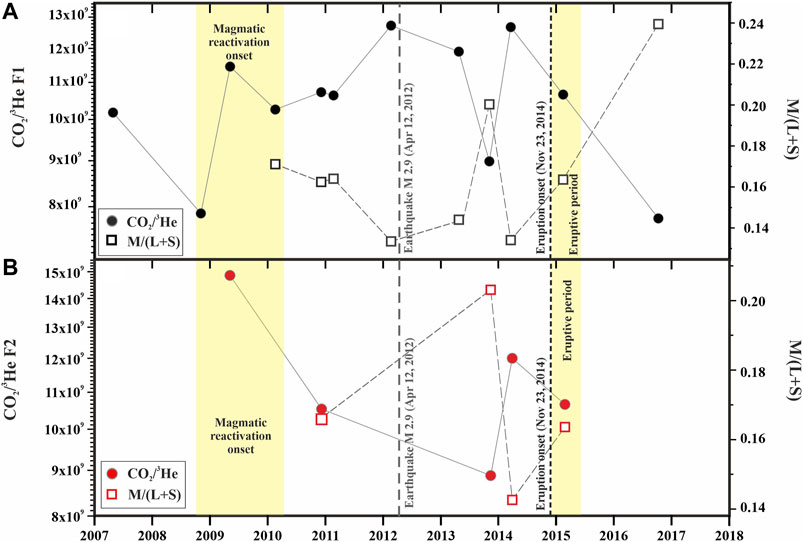
FIGURE 12. Temporal evolution of CO2/3He and M/(L + S) ratio (L = limestone, S = organic sediment and M = mantle sources) for F1 (A) and F2 (B) fumarole emissions.
To estimate carbon sources for the Pico do Fogo fumaroles, the following mixing calculations are used (Sano and Marty, 1995):
where obs, L, M, and S refer to the observed value, marine Limestone (L), MORB (M), and organic Sediments (S), respectively. Fumarole F1 shows: limestone 76–82%, organic Sediments 5–8% and MORB 12–19%; Fumarole F2 displays a limestone contribution of 78–80%, organic Sediments 5–7% and MORB 12–19% (Table 2). The temporal variations of the M/(L + S) ratio are displayed in Figure 12. From the first measurement in 2009, fumarole F1 decreases until 2013, followed by a sharp peak at the end of 2013 before falling. F2 also peaks at the end of 2013 and diminishes thereafter. The peaks reflect an increase in the relative proportion of mantle-derived CO2. The temporal agreement between 3He/4He ratios and the proportion of CO2 of mantle derivation is consistent with release of volatiles from a mantle-derived component during the periods 2008–2009 and 2013–2014.
Several authors have reported that magmas from the 1951, 1995 and 2014–2015 eruptions of Pico do Fogo were stored prior to eruption within the uppermost mantle at 15–30 km depth and stalled during ascent within the lower crust at 8–13 km depth (Munhá et al., 1997; Hildner et al., 2011, 2012; Mata et al., 2017; Klügel et al., 2020). No evidence was reported for a very shallow crustal magma reservoir during these eruptions. Klügel et al. (2020) proposed a model for the storage and transport of magma erupted during the 2014–2015 eruption of Pico do Fogo volcano. The main magma storage reservoir was within the uppermost mantle, at ∼24–30 km depth. The arrival of fresh and volatile-rich magma to this zone probably occurred during the onset of the first magmatic reactivation observed in 2008–2009 (Alonso et al., 2021). Around one year before the 2014 eruption, magma ascended to a shallower (∼21 km) complex storage region with an interconnected network of magma pockets and dyke/sills (Klügel et al., 2020), and was stored along this zone in the lowermost crust.
Based on the present work and other previous findings (Aiuppa et al., 2020; Klügel et al., 2020) we reconstruct the evolution of the fluids at Pico do Fogo volcano from 2007 to 2016 in a conceptual model of five phases (Figure 13):
• Phase 1: April 2007–November 2008 (Figure 13A). This period corresponds to an inter-eruptive period. Fumarolic discharges were characterized by moderate ratios in the main volcanic gases, as well as a low steam/gas ratio and a relatively high magmatic He component. In general, the composition of Pico do Fogo fumarolic gas discharges were CO2-richer with lower H2O contents. This coincidence is supports the hypothesis that CO2 flushing is responsible of H2O loss in different magma pockets (Klüger et al., 2020). The source of magmatic gas at Pico do Fogo is located in the magma reservoir at the uppermost mantle at 24–30 km depth (Klüger et al., 2020).
• Phase 2: November 2008–2010 (Figure 13B). During this period, the chemical and isotopic composition of fumarolic discharges showed significant changes. In November 2008, the deep magmatic environment became slightly more oxidizing and a decrease in the equilibrium temperature with a minimum in 2010 was observed. This was probably due to injections of magmatic CO2 into the Fogo magmatic-hydrothermal system that caused decreases in the fumarole CO/CO2 ratio. In this period, a significant increase of 3He/4He occurred with a maximum value registered for F1 in 2010. Maximum values of magmatic He component were also observed for F1 and F2 fumarolic discharges. These changes were likely due to an increase of volatile pressure in the magmatic-hydrothermal system. The geochemical data suggest the occurrence of a first magmatic reactivation due possibly to a deep magma intrusion with temporary stalling in a zone of magma accumulation at ∼12–13 km depth, near the Moho, which is described by Klügel et al. (2015), such as the magma accumulation zone.
• Phase 3: 2011–2012 (Figure 13C). During this period, geochemical parameters generally returned to levels of Phase 1, which suggests that the intrusion of magma of Phase 2 ended. 48 days before a seismic event of magnitude 2.9 occurred in April 2012 (Pérez et al., 2015) an increase in the HCl/CO2 and CO2/Stotal ratios were observed.
• Phase 4: 2014–June 2015 (Figure 13D). During this period, significant changes were recorded in the chemical and isotopic composition of the fumarolic discharges. Maximum values of H2/CO2, He/CO2, CO2/Stotal and CO/CO2 ratios were observed in 2013–2014. These peaks are coincident with maximum values of 3He/4He and magmatic He component in both fumaroles. These changes were likely due to an increase of volatile pressure in the magmatic-hydrothermal system of Pico do Fogo volcano. The composition of Pico do Fogo fumarolic gas discharges were again CO2-richer with lower H2O contents. These changes were likely due to a new magmatic volatile injection and heat transfer in the magmatic-hydrothermal system as is suggested by other geochemical and geophysical signals observed during the same period (González et al., 2015; Cappello et al., 2016; Richter et al., 2016; Calvari et al., 2018; Klügel et al., 2020; Alonso et al., 2021). During the rise of magma to the surface, the flowing magma passed through a complex storage region characterized by an interconnected network of dikes/sills, where part of the magma passed through and part was stored (Klügel et al., 2020). The magma was again accumulated in the area near the Moho (∼12–13 km depth). After breaking through the storage region, the magma rose rapidly through the crust and reached the surface on November 23, 2014 (Klügel et al., 2020). The presumably thin conduit and distance of ∼2.5 km between the vent and the geochemical sample sites explains why close temporal trends are not observed during the magma’s final ascent (days-weeks), and geochemical indices. Those indices are reflecting the broader scale and longer-term influences upon the hydrothermal-magmatic system as a whole rather than pre- or syn-eruptive release of gas closer to the eruption site.
• Phase 5: After the eruptive period and from July 2015 (Figure 13E), the situation seems to have reset. The steam/gas ratio, CH4/CO2, H2/CO2, He/CO2 ratios, δC-CO2, 3He/4He and magmatic He fraction decreased quite dramatically. These drastic changes are attributed to efficient degassing of the magma responsible for the eruption.
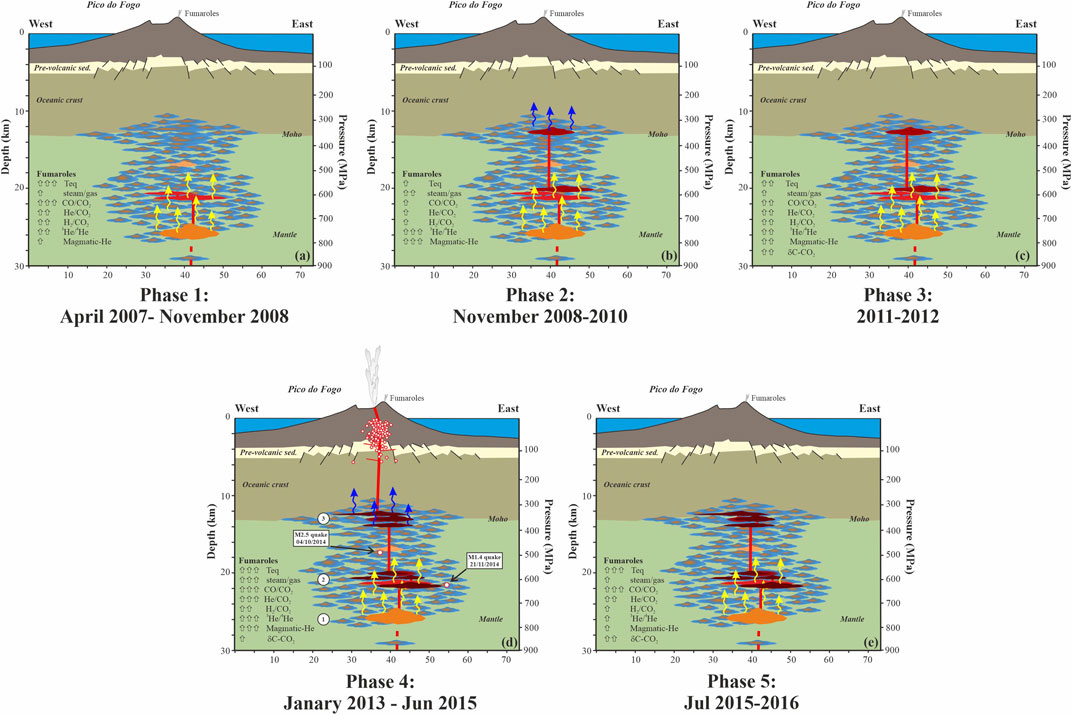
FIGURE 13. Schematic model for the Pico do Fogo volcano fumarolic gas discharge during the period 2007–2016 [modified from Klügel et al. (2020)].
The changes recorded in the chemical and isotopic composition of the fumarolic discharges of the Pico do Fogo volcano during the period 2007–2016 provide information of great value to understand the dynamics of this volcano and the relationship between these changes and the eruptive activity. The injection of hot magmatic fluids from rich-gas magma into the volcanic-hydrothermal system is reflected in the CO2, CH4, He, CO and H2 contents, as well as the He and C isotopic magmatic signatures, exiting from the fumaroles.
The close relationship observed between the geochemical parameters studied in visible emissions (fumaroles) demonstrates the convenience of enhancing the geochemical program for volcanic monitoring of fumaroles as an important complement to understanding the evolution of volcanic activity in Pico do Fogo. Increasing the sampling frequency, at least every six months, would be of great importance to improve the surveillance of this volcano.
The raw data supporting the conclusions of this article will be made available by the authors, without undue reservation.
GM participated in sampling, chemical and isotopic analysis of samples, treatment of data and manuscript writing. PH, EP, and NP participated in sampling, treatment of data and manuscript writing. HS performed isotopic analysis of samples, treatment of data and manuscript writing. MA-R and CA contributed chemical and isotopic analysis of samples. MA, GP, JB, FR, SS, JP, FS, and NC participated in the collection of gas samples. MA and FS also participated in the chemical analysis of samples.
This research was supported by the projects (i) MAKAVOL (MAC/3/C161), financed by the European Union Transnational Cooperation Programme MAC 2007-2013, (ii) CABOVERDE (08-CAP2-1208), financed by the Spanish Agency for International Cooperation & Development, AECID, (iii) VOLRISKMAC (MAC/3.5b/124) and VOLRISKMAC II (MAC2/3.5b/328) financed by the Program INTERREG V A Spain-Portugal MAC 2014-2020 of the European Comission and (iv) TFassistance, financed by the ProgramTFinnova Program of the Cabildo Insular de Tenerife. MA was supported by a grant of the Doctorados Industriales Program (DI-16- 08974) financed by Spanish National Plan for Scientific and Technical Research and Innovation 2013–2016.
The authors declare that the research was conducted in the absence of any commercial or financial relationships that could be construed as a potential conflict of interest.
Special thanks are given for logistical support from the residents of Cha das Caldeira in Fogo Island. We would also like to thank Samara Dionis, Paolo Fernandes and Vera Alfama for their help during this study and Beverley Coldwell and Matthew James Pankhurst for their revision of written English and constructive comments that greatly improved the quality of paper.
Aiuppa, A., Federico, C., Giudice, G., and Gurrieri, S. (2005a). Chemical Mapping of a Fumarolic Field: La Fossa Crater, Vulcano Island (Aeolian Islands, Italy). Geophys. Res. Lett. 32, 13. doi:10.1029/2005GL023207
Aiuppa, A., Inguaggiato, S., McGonigle, A. J. S., O’Dwyer, M., Oppenheimer, C., Padgett, M. J., et al. (2005b). H2S Fluxes from Mt. Etna, Stromboli, and Vulcano (Italy) and Implications for the Sulfur Budget at Volcanoes. Geochimica et Cosmochimica Acta 69, 1861–1871. doi:10.1016/j.gca.2004.09.018
Aiuppa, A., Moretti, R., Federico, C., Giudice, G., Gurrieri, S., Liuzzo, M., et al. (2007). Forecasting Etna Eruptions by Real-Time Observation of Volcanic Gas Composition. Geol 35 (12), 1115–1118. doi:10.1130/g24149a.1
Aiuppa, A., Ronchi, A., Bitetto, M., Rizzo, A. L., Viveiros, F., Allard, P., et al. (2020). The Fumarolic CO2 Output from Pico Do Fogo Volcano (Cape Verde). Ijg 139, 325–340. doi:10.3301/IJG.2020.03
Aiuppa, A. (2015). “Volcanic-gas Monitoring,” in Volcanism and Global Environmental Change. Editors A. Schmidt, F. Kirtsen, and L. Elkins-Tanton (Cambridge University Press), 81–96. doi:10.1017/CBO9781107415683.009
Alonso, M., Pérez, N. M., Padrón, E., Hernández, P. A., Melián, G. V., Sumino, H., et al. (2021). Changes in the thermal Energy and the Diffuse 3He and 4He Degassing Prior to the 2014-2015 Eruption of Pico Do Fogo Volcano, Cape Verde. J. Volcanology Geothermal Res. 416, 107271. doi:10.1016/j.jvolgeores.2021.107271
Bagnardi, M., Gonzàlez, P. J., and Hooper, A. (2016). High-resolution Digital Elevation Model from Tri-stereo Pleiades-1 Satellite Imagery for Lava Flow Volume Estimates at Fogo Volcano: Tristereo Pleiades DEM of Fogo Volcano. Geophys. Res. Lett. 43. doi:10.1002/2016GL0694510.1002/2016gl069457
Barmen, G., Carvalho, V., and Querido, A. (1990). “Groundwater-related Geological and Isotopic Investigations on the Island of Fogo: an Overview,”. Report LUTVDG/TVTG-90/3027 (Lund, Sweden:Lund Institute of Technology), 72.
Barmen, G., Joseffson, G., Magnusson, M., and Wernersson, H. (1984). “A Hydrogeological Investigation on Santiago, Cape Verde Islands,”. Report TVTG-5009 (Lund, Sweden:Lund Institute of Technology), 43.
Barry, P. H., Hilton, D. R., Fischer, T. P., de Moor, J. M., Mangasini, F., and Ramirez, C. (2013). Helium and Carbon Isotope Systematics of Cold “Mazuku” CO2 Vents and Hydrothermal Gases and Fluids from Rungwe Volcanic Province, Southern Tanzania. Chem. Geology. 339, 141–156. doi:10.1016/j.chemgeo.2012.07.003
Burton, M., Allard, P., Mure, F., and La Spina, A. (2007). Magmatic Gas Composition Reveals the Source Depth of Slug-Driven Strombolian Explosive Activity. Science 317, 227–230. doi:10.1126/science.1141900
Caliro, S., Viveiros, F., Chiodini, G., and Ferreira, T. (2015). Gas Geochemistry of Hydrothermal Fluids of the S. Miguel and Terceira Islands, Azores. Geochimica et Cosmochimica Acta 168, 43–57. doi:10.1016/j.gca.2015.07.009
Calvari, S., Ganci, G., Victória, S., Hernandez, P., Perez, N., Barrancos, J., et al. (2018). Satellite and Ground Remote Sensing Techniques to Trace the Hidden Growth of a Lava Flow Field: The 2014-2015 Effusive Eruption at Fogo Volcano (Cape Verde). Remote Sensing 10, 1115. doi:10.3390/rs10071115
Cappello, A., Ganci, G., Calvari, S., Pérez, N. M., Hernández, P. A., Silva, S. V., et al. (2016). Lava Flow hazard Modeling during the 2014-2015 Fogo Eruption, Cape Verde. J. Geophys. Res. Solid Earth 121, 2290–2303. doi:10.1002/2015jb012666
Cardellini, C., Chiodini, G., Frondini, F., Avino, R., Bagnato, E., Caliro, S., et al. (2017). Monitoring Diffuse Volcanic Degassing during Volcanic Unrests: the Case of Campi Flegrei (Italy). Sci. Rep. 7, 6757. doi:10.1038/s41598-017-06941-2
Carrion, F., Diaz Moreno, A., Martin, B. J., Moreno, J., Prudencio, J., García Yeguas, A., Ibañez, J. M., Barrancos, J., Pérez, N., Barros, I., Bandomo, Z., and Gonçalves, A. (2012). “The New Seismic Network for Seismo-Volcanic Monitoring of Fogo Island (Cape Verde): Evidences of a Seismically Active Volcano,” in MAKAVOL 2012 El Hierro, El Hierro, 20.
Carroll, M. R., and Webster, J. D. (1994). “Solubilitiies of Sulfur, noble Gases, Nitrogen, Chlorine, and Fluorine in Magmas,” in Volatiles in Magmas. Reviews in Mineralogy. Min. Soc. Am. Editors M. R. Carroll, and J. R. Holloway (Fredericksburg, VA), 232–279.
Chiodin, G., Cioni, R., Leonis, C., Marini, L., and Raco, B. (1993). Fluid Geochemistry of Nisyros Island, Dodecanese, Greece. J. Volcanol. Geotherm. Res. 56, 95–112.
Chiodini, G., Allard, P., Caliro, S., and Parello, F. (2000). 18O Exchange between Steam and Carbon Dioxide in Volcanic and Hydrothermal Gases: Implications for the Source of Water. Geochimica et Cosmochimica Acta 64 (14), 2479–2488. doi:10.1016/s0016-7037(99)00445-7
Chiodini, G., Caliro, S., De Martino, P., Avino, R., and Gherardi, F. (2012). Early Signals of New Volcanic Unrest at Campi Flegrei Caldera? Insights from Geochemical Data and Physical Simulations. Geology 40, 943–946. doi:10.1130/g33251.1
Chiodini, G. (2009). CO2/CH4ratio in Fumaroles a Powerful Tool to Detect Magma Degassing Episodes at Quiescent Volcanoes. Geophys. Res. Lett. 36, a–n. doi:10.1029/2008GL036347
Chiodini, G., Frondini, F., and Raco, B. (1996). Diffuse Emission of CO 2 from the Fossa Crater, Vulcano Island (Italy). Bull. Volcanology 58, 41–50. doi:10.1007/s004450050124
Chiodini, G., and Marini, L. (1998). Hydrothermal Gas Equilibria: the H2O-H2-CO2-CO-CH4 System. Geochimica et Cosmochimica Acta 62, 2673–2687. doi:10.1016/s0016-7037(98)00181-1
Cioni, R., Corazza, E., and Marini, L. (1984). The Gas/steam Ratio as Indicator of Heat Transfer at the Solfatara Fumaroles, Phlegraean Fields (Italy). Bull. Volcanol 47, 295–302. doi:10.1007/bf01961560
Coplen, T. B., Wildman, J. D., and Chen, J. (1991). Improvements in the Gaseous Hydrogen-Water Equilibration Technique for Hydrogen Isotope-Ratio Analysis. Anal. Chem. 63, 910–912. doi:10.1021/ac00009a014
Courtney, R. C., and White, R. S. (1986). Anomalous Heat Flow and Geoid across the Cape Verde Rise: Evidence for Dynamic Support from a thermal Plume in the Mantle. Geophys. J. Int. 87, 815–867. doi:10.1111/j.1365-246x.1986.tb01973.x
Craig, H. (1961). Isotopic Variations in Meteoric Waters. Science 133, 1702–1703. doi:10.1126/science.133.3465.1702
Craig, H., and Lupton, J. E. (1976). Primordial Neon, Helium, and Hydrogen in Oceanic Basalts. Earth Planet. Sci. Lett. 31, 369–385. doi:10.1016/0012-821x(76)90118-7
D’Amore, F., and Panichi, C. (1987). Geochemistry in Geothermal Exploration. Appl. Geotherm. 9, 69e89.
Day, S. J., Heleno da Silva, S. I. N., and Fonseca, J. F. B. D. (1999). A Past Giant Lateral Collapse and Present-Day Flank Instability of Fogo, Cape Verde Islands. J. Volcanology Geothermal Res. 94, 191–218. doi:10.1038/s41467-017-01256-2
Dionis, S. M., Melián, G., Rodríguez, F., Hernández, P. A., Padrón, E., Pérez, N. M., et al. (2015b). Diffuse Volcanic Gas Emission and thermal Energy Release from the summit Crater of Pico Do Fogo, Cape Verde. Bull. Volcanol. 77. doi:10.1007/s00445-014-0897-4
Dionis, S. M., Pérez, N. M., Hernández, P. A., Melián, G., Rodríguez, F., Padrón, E., et al. (2015a). Diffuse CO2 Degassing and Volcanic Activity at Cape Verde Islands, West Africa. Earth Planet. Sp 67. doi:10.1186/s40623-015-0219-x
Epstein, S., and Mayeda, T. (1953). Variation of O18 Content of Waters from Natural Sources. Geochimica et Cosmochimica Acta 4, 213–224. doi:10.1016/0016-7037(53)90051-9
Escrig, S., Doucelance, R., Moreira, M., and Allègre, C. J. (2005). Os Isotope Systematics in Fogo Island: Evidence for Lower continental Crust Fragments under the Cape Verde Southern Islands. Chem. Geology. 219, 93–113. doi:10.1016/j.chemgeo.2005.02.011
Ferreira, T., Gaspar, J. L., Viveiros, F., Marcos, M., Faria, C., and Sousa, F. (2005). Monitoring of Fumarole Discharge and CO2 Soil Degassing in the Azores: Contribution to Volcanic Surveillance and Public Health Risk Assessment. Ann. Geophys. 48, 787–796. doi:10.4401/ag-3234
Fischer, T. P., Arehart, G. B., Sturchio, N. C., and Williams, S. N. (1996). The Relationship between Fumarole Gas Composition and Eruptive Activity at Galeras Volcano, Colombia. Geol 24, 531–534. doi:10.1130/0091-7613(1996)024<0531:trbfgc>2.3.co;2
Foeken, J. P. T., Stuart, F. M., and Mark, D. F. (2012). Long-term Low Latitude Cosmogenic 3He Production Rate Determined from a 126ka basalt from Fogo, Cape Verdes. Earth Planet. Sci. Lett. 359-360, 14–25. doi:10.1016/j.epsl.2012.10.005
Fonseca, J. F. B. D., Faria, B. V. E., Lima, N. P., Heleno, S. I. N., Lazaro, C., d’Oreye, N. F., et al. (2003). Multiparameter Monitoring of Fogo Island, Cape Verde, for Volcanic Risk Mitigation. J. Volcanology Geothermal Res. 125 (1–2), 39–56. doi:10.1016/s0377-0273(03)00088-x
Gerlach, T. (1986). Exsolution of H2O, CO2, and S during Eruptive Episodes at Kilauea Volcano, Hawaii. J. Geophys. Res. 91 (B12), 112177–112185. doi:10.1029/jb091ib12p12177
Giggenbach, W. F. (1975). A Simple Method for the Collection and Analysis of Volcanic Gas Samples. Bull. Volcanol. 39, 132–145. doi:10.1007/bf02596953
Giggenbach, W. F. (1980). Geothermal Gas Equilibria. Geochimica et Cosmochimica Acta 44, 2021–2032. doi:10.1016/0016-7037(80)90200-8
Giggenbach, W. F., and Goguel, R. L. (1989a). Collection and Analysis of Geothermal and Volcanic Water and Gas Discharges, Unpublished Report, Chemistry Division. New Zealand: DSIR-Petone.
Giggenbach, W. F., and Goguel, R. L. (1989b). Methods for the Collection and Analysis of Geothermal and Volcanic Water and Gas samples CD 2387. New Zealand: Department of Scientific and Industrial Research, Chemistry Division.
Giggenbach, W. F. (1992). Isotopic Shifts in Waters from Geothermal and Volcanic Systems along Convergent Plate Boundaries and Their Origin. Earth Planet. Sci. Lett. 113 (4), 495–510. doi:10.1016/0012-821x(92)90127-h
Giggenbach, W. F. (1984). Mass Transfer in Hydrothermal Alteration Systems-A Conceptual Approach. Geochimica et Cosmochimica Acta 48, 2693–2711. doi:10.1016/0016-7037(84)90317-x
Giggenbach, W. F. (1993). Redox Control of Gas Compositions in Philippine Volcanic-Hydrothermal Systems. Geothermics 22, 575–587. doi:10.1016/0375-6505(93)90037-n
Giggenbach, W. F. (1987). Redox Processes Governing the Chemistry of Fumarolic Gas Discharges from White Island, New Zealand. Appl. Geochem. 2, 141–161. doi:10.1016/0883-2927(87)90030-8
González, P. J., Bagnardi, M., Hooper, A. J. Y., Larsen, Y., Marinkovic, P., Samsonov, S. V., et al. (2015). The 2014-2015 Eruption of Fogo Volcano: Geodetic Modeling of Sentinel-1 TOPS Interferometry. Geophys. Res. Lett. 42, 9239–9246. doi:10.1002/2015GL066003
Graham, D. W. (2002). “8. Noble Gas Isotope Geochemistry of Mid-ocean Ridge and Ocean Island Basalts: Characterization of Mantle Source Reservoirs,” in Noble Gases in Geochemistry and Cosmochemistry. Editors D. Porcelli, R. Wieler, and C. J. Ballentine (Washington, D.C: Mineral. Soc. Amer.), 247–318. doi:10.1515/9781501509056-010
Gresse, M., Vandemeulebrouck, J., Byrdina, S., Chiodini, G., Roux, P., Rinaldi, A. P., et al. (2018). Anatomy of a Fumarolic System Inferred from a Multiphysics Approach. Sci. Rep. 8, 7580. doi:10.1038/s41598-018-25448-y
Heilweil, V. M., Solomon, D. K., Gingerich, S. B., and Verstraeten, I. M. (2009). Oxygen, Hydrogen, and Helium Isotopes for Investigating Groundwater Systems of the Cape Verde Islands, West Africa. Hydrogeol. J. 17 (5), 1157–1174. doi:10.1007/s10040-009-0434-2
Hernández, P. A., Melián, G. V., Dionis, S., Barrancos, J., Padilla, G., Padrón, E., et al. (2015). Chemical Composition of Volcanic Gases Emitted during the 2014-15 Fogo Eruption, Cape Verde. Geophys. Res. Abstr. 17, EGU2015–9577. 2015, EGU General Assembly 2015.
Hernández, P. A., Notsu, K., Salazar, J. M., Mori, T., Natale, G., Okada, H., et al. (2001). Carbon Dioxide Degassing by Advective Flow from Usu Volcano, Japan. Science 292, 83–86. doi:10.1126/science.1058450
Hildner, E., Klügel, A., and Hansteen, T. H. (2012). Barometry of Lavas from the 1951 Eruption of Fogo, Cape Verde Islands: Implications for Historic and Prehistoric Magma Plumbing Systems. J. Volcanology Geothermal Res. 217-218, 73–90. doi:10.1016/j.jvolgeores.2011.12.014
Hildner, E., Klügel, A., and Hauff, F. (2011). Magma Storage and Ascent during the 1995 Eruption of Fogo, Cape Verde Archipelago. Contrib. Mineral. Petrol. 162, 751–772. doi:10.1007/s00410-011-0623-6
Hilton, D. R., Fischer, T. P., and Marty, B. (2002). Noble Gases and Volatile Recycling at Subduction Zones. Rev. Mineralogy Geochem. 47, 319–370. doi:10.2138/rmg.2002.47.9
Hilton, D. R., Ramirez, C. J., Mora-Amador, R., Fischer, T. P., Furi, E., Barry, P. H., et al. (2010). Monitoring of Temporal and Spatial Variations in Fumarole Helium and Carbon Dioxide Characteristics at Po^|^aacute;s and Turrialba Volcanoes, Costa Rica (2001-2009). Geochem. J. 44, 431–440. doi:10.2343/geochemj.1.0085
Holloway, J. R., and Blank, J. G. (1994). “Chapter 6. APPLICATION of EXPERIMENTAL RESULTS to C-O-H SPECIES IN NATURAL MELTS,” in Volatiles in Magmas. Reviews in Mineralogy. Editor M. R. C. J. R. Holloway (Fredericksburg, VA: Mineralogical Society of America), 187–230. doi:10.1515/9781501509674-012
Javoy, M., Pineau, F., and Delorme, H. (1986). Carbon and Nitrogen Isotopes in the Mantle. Chem. Geology. 57, 41–62. doi:10.1016/0009-2541(86)90093-8
Jørgensen, J. Ø., and Holm, P. M. (2002). Temporal Variation and Carbonatite Contamination in Primitive Ocean Island Volcanics from Sa˜o Vicente, Cape Verde Islands. Chem. Geol. 192, 249–267.
Kallrén, L., and Schreiber, I. (1988). Groundwater Survey on Western Fogo, Cape Verde. Report TVTG-5019. Lund, Sweden: Lund Institute of Technology, 83.
Karolyte, R., Serno, S., Johnson, G., and Gilfillan, S. M. V. (2017). The Influence of Oxygen Isotope Exchange between CO2 and H2O in Natural CO2-rich spring Waters: Implications for Geothermometry. J. Appl. Geochem. 84, 173–186.
Klügel, A., Day, S., Schmid, M., and Faria, B. (2020). Magma Plumbing during the 2014-2015 Eruption of Fogo (Cape Verde Islands). Front. Earth Sci. 8, 157. doi:10.3389/feart.2020.00157
Klügel, A., Longpré, M.-A., García-Cañada, L., and Stix, J. (2015). Deep Intrusions, Lateral Magma Transport and Related Uplift at Ocean Island Volcanoes. Earth Planet. Sci. Lett. 431, 140–149. doi:10.1016/j.epsl.2015.09.031
Langworthy, M., and Finan, T. J. (1997). Waiting for Rain: Agriculture and Ecological Imbalance in Cape Verde. Boulder, CO: Rienner, 212.
López, T., Ushakov, S., Izbekov, P., Tassi, F., Cahill, C., Neill, O., et al. (2013). Constraints on Magma Processes, Subsurface Conditions, and Total Volatile Flux at Bezymianny Volcano in 2007-2010 from Direct and Remote Volcanic Gas Measurements. J. Volcanology Geothermal Res. 263, 92–107. doi:10.1016/j.volgores.2012.0.015
Leva, C., Rümpker, G., Link, F., and Wölbern, I. (2019). Mantle Earthquakes Beneath Fogo Volcano, Cape Verde: Evidence for Subcrustal Fracturing Induced by Magmatic Injection. J. Volcanol. Geother. Res. 386, doi:10.1016/j.jvolgeores.2019.106672
Marty, B., and Jambon, A. (1987). C3He in Volatile Fluxes from the Solid Earth: Implications for Carbon Geodynamics. Earth Planet. Sci. Lett. 83, 16–26. doi:10.1016/0012-821x(87)90047-1
Marty, B., Jambon, A., and Sano, Y. (1989). Helium Isotopes and CO2 in Volcanic Gases of Japan. Chem. Geol. 76 (1-2), 25–40. doi:10.1016/0009-2541(89)90125-3
Mata, J., Martins, S., Mattielli, N., Madeira, J., Faria, B., Ramalho, R. S., et al. (2017). The 2014-15 Eruption and the Short-Term Geochemical Evolution of the Fogo Volcano (Cape Verde): Evidence for Small-Scale Mantle Heterogeneity. Lithos 288-289, 91–107. doi:10.1016/j.lithos.2017.07.001
Matsuda, J., Matsumoto, T., Sumino, H., Nagao, K., Yamamoto, J., Miura, Y., et al. (2002). The 3He/4He Ratio of the New Internal He Standard of Japan (HESJ). Geochem. J. 36, 191–195. doi:10.2343/geochemj.36.191
Melián, G., Hernández, P. A., Padrón, E., Pérez, N. M., Barrancos, J., Padilla, G., et al. (2014). Spatial and Temporal Variations of Diffuse CO2 degassing at El Hierro Volcanic System: Relation to the 2011-2012 Submarine Eruption. J. Geophys. Res. Solid Earth 119 (9), 6976–6991. doi:10.1002/2014JB011013
Melián, G., Tassi, F., Pérez, N., Hernández, P., SortinoVaselli, F. O., Vaselli, O., et al. (2012). A Magmatic Source for Fumaroles and Diffuse Degassing from the summit Crater of Teide Volcano (Tenerife, Canary Islands): a Geochemical Evidence for the 2004-2005 Seismic-Volcanic Crisis. Bull. Volcanol 74, 1465–1483. doi:10.1007/s00445-012-0613-1
Melián, G. V., Pérez, N. M., Mora Amador, R. A., Hernández, P. A., Ramírez, C., Sumino, H., et al. (2019). “Diffuse CO2 Degassing and Thermal Energy Release from Poás Volcano, Costa Rica,” in Poás Volcano, Active Volcanoes of the World. Editors F. Tassiet al. (Springer Nature Switzerland AG 2019), 135–154. doi:10.1007/978-3-319-02156-0_6
Mota Gomes, A. (2006). A problemática da Geologia e dos Recursos Hídricos na Ilha do Fogo. Praia, Cabo Verde: Relatório inédito.
Mourão, C., Mata, J., Doucelance, R., Madeira, J., Millet, M.-A., and Moreira, M. (2012). Geochemical Temporal Evolution of Brava Island Magmatism: Constraints on the Variability of Cape Verde Mantle Sources and on Carbonatite-Silicate Magma Link. Chem. Geology. 334, 44–61. doi:10.1016/j.chemgeo.2012.09.031
Munhá, J. M., Mendes, M. H., Palácios, T., Silva, L. C., and Torres, P. C. (1997). “Petrologia e geoquímica da erupção de 1995 e de outras lavas históricas na Ilha Do Fogo, Cabo Verde,” in A Erupção Vulcanica de 1995 Na Ilha Do Fogo, Cabo Verde. Editor A. Réffega (Lisbon: Instituto de Investigação Científica e Tropical), 171–186.
Oppenheimer, C., Fischer, T. P., and Scaillet, B. (2012). “Volcanic Degassing: Process and Impact,” in Treatise on Geochemistry. Second Edition (Elsevier), 111–179. doi:10.1016/B978-0-08-095975-7.00304-1
Ozima, M., and Podosek, F. A. (2002). Noble Gas Geochemistry. 2nd ed. Cambridge: Cambridge University Press, 287.
Padrón, E., Hernández, P. A., Pérez, N. M., Toulkeridis, T., Melián, G., Barrancos, J., et al. (2012). Fumarole/plume and Diffuse CO2 Emission from Sierra Negra Caldera, Galapagos Archipelago. Bull. Volcanol 74, 1509–1519. doi:10.1007/s00445-012-0610-4
Padrón, E., Pérez, N. M., Hernández, P. A., Melián, G., Asensio‐Ramos, M., D'Auria, L., et al. (2021). Changes in Diffuse Degassing from the Summit Crater of Teide Volcano (Tenerife, Canary Islands) Prior to the 2016 Tenerife Long‐Period Seismic Swarm. J. Geophys. Res. Solid Earth 126, e2020JB020318. doi:10.1029/2020JB020318
Padrón, E., Pérez, N. M., Hernández, P. A., Sumino, H., Melián, G. V., Barrancos, J., et al. (2013). Diffusive Helium Emissions as a Precursory Sign of Volcanic Unrest. Geology 41 (5), 539–542. doi:10.1130/g34027.1
Pérez, N. M., Dionis, S., Fernandes, P., Barrancos, J., Rodríguez, F., Bandomo, Z., et al. (2015). Precursory Signals of the 2014-15 Fogo Eruption (Cape Verde) Detected by Surface CO2 Emission and Heat Flow Observations. Vienna: EGU General Assembly.
Pérez, N. M., Hernández, P. A., Padilla, G., Nolasco, D., Barrancos, J., Melián, G., et al. (2011). Global CO2 Emission from Volcanic Lakes. Geology 39, 235–238. doi:10.1130/G31586.1
Ramalho, R. S., Winckler, G., Madeira, J., Helffrich, G. R., Hipólito, A., Quartau, R., et al. (2015). Hazard Potential of Volcanic Flank Collapses Raised by New Megatsunami Evidence. Sci. Adv. 1, e1500456. doi:10.1126/sciadv.1500456
Richter, N., Favalli, M., de Zeeuw-van Dalfsen, E., Fornaciai, A., da Silva Fernandes, R. M., Pérez, N. M., et al. (2016). Lava Flow hazard at Fogo Volcano, Cabo Verde, before and after the 2014-2015 Eruption. Nat. Hazards Earth Syst. Sci. 16, 1925–1951. doi:10.5194/nhess-2016-81
Sacchi, E., Cossio, R., Dray, M., Petrucci, B., and Zuppi, G. M. (1995). “Present Recharge and Groundwater Circulation in Ilha Do Sal (Cape Verde Islands). Application of Tracers in Arid Zone Hydrology,” in Proceedings of the Vienna Symposium, Vienna, August 1994 (IAHS Publ), 232.
Sano, Y., and Marty, B. (1995). Origin of Carbon in Fumarolic Gas from Island Arcs. Chem. Geology. 119 (1–4), 265–274. doi:10.1016/0009-2541(94)00097-r
Sano, Y., Urabe, A., WakitaChiba, H. H., Chiba, H., and Sakai, H. (1985). Chemical and Isotopic Compositions of Gases in Geothermal Fluids in Iceland. Geochem. J. 19, 135–148. doi:10.2343/geochemj.19.135
Sano, Y., and Wakita, H. (1985). Geographical Distribution of 3He/4 He Ratios in Japan: Implications for Arc Tectonics and Incipient Magmatism. J. Geophys. Res. 90, 8729–8741. doi:10.1029/jb090ib10p08729
Sano, Y., and Williams, S. N. (1996). Fluxes of Mantle and Subducted Carbon along Convergent Plate Boundaries. Geophys. Res. Lett. 23 (20), 2749–2752. doi:10.1029/96gl02260
Sumino, H., Nagao, K., and Notsu, K. (2001). Highly Sensitive and Precise Measurement of Helium Isotopes Using a Mass Spectrometer with Double Collector System. J. Mass. Spectrom. Soc. Jpn. 49, 61–68. doi:10.5702/massspec.49.61
Symonds, R. B., Rose, W. I., Bluth, G. J. S., and Gerlach, T. M. (1994). Chapter 1. VOLCANIC-GAS STUDIES: METHODS, RESULTS, and APPLICATIONS. Rev. Mineral. 30, 1–66. doi:10.1515/9781501509674-007
Taran, Y. A., and Giggenbach, W. F. (2003). “Geochemistry of Light Hydrocarbons in Subduction-Related Volcanic and Hydrothermal Fluids,” in Volcanic, Geothermal, and Ore-Forming Fluids: Rulers and Witnesses of Processes within the Earths. Editors S. F. Simmons, and I. Graham (Littleton, Colo: Soc. Econ. Geol.), 61–74.
Taran, Y., Fischer, T. P., Pokrovsky, B., Sano, Y., Armienta, M. A., and Macias, J. L. (1998). Geochemistry of the Volcano-Hydrothermal System of El Chichón Volcano, Chiapas, Mexico. Bull. Volcanology 59, 436–449. doi:10.1007/s004450050202
Tilling, R. I. (1995). “The Role of Monitoring in Forecasting Volcanic Events,” in Monitoring Active Volcanoes: Strategies, Procedures, and Techniques, Chapter 14. Editors W. J. McGuire, C. R. J. Kilburn, and J. B. Murray (London: UCL Press), 369–402.
Torres, P., Madeira, J., Silva, L., Brum da Silveira, A., Serralheiro, A., and Mota Gomes, A. (1997). Carta Geológica das Erupções Históricas da Ilha Do Fogo (Cabo Verde): revisão e actualização. Comun. Instit. Geol. Mine. 84, A193–A196.
Vailleux, Y., and Bourguet, L. (1974). “La mise en valeur des eaux souterraines dans l’archipel du Cap Vert [The development of groundwater in the archipelago of Cape Verde],” Final Mission Report 140. (Paris:BURGEAP, Ministerio da Coordenacão Interterritorial, Brigada de Aguas Subterraneas do Cabo Verde), 291.
Wallace, P. J. (2001). Volcanic SO 2 Emissions and the Abundance and Distribution of Exsolved Gas in Magma Bodies. J. Volcanology Geothermal Res. 108, 85–106. doi:10.1016/s0377-0273(00)00279-1
Keywords: geochemistry, volcanic gases, fumarolic emission, precursory signals, Pico do Fogo volcano
Citation: Melián GV, Hernández PA, Pérez NM, Asensio-Ramos M, Padrón E, Alonso M, Padilla GD, Barrancos J, Sortino F, Sumino H, Rodríguez F, Amonte C, Silva S, Cardoso N and Pereira JM (2021) Insights from Fumarole Gas Geochemistry on the Recent Volcanic Unrest of Pico do Fogo, Cape Verde. Front. Earth Sci. 9:631190. doi: 10.3389/feart.2021.631190
Received: 19 November 2020; Accepted: 02 July 2021;
Published: 15 July 2021.
Edited by:
Francesco Italiano, National Institute of Geophysics and Volcanology, ItalyReviewed by:
Pierpaolo Zuddas, Sorbonne Universités, FranceCopyright © 2021 Melián, Hernández, Pérez, Asensio-Ramos, Padrón, Alonso, Padilla, Barrancos, Sortino, Sumino, Rodríguez, Amonte, Silva, Cardoso and Pereira. This is an open-access article distributed under the terms of the Creative Commons Attribution License (CC BY). The use, distribution or reproduction in other forums is permitted, provided the original author(s) and the copyright owner(s) are credited and that the original publication in this journal is cited, in accordance with accepted academic practice. No use, distribution or reproduction is permitted which does not comply with these terms.
*Correspondence: Gladys V. Melián, Z2xhZHlzQGl0ZXIuZXM=
Disclaimer: All claims expressed in this article are solely those of the authors and do not necessarily represent those of their affiliated organizations, or those of the publisher, the editors and the reviewers. Any product that may be evaluated in this article or claim that may be made by its manufacturer is not guaranteed or endorsed by the publisher.
Research integrity at Frontiers
Learn more about the work of our research integrity team to safeguard the quality of each article we publish.