 Mingzhu Xu1
 Guoce Xu
 Peng Li
 Peng Shi
 Lie Xiao
- 1Key Laboratory of National Forestry Administration on Ecological Hydrology and Disaster Prevention in Arid Regions, Xi’an University of Technology, Xi’an, China
- 2College of Life Sciences, Yan’an University, Yan’an, China
- 3Northwest Surveying, Planning and Designing Institute of National Forestry and Grassland Administration, Xi’an, China
Soil water content (SWC) plays a crucial role in the hydrological cycle and ecological restoration in arid and semi-arid areas. Studying the temporal stability of SWC spatial distribution is a requirement for the dynamic monitoring of SWC and the optimization of water resource management. The SWC in a Pinus tabulaeformis Carr. forest on the slope of the Loess Plateau of China were analyzed in five soil layers (0–100 cm with an interval of 20 cm) in the rainy and dry seasons from July 2014 to November 2017. The mean SWC was estimated and the main factors affecting the temporal stability of the SWC were further analyzed. Results showed that the SWC had strong temporal stability during the two seasons for several consecutive years. The temporal stability of SWC and the number of representative locations varied with season and depth. The elevation, soil total phosphorus (STP), clay, silt, or sand content of the representative locations approached the corresponding mean value of the study area. A single representative location accurately represented the mean SWC for the five depths in the rainy and dry seasons (RMSE <2%; rainy season: 0.81 < R2 < 0.94; dry season: 0.63 < R2 < 0.83; p < 0.01). The mean relative difference (MRD) and the relative difference standard deviation (SDRD) changed with the seasons and were significantly correlated with elevation, root density, and sand and silt content in two seasons (p < 0.05). Elevation, root density, and sand content were the main factors influencing the change of SWC temporal stability in different seasons. The results provide scientific guidance to monitor SWC by using a small number of locations and enrich our understanding of the factors affecting the temporal stability of SWC in the rainy and dry seasons of the Loess Plateau of China.
Introduction
Soil water content (SWC) is an important or even dominant influencing factor for the hydrological cycle, and vegetation and ecological restoration in arid and semi-arid ecosystems. SWC is also the key carrier of material transport in soil and an important driving force for energy transport (Brocca et al., 2009; Heathman et al., 2012; Penna et al., 2013; Zhao et al., 2019; Cheng et al., 2021). However, It is very difficult to obtain SWC data on large areas quickly and accurately. Besides, owing to the influence of topography, rainfall, soil characteristics, vegetation, and human activities, SWC shows high variations at different spatial and temporal scales (Western and Blöschl, 1999; Gómez-Plaza et al., 2001; Zhao et al., 2010; Biswas and Cheng Si, 2011; Hu and Si, 2016), which also increases the difficulty in obtaining reliable SWC data. SWC also had a major influential role in the processes of rainfall infiltration, evaporation, solute transport, runoff and sediment yield, plant photosynthesis, and groundwater recharge (de Souza et al., 2011; Duan et al., 2016; Wang et al., 2019; Xiao et al., 2020). Therefore, it is very important to understand the dynamic characteristics of SWC for vegetation protection, ecological restoration, and water resources management in arid and semi-arid areas.
Although the SWC displays high variability in time and space. However, in 1985, Vachaud first discovered that the high and low rank order of SWC at sample locations presented relative stability phenomenon with time and defined the concept of SWC temporal stability for the first time. He defined “temporal stability” as “the time-invariant association between spatial location and classical statistical parameters of a given soil property”. The method of SWC temporal stability is based on point-scale observations and considers that the SWC at certain locations can represent the mean SWC of a region over a period of time. The temporal stability concept at different spatial scales (e.g., slope, watershed, field, landscape-scale), different land-use types (e.g., rangeland, grass, pasture, agricultural land, shrub, forest), different terrain conditions (e.g., rolling, gentle sloping, complex terrains) and different climate zones (e.g., semi-arid, semi-humid, humid, semiarid) has been widely noticed and verified (Kachanoski and De Jong, 1988; Williams et al., 2009; Jacobs et al., 2010; Liu and Shao, 2014). At present, SWC temporal stability is widely used to interpolate missing SWC data and establish hydrological models (Pachepsky et al., 2005; Penna et al., 2013), and verify or correct remote sensing SWC data affected by resolution, vegetation, ground roughness, and topography (Mohanty and Skaggs, 2001; Jacobs et al., 2004; Vivoni et al., 2008; Wang et al., 2020). Besides, rapidly identifying the representative locations of SWC and use of these locations to directly or indirectly estimate the mean SWC is an important application of the concept of SWC temporal stability (Duan et al., 2017; He et al., 2019). The advantage of using the SWC representative location to obtain large-area SWC is that can reduce measurement costs and shorten the measurement cycle compared with traditional random multi-sample methods (Jacobs et al., 2004; Xu et al., 2017b). Direct or indirect estimation of the spatial mean SWC at different scales through the most temporally stable location or representative locations is very effective and feasible with accurate estimation results. (Grayson and Western, 1998; Guber et al., 2008; Hu and Si, 2014; Li et al., 2015; He et al., 2019). It is also able to accurately estimate the multi-year average SWC within the allowed error range (Schneider et al., 2008; Liu and Shao, 2014). Since 1999, the Chinese government has implemented a wide-ranging project of returning farmland to forests and grasslands to improve the ecological environment and reduce soil erosion of the Loess Plateau (Shi et al., 2020; Yu et al., 2020). However, soil water consumption increases with the increase of vegetation cover, which exacerbates the water shortage problem in the vegetation restoration process of the Loess Plateau (Liu and Shao, 2015), and causes the changes of SWC dependent on soil depth (Yaseef et al., 2010; Gao et al., 2011; Jian et al., 2015). Therefore, it is necessary to study the temporal stability patterns of SWC in different seasons over consecutive years to understand the dynamics of soil SWC and the effect of vegetation restoration on SWC changes in the Loess Plateau. No studies have yet focused on the temporal stability of SWC, and the factors affecting this temporal stability, in the dry and rainy seasons on the Loess Plateau for several consecutive years.
Many studies have been performed to determine the factors influencing SWC temporal stability, and many results have shown that SWC temporal stability depends on soil properties, topography, vegetation, climate, observation period, and scale of the study area (Vachaud et al., 1985; Gómez-Plaza et al., 2000; Heathman et al., 2009; Hu et al., 2009; Pan and Wang, 2009; Martinez et al., 2013; Liu et al., 2020; Xu et al., 2021). Soil texture and topography are considered to be some of the most dominant influencing factors. Vachaud et al. (1985) reported that the clay content contributes more to the temporal stability of SWC than other relevant factors, consistent with Mohanty and Skaggs (2001). However, Mohanty and Skaggs (2001) found that sandy soils exhibited stronger and more remarkable temporal stability contrasted with silty soils. Jacobs et al. (2004) studied various terrains of the Walnut Creek watershed in an Iowa depression (hilltop, steep slope, and mild slope), and pointed that the optimal time stable locations were those on a mild slope having moderate or above moderate clay content. Gao et al. (2011) also reported that those time-stable locations should have some identical or similar characteristics with locations of comparatively high clay content, comparatively mild slope, and comparatively planar surface for the 0–60 cm SWC in semi-arid jujube. This confirmed the results of Jacobs et al. (2004). Hu et al. (2009) study showed that land use did not affect the SWC spatial variability and temporal stability, but soil particle size and organic matter content were the main key factors of SWC temporal stability. Studies have confirmed that vegetation also has an important effect on the stability of SWC (Gómez-Plaza et al., 2001), the normalized difference vegetation index value in the most stable location was the moderate and above level (Jacobs et al., 2010). Jia et al. (2013) found that SWC shortage was mainly caused by vegetation restoration and depended on plant species, while vegetation cover and aboveground biomass were the main factors affecting SWC temporal stability. He et al. (2019) reported that vegetation characteristics such as leaf area index, soil bulk density, and canopy interception losses had an obvious effect on the temporal stability of high-elevation forests SWC. Besides, the temporal stability of SWC varied with the seasons and was stronger with the increase of vertical soil depth (Pachepsky et al., 2005; Guber et al., 2008; Xu et al., 2017a). Vanderlinden et al. (2012) found that a combination of topography, soil, vegetation, and climate have close interaction and comprehensive influence on SWC stability, rather than a single dominant factor. Therefore, it is difficult to reach a consensus on the factors that affect the temporal stability of SWC. Further understanding of the influence of these factors on the temporal stability of SWC would be helpful for the rapid and accurate identification of representative locations, the prediction and estimation of SWC at different scales, and the establishment of SWC models.
This study was based on the measured data of SWC from July 2014 to November 2017 in 21 monitoring locations on a slope afforested with Pinus tabulaeformis Carr. The objectives of this study were: 1) to evaluate the spatial distribution and temporal stability of SWC at different depths during the dry and rainy seasons for several consecutive years; 2) to estimate the mean SWC at different depths in two periods using a single representative location; and 3) to further identify the dominant factors that influence the temporal stability of SWC in different seasons.
Materials and Methods
Study Area
The study was conducted in Wangmaogou watershed (110°20′26″–110°22′46″E, 37°34′13″–37°36′03″N). This 5.97 km2 area is located in Suide county, Shaanxi province, China (Figure 1). The watershed belongs to the typical gully region of the Loess Plateau, a central area of hydraulic erosion. The area of the upland and gully region in the watershed is 2.97 km2, accounting for 46.7% of the total watershed area. The elevation ranging is from 940 to 1200 m and the mean gradient is 28°. The region is dominated by a continental monsoon climate and has a mean temperature of 10.2°C. The annual mean evaporation and precipitation are 1,519 mm and 513 mm, respectively. Precipitation is unevenly distributed throughout the year, with more than 73.1% rainfall occurring between July and October. Figure 2 shows the precipitation distribution in the study area from June 2014 to November 2017. The typical soil type in the study area is loessial soil and the bulk density of surface soil ranges from 1.1 to 1.3 g/cm3. The soil in the watershed is made of over 60% fine sand and silt. The land use is dammed land (6.24%), forest land (9.5%), slope farmland (22.32%), terrace (25.78%), and grassland (36.51%). More information about the soil properties for the studied slope is shown in Table 1. Pinus tabulaeformis Carr. is one of the main tree species in the vegetation restoration process of Loess Plateau, so we chose typically sloped forestland covered by Pinus tabulaeformis Carr. to study. The selected slope is a slope and gully system with a small proportion of 1/5 of the whole slope, and the Pinus tabulaeformis Carr. is mainly distributed on the gully slope. The sample locations were placed in an approximate grid pattern along with the entire Pinus tabulaeformis Carr. forestland (Figure 1C). The mean plant spacing is 1.95 m and the stand age is 30 years.
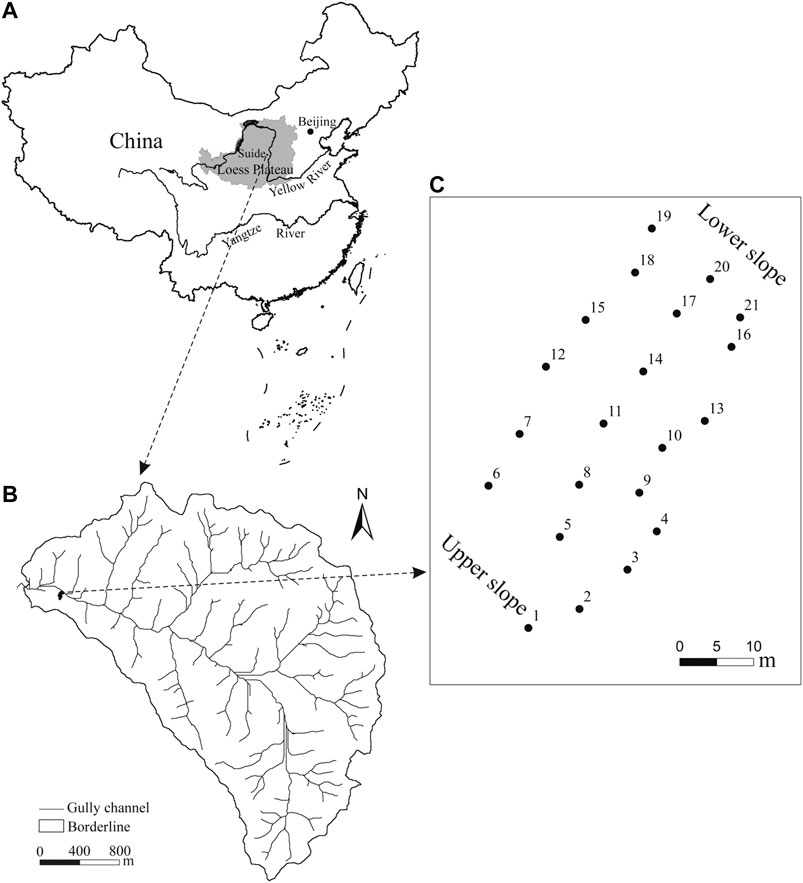
FIGURE 1. The distribution of the 21 tube locations across the hillslope (C) located in the Wangmaogou watershed (B) on the Loess Plateau, China (A).
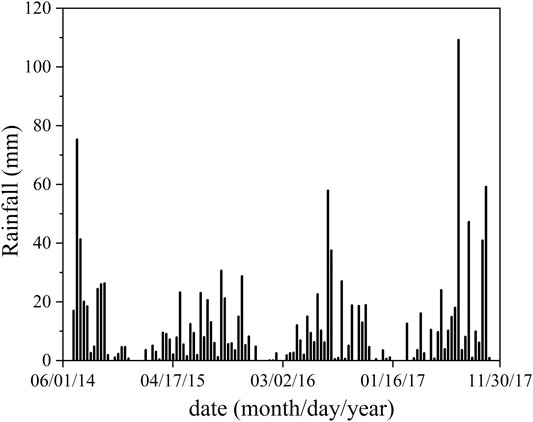
FIGURE 2. Evolution of daily rainfall for the study area from 2014 to 2017.
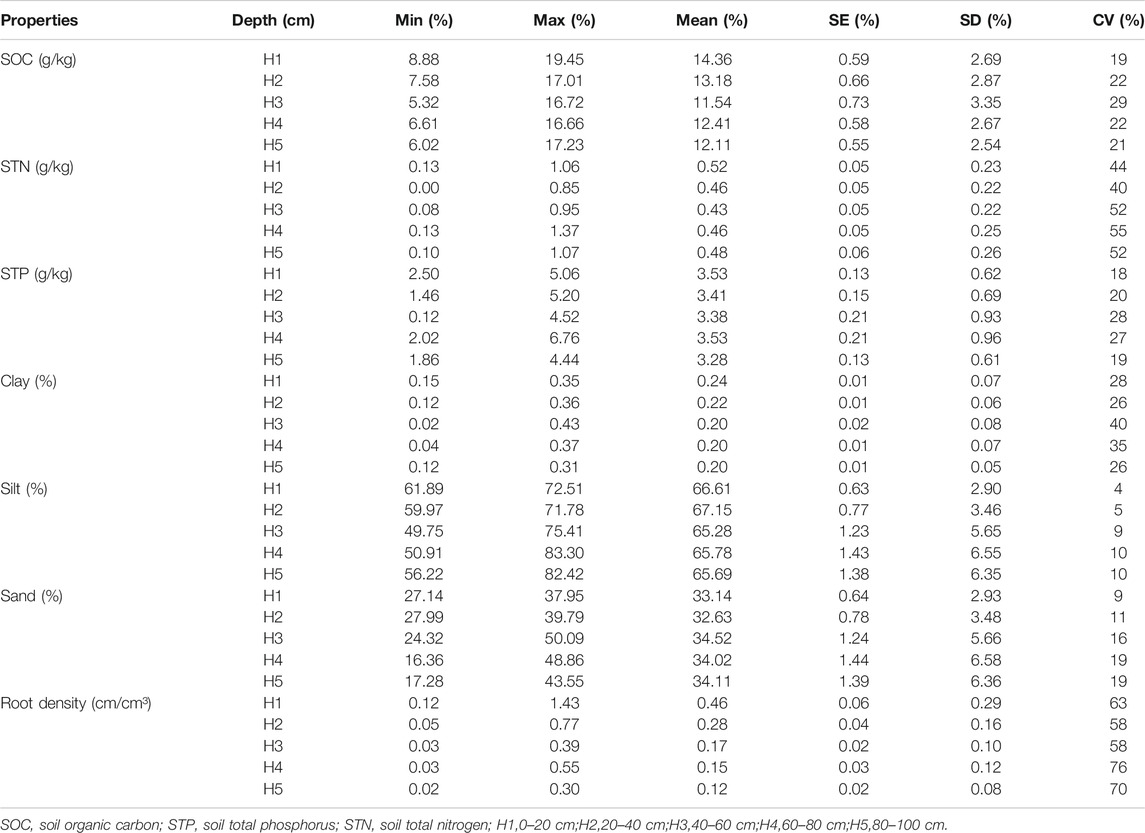
TABLE 1. Statistical characteristics of soil properties at different depths.
Soil Sampling and Measurement
We chose 21 sampling locations on the hillslope, at elevations ranging from 964 to 997 m, and placed a 2 m long polycarbonate (PC) tube with an inner diameter of 44 mm at those locations (Figure 1C). The mean horizontal distance between adjacent PC tubes was about 10 m. Soil samples with roots were gathered at each sampling location at 20 cm intervals, and each sample was taken back to the laboratory for testing and analysis of its soil organic carbon content (SOC), soil total phosphorus (STP), soil total nitrogen (STN), soil particle size and root density (Table 1). N/C3100 analyzer (Analytik Jena AG, Germany) was applied to measure SOC. Foss 8400 analyzer and Auto Discrete analyzer (ADA, CleverChem 200, Germany) were employed to analyze the content of STN and STP. The WinRHIZO 2013 image analyzer system (Regent Instruments Inc., Quebec, Canada) was employed to scan root samples that were previously rinsed to acquire root length and diameter. The Mastersizer 2000 particle size analyzer (Malvern Instruments, Malvern, United Kingdom) was applied to measure soil particle composition which was sorted according to clay (<0.002 mm), silt (0.002–0.05 mm), and sand (0.05–2.0 mm) by the percentage of the soil particle distribution.
Volumetric SWC (%, V/V) was obtained by a time domain reflectometry (TDR) system (TRIME-PICO IPH, Ettlingen, Germany) at each location at soil depths of 0–20, 20–40, 40–60, 60–80 and 80–100 cm. The mean values of 3 measurements were taken as the final SWC at each tube location and each depth. The SWC was generally recorded twice a month (at least once a month) for a total of 57 measurement events from July 2014 to November 2017. During the rainy season from June to November, 35 measurement events took place in total, and during the dry season from December to May of the following year, 22 measurement events took place in total. In all 21 sampling locations, SWC was recorded by TDR during the rainy season and the dry season. The five soil layers at a soil depth of 0–100 cm at 20 cm intervals were designated as H1, H2, H3, H4, and H5, respectively.
Method of Data Analysis
The following methods were used to analyze the SWC temporal stability and the representativeness of the estimation results at H1, H2, H3, H4, and H5 depths. The Spearman’s rank correlation coefficient, rs, was used to reflect the temporal stability and consistency of SWC rank changes with time at different sampling locations. Furthermore, rs = 1 indicated that soil the spatial distribution of SWC had strong temporal stability in spatial distribution during different periods (Douaik et al., 2006). The relative difference method was originally proposed by Vachaud et al. (1985). The mean relative difference (MRD) and the relative difference standard deviation (SDRD) were adopted to describe the SWC temporal stability and find the representative locations. A location can be regarded as the SWC representative location when the MRD of the sampling location ranged from −0.05 to 0.05, and the corresponding SDRD was lower than the mean value for SDRD (Jacobs et al., 2004; Xu et al., 2015). The SWC at representative locations can predict or estimate the mean SWC in the study area. A t-test can be used to test whether there was a significant difference between the SWC of representative locations and the mean SWC on the slope (Gao and Shao, 2012). The difference between the estimated and observed values was analyzed by the root mean square error (RMSE) and mean absolute error (MAE). The smaller RMSE and MAE, the smaller the difference between the SWC and the mean SWC at the representative location.
Results
Statistical Characteristics of SWC
The statistical characteristics of SWC at different depths during the rainy and dry seasons are shown in Table 2. The mean SWC ranged between 9.69–14.49% in the rainy season and 6.60–11.63% in the dry season. The mean SWC at 0–20 cm in the two periods was the lowest, while the mean SWC at 40–60 cm was the highest, indicating that more water can be stored at 40–60 cm soil depth. Also, the SWC at each depth in the rainy season was higher than that at the corresponding depth in the dry season. SWC in five soil depths ranged between 0.30–28.97% and 0.27–27.02% in the rainy and dry seasons, respectively. The coefficient of variation (CV), standard deviation (SD), standard error (SE) for the rainy and dry seasons generally decreased with increasing soil depth. The CV in the rainy season and dry season ranged between 33–51% and 26–50% respectively, both of which belong to moderate variability (Nielsen and Bouma, 1985).
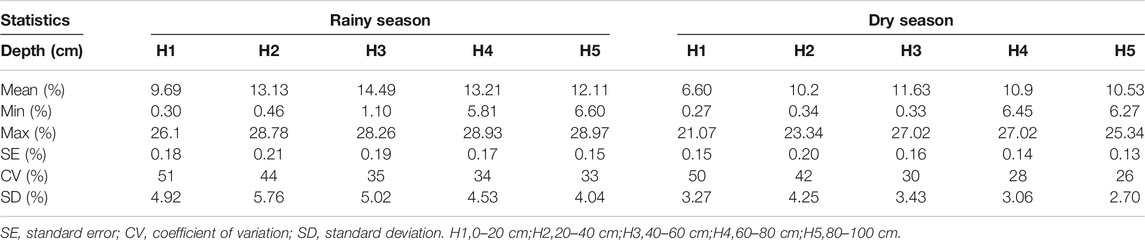
TABLE 2. Statistical characteristics of SWC at different soil depths during rainy and dry seasons.
Temporal Stability of Spatial Distribution of SWC
The variation characteristics of mean SWC measured on the entire observation period during the rainy and dry seasons, and the driest and the wettest date at a depth of 0–100 cm in 21 locations are shown in Figure 3. The driest and wettest dates for the mean SWC at 0–100 cm depth during the rainy season occurred on Jun. 15, 2015 and Oct. 28, 2017 respectively (Figure 3A). In contrast, the driest and wettest dates for mean SWC at 0–100 cm depth during the dry season occurred on Feb. 3, 2015 and Apr. 16, 2017, respectively (Figure 3B). There was a significant difference between the wettest and driest dates of mean SWC in the rainy and dry seasons (p = 0.000). However, the spatial distribution of SWC on the entire observation period, the driest and wettest dates were strongly correlated (p < 0.01), and the spatial distribution pattern of SWC was almost unchanged.
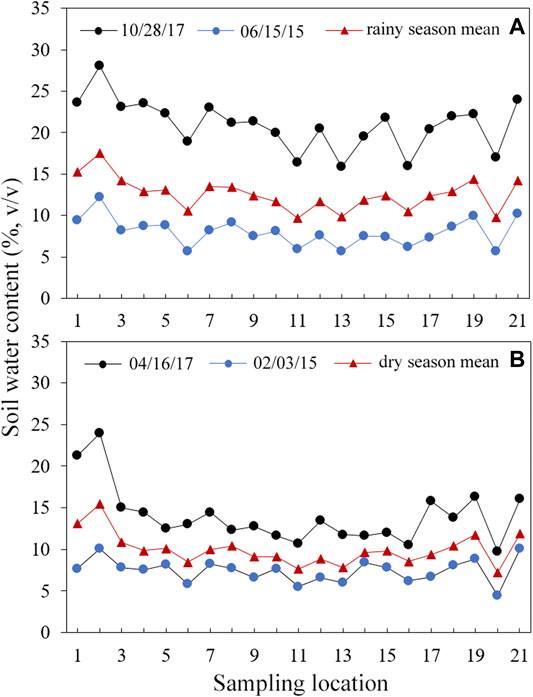
FIGURE 3. Mean SWC Change of 21 locations in the rainy season (A) and dry season (B) on the driest and wettest dates in the depth of 100 cm.
The Spearman’s rank correlation coefficient, rs, was used to later analyze the temporal stability of the spatial distribution of SWC. Figure 4 shows the mean Spearman’s rank correlation coefficient time series at different soil depths in two periods. During the rainy season, the rs values varied from 0.15 to 0.85 at different soil depths for each measurement date, and the lowest rs value occurred on August 24, 2017 (Figure 4A). The mean values of the correlation coefficients rs from H1 to H5 were 0.65, 0.74, 0.63, 0.74, and 0.76, respectively. During the dry season, the rs value varied from 0.39 to 0.86 at different soil depths for each measurement date, and the lowest rs value was on December 1, 2016 (Figure 4B). The mean values of H1 to H5 correlation coefficients rs in the dry season were 0.60, 0.78, 0.68, 0.70, and 0.75, respectively. The rs values in the rainy season and the dry season were generally close to 1, indicating that there was strong temporal stability in the spatial pattern of SWC at each depth. The mean rs at H2, H3, H4, H5 depth was higher in the dry season than in the rainy season (Figure 5), indicating that SWC temporal stability in the dry season was stronger compared with the rainy season at those depths. There was no significant difference between the average rs values of different depths of soil layers in the rainy season and those of the corresponding soil layers in the dry season (p > 0.05). The rs values at soil depths from H2 to H5 in the rainy season and dry season were significantly higher than the rs values at H1. The spatial patterns of SWC in the two periods were significantly correlated (p < 0.05), most showing an extremely significant correlation (p < 0.01), indicating that the spatial patterns of SWC at each depth had strong temporal stability.
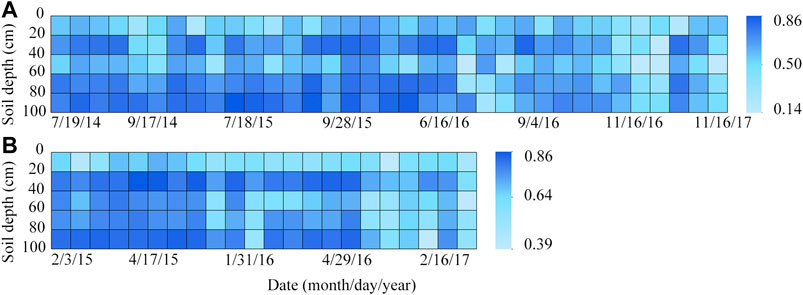
FIGURE 4. Time series of mean Spearman rank correlation coefficients (rs) at different depths in the (A) rainy season and (B) dry season.
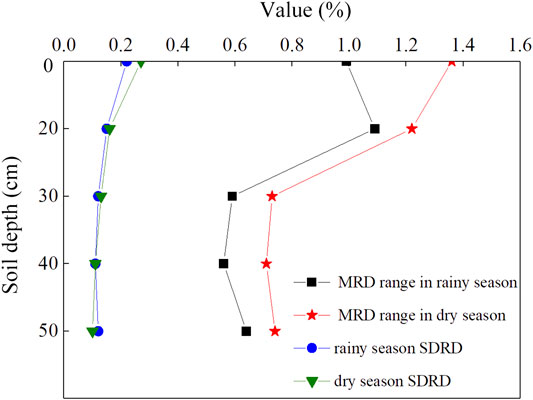
FIGURE 5. Variation of mean MRD range and mean SDRD of different soil layers change with depth in the rainy season and dry season.
Representative Locations at Different Soil Depths
Some locations which can represent or estimate the mean SWC value can be quantitatively obtained by the relative difference method. This method involves calculating the MRD and the SDRD under different soil depths, and plotting the relative difference diagram of different soil depths in two periods, as shown in Figure 6. The ranges between the maximum and minimum MRD values at H1, H2, H3, H4 and H5 in the rainy season and dry season were 0.99%, 1.09%, 0.59%, 0.56%, 0.64% and 1.36%, 1.22%, 0.73%, 0.71%, 0.74%, respectively. The ranges of MRD values at H3, H4, and H5 were smaller than that of the soil layers H1 and H2, indicating that the spatial variability of SWC was smaller and the temporal stability of SWC was stronger at the depth of 40–100 cm. The range of MRD values in the dry season was higher than in the rainy season. The Spearman’s rank correlation coefficient of MRD in the rainy and dry seasons was close to 1, and the MRD rank in the two periods showed an extremely significant correlation (p < 0.01) which gradually increased with depth. Under the same soil depth, the number of representative locations was different in the rainy and dry seasons. The number of representative locations at different soil depths during the rainy and dry seasons was also not constant. These phenomena indicated that the distribution pattern of SWC on the forestland slope in different seasons had temporal stability. And the temporal stability of the spatial distribution of SWC increased with soil depth and varied with the season.
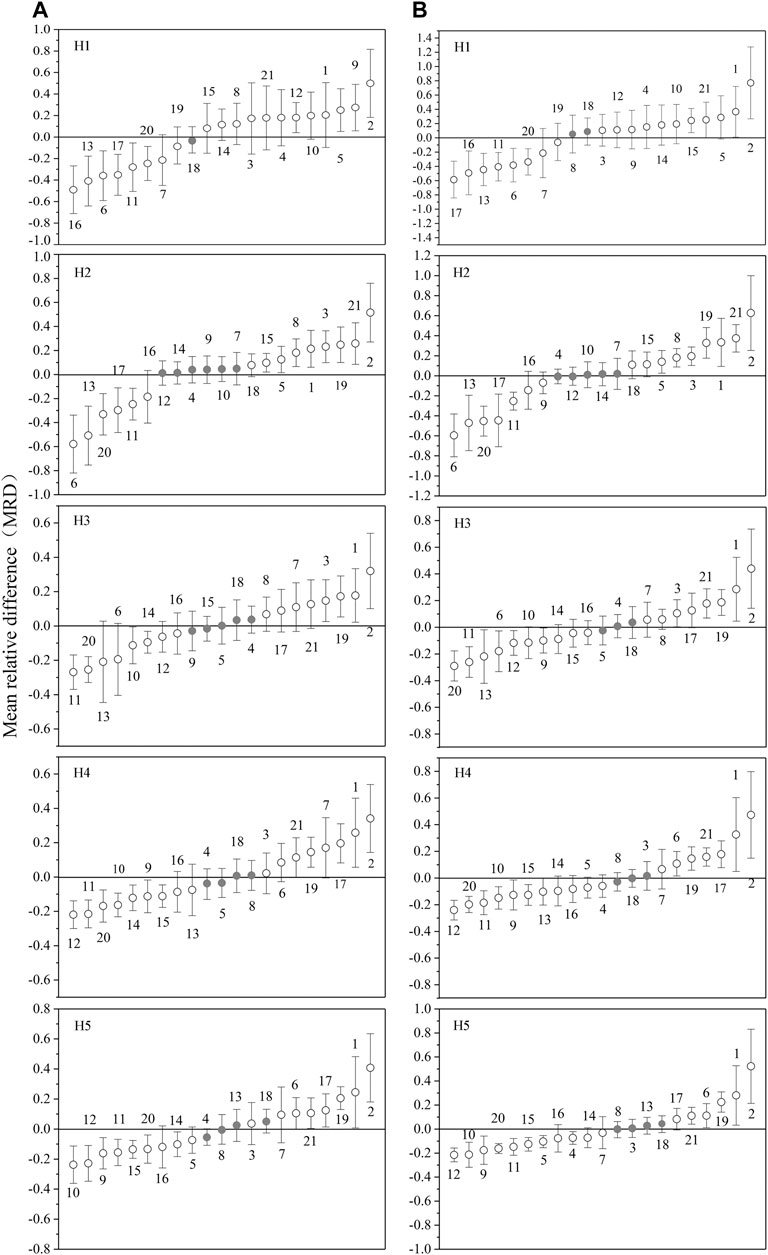
FIGURE 6. The mean relative differences of each different soil depth in the rainy season (A) and dry season (B). The error bar represents the standard deviation of the relative difference. The gray solid circle is the representative location of each soil layer.
The locations with stronger SWC temporal stability should have smaller SDRD. The average SDRD values of H1, H2, H3, H4 and H5 in rainy and dry seasons were 0.22, 0.15, 0.13, 0.11, 0.12 and 0.27, 0.16, 0.13, 0.11, 0.10, respectively. The variations of mean MRD range and mean SDRD of different soil layers with depth in the rainy and dry seasons are shown in Figure 5. As a whole, the mean SDRD value decreased with soil depth. The mean SDRD value at H1 was the highest, indicating that the temporal stability of SWC at H1 was the lowest in both periods. Also, we found that representative locations had average elevation, TP, clay, silt, or sand compared with the corresponding study area average. The soil characteristics of the representative locations and the whole study area are compared in Table 3.
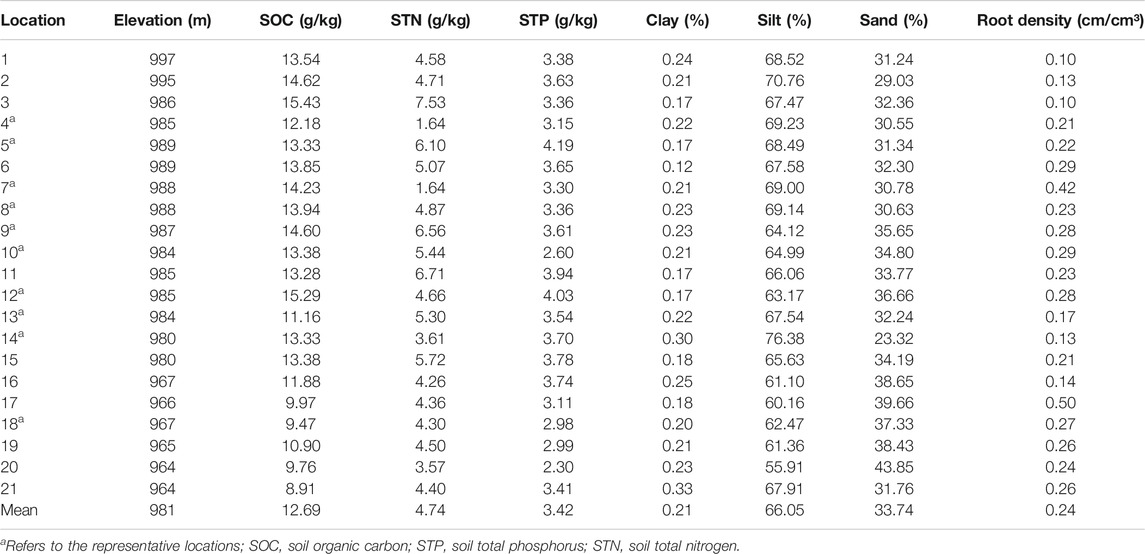
TABLE 3. The soil characteristics of the representative locations and the whole study area.
Estimation and Accuracy Analysis of Mean SWC on Forestland Slope by Representative Location
According to the location of temporal stability determined by MRD and SDRD, selecting a single location representing four or five layers can be used to estimate the mean SWC. Location 18 was determined to best represent the mean SWC at different depths during the two periods. In the two seasons at each soil depth, a portion of the measurement events was used to establish a linear regression line between the measured mean SWC and the estimated SWC by the representative location, while the remaining events were used to test the accuracy of the estimation of the mean SWC on the slope by the representative location. Figure 7 shows the linear regression line between the measured SWC and estimated SWC at the representative location during the two periods. The determination coefficient R2 of the linear regression in the rainy and dry seasons ranges from 0.81 to 0.94 and 0.63 to 0.83 respectively, and all the linear regressions are significant at the level of p < 0.01. The accuracy of estimating the mean SWC on forestland slope by representative location points was further analyzed. For the rainy season, the RMSE value ranged from 0.62 to 1.81% and the MAE value ranged from 0.48 to 1.68%. For the dry season, the RMSE value ranged from 0.52 to 1.45% and the MAE value ranged from 0.42 to 1.08%. Cosh et al. (2008) considered that estimation is accurate when the RMSE between the estimated and measured values is less than 2%. The RMSE values in two periods at each depth were less than 2%. The lower the RMSE and MAE values in the two periods, the smaller the error between the predicted and the measured values, and the higher the confidence of estimating the average SWC. Therefore, we considered that a single representative location can be reliably used to estimate the mean SWC at different depths of the slope in the two periods, and the estimation accuracy was within the acceptable range.
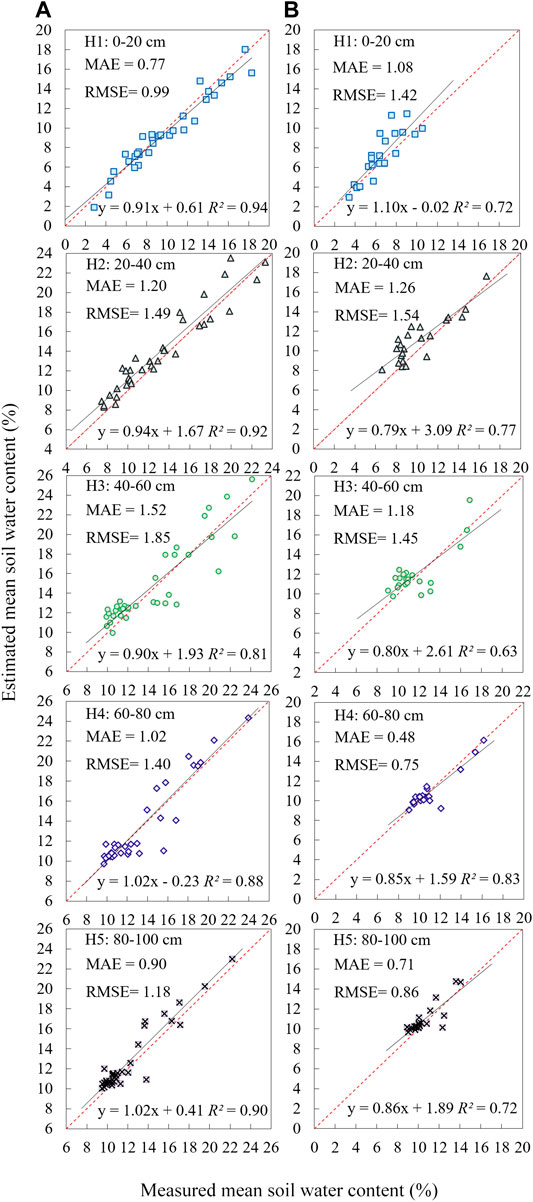
FIGURE 7. Plot mean soil water content vs. SWC at representative locations for the 0–20, 20–40, 40–60, 60–80, and 80–100 cm soil layers (location 18 for the five soil layer) during the (A) rainy season and (B) dry season.
Factors Affecting the Stability of SWC
The Pearson’s correlation coefficients of the temporal stability parameters MRD, SDRD, and altitude, SOC, total N (TN), total P (TP), silt, sand, and clay and root density are shown in Table 4. From the relationship between MRD and soil properties mentioned above, MRD in rainy and dry seasons was significantly positively correlated with elevation and silt (p < 0.05), and negatively correlated with sand (p < 0.05). SDRD in the rainy and dry seasons was significantly positively correlated with elevation, SOC, and root density (p < 0.05). The factors affecting MRD and SDRD during the rainy season were fewer than those during the dry season. There was no significant correlation between TN, TP, clay content, and MRD and SDRD. The Pearson's correlation showed that soil particle size, root system, elevation, and SOC were the main factors affecting the spatial pattern and temporal stability of SWC in sloping forestland.
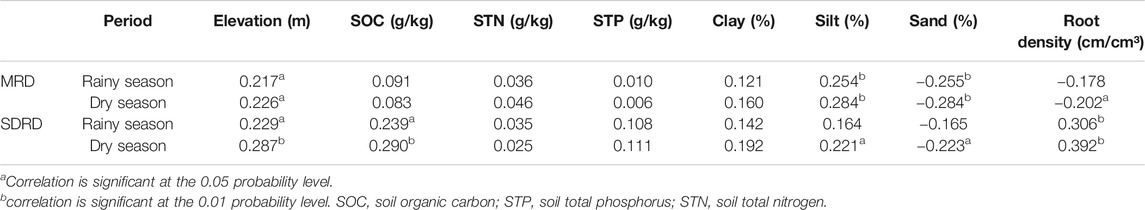
TABLE 4. Pearson correlation between MRD, SDRD, and influencing factors in rainy and dry seasons.
Redundancy analysis (RDA) was used to further analyze the relationship between SWC and soil properties. The SWC data matrix consisted of MRD and SDRD, and the soil properties data matrix was composed of elevation, root density, SOC, TN, and TP. The longest arrow lines of elevation, and sand and root density indicated that they had significant effects on soil properties in the RDA ordination chart of Figure 8. During the two periods, MRD was positively correlated with elevation and negatively correlated with root density and sand content. SDRD was positively correlated with elevation and root density, and negatively correlated with sand content.
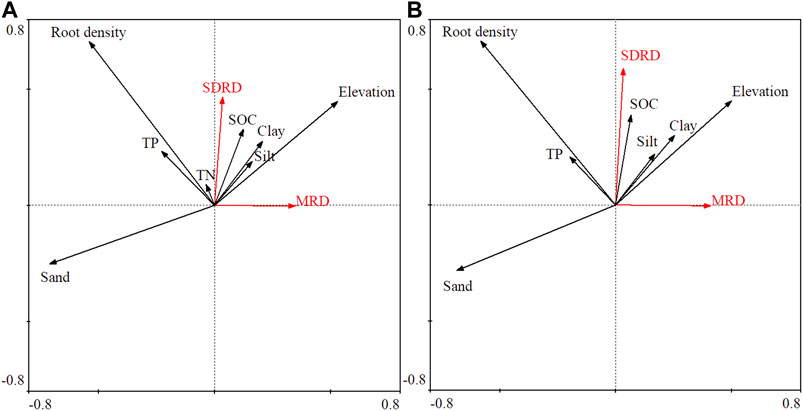
FIGURE 8. Two dimensional ordination diagram of redundancy analysis of MRD and SDRD in (A) rainy season and (B) dry season.
Discussion
Temporal Variability and Temporal Stability of SWC
The SWC at different depths on the slope of the forest area under study was lower than 15% due to relatively low precipitation and strong evapotranspiration in the rainy and dry seasons (Gao and Shao, 2012; Liu and Shao, 2015; Xu et al., 2017a). The SWC at 40–60 cm depth was the highest, due to the lower distribution of high water consumption root organisms and relatively high precipitation replenishment at this depth (He et al., 2019). SWC in the rainy season was higher than that in the dry season, attributed to the different distributions of the root, rainfall recharge, and transpiration in different seasons. The spatial variability of deep SWC was low, consistent with other reports (Jia et al., 2013). Deep SWC was relatively weakly affected by rainfall events, evaporation, and climate ((Penna et al., 2009; Duan et al., 2017).
The spatial distribution patterns and Spearman’s rank correlation coefficient of SWC in the rainy and dry seasons showed strong temporal stability in all the five soil layers, consistent with previous studies (Vachaud et al., 1985; Schneider et al., 2008; Brocca et al., 2009; Gao and Shao, 2012; Zhao et al., 2017). According to the change of mean Spearman’s rank correlation coefficient, and MRD and SDRD calculated in the two periods, the temporal stability of SWC in deep soil depth were stronger than that in shallow soil depth. The main reasons for this phenomenon were that the effects of vegetation, topography, climate change and surface hydrological conditions on the temporal stability of SWC in deep layers decreased with the increase of soil depth (Hu et al., 2010b; Biswas and Cheng Si, 2011; Gao et al., 2011; Vanderlinden et al., 2012; Penna et al., 2013). At the same time, soil structure, strong heterogeneity of canopy interception, and the capacity of soil to retain water also reduced the temporal stability of shallow SWC (Korsunskaya et al., 1995; He et al., 2019).
However, the mean Spearman’s rank correlation coefficient at 20–60 cm depth was higher in the dry season than in the rainy season, indicating that SWC temporal stability in the dry season was stronger than in the rainy season at this depth. This conclusion is inconsistent with the previous results in other regions. For example, Williams et al. (2009) and Penna et al. (2013) found that SWC has more temporal stability in the rainy season. The 21 sampling locations in our study area ranged between 964–997 m in elevation, and the relatively large topographic relief had a certain impact on the temporal stability of SWC in different seasons. Gao et al. (2011) found that the temporal stability of SWC at 20–60 cm depth was higher in dry seasons than in wet seasons due to the complex topography of the jujube forest on the loess plateau. Lin (2006) also reported that the temporal stability of SWC spatial patterns in complex terrain may vary between seasons.
Mean SWC at Representative Locations
The variation range of MRD values in rainy and dry seasons decreased with depth, due to the weak spatial variability of soil water in deep layers (Table 2). Other studies have found that the range of MRD values increases with soil depth (Gao and Shao, 2012; Jia et al., 2013; Li et al., 2015), related to the soil, terrain, vegetation characteristics, and the study area scale (Schneider et al., 2008; Brocca et al., 2009). Average SDRD values in rainy and dry seasons decreased with the soil depth, similarly to previous research results (Guber et al., 2008; Penna et al., 2013; Liu and Shao, 2014). The influence of climate, biological, and hydrological factors on deep soil were smaller than on shallow soil, resulting in the low SDRD value of deep soil. The main reason for the low SDRD value of deep soil was that the influence of climate, biological, and hydrological factors on deep soil decreased with depth (Vanderlinden et al., 2012; Gao et al., 2016), which increased the temporal stability of SWC in deep layers. As in other studies, the representative locations of temporal stability varied with the depth and the number was not constant (Hu et al., 2010a; Coppola et al., 2011; de Souza et al., 2011; Martinez et al., 2013; Liu and Shao, 2014).
We found that representative locations were those having average elevation, TP, clay, silt, sand content, or root density compared to the corresponding means on the sloped forestland. Some studies have also reported that time-stable locations present some significant characteristics, such as mean soil bulk density, leaf area index, slope, slope direction, elevation, or relatively low canopy interception loss compared to the corresponding field means (Vanderlinden et al., 2012; He et al., 2019). Many previous studies have shown that it is difficult to accurately estimate the average SWC of multiple soil depths using a single stable location (Vanderlinden et al., 2012; Li et al., 2015), and even that no single stable location can represent the mean SWC at different depths (Duan et al., 2017). This study found a single stable location could estimate the field mean SWC at different depths satisfactorily, confirming the results (Jia et al., 2013; Penna et al., 2013; He et al., 2019). More importantly, our results showed that SWC in different seasons can also be estimated by the same representative location. The R2 in the rainy season was all larger than in the dry season, indicating that the estimation accuracy of representative locations was higher for the rainy season. Also, the low RMSE and MAE values of the two periods indicated that the estimation of mean SWC was accurate (Cosh et al., 2008).
Major Factors Influencing the Spatial and Temporal Changes of SWC
The Pearson’s correlation coefficient carried out showed that the factors affecting MRD and SDRD varied with the season, and more factors affected SWC parameters in the dry season than in the rainy season. The differences in climate, temperature, vegetation, and rainfall between the dry and rainy seasons are the main reason for the different factors influencing MRD and SDRD in the two periods. The RDA ordination chart of the two periods in Figure 8 indicates that elevation, root density, and sand content were the main factors influencing the temporal stability of SWC. The temporal stability of complex terrain is strongly affected by altitude (Cosh et al., 2008), and the distribution of root biomass leads to the dynamic of the required water height of vegetation (Zhao et al., 2010; He et al., 2019). The temporal stability of the SWC spatial pattern was related to soil, terrain, and vegetation (Gao and Shao, 2012).
The elevation, silt, and sand content had significant effects on MRD in the dry and rainy seasons. During the two periods, MRD was significantly negatively correlated with sand content (p < 0.01), and positively correlated with elevation and silt content. MRD in the dry season was also significantly affected by root density (p < 0.05), mainly because rainfall replenishment of soil water in the dry season was less than in the rainy season, leading to a significant influence of root water absorption on MRD. MRD was significantly influenced by soil particle size, in agreement with previous research (Vachaud et al., 1985; Penna et al., 2013; Chaney et al., 2015). However, the correlation between MRD and clay was not significant because soil texture was dominated by silt and sand in the study area, while clay content was less than 0.5%. Also, MRD was not significantly correlated with SOC, TP, and TN. Jia et al. (2013) also found that TP was not significantly correlated with MRD, but Zhao et al. (2010), Biswas and Cheng Si (2011) showed that MRD was significantly correlated with SOC. MRD was significantly associated with elevation, and many studies also reported that elevation had a slight or significant effect on SWC temporal stability (Hébrard et al., 2006; Zhao et al., 2010; Biswas and Cheng Si, 2011; Gao and Shao, 2012).
There have been few studies on the factors influencing SDRD in different seasons. In our study, in the two periods, SDRD was significantly positively correlated with elevation, SOC, and root density. Previous studies showed that elevation mainly affects the redistribution of SWC after rainfall (Vivoni et al., 2008), and indirectly affects evapotranspiration through solar radiation time and temperature (Xu et al., 2017a). Zhang et al. (2019) reported that soil particle size affects SOC content, so the effect of SOC content on SDRD was essentially still the effect of soil particle size on SWC temporal stability. Root water absorption has an important effect on SWC (Graefe et al., 2011). Soil particle size had a significant effect on SDRD in the dry season (p < 0.05), especially the content of clay and sand. A relatively high silt content and a low sand content result in a smaller SDRD, which is consistent with the result of RDA. However, SDRD was not significantly correlated with TN, TP, and clay content in two seasons.
Conclusion
Based on SWC data from 57 monitoring events in rainy and dry seasons, we studied the temporal stability and temporal spatial variability of SWC for several consecutive years in the Loess Plateau in China. SWC in this area showed moderate variability and presented strong temporal stability in dry and rainy seasons. The SWC temporal stability and representative location varied with the season and soil depth. The mean SWC at five depths in different seasons can be simultaneously predicted by a single representative location and allows accurate estimations. The factors influencing MRD and SDRD varied with the seasons. Moreover, elevation, root density, and sand content were the dominant factors affecting the temporal stability of SWC in two seasons. More attention should be emphasized to the comprehensive effects of season, complex topography, and soil properties on SWC in arid and semi-arid areas. Our results provide support for the targeted management of water resources during the dry and rainy seasons and the restoration of reasonable vegetation in arid and semi-arid areas.
Data Availability Statement
The raw data supporting the conclusions of this article will be made available by the authors, without undue reservation.
Author Contributions
All authors contributed to the study conception and design. Material preparation, data collection and analysis were performed by MX, GX, YC, ZM, PL, BZ, PS, and LX. The first draft of the manuscript was written by MX and all authors commented on previous versions of the manuscript. All authors read and approved the final manuscript.
Funding
This research was supported by the National Key Research and Development Program (Grant No.: 2017YFC0504704), the National Natural Science Foundations of China (Grant No.: 52022081), the Innovative Talent Promotion Plan of Shaanxi Province (Grant No.: 2018TD-037), the Science and Technology Program of Yulin (Grant No.: 2019-144).
Conflict of Interest
The authors declare that the research was conducted in the absence of any commercial or financial relationships that could be construed as a potential conflict of interest.
Acknowledgments
We thank the reviewers for their useful comments and suggestions.
References
Biswas, A., and Cheng Si, B. (2011). Scales and locations of time stability of soil water storage in a hummocky landscape. J. Hydrol. 408 (1-2), 100–112. doi:10.1016/j.jhydrol.2011.07.027
Brocca, L., Melone, F., Moramarco, T., and Morbidelli, R. (2009). Soil moisture temporal stability over experimental areas in Central Italy. Geoderma 148 (3-4), 364–374. doi:10.1016/j.geoderma.2008.11.004
Chaney, N. W., Roundy, J. K., Herrera-Estrada, J. E., and Wood, E. F. (2015). High-resolution modeling of the spatial heterogeneity of soil moisture: applications in network design. Water Resour. Res. 51 (1), 619–638. doi:10.1002/2013wr014964
Cheng, Y., Li, P., Xu, G., Wang, X., Li, Z., Cheng, S., et al. (2021). Effects of dynamic factors of erosion on soil nitrogen and phosphorus loss under freeze-thaw conditions. Geoderma 390, 114972. doi:10.1016/j.geoderma.2021.114972
Coppola, A., Comegna, A., Dragonetti, G., Lamaddalena, N., Kader, A. M., and Comegna, V. (2011). Average moisture saturation effects on temporal stability of soil water spatial distribution at field scale. Soil Till. Res. 114 (2), 155–164. doi:10.1016/j.still.2011.04.009
Cosh, M. H., Jackson, T. J., Moran, S., and Bindlish, R. (2008). Temporal persistence and stability of surface soil moisture in a semi-arid watershed. Remote Sens. Environ. 112 (2), 304–313. doi:10.1016/j.rse.2007.07.001
de Souza, E. R., Montenegro, A. A. d. A., Montenegro, S. M. G., and Matos, J. d. A. (2011). Temporal stability of soil moisture in irrigated carrot crops in Northeast Brazil. Agric. Water Manag. 99 (1), 26–32. doi:10.1016/j.agwat.2011.08.002
Douaik, A., Van Meirvenne, M., and Tóth, T. (2006). Temporal stability of spatial patterns of soil salinity determined from laboratory and field electrolytic conductivity. Arid Land Res. Manag. 20, 1–13. doi:10.1080/15324980500369392
Duan, L., Huang, M., and Zhang, L. (2016). Use of a state-space approach to predict soil water storage at the hillslope scale on the Loess Plateau, China. Catena 137, 563–571. doi:10.1016/j.catena.2015.11.003
Duan, L., Huang, M., Li, Z., Zhang, Z., and Zhang, L. (2017). Estimation of spatial mean soil water storage using temporal stability at the hillslope scale in black locust ( Robinia pseudoacacia ) stands. Catena 156, 51–61. doi:10.1016/j.catena.2017.03.023
Gao, L., Lv, Y., Wang, D., Muhammad, T., Biswas, A., and Peng, X. (2016). Soil water storage prediction at high space-time resolution along an agricultural hillslope. Agric. Water Manag. 165, 122–130. doi:10.1016/j.agwat.2015.11.012
Gao, L., and Shao, M. (2012). Temporal stability of shallow soil water content for three adjacent transects on a hillslope. Agric. Water Manag. 110, 41–54. doi:10.1016/j.agwat.2012.03.012
Gao, X., Wu, P., Zhao, X., Shi, Y., and Wang, J. (2011). Estimating spatial mean soil water contents of sloping jujube orchards using temporal stability. Agric. Water Manag. 102 (1), 66–73. doi:10.1016/j.agwat.2011.10.007
Gómez-Plaza, A., Alvarez-Rogel, J., Albaladejo, J., and Castillo, V. (2000). Spatial patterns and temporal stability of soil moisture across a range of scales in a semi-arid environment. Hydrol. Process 14 (7), 1261–1277. doi:10.1002/(SICI)1099-1085(200005)14
Gómez-Plaza, A., Martı́nez-Mena, M., Albaladejo, J., and Castillo, V. M. (2001). Factors regulating spatial distribution of soil water content in small semiarid catchments. J. Hydrol. 253 (1), 211–226. doi:10.1016/S0022-1694(01)00483-8
Graefe, S., Leuschner, C., Coners, H., and Hertel, D. (2011). Root functioning in tropical high-elevation forests: environmental vs. biological control of root water absorption. Environ. Exp. Bot. 71 (3), 329–336. doi:10.1016/j.envexpbot.2011.01.001
Grayson, R. B., and Western, A. W. (1998). Towards areal estimation of soil water content from point measurements: time and space stability of mean response. J. Hydrol. 207 (1-2), 68–82. doi:10.1016/s0022-1694(98)00096-1
Guber, A. K., Gish, T. J., Pachepsky, Y. A., van Genuchten, M. T., Daughtry, C. S. T., Nicholson, T. J., et al. (2008). Temporal stability in soil water content patterns across agricultural fields. Catena 73 (1), 125–133. doi:10.1016/j.catena.2007.09.010
He, Z. B., Zhao, M. M., Zhu, X., Du, J., Chen, L.-F., Lin, P. F., et al. (2019). Temporal stability of soil water storage in multiple soil layers in high-elevation forests. J. Hydrol. 569, 532–545. doi:10.1016/j.jhydrol.2018.12.024
Heathman, G. C., Cosh, M. H., Han, E., Jackson, T. J., McKee, L., and McAfee, S. (2012). Field scale spatiotemporal analysis of surface soil moisture for evaluating point-scale in situ networks. Geoderma 170, 195–205. doi:10.1016/j.geoderma.2011.11.004
Heathman, G. C., Larose, M., Cosh, M. H., and Bindlish, R. (2009). Surface and profile soil moisture spatio-temporal analysis during an excessive rainfall period in the Southern Great Plains, USA. Catena 78 (2), 159–169. doi:10.1016/j.catena.2009.04.002
Hébrard, O., Voltz, M., Andrieux, P., and Moussa, R. (2006). Spatio-temporal distribution of soil surface moisture in a heterogeneously farmed Mediterranean catchment. J. Hydrol. 329 (1), 110–121. doi:10.1016/j.jhydrol.2006.02.012
Hu, W., and Si, B. C. (2014). Can soil water measurements at a certain depth be used to estimate mean soil water content of a soil profile at a point or at a hillslope scale? J. Hydrol. 516, 67–75. doi:10.1016/j.jhydrol.2014.01.053
Hu, W., and Si, B. C. (2016). Estimating spatially distributed soil water content at small watershed scales based on decomposition of temporal anomaly and time stability analysis. Hydrol. Earth Syst. Sci. 20 (1), 571–587. doi:10.5194/hess-20-571-2016
Hu, W., Shao, M., Wang, Q., and Reichardt, K. (2009). Time stability of soil water storage measured by neutron probe and the effects of calibration procedures in a small watershed. Catena 79 (1), 72–82. doi:10.1016/j.catena.2009.05.012
Hu, W., Shao, M., Han, F., Reichardt, K., and Tan, J. (2010a). Watershed scale temporal stability of soil water content. Geoderma 158 (3-4), 181–198. doi:10.1016/j.geoderma.2010.04.030
Hu, W., Shao, M., and Reichardt, K. (2010b). Using a new criterion to identify sites for mean soil water storage evaluation. Soil Sci. Soc. Am. J. 74 (3), 762–773. doi:10.2136/sssaj2009.0235
Jacobs, J. M., Hsu, E.-C., and Choi, M. (2010). Time stability and variability of electronically scanned thinned array radiometer soil moisture during southern great plains hydrology experiments. Hydrol. Process. 24, 2807–2819. doi:10.1002/hyp.7703
Jacobs, J., Mohanty, B., Hsu, E.-C., and Miller, D. (2004). SMEX02: field scale variability, time stability and similarity of soil moisture. Remote Sens. Environ. 92, 436–446. doi:10.1016/j.rse.2004.02.017
Jia, X., Shao, M. a., Wei, X., and Wang, Y. (2013). Hillslope scale temporal stability of soil water storage in diverse soil layers. J. Hydrol. 498, 254–264. doi:10.1016/j.jhydrol.2013.05.042
Jian, S., Zhao, C., Fang, S., and Yu, K. (2015). Effects of different vegetation restoration on soil water storage and water balance in the Chinese Loess Plateau. Agric. For. Meteorol. 206, 85–96. doi:10.1016/j.agrformet.2015.03.009
Kachanoski, R. G., and De Jong, E. (1988). Scale dependence and the temporal persistence of spatial patterns of soil water storage. Water Resour. Res. 24 (1), 85–91. doi:10.1029/wr024i001p00085
Korsunskaya, L., Gummatov, N., and Pachepskiy, Y. A. (1995). Seasonal changes in root biomass, carbohydrate content, and structural characteristics of Gray Forest soil. EurAsian Soil Sci. 27 (9), 45–52.
Li, X., Shao, M., Jia, X., Wei, X., and He, L. (2015). Depth persistence of the spatial pattern of soil-water storage along a small transect in the Loess Plateau of China. J. Hydrol. 529, 685–695. doi:10.1016/j.jhydrol.2015.08.039
Lin, H. (2006). Temporal stability of soil moisture spatial pattern and subsurface preferential flow pathways in the shale hills catchment. Vadose Zone J. 5, 317–340. doi:10.2136/vzj2005.0058
Liu, B., and Shao, M. (2014). Estimation of soil water storage using temporal stability in four land uses over 10 years on the Loess Plateau, China. J. Hydrol. 517, 974–984. doi:10.1016/j.jhydrol.2014.06.003
Liu, B., and Shao, M. (2015). Modeling soil-water dynamics and soil-water carrying capacity for vegetation on the Loess Plateau, China. Agric. Water Manag. 159, 176–184. doi:10.1016/j.agwat.2015.06.019
Liu, Y., Li, P., Wang, T., Liu, Q., and Wang, W. (2020). Root respiration and belowground carbon allocation respond to drought stress in a perennial grass (Bothriochloa ischaemum). Catena 188, 104449. doi:10.1016/j.catena.2019.104449
Martinez, G., Pachepsky, Y. A., Vereecken, H., Hardelauf, H., Herbst, M., and Vanderlinden, K. (2013). Modeling local control effects on the temporal stability of soil water content. J. Hydrol. 481, 106–118. doi:10.1016/j.jhydrol.2012.12.024
Mohanty, B. P., and Skaggs, T. H. (2001). Spatio-temporal evolution and time-stable characteristics of soil moisture within remote sensing footprints with varying soil, slope, and vegetation. Adv. Water Resour. 24 (9-10), 1051–1067. doi:10.1016/s0309-1708(01)00034-3
Pachepsky, Y. A., Guber, A. K., and Jacques, D. (2005). Temporal persistence in vertical distributions of soil moisture contents. Soil Sci. Soc. Am. J. 69, 347–352. doi:10.2136/sssaj2005.0347
Pan, Y.-X., and Wang, X.-P. (2009). Factors controlling the spatial variability of surface soil moisture within revegetated-stabilized desert ecosystems of the Tengger Desert, Northern China. Hydrol. Process. 23 (11), 1591–1601. doi:10.1002/hyp.7287
Penna, D., Borga, M., Norbiato, D., and Dalla Fontana, G. (2009). Hillslope scale soil moisture variability in a steep alpine terrain. J. Hydrol. 364 (3-4), 311–327. doi:10.1016/j.jhydrol.2008.11.009
Penna, D., Brocca, L., Borga, M., and Dalla Fontana, G. (2013). Soil moisture temporal stability at different depths on two alpine hillslopes during wet and dry periods. J. Hydrol. 477, 55–71. doi:10.1016/j.jhydrol.2012.10.052
Schneider, K., Huisman, J. A., Breuer, L., Zhao, Y., and Frede, H. G. (2008). Temporal stability of soil moisture in various semi-arid steppe ecosystems and its application in remote sensing. J. Hydrol. 359 (1), 16–29. doi:10.1016/j.jhydrol.2008.06.016
Shi, P., Feng, Z., Gao, H., Li, P., Zhang, X., Zhu, T., et al. (2020). Has “grain for green” threaten food security on the Loess Plateau of China? Ecosyst. Health Sustainability 6 (1), 1709560. doi:10.1080/20964129.2019.1709560
Vachaud, G., Passerat de Silans, A., Balabanis, P., and Vauclin, M. (1985). Temporal stability of spatially measured soil water probability density function. Soil Sci. Soc. Am. J. 49 (4), 822–828. doi:10.2136/sssaj1985.03615995004900040006x
Vanderlinden, K., Vereecken, H., Hardelauf, H., Herbst, M., Martinez, G., Cosh, M. H., et al. (2012). Temporal stability of soil water contents: a review of data and analyses. Vadose Zone J. 11 (4), 280–288. doi:10.2136/vzj2011.0178
Vivoni, E. R., Gebremichael, M., Watts, C. J., Bindlish, R., and Jackson, T. J. (2008). Comparison of ground-based and remotely-sensed surface soil moisture estimates over complex terrain during SMEX04. Remote Sens. Environ. 112 (2), 314–325. doi:10.1016/j.rse.2006.10.028
Wang, X., Fan, J., Xing, Y., Xu, G., Wang, H., Deng, J., et al. (2019). The effects of mulch and nitrogen fertilizer on the soil environment of crop plants. Adv. Agron. 153, 121–173. doi:10.1016/bs.agron.2018.08.003
Wang, B., Xu, G., Li, P., Li, Z., Zhang, Y., Cheng, Y., et al. (2020). Vegetation dynamics and their relationships with climatic factors in the Qinling Mountains of China. Ecol. Indic. 108, 105719. doi:10.1016/j.ecolind.2019.105719
Western, A. W., and Blöschl, G. (1999). On the spatial scaling of soil moisture. J. Hydrol. 217, 203–224. doi:10.1016/S0022-1694(98)00232-7
Williams, C. J., McNamara, J. P., and Chandler, D. G. (2009). Controls on the temporal and spatial variability of soil moisture in a mountainous landscape: the signature of snow and complex terrain. Hydrol. Earth Syst. Sci. 13 (7), 1325–1336. doi:10.5194/hess-13-1325-2009
Xiao, L., Liu, G., Li, P., Li, Q., and Xue, S. (2020). Ecoenzymatic stoichiometry and microbial nutrient limitation during secondary succession of natural grassland on the Loess Plateau, China. Soil Till. Res. 200, 104605. doi:10.1016/j.still.2020.104605
Xu, G., Lu, K., Li, Z., Li, P., Liu, H., Cheng, S., et al. (2015). Temporal stability and periodicity of groundwater electrical conductivity in luohuiqu irrigation district, China. Clean Soil Air Water 43 (7), 995–1001. doi:10.1002/clen.201400488
Xu, G., Li, Z., Li, P., Zhang, T., Chang, E., Wang, F., et al. (2017a). The spatial pattern and temporal stability of the soil water content of sloped forestland on the Loess Plateau, China. Soil Sci. Soc. Am. J. 81 (4), 902–914. doi:10.2136/sssaj2016.10.0331
Xu, G., Zhang, T., Li, Z., Li, P., Cheng, Y., and Cheng, S. (2017b). Temporal and spatial characteristics of soil water content in diverse soil layers on land terraces of the Loess Plateau, China. Catena 158, 20–29. doi:10.1016/j.catena.2017.06.015
Xu, G., Huang, M., Li, P., Li, Z., and Wang, Y. (2021). Effects of land use on spatial and temporal distribution of soil moisture within profiles. Environ. Earth Sci. 80 (4), 128. doi:10.1007/s12665-021-09464-2
Yaseef, N. R., Yakir, D., Rotenberg, E., Schiller, G., and Cohen, S. (2010). Ecohydrology of a semi-arid forest: partitioning among water balance components and its implications for predicted precipitation changes. Ecohydrology 3 (2), 143–154. doi:10.1002/eco.65
Yu, Y., Zhao, W., Martinez-Murillo, J. F., and Pereira, P. (2020). Loess Plateau: from degradation to restoration. Sci. Total Environ. 738, 140206. doi:10.1016/j.scitotenv.2020.140206
Zhang, Y., Li, P., Liu, X., Xiao, L., Shi, P., and Zhao, B. (2019). Effects of farmland conversion on the stoichiometry of carbon, nitrogen, and phosphorus in soil aggregates on the Loess Plateau of China. Geoderma 351, 188–196. doi:10.1016/j.geoderma.2019.05.037
Zhao, Y., Peth, S., Wang, X. Y., Lin, H., and Horn, R. (2010). Controls of surface soil moisture spatial patterns and their temporal stability in a semi-arid steppe. Hydrol. Process. 24, 2507–2519. doi:10.1002/hyp.7665
Zhao, W., Cui, Z., Zhang, J., and Jin, J. (2017). Temporal stability and variability of soil-water content in a gravel-mulched field in northwestern China. J. Hydrol. 552, 249–257. doi:10.1016/j.jhydrol.2017.06.031
Keywords: soil water content, temporal stability, influencing factors, representative location, season, spatial distribution pattern, soil particle size
Citation: Xu M, Xu G, Cheng Y, Min Z, Li P, Zhao B, Shi P and Xiao L (2021) Soil Moisture Estimation and Its Influencing Factors Based on Temporal Stability on a Semiarid Sloped Forestland. Front. Earth Sci. 9:629826. doi: 10.3389/feart.2021.629826
Received: 16 November 2020; Accepted: 20 January 2021;
Published: 11 March 2021.
Edited by:
Ataollah Kavian, Sari Agricultural Sciences and Natural Resources University, IranReviewed by:
Abdolreza Bahremand, Gorgan University of Agricultural Sciences and Natural Resources, IranMaría J. Polo, University of Cordoba, Spain
Copyright © 2021 Xu, Xu, Cheng, Min, Li, Zhao, Shi and Xiao. This is an open-access article distributed under the terms of the Creative Commons Attribution License (CC BY). The use, distribution or reproduction in other forums is permitted, provided the original author(s) and the copyright owner(s) are credited and that the original publication in this journal is cited, in accordance with accepted academic practice. No use, distribution or reproduction is permitted which does not comply with these terms.
*Correspondence: Guoce Xu, eHVndW9jZV94QDE2My5jb20=; Yuting Cheng, Y2hlbmd5dXRpbmdzdGFyQDE2My5jb20=