 Vera Pessina
 Fabrizio Meroni1
 Raffaele Azzaro
- 1Istituto Nazionale di Geofisica e Vulcanologia (INGV), Milan, Italy
- 2Istituto Nazionale di Geofisica e Vulcanologia (INGV), Catania, Italy
An application for a quick earthquake damage scenario assessment is here presented as a potential tool for planning prevention actions or managing seismic emergencies in the volcanic region of Mt. Etna (Italy). As case-study, we considered the December 26, 2018 earthquake that, with a magnitude MW 4.9, represents the largest event occurring in the area during the last 70 years. The QUEST working group (the INGV macroseismic team) carried out a detailed survey in the damage area, collecting data on the number of buildings in the different vulnerability classes and related damage, with the aim to assign intensity. The maximum intensity reached degree VIII EMS along a narrow strip extending for 5 km astride the Fiandaca fault. In this paper, we simulated the damage scenario in the most struck municipalities of the epicentral area by testing different methodological approaches proposed in the literature using the information of the ISTAT census data collected by the Italian Institute of Statistics. We evaluated the damage level of the residential buildings and we validated the results comparing with the real damage data recognized in the field. Our analysis highlighted the difficulty of applying methods calibrated for larger earthquakes in tectonic domains, to small magnitude events in volcanic zones, where some operating assumptions must be introduced. Despite this, the results confirm the potential of the simulations based on statistical damage assessment methods also in these peculiar conditions, opening the way to finalized plans of pre- and post-earthquake interventions.
Introduction
Risk scenarios in volcanic areas are mostly referring to damage or disruption caused by lava flows, tephra fallout, or pyroclastic flows, i.e., in general to the eruption effects. This despite damage caused by volcano seismicity, whether or not related to an eruption, is a critical issue in these areas and often represents an under-studied aspect of the risk. In Italy, the analyses carried out at Vesuvius and Campi Flegrei are an example of the proper way to face the problem (Working Group, 2013) and are at the basis of the emergency plans issued by the Italian Department of Civil Protection for the Neapolitan volcanic district. In the study by Zuccaro and De Gregorio (2019), for instance, the damage expected from pre-eruptive seismic activity is evaluated with a uniform seismic input on the whole area, but not considering the characteristics of the attenuation of ground shaking in a volcanic area. Luckily, the occurrence of strong volcano-tectonic earthquakes in the Neapolitan volcanic district is quite rare, and almost limited to the island of Ischia (De Natale et al., 2019; Selva et al., 2019). The situation is different at Mt. Etna, the largest active volcano in Europe, where the contribution of volcano-tectonic seismicity plays a more important role and significantly enhances the level of risk, since the earthquakes are frequent and often produce heavy damage (Azzaro et al., 2016).
Here, earthquake damage scenarios have been developed in the framework of the recent EU projects UPStrat-MAFA (Sigbjörnsson et al., 2016) and KnowRISK1. In these analyses, both the building vulnerability and the impact on network systems have been also considered (D’Amico et al., 2016; Meroni et al., 2016).
While the estimation of damage to residential buildings is a consolidated practice for “tectonic” earthquakes, its application on volcanoes requires ad-hoc approaches taking into account the characteristics of local seismicity, such as the small-moderate magnitude (Mmax ∼5.3), the shallow depth of sources (<3 km), the high values of peak ground motion (PGM) parameters and the low-frequency content in the near field, and the strong attenuation of intensity in very short distances (Azzaro et al., 2006, 2017; Langer et al., 2016; Iervolino, 2018; Tusa et al., 2020). The main feature of the earthquake seismic scenarios at Etna is that the involved areas are relatively small (∼30 km2) and characterized by a large variability of effects in a few kilometers (QUEST Working Group, 2019).
The problem is complicated by the fact that, for very shallow earthquakes, the geometrical spreading of the seismic intensity reflects the geometry of a linear source, i.e., the shape of the shaking area around the causative fault is elongated and not circular (Azzaro et al., 2013). Considering the anisotropic attenuation in earthquake scenarios, as illustrated below, introduces operative problems due to the wide variability of the shaking values also inside the same municipality, difficult to tackle for the statistical significance of vulnerability building data in an inhabited area. In general, data on residential buildings are indeed provided at a municipal scale, unless particular cases where strategical buildings (hospitals, fire stations, schools, etc.) are individually considered. The ISTAT National census collects data on dwellings or building every 10 years and releases them in an aggregated form for each municipality. The accuracy level of census data is an important aspect to obtain reliable earthquake scenarios.
In this paper we discuss some critical points about the damage models in the literature, in the light of the recent analyses for seismic risk at a national scale (Dolce et al., 2020). Notwithstanding damage estimation models have recently been harmonized (i.e., Lagomarsino et al., 2019; Zuccaro et al., 2020) to be integrated into the same platform (IRMA—Italian Risk Map, Dolce et al., 2020) and to obtain a comparison of results, in the present work, we use three damage models in their original form, based on macroseismic intensity as a input parameter and respecting the philosophy on which the models were created and validated. In this way we avoid resorting to intensity vs. acceleration conversion laws that are affected by significant uncertainties, and considering local amplification effects (where present), already included in the macroseismic parameter. The calibration of damage models on a local scale, as in the case of Mt. Etna, is a crucial point, characterized by the extremely rapid attenuation of intensity, and hence damage effects. An advantage in using macroseismic models is the immediate validation of the results with the data collected directly in terms of intensity.
Finally, the application to December 26, 2018, MW 4.9 Fleri earthquake, the strongest event recorded in the last 70 years at Mt. Etna, allows verifying how damage models set for different seismotectonic contexts may depict the damage level caused by a volcanic earthquakes. To this end, the validation process is based on real damage data collected in a detailed macroseismic survey throughout the damage area (Azzaro et al., 2020).
The December 26, 2018 Earthquake: Observed and Simulated Intensity Scenarios
Macroseismic Survey and Intensity Data
Two days after the intense seismic swarm accompanying the December 24, 2018 eruption on the summit area of Mt. Etna (Alparone et al., 2020), a strong earthquake (ML 4.8, MW 4.9) hit, at 02:19 UTC, the lower southeastern flank of the volcano. Due to an extremely shallow hypocenter, located at a depth of ca. 1 km b.s.l., the event produced heavy damage in the area between the towns of Acireale and Zafferana (Figure 1), with more than 1,100 homeless, but luckily without causing victims (QUEST Working Group, 2019). As many other shallow shocks at Etna, the earthquake was accompanied by remarkable effects of surface faulting along the Fiandaca fault, the southernmost structure of the Timpe tectonic system (Civico et al., 2019; Cucci et al., 2019).
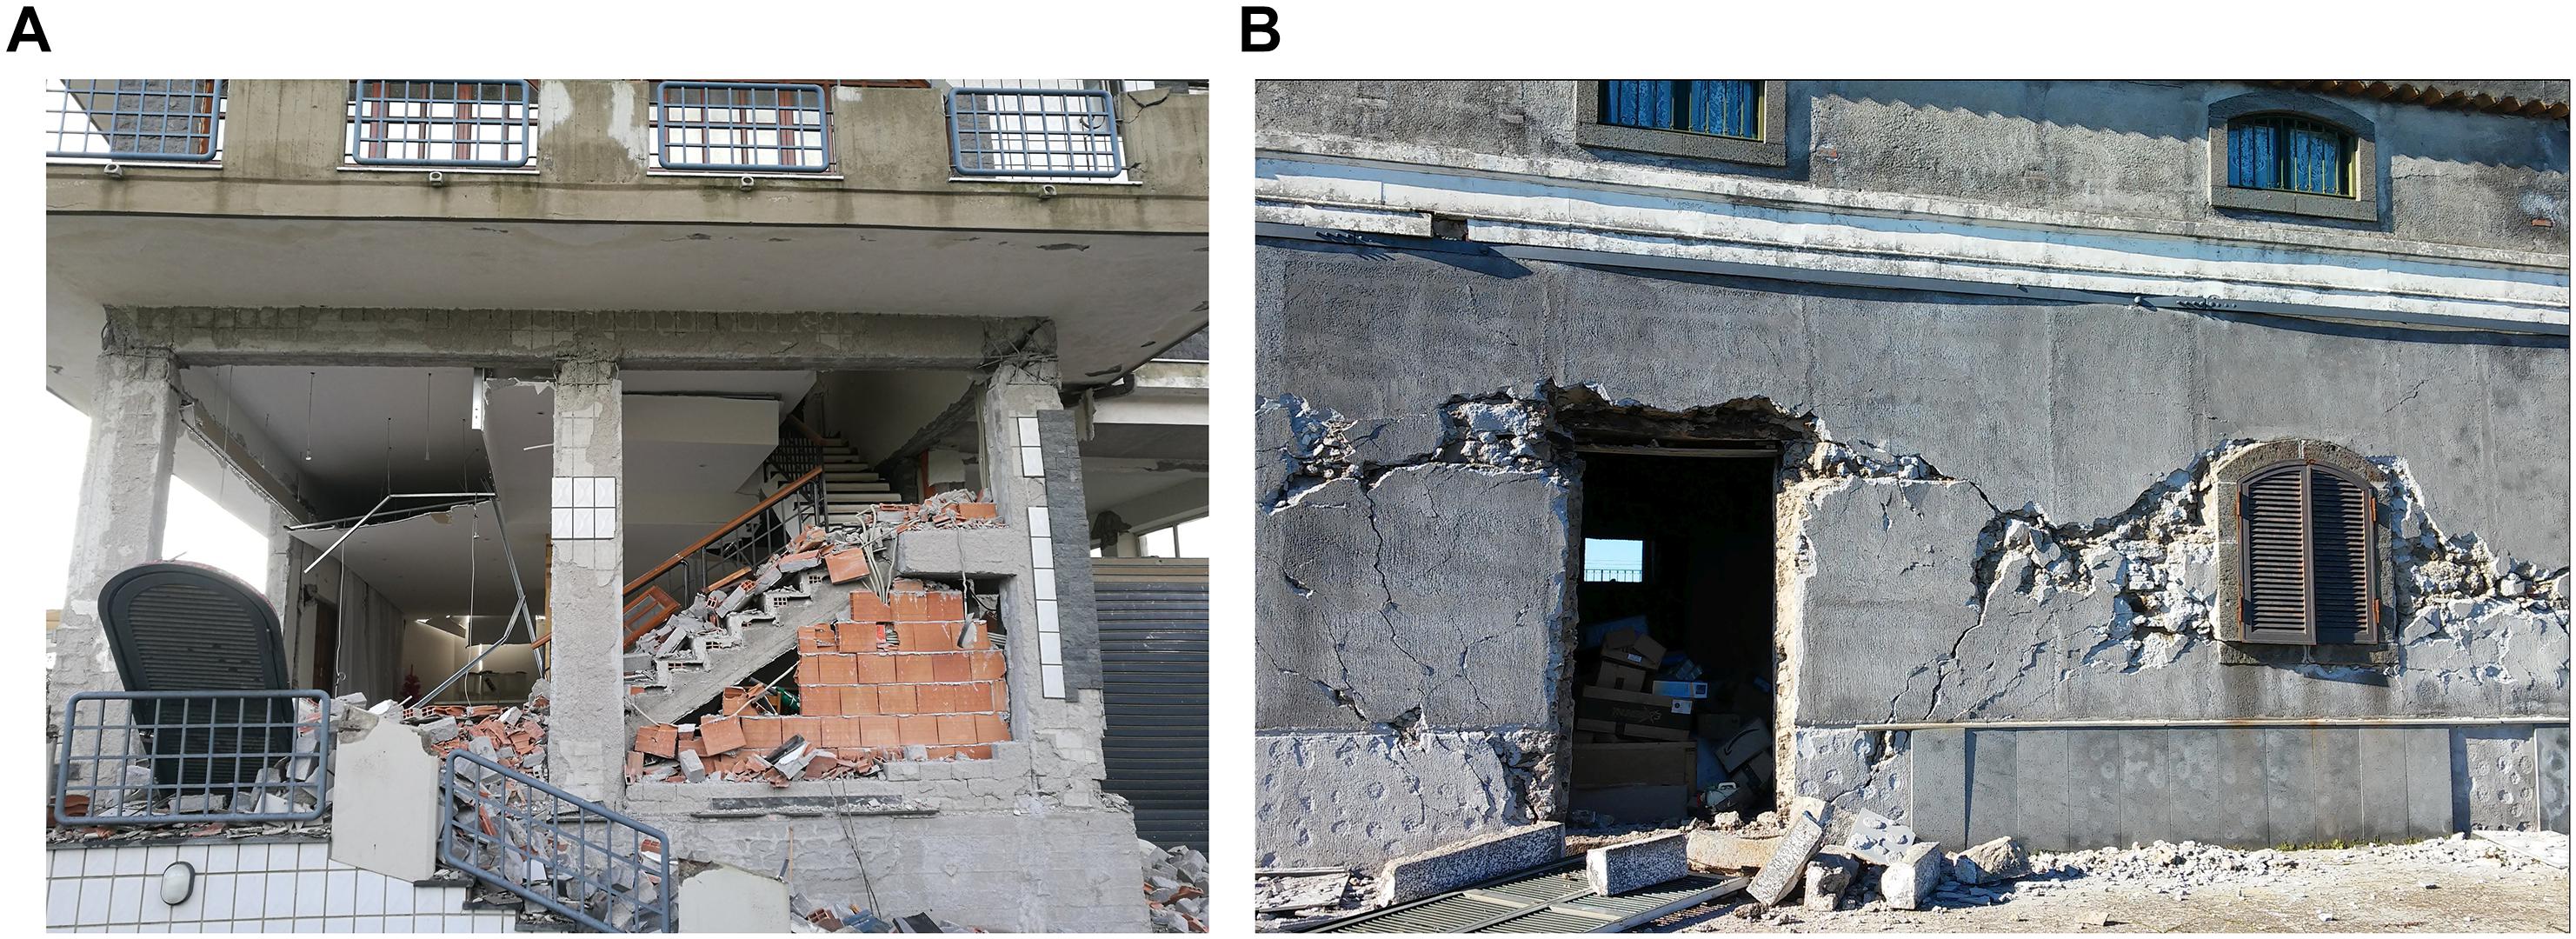
Figure 1. (A) Damage to reinforced concrete building at Mazzasette (I = 8 EMS) and (B) to masonry edifice at Testa di Vipera (I = 7–8 EMS).
The severity of the effects prompted the QUEST Working Group—the INGV team devoted to the macroseismic survey—to undertake a detailed inspection in the localities of the epicentral area with the aim to assess intensity according to the European Macroseismic Scale EMS (Grünthal, 1998). Since the dense urbanization of the area and the rapid attenuation of seismic intensity moving out from the epicentral area, the survey was carried out, in some key zones, building by building in order to consider properly the variability of effects as well as the building vulnerability and the associated damage. As a result, an intensity map of 44 localities was produced by Azzaro et al. (2020), 24 of them reporting damage. Briefly, the intensity in the epicentral area reached degree 8 EMS—the most damaged zone is between the villages of Fleri and Pennisi along the Fiandaca fault—but the intensity distribution is strongly anisotropic, with a preferential propagation along the strike of the causative fault and a very strong attenuation in the orthogonal direction (Figure 2).
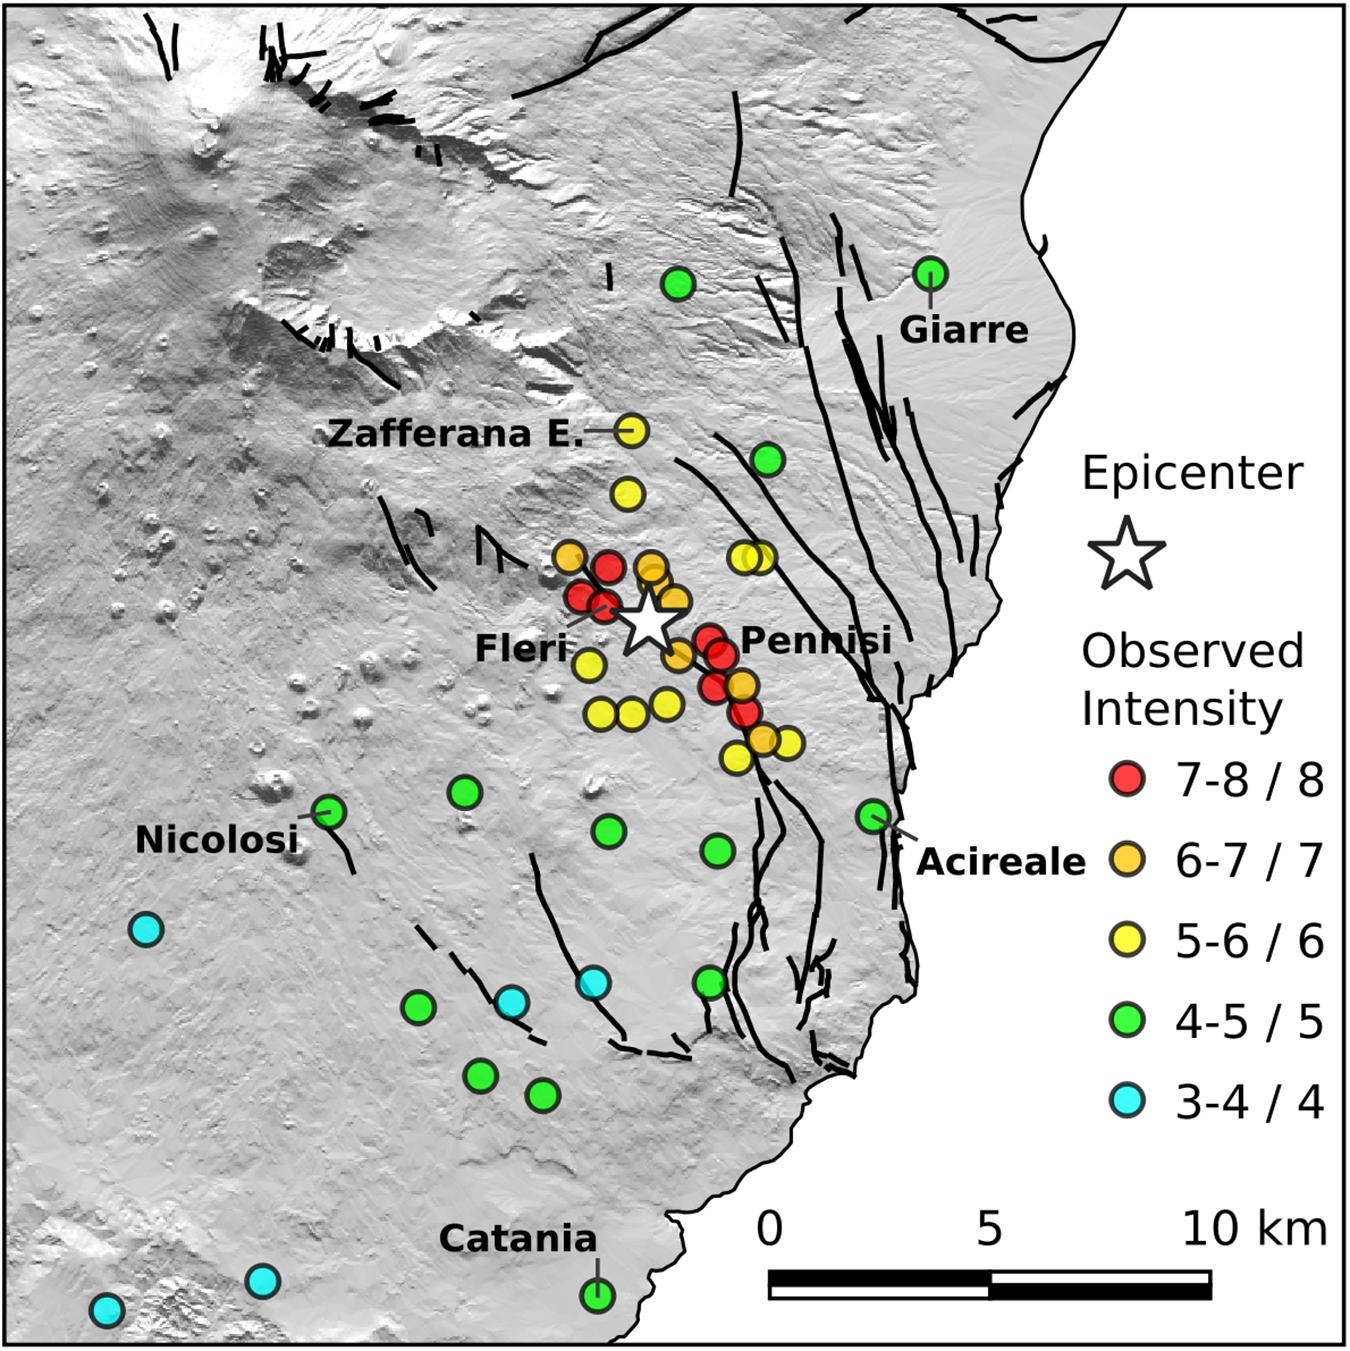
Figure 2. Observed intensity of the December 26, 2018 earthquake (data from Azzaro et al., 2020).
In the following, we refer to this data for the analysis of the damage scenario produced by the 2018 earthquake, basing particularly on the detailed forms compiled for surveyed localities.
Modeling Intensity Scenarios
As a first step for calibrating the damage scenarios, we simulated the intensity distribution of the December 26, 2018 earthquake by using a probabilistic approach based on the Bayesian statistics (Rotondi and Zonno, 2004). Briefly, the method calculates the decay of the macroseismic intensity conditioned on the epicentral intensity I0 of the earthquake and the epicenter-site distance; as a result, it provides the probabilistic distribution of the intensity expected (Iexp) at a given site (Zonno et al., 2009). The intensity to be assumed as a reference value is given by the mode (the most frequent value) of the smoothed binomial distribution, whereas the uncertainty can be calculated by setting other probability thresholds (50, 75%, etc.). Being a probabilistic estimation, it does not need applying other methods to calculate uncertainties, as for example a Monte Carlo approach.
The above procedure has been adapted to the Etna area by Azzaro et al. (2013) in order to take into account the particular features of attenuation of the volcano-tectonic earthquakes. For example, it is possible to consider both isotropic and anisotropic attenuation models, useful to represent point or linear sources, respectively.
The evident asymmetry in the distribution of the observed intensities (Figure 2) suggested us using the anisotropic attenuation model, in which the preferential direction of propagation of the seismic energy (i.e., minimum attenuation) corresponds to the causative fault, while the maximum attenuation is orthogonal. The decay of intensity along these two trends produces significant differences in terms of calculated intensities, reaching two intensity degrees at equal distances from the epicenter.
Concerning the fault model adopted for the simulation, we considered a linear source with a length of 4.5 km, that corresponds to the NW-SE trending segment of the Fiandaca fault (Civico et al., 2019) hosting the instrumental epicenter and the maximum intensity area (I = 8 EMS); the dip of the fault plane is considered vertical.
In Figure 3A the intensity scenario is represented on a grid with a resolution of 0.0025° (ca. 250 m), where the values of expected intensity Iexp represent the mode of the smoothed binomial distribution. To account for the uncertainty affecting the modeled scenario, we also calculated the intensities expected at probability 25, 50, and 75% (Iref25, Iref50, and Iref75, respectively). Iref25 overestimates compared to Iexp by 1.5, while Iref50 and Iref75 overestimates and underestimate by 0.5, respectively. The mode, on average, corresponds to the value of 65 ± 8% of the probability, a percentage in which the uncertainties are confined between –0.5 and + 0.5 of intensity (values commonly used in EMS to indicate, for example, intensity as “6–7,” where the data can be interpreted in the same way as “6” or “7”).
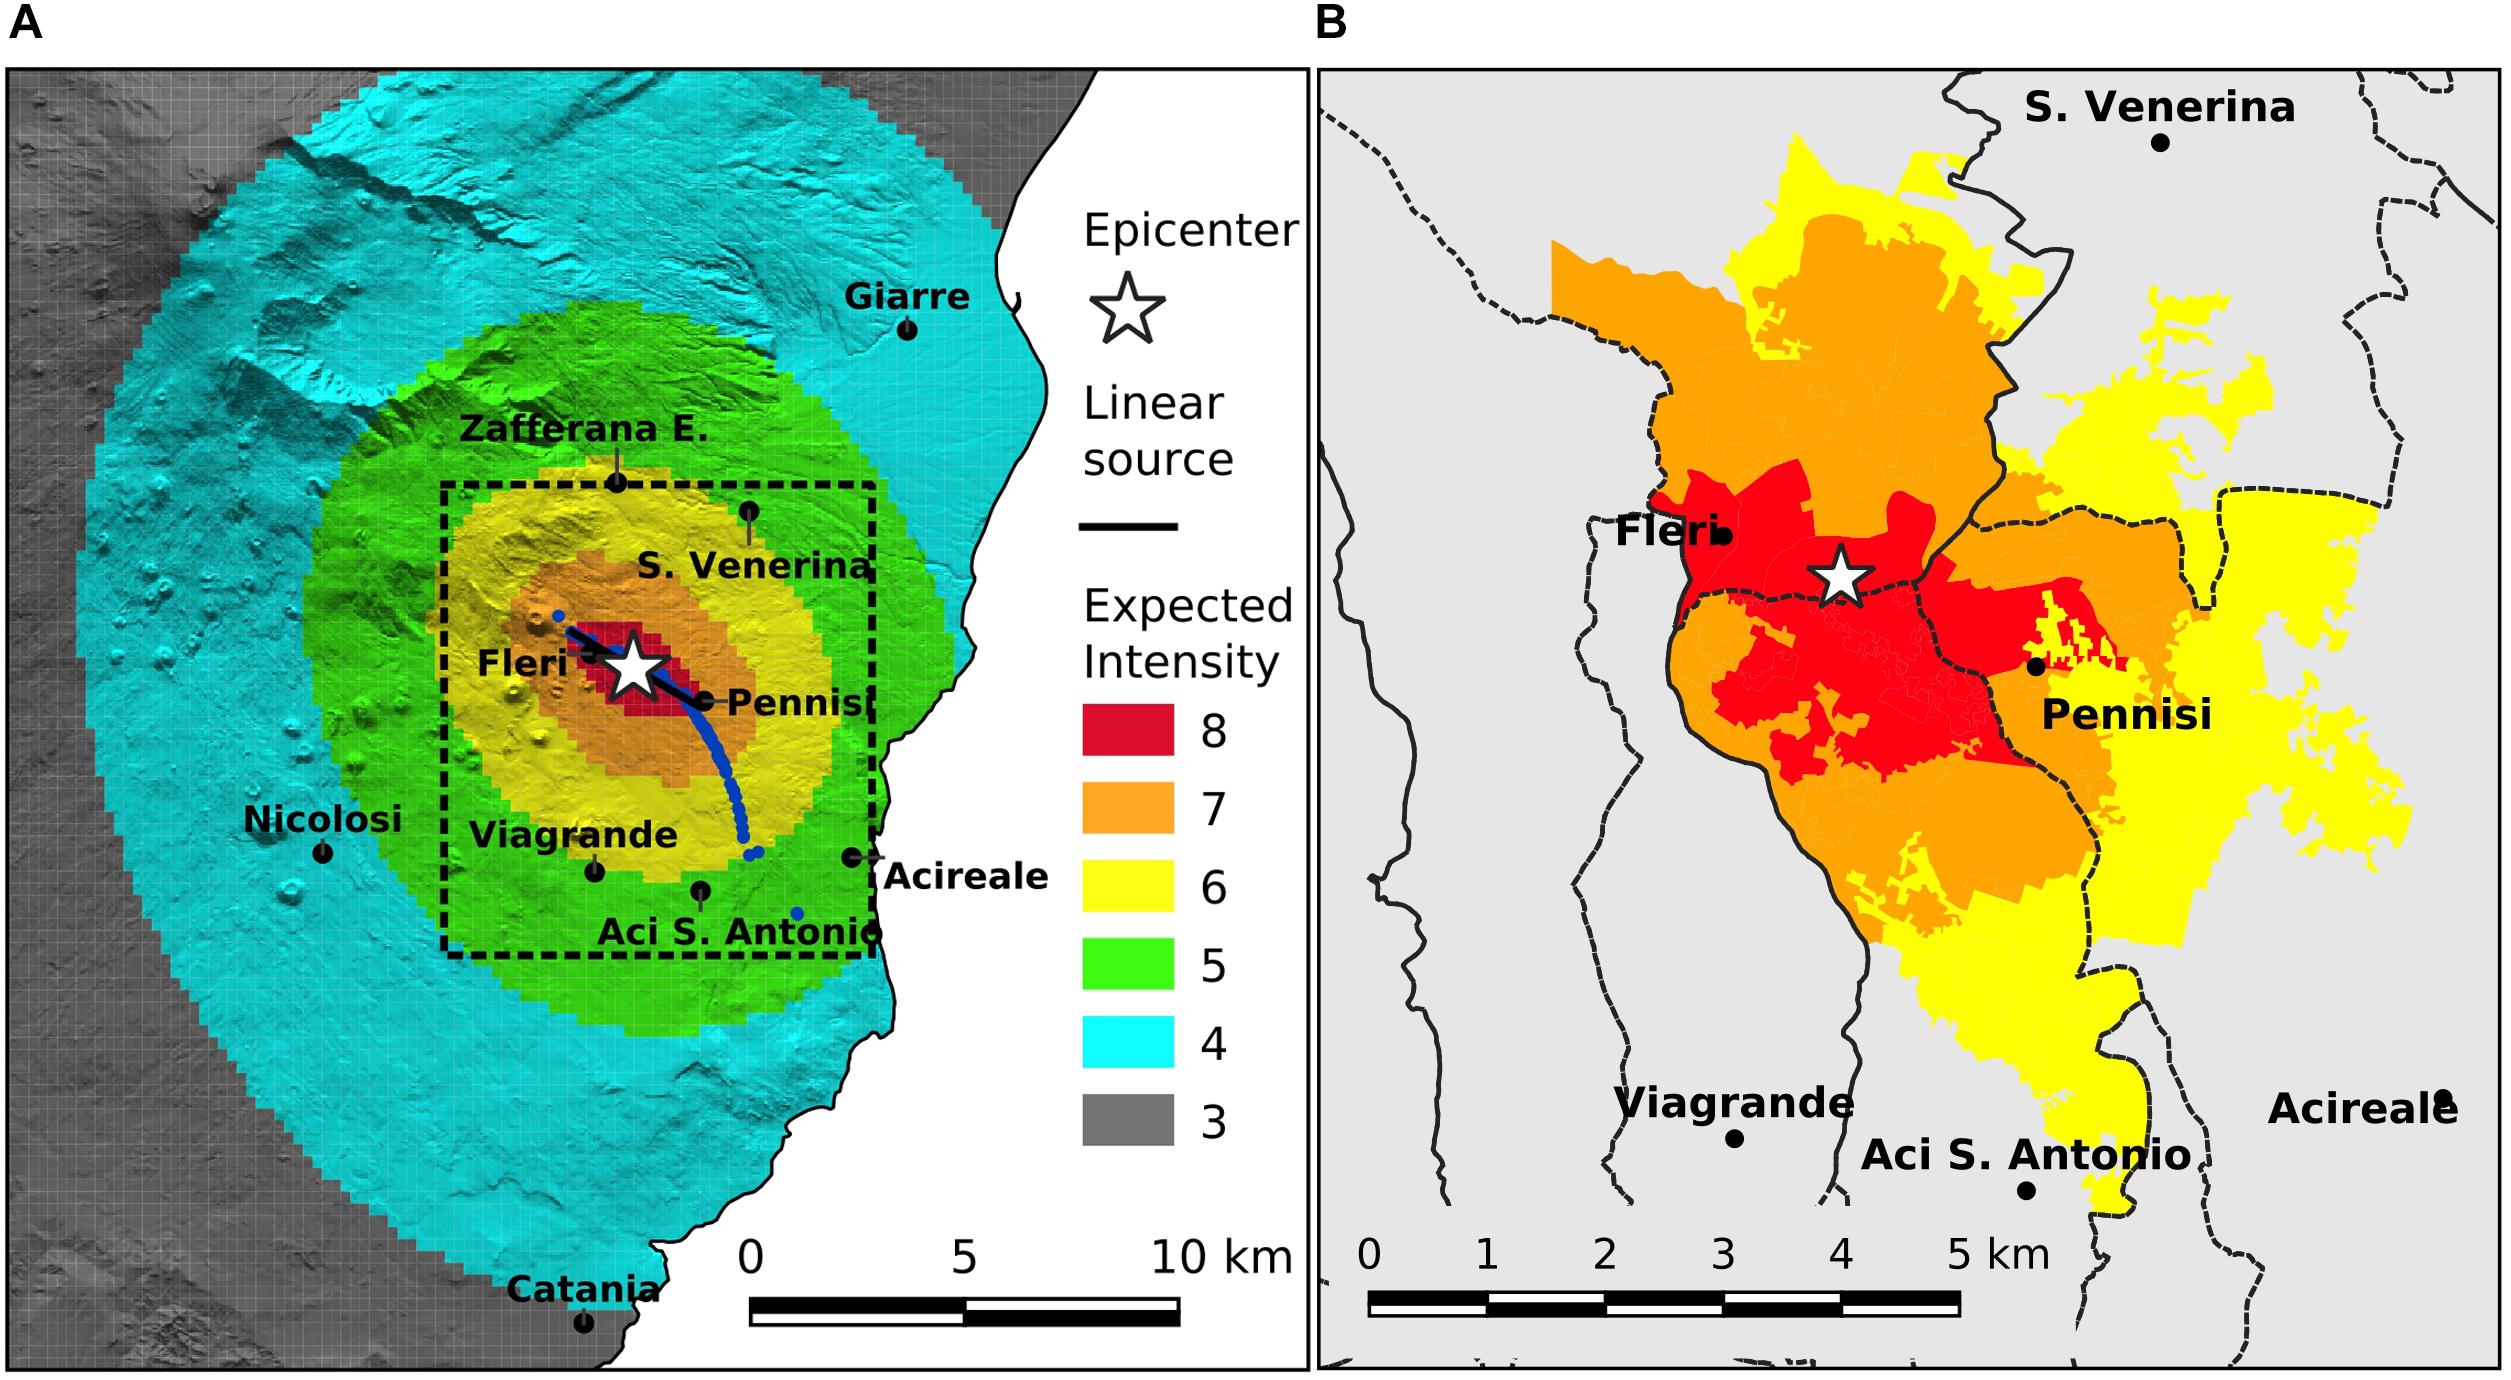
Figure 3. (A) Seismic scenario of the December 26, 2018 earthquake. Dotted box represents the study area. (B) Detail of the same scenario applied at the urban scale of the census sections defined by ISTAT.
In order to estimate the overall reliability of this synthetic scenario, we used the deterministic criterion of validation of the absolute discrepancy diff to compare observed (I) and the calculated (Iexp) intensities at a site:
where N is the number of sites. For the whole scenario the result is 0.825, while for the study area (dashed box in Figure 3A) the value is 0.455, i.e., the difference between I and Iexp is comparable to the uncertainty often associated with the intensity estimate.
Given the aims of this study and the applications based on the ISTAT census data, we finally plotted the same scenario at an urban scale referring the expected intensities to the census sections (a subdivision of the municipality) considered in the following chapters. In Figure 3B, Iexp was calculated at the centroid of each polygon representing the sections. This approach reduces the resolution of the scenario, so that the extension of the areas characterized by a given value of Iexp is a bit different from the ones calculated in Figure 3A. Anyway, the result is sufficiently good, with a diff value between synthetic intensities obtained in the centroid of the sections with the observed intensities located inside a polygon, equal to 0.525.
The ISTAT Data
To assess the building vulnerability at an urban scale, we use the information for residential housing provided by the ISTAT census data, homogeneously collected every 10 years on the entire national territory. These data allow a reliable estimate of the total number of buildings and their corresponding volume. The number of buildings is published directly by ISTAT (2011), for each municipality and for each census section. On the contrary, in 1991, the number of buildings for the census section has to be inferred from the number of dwellings, using the average value of the item “No. of Dwellings per Building” associated with each record.
Edifices are described by multiple characteristics: structural typology, date of construction (or renovation), number of floors, position in the block, state of repair and quality of maintenance (Table 1). The last parameter is deduced indirectly from other ISTAT data such as the presence of efficient systems and the characteristics of installations2. This data allows a vulnerability classification of buildings when there is no other information collected specifically for the same purpose.
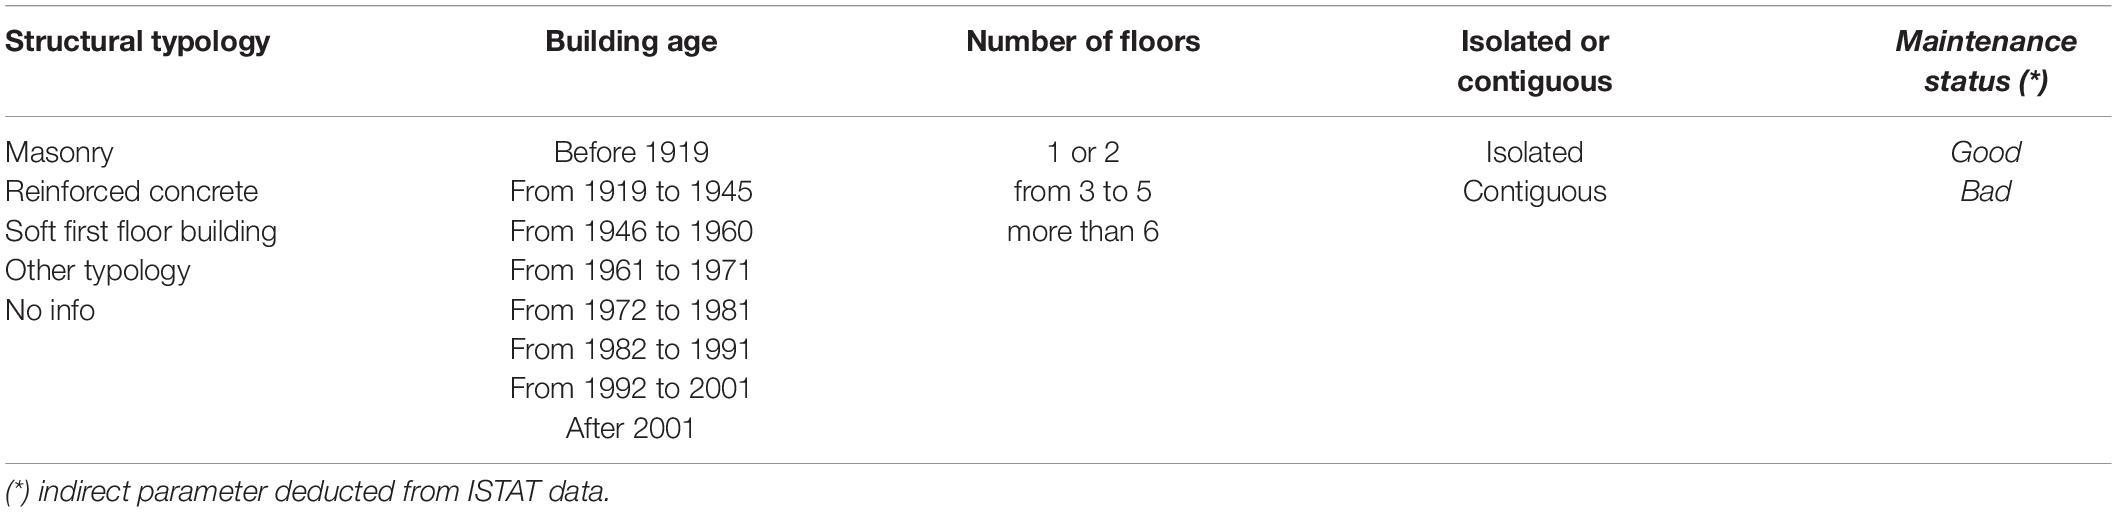
Table 1. Typological parameters of the buildings, according to ISTAT census data.
Until the 1991 census, the ISTAT data on residential buildings were provided at the resolution of census section in a disaggregated way, being so possible to correlate the relevant information (as for instance in Meroni et al., 2000).
From the 2001 census onwards, due to the introduction of more restrictive privacy rules, the ISTAT census information provides aggregated values only, reducing the vulnerability assessment to a rough estimation. There are no more disaggregated information at a census section scale neither at a municipal level, and few typological features on age, materials, and the other factors are available in a disaggregated form solely at a provincial level; in practice, they are not usable for detailed vulnerability analyses (Crowley et al., 2009).
Notwithstanding the most recent dataset (ISTAT, 2011) do not provides information suitable for setting the vulnerability model at a local scale, it well describe the recent urban development. Indeed, there are areas in the country with a scarce building development or even affected by the depopulation, for instance rural districts or mountain villages (e.g., in the Apennines). In these cases, data from the 1991 ISTAT census can still be considered representative. On the contrary, other areas of Italy are characterized by a considerable urban growth occurred in the last years, as in the case of the study area. The examined municipalities recorded a significant demographic growth (Figure 4) ranging from 11.4% in Acireale to 43.3% in Viagrande, resulting in a substantial increase in the number of buildings of approximately + 32% from 1991 up to 2011. Moreover, as often happens in case of a rapid urban development, the vulnerability level of the recent buildings is difficult to characterize because of the need to know the age of the buildings (i.e., year of construction) to be referred with the relevant technical rules.
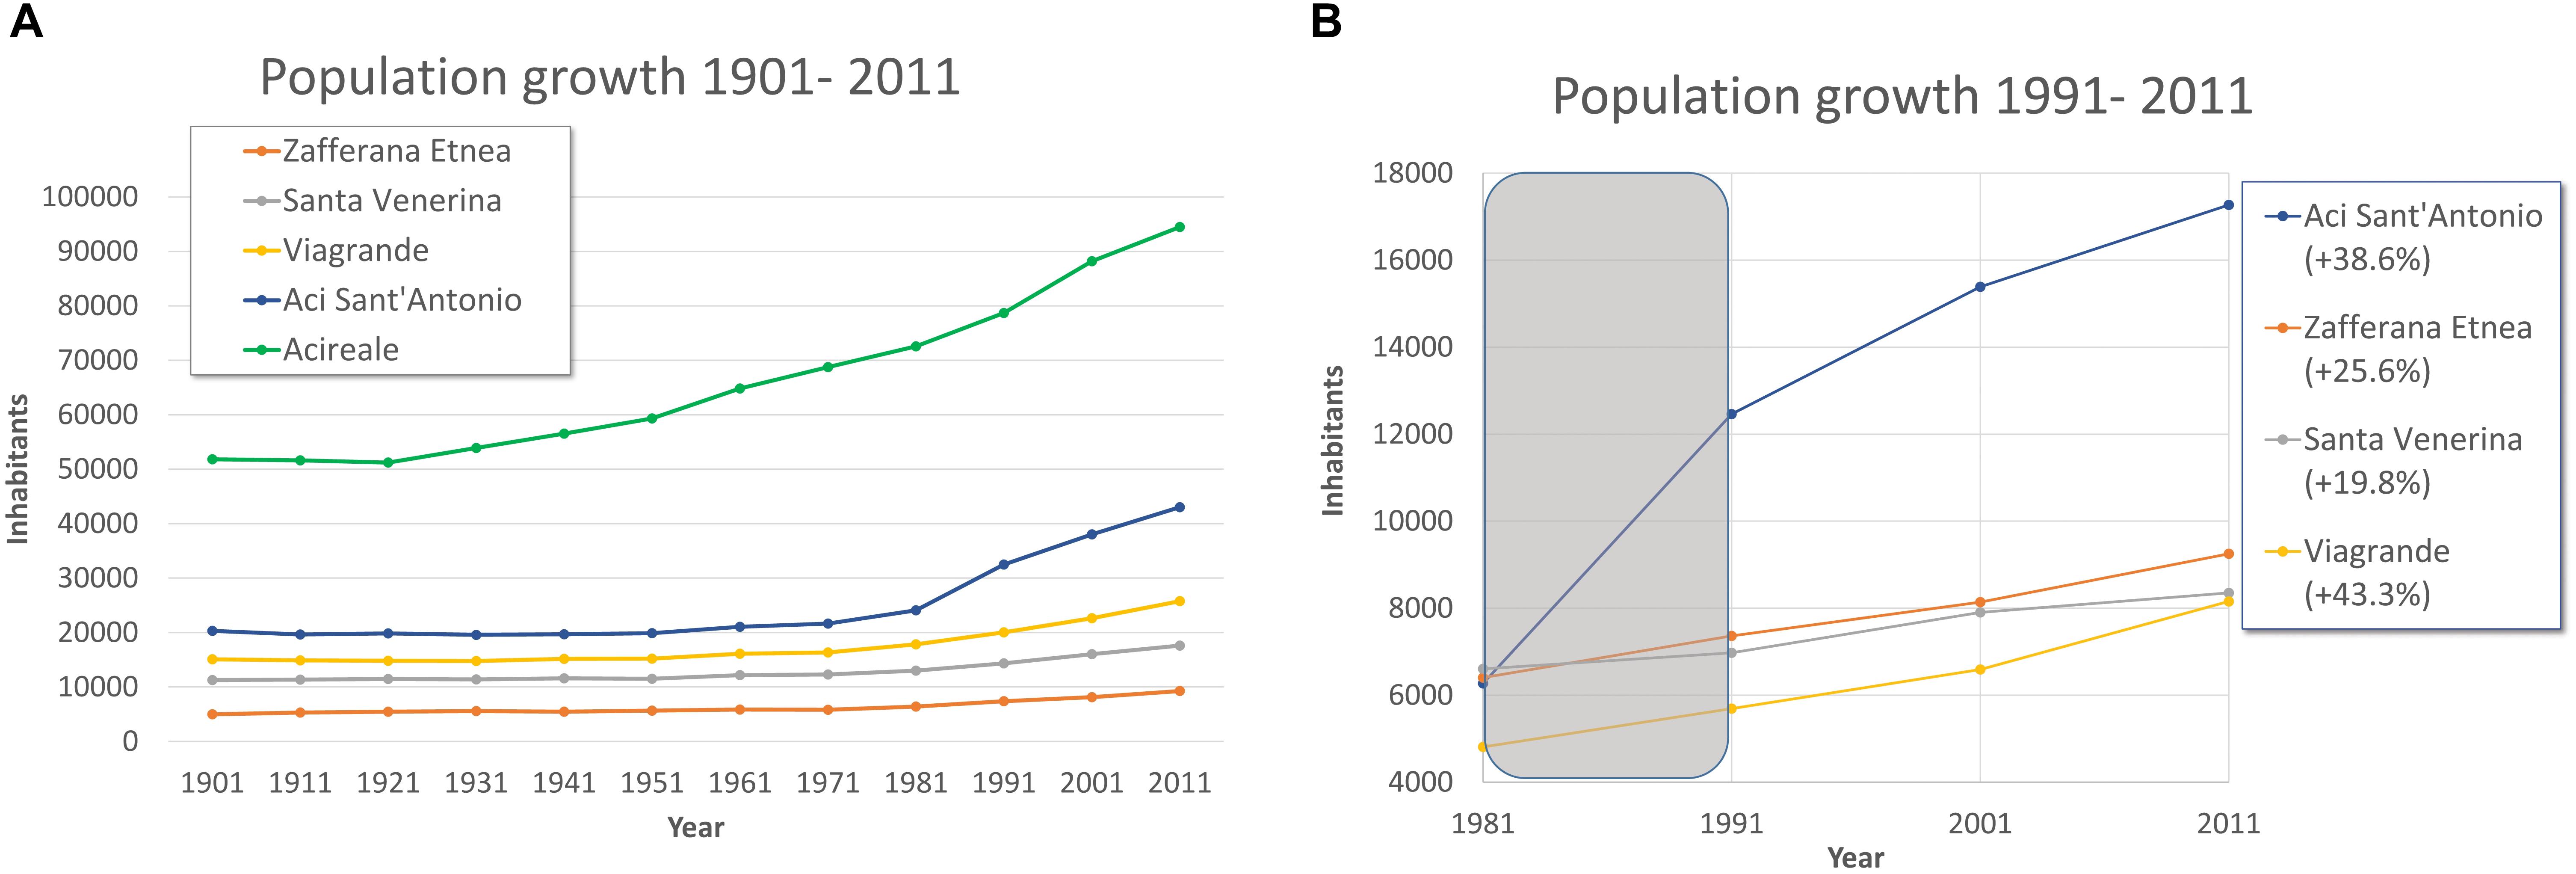
Figure 4. Demographic trend in the municipalities: (A) from 1901, (B) in the last 20 years, population growth varies between +11.4% in Acireale and +43.3% at Viagrande.
The characterization at a municipal scale of buildings of the last 30 years is therefore a critical step in our analysis. For this reason, different methods for estimating vulnerability are examined in the following.
Vulnerability and Damage Assessment Methods
From the methodological point of view, there is in Italy (but also in Europe) a tradition dating back 1980’s of studies correlating damage to buildings vs. macroseismic intensity, based on data collected after strong earthquakes. This led structural engineers to derive robust fragility curves or vulnerability functions to be used for estimating local scenarios. Since then, this approach has been continuously improved both in the method and in the input data for calibration (e.g., Spence and Le Brun, 2006), with the increasing use of census data capable of providing better estimations. Several examples are represented by applications in European Risk projects such as in Spain, Portugal, France, Greece, Romania, Turkey, etc. (Lantada et al., 2010; Riedel et al., 2015; Kassaras et al., 2018; Mosoarca et al., 2019).
In general, the scarcity of instrumental ground motion data at a local scale as well as uncertainties associated with GMPEs, explains why in Italy/Europe the use of macroseismic intensity data is normally used for damage scenarios at an urban scale.
Among the methods available in the literature, we adopt the Bernardini et al. (2008, hereinafter M_1) and Giovinazzi and Lagomarsino (2001, hereinafter M_2) which allow to consider the whole information contained in the 1991 ISTAT census by providing a very detailed and precise vulnerability classification of both masonry and reinforced concrete buildings. Indeed, the accuracy of the input data makes the difference with the numerous methods able to group the buildings into vulnerability classes (Kassem et al., 2020). Even though the input data is very accurate, these methods cannot still provide information about the edifices of the last 20 years and need to be integrated (Figure 5).
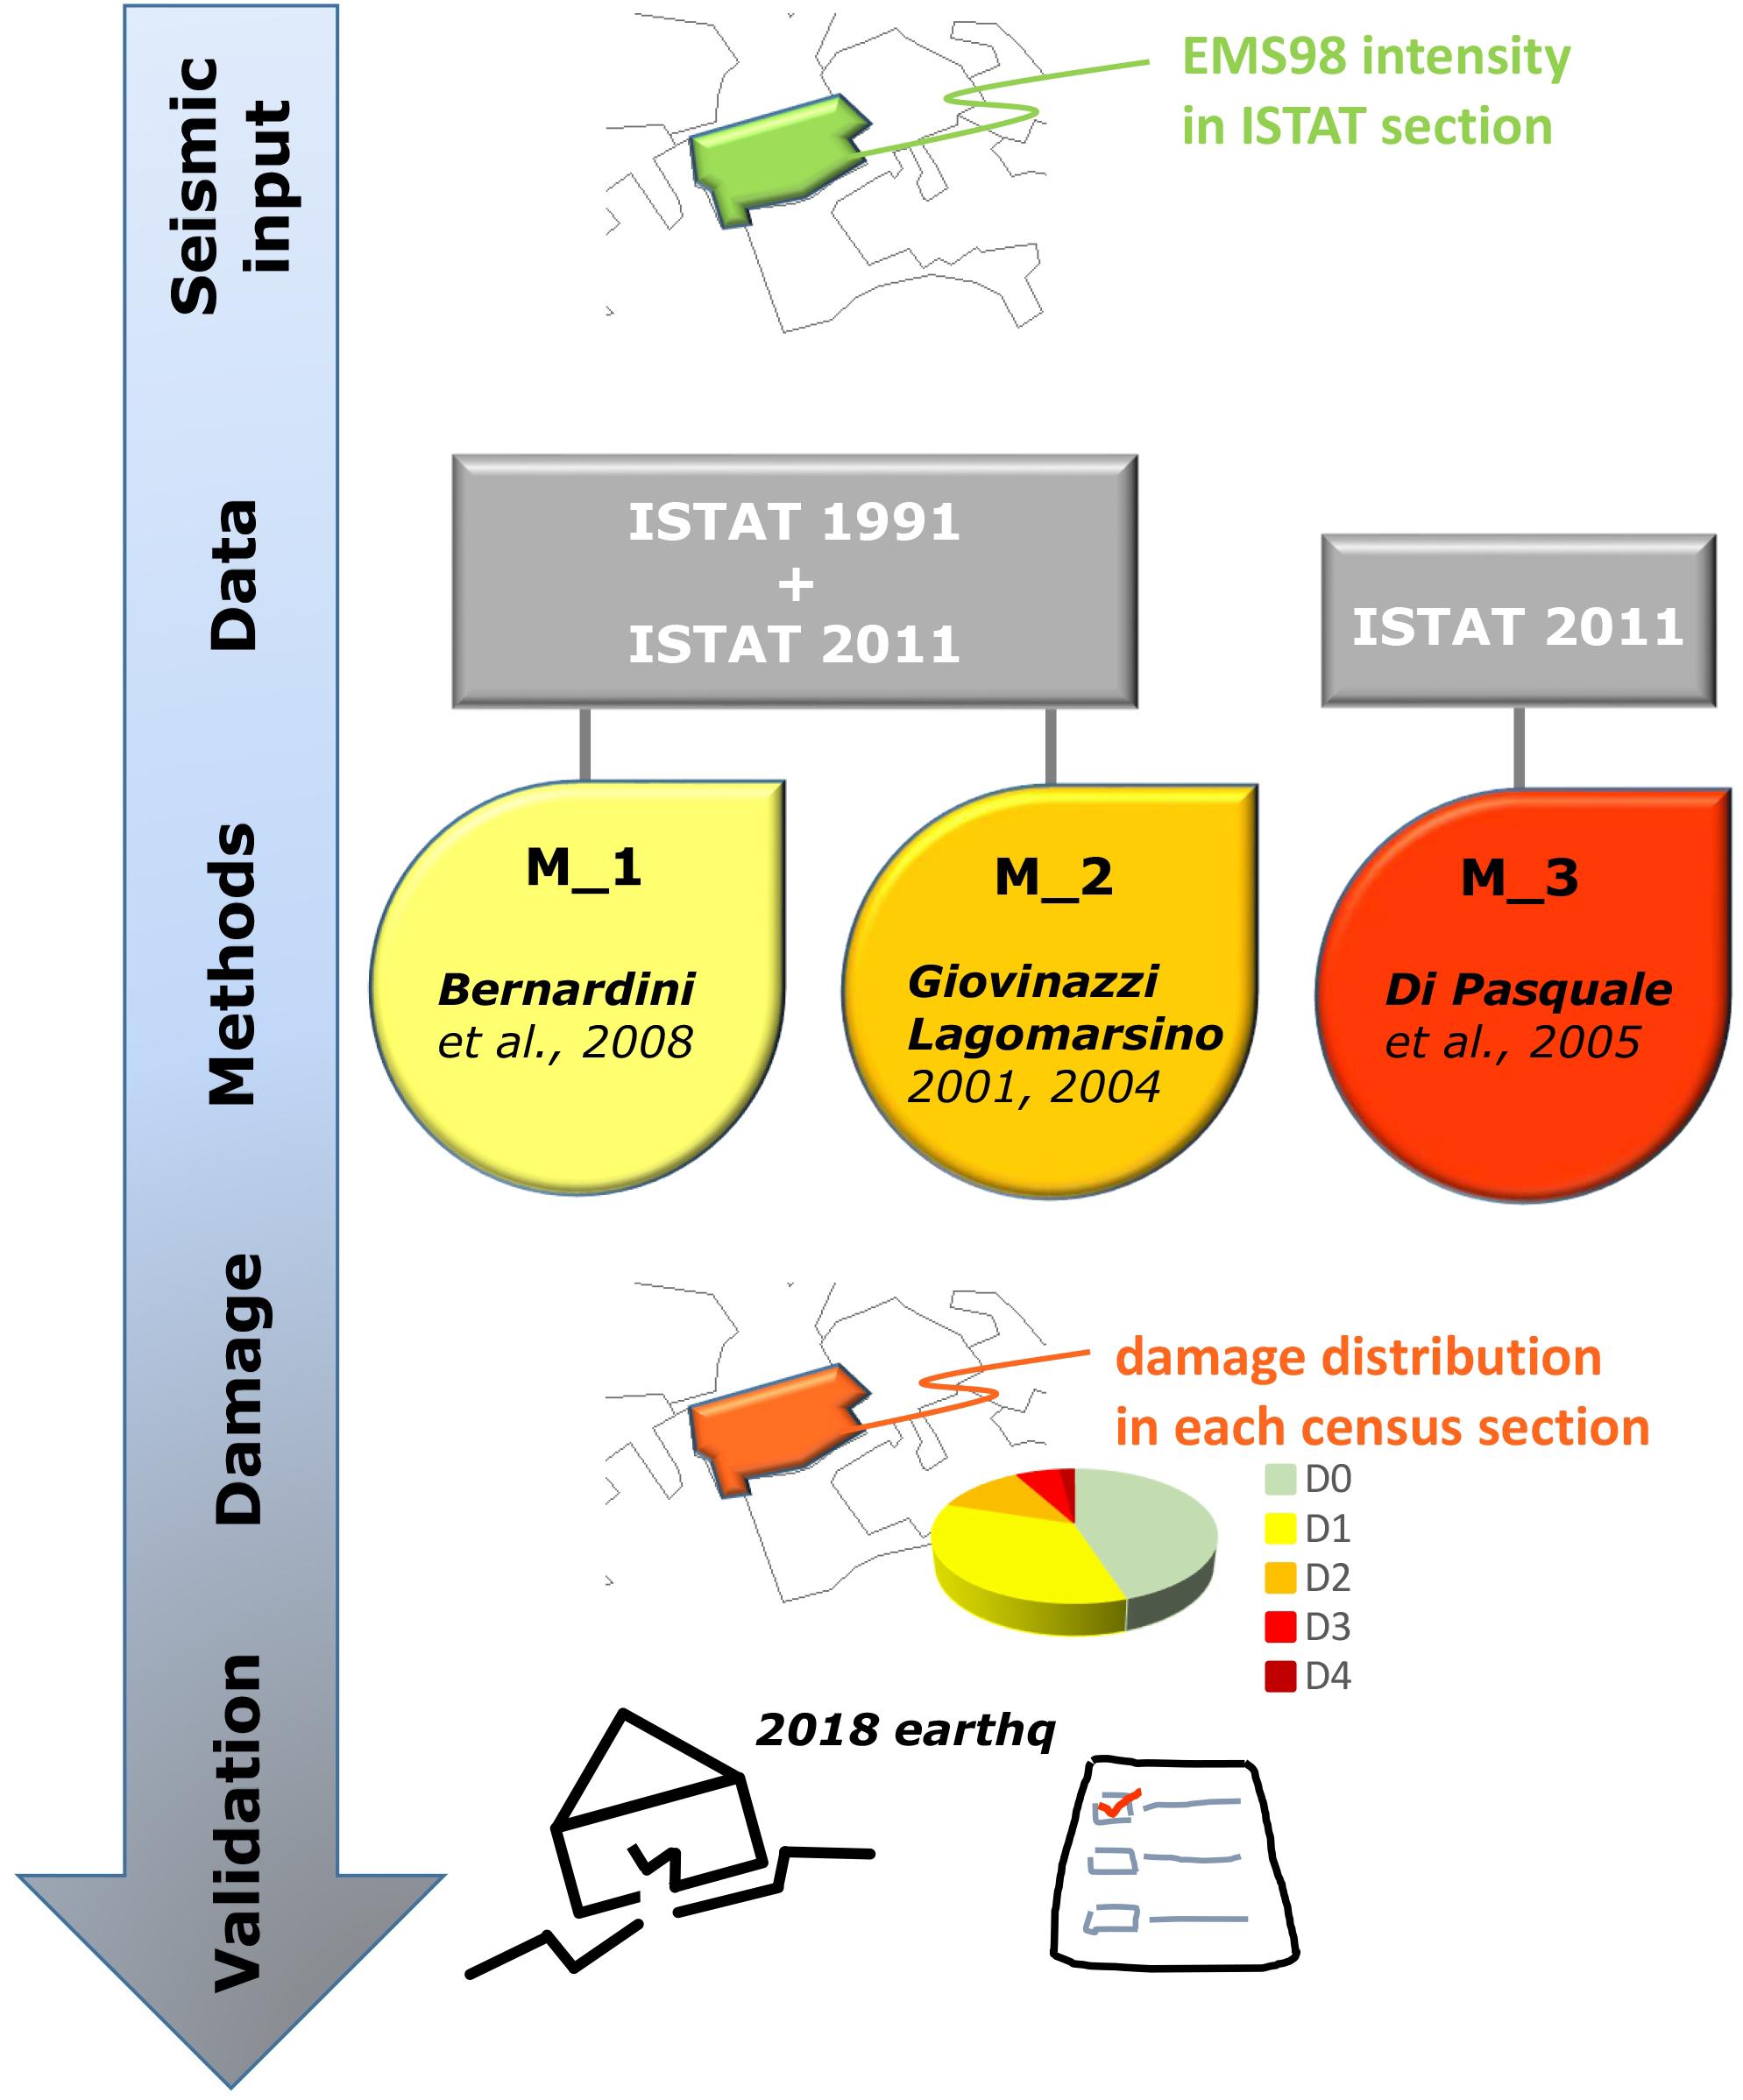
Figure 5. Conceptual scheme of the procedure for damage scenario assessment by using census data on the building stocks.
Another method proposed by Di Pasquale et al. (2005, M_3) is directly applicable to the most recent ISTAT data (2011 census). This empirical approach is based on the relationships between structural types and age classes of the buildings and was widely tested by the technicians of the Department of Civil Protection (Di Pasquale et al., 2005).
For M_1 and M_2 methods, in order to characterize the vulnerability of the edifices built after 1991, we considered the 2011 ISTAT data, available as disaggregated variables at a provincial level only, by adapting them to the municipal scale. Naming ΔP the number of buildings in the 1991–2011 period at provincial level and ΔM the same number for each municipality here considered—Zafferana Etnea, Santa Venerina, Acireale, Aci Sant’Antonio, Viagrande—we calculated the vulnerability distribution of ΔP, and added the normalized (ΔP/ΔM) values to the vulnerability distribution of each municipality, previously calculated on the 1991 ISTAT data. We assumed that the recent constructions over the last 20 years ΔP follow the vulnerability distribution assessed at the province level. More details on this method can be found in the application to the 2012 Emilia-Romagna earthquake (Meroni et al., 2017).
With the exception of method M_3, these two methods also consider the year of seismic classification, after which the adoption of more restrictive seismic standards is conceivable. They include an additional parameter, namely the date of seismic classification of the territory, which defines a lower vulnerability for the buildings constructed with earthquake resistant design. Although the study-area was classified since 1914, with a revision in 1962, such an early classification does not guarantee an adequate vulnerability level compared to the present building seismic code.
Method M_1
The approach proposed by Bernardini et al. (2008) defines a score for homogeneous groups of buildings, consistent with a vulnerability assessment (Meroni et al., 2000) calibrated on more than 28.000 detailed buildings vulnerability forms collected during the main seismic crises occurred in Italy from 1983 to 2000 (GNDT database—National Group for the Defense Against Earthquakes).
The 1991 census (ISTAT, 1991) was taken as a starting point, since it provides disaggregated data at a resolution of the census section.
The mean vulnerability index Iv, for each group of buildings, is defined by the relation:
where i = 1 ÷ 6 and j =1 ÷ 6 (see Table 2B).
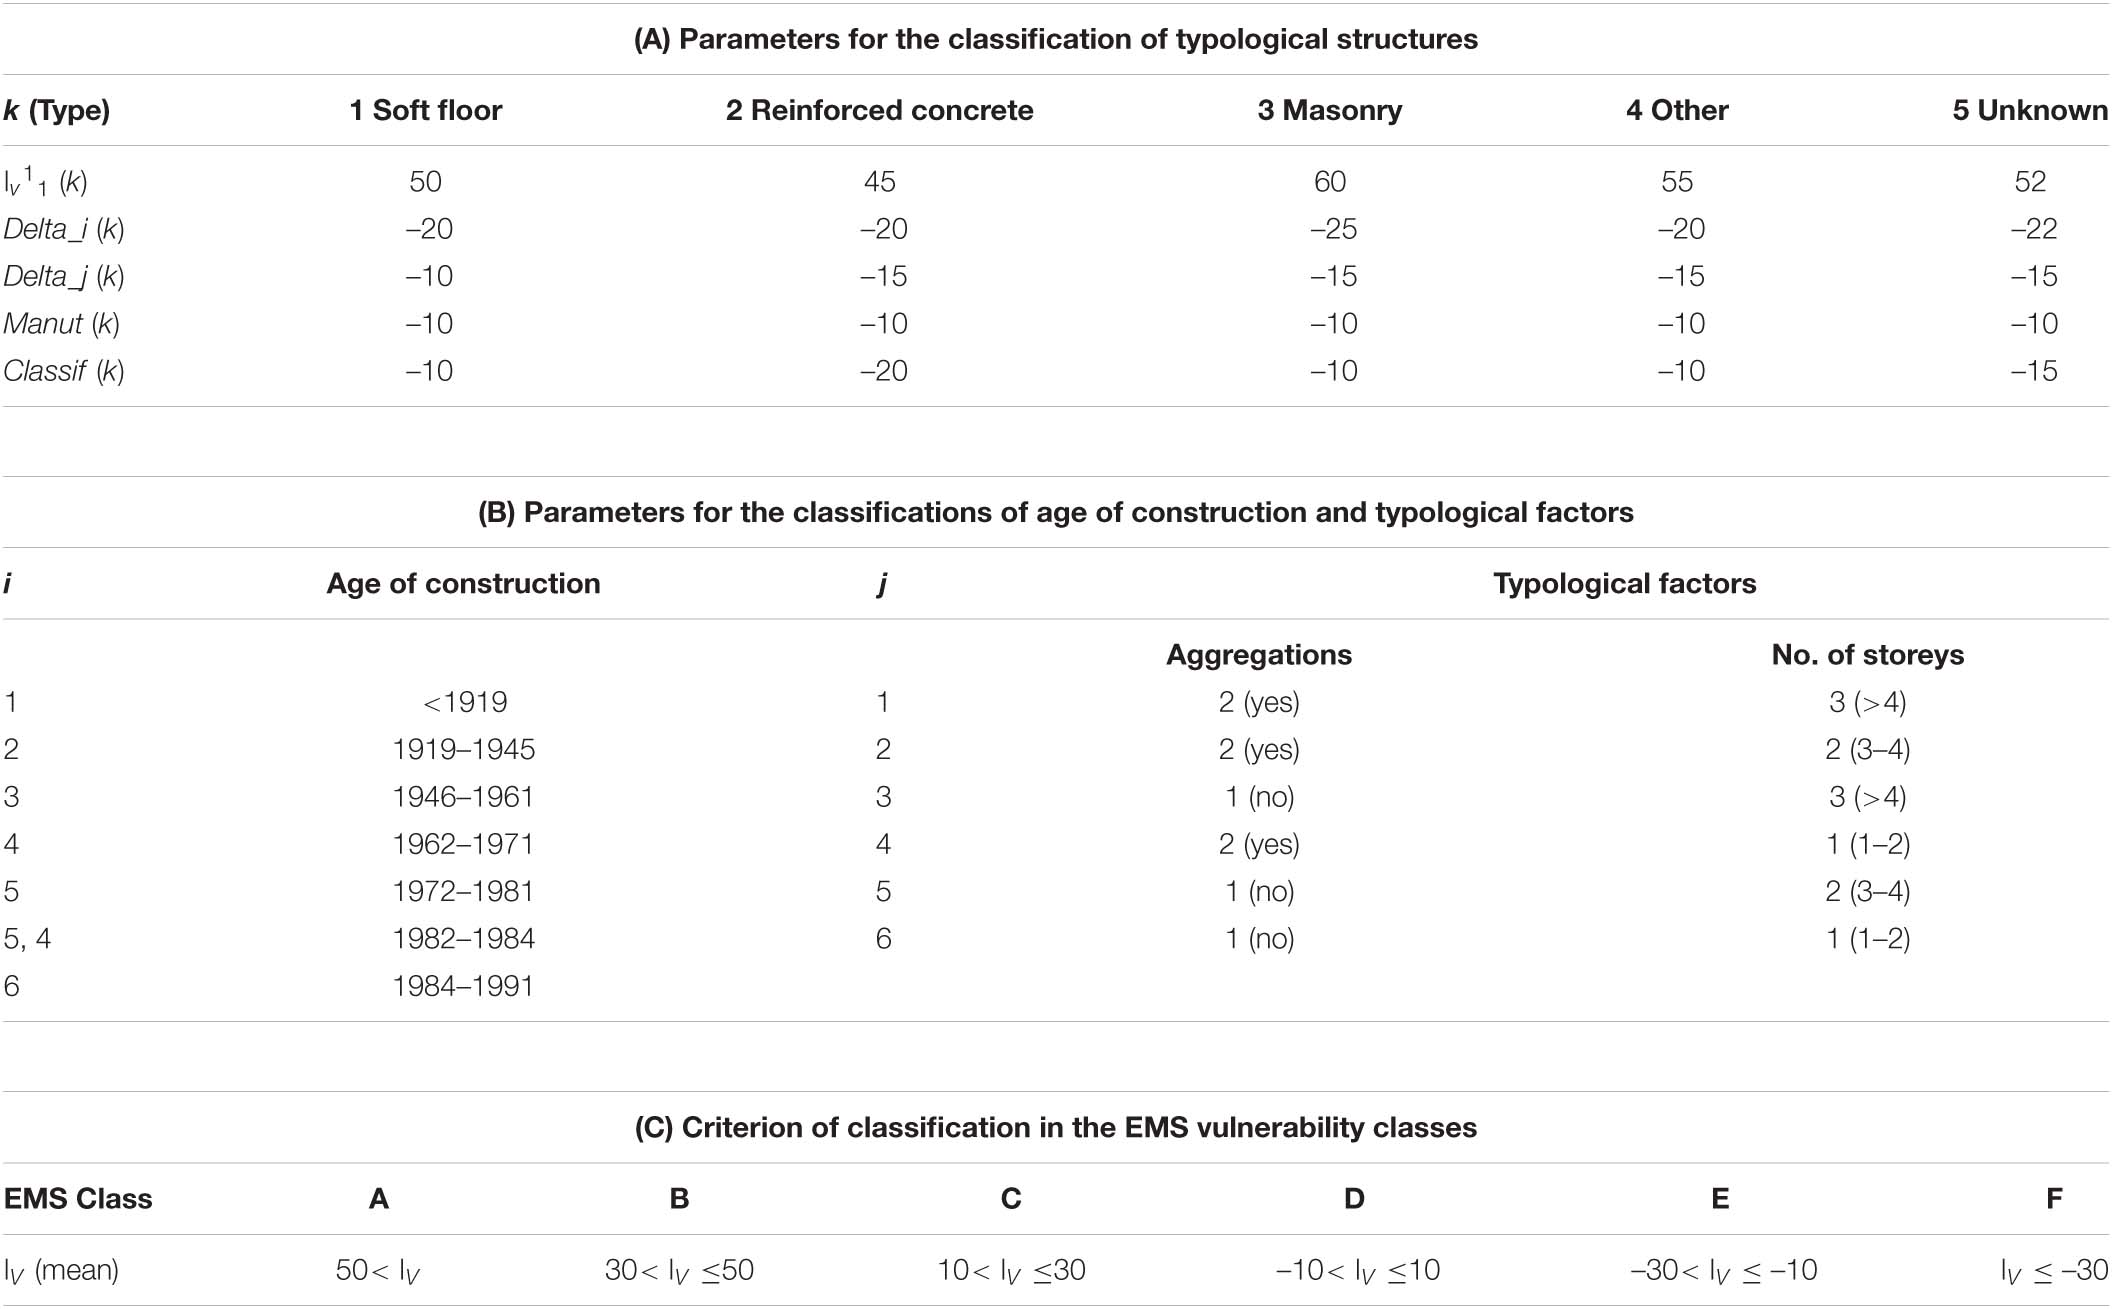
Table 2. Elements for the vulnerability assessment method based on the 1991 ISTAT data.
For a given k structural typology (k = 1 ÷ 5), the factors Delta_i and Delta_j (Table 2A) refer to the i ranges of the construction age (or total retrofitting) of the buildings and to the j typological factors, respectively (Table 2B). The factors Manut and Classif account for the state of building maintenance and the year of seismic classification of the municipality.
The corresponding EMS vulnerability class is determined according to the range of the vulnerability score shown in Table 2C (Bernardini et al., 2008). Vulnerability classes range from A (the weakest buildings, having the highest indices) to F (the most resistant ones, with the lowest scores).
The method proposed by Bernardini et al. (2007) uses macroseismic fragility curves to evaluate damage to residential buildings, through the definition of five damage classes (D1 ÷ D5) according to EMS classification. The EMS adopts qualitative ratings to evaluate the frequencies of buildings with different degrees of damage, for each vulnerability class and intensity. For instance, the intensity degree VII is reached when “Many buildings of vulnerability class A suffer damage of grade 3; a few of grade 4. Many buildings of vulnerability class B suffer damage of grade 2; a few of grade 3.A few buildings of vulnerability class C sustain damage of grade 2.A few buildings of vulnerability class D sustain damage of grade 1.” (Grünthal, 1998).
According to this approach it is possible to estimate a damage grade μD following the equations:
with f (IV, I) defined as:
where μD is the mean value of D, a random variable of damage grade; I is the intensity and IV is the vulnerability index.
The fragility curves for damage distribution P(D > d | I) are modeled according to a Beta distribution, with a probability density function given by:
in which, Γ is the Gamma function, p and q are the parameters of the Beta distribution, defined as a function of the average value μD and the variance σD2 from the relations:
Method M_2
Giovinazzi and Lagomarsino (2001, 2004) proposed a vulnerability assessment method based on EMS by identifying seven distinct categories of buildings. A mean vulnerability index Vm(k) is given by the combination of the building age and the structural type: four classes are defined for masonry buildings (k = 1 ÷ 4) and three for reinforced concrete buildings (k = 5 ÷ 7), as shown in Tables 3A, 4A.
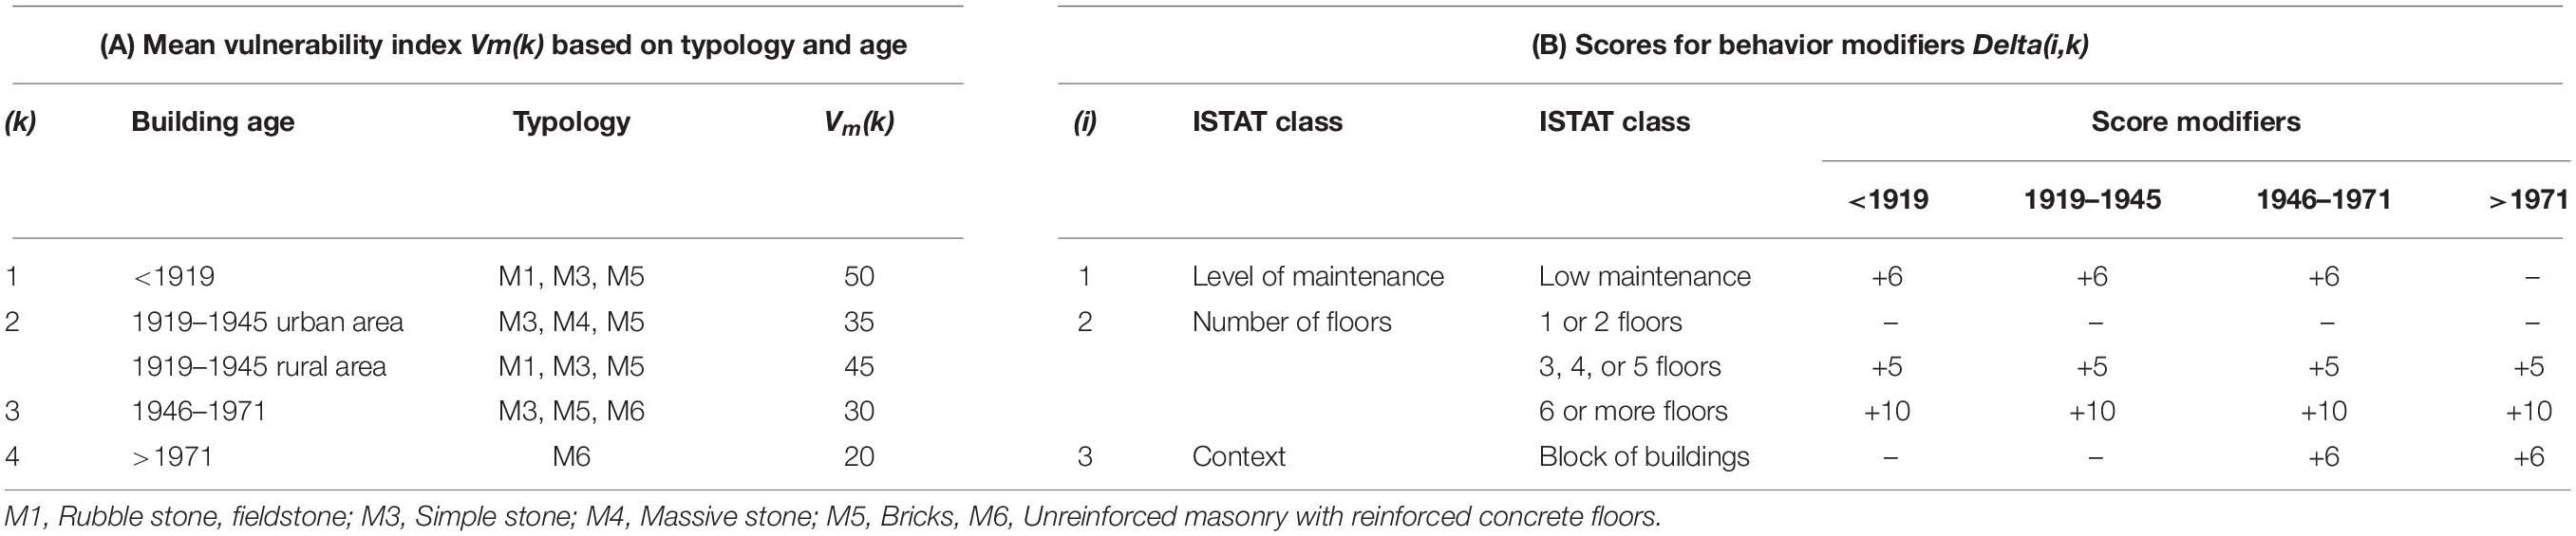
Table 3. Vulnerability scores for masonry buildings.
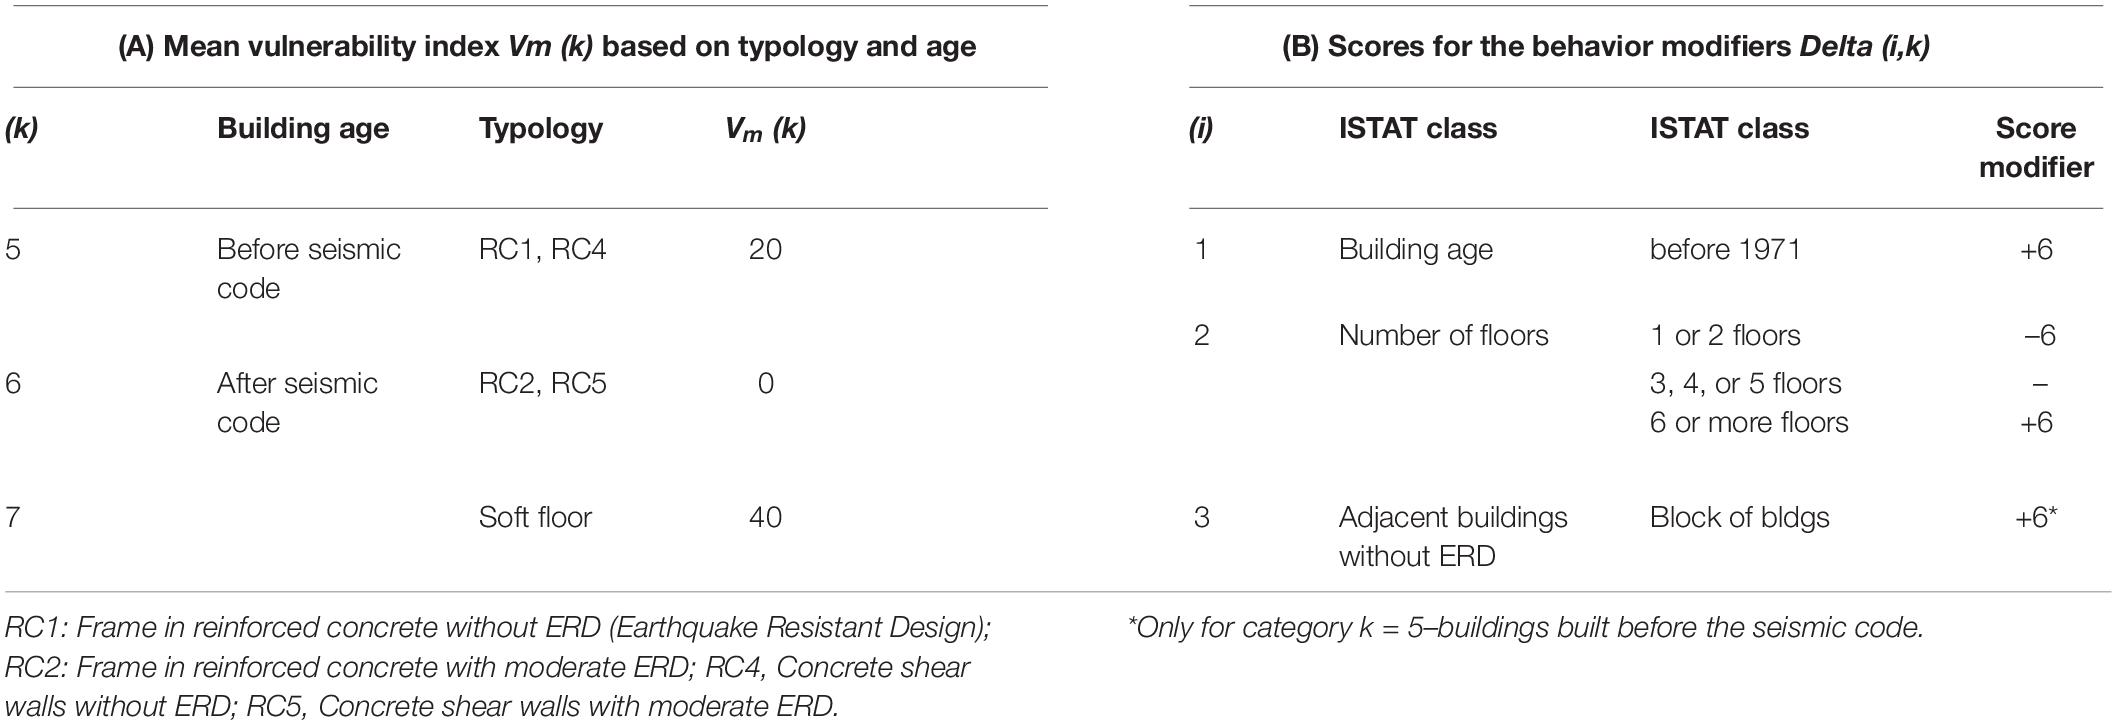
Table 4. Vulnerability scores for reinforced concrete buildings.
The overall vulnerability index V is calculated from the typological score Vm(k) and considering appropriate behavior modifiers derived from other ISTAT information (e.g., number of floors, structural context, maintenance status, see Tables 3B, 4B):
where k = 1 ÷ 7 refers to building structural typology. The Delta(i,k) for i = 1 ÷ 3 score represents the behavior modifiers for masonry (Table 3B) and reinforced concrete buildings (Table 4B). They can either increase or decrease the initial value of the mean vulnerability index Vm(k).
The damage model proposed by Lagomarsino and Giovinazzi (2006) is similar to the one adopted by the M_1 method. It classifies the building stock according to the vulnerability definition of the EMS and provides damage distributions, conditioned by the level of intensity, for each degree of damage of the EMS.
The fragility curves are modeled according to a Beta distribution, with a probability density function with the value μD calculated as:
μD is the mean damage grade of a random variable D, I is the intensity level and V is the vulnerability index (A ÷ F).
Applications of this method have been developed for Etna area (D’Amico et al., 2016) and Portugal (Zonno et al., 2010; Mota de Sá et al., 2016; Sousa and Campos Costa, 2016).
Method M_3
This method, adopted in the 2005 by the Department of Civil Protection for the assessments of seismic risk in Italy (Di Pasquale et al., 2005), subdivides the building stock into four vulnerability classes (A, B, C1, and C2) by means of a correlation between type of construction and age. The age classes are those of the ISTAT census, and therefore the method is immediately applicable to the 2011 data.
Table 5A lists the vulnerability class as a function of the horizontal and vertical structural elements (adapted from Braga et al., 1982). A correlation between vulnerability class and the age of masonry buildings has been obtained through a statistical study of a sample of about 50,000 dwellings after the 1980 Irpinia MW 6.8 earthquake (Table 5B). The reinforced concrete buildings are classified into the C2 vulnerability class.
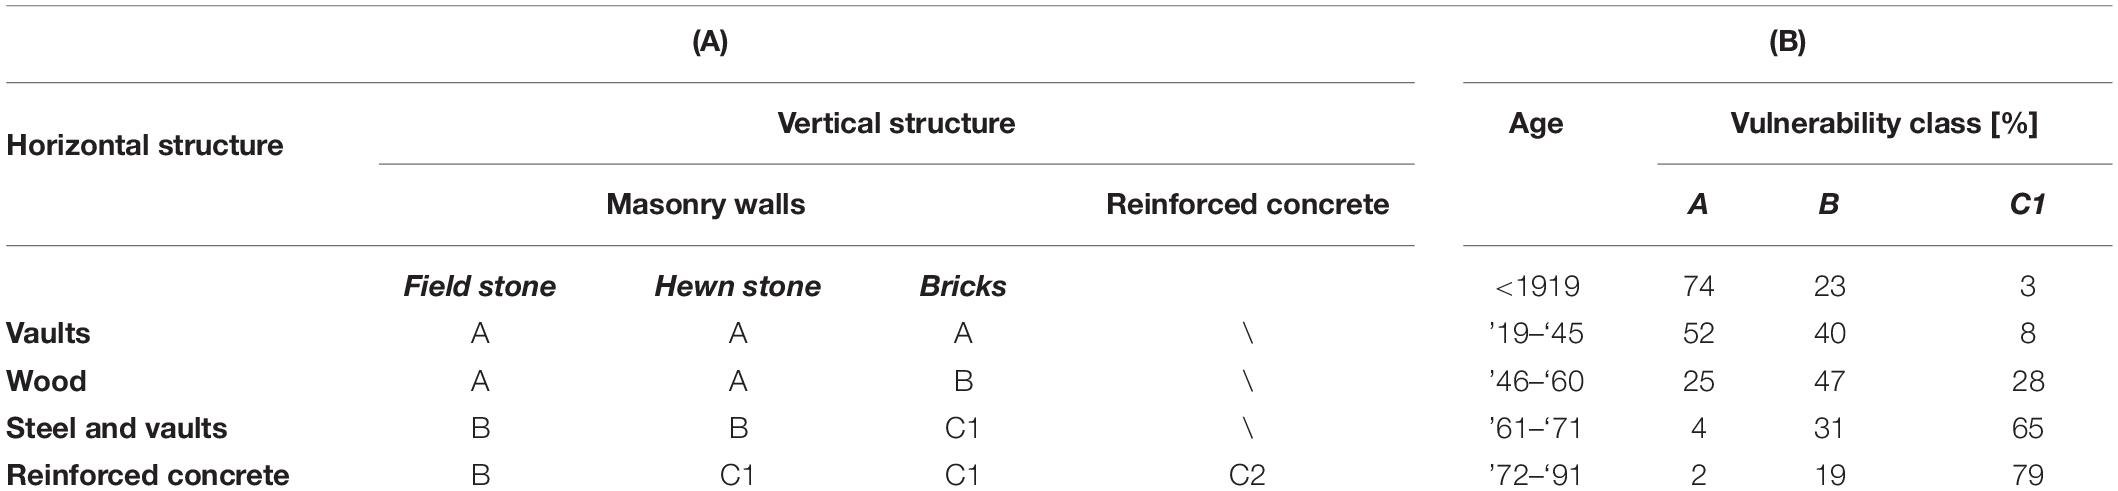
Table 5. (A) Vulnerability classes vs. horizontal and vertical structural elements. (B) Vulnerability classes vs. age for masonry buildings (modified from Di Pasquale and Orsini, 1998).
Damage scenarios are estimated by the Damage Probability Matrices (hereinafter DPM), that is a statistical correlation among macroseismic intensity, vulnerability class and EMS damage grade (D0 ÷ D5). According to this approach, damage grade k (k = 1 ÷ 5) is evaluated through the ground shaking (expressed in terms of intensity) and the frequency of buildings in the vulnerability class. The scenario is obtained by adding in discrete terms the number of buildings in each vulnerability class (A, B, C1, and C2) given the intensity degree. The number of buildings is weighted by the probability pk of the damage grade k given by the adopted DPM.
The DPM are described by a binomial distribution:
where pk is the damage probability of level k (k = 1 ÷ 5), for a given intensity degree I.
The binomial distribution is defined by the binomial coefficient (or “average damage”) d(I), ranging between 0 and 1. Technically, using the only average damage d(I) it is possible to describe the whole damage distribution for each vulnerability class and intensity grade. The values of pk, for each intensity and vulnerability class, have been found through an error minimization procedure on the observed frequencies of damage level (observed DPM), relative to the same sample of structures surveyed after the 1980 Irpinia earthquake (Di Pasquale and Orsini, 1997, 1998). The assumed values of average damage d(I) are summarized in Figure 6.
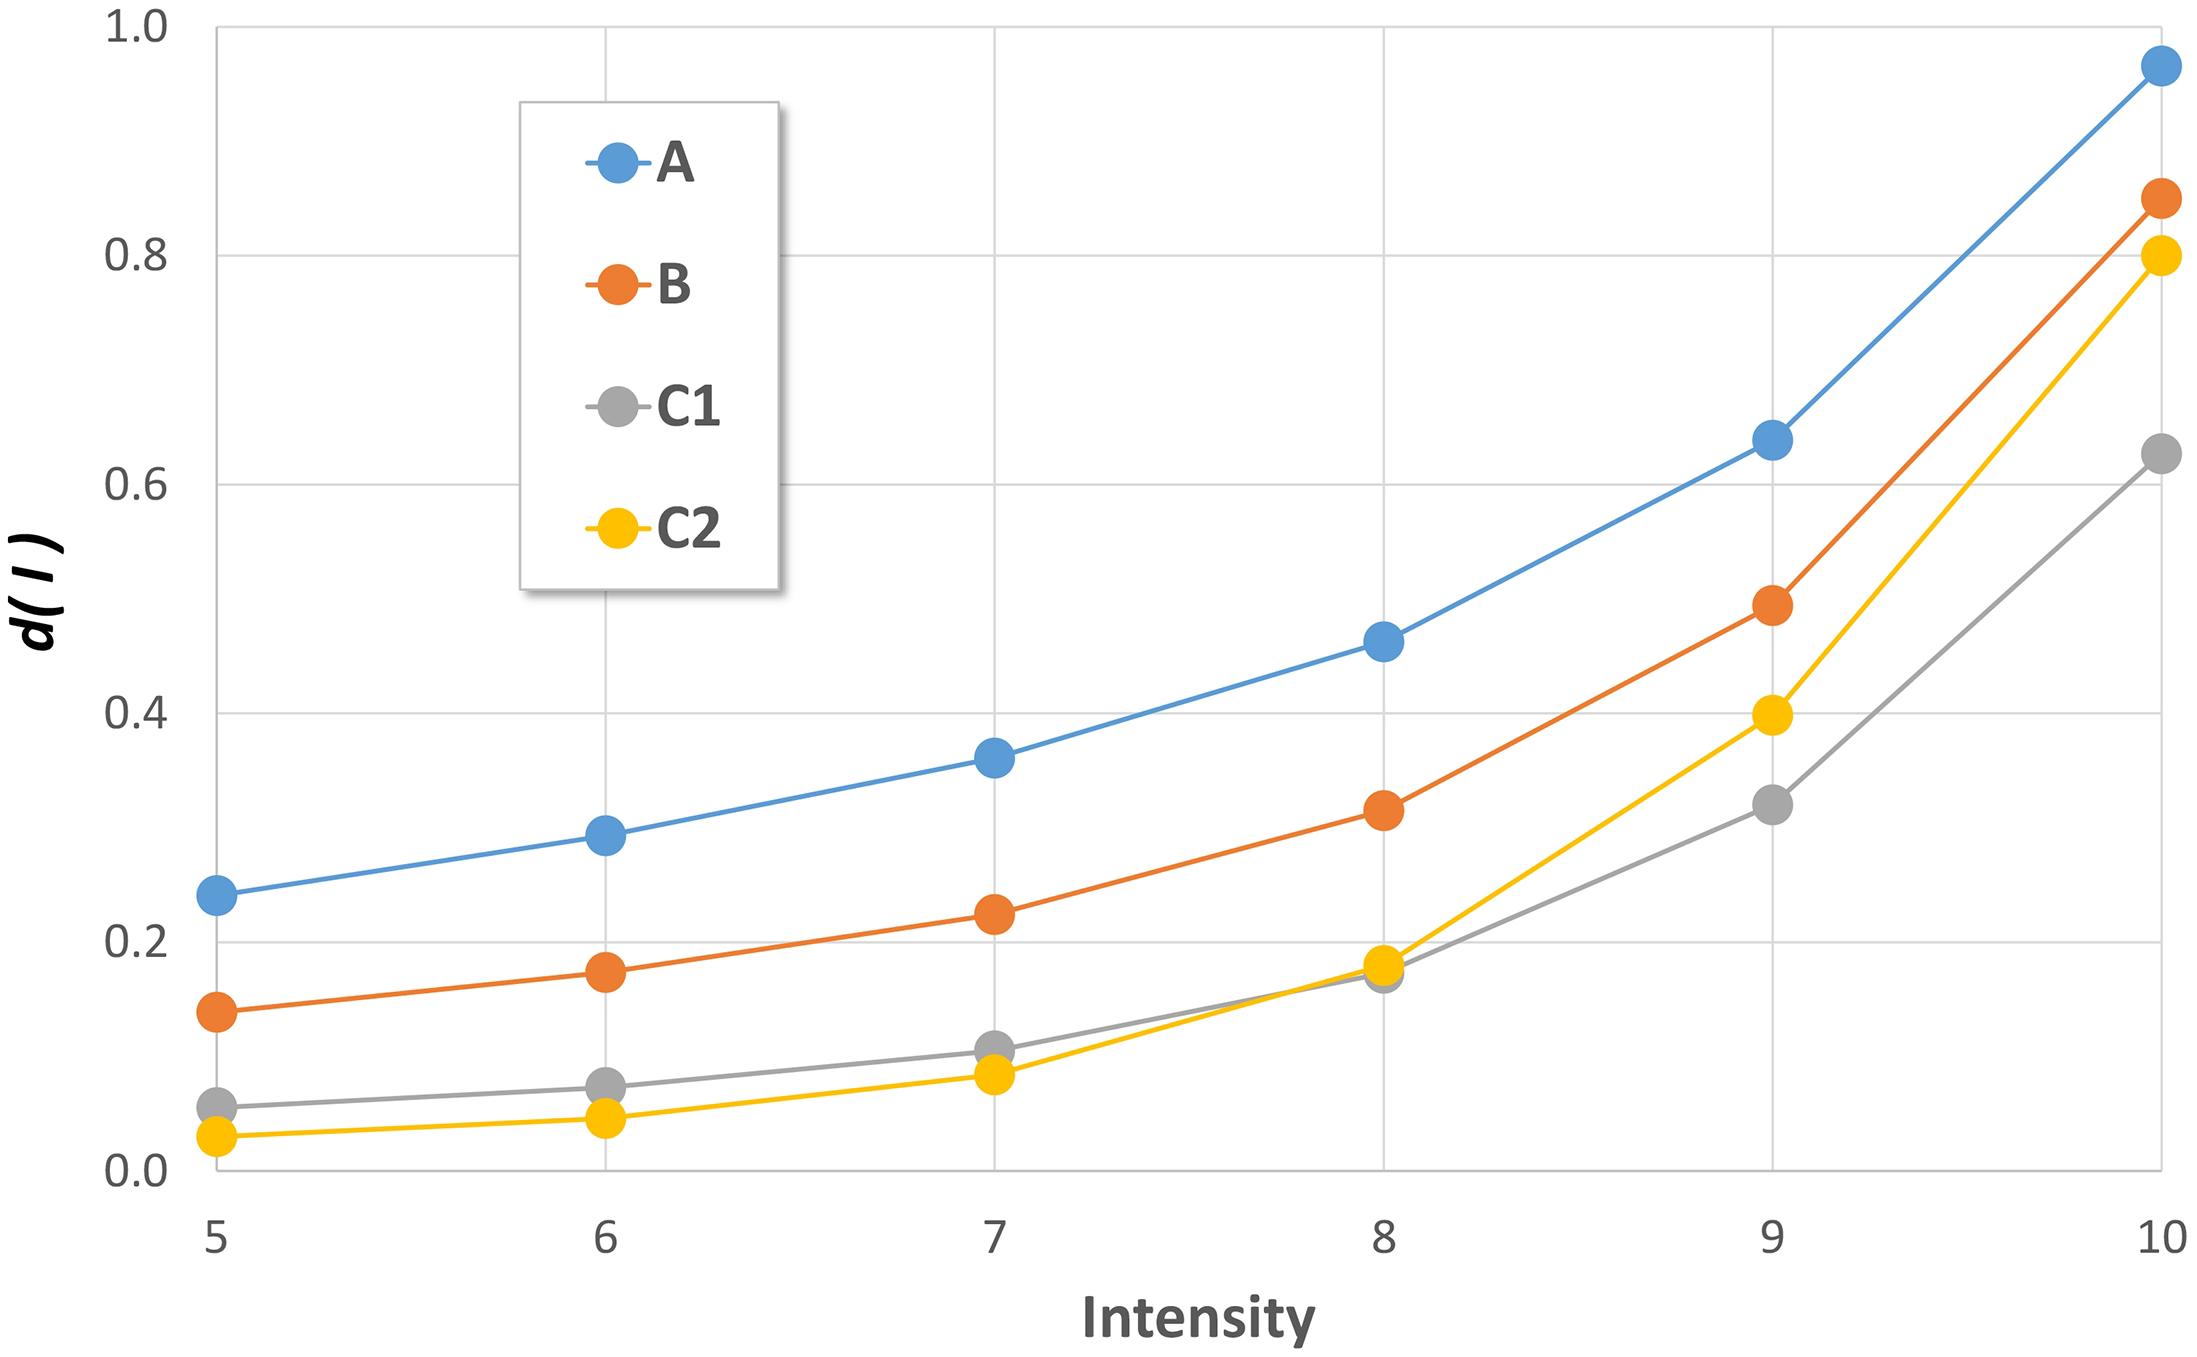
Figure 6. Values of average damage d(I) of the binomial function pk, for each vulnerability class and EMS intensity (Di Pasquale and Orsini, 1997, 1998; Di Pasquale et al., 2005) ).
Analysis of Results and Comparison With Surveyed Data
As described before, the intensity attenuation is characterized by a rapid variability at very short distances, and needs to be represented in detail when matched with the vulnerability data to produce reliable damage scenarios. The use of a single intensity value at a municipal scale is a rough approximation, while the ISTAT census section scale is a preferable option. Our analysis followed three main steps: (i) calculating the macroseismic intensity in the census section centroids by means of the specific attenuation model (see section The December 26, 2018 Earthquake: Observed and Simulated Intensity Scenarios), (ii) assessing the building vulnerability distribution for each census section according to the models M_1 to M_3, (iii) evaluating the damage distribution by means of macroseismic fragility curves and DPM.
Following the procedure used by Dolce et al. (2020) for the recent Italian risk maps we examined the estimations obtained by the M_1, M_2, and M_3 methods in terms of damage values that are comparable because are defined through the same EMS scale.
Figure 7 shows the damage distribution in five classes (D1 ÷ D5) for the residential buildings of the entire area. It is noteworthy that the methods M_1 and M_2 are more conservative than M_3. Largest differences exist in damage classes D2 and D3, where damage evaluated with M_3 is double than the ones calculated with M_1 and M_2. Furthermore, the M_2 method is the most conservative of all and it does not estimate any collapsed building (class D5).
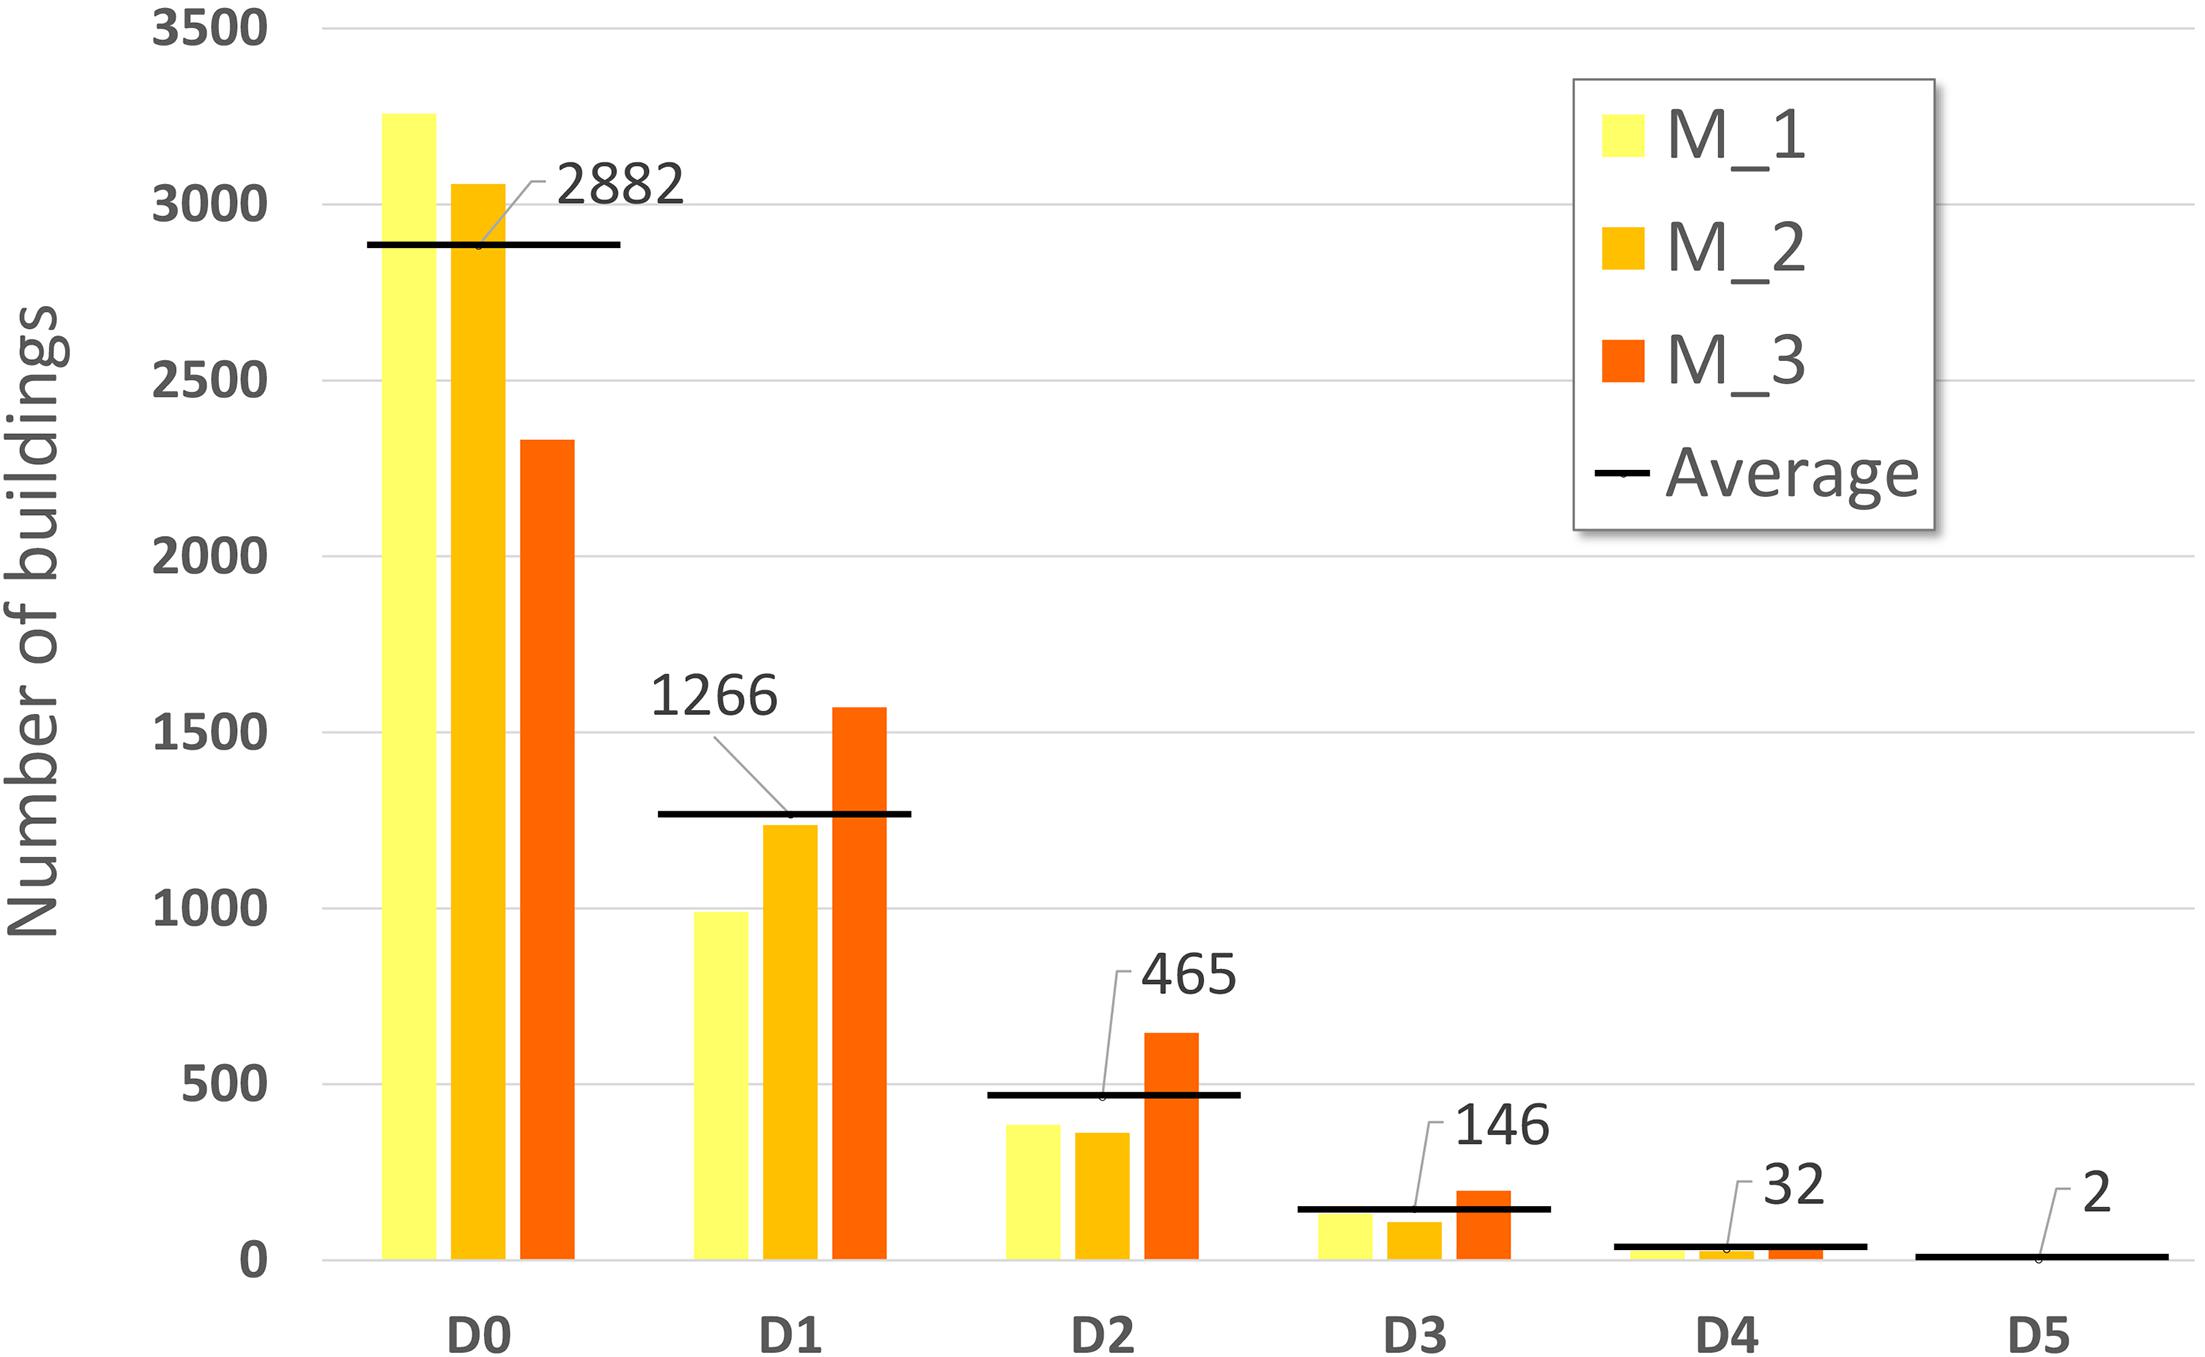
Figure 7. Damage distribution obtained through the methods M_1 (Bernardini et al., 2007), M_2 (Lagomarsino and Giovinazzi, 2006), and M_3 (Di Pasquale et al., 2005). Black line indicates the average number of buildings in each damage class.
In order to validate the methodological approaches here proposed, we compare the resulting damage assessments based on the ISTAT data with real data on individual buildings acquired during the macroseismic survey (Azzaro et al., 2020).
The main problem in applying the aforementioned methods is the different areal coverage to which data are referred, complicated by the fact that the study area is densely urbanized, in many places without a solution of continuity. In practice, while at the ISTAT scale the urban settlements are “viewed” through administrative boundaries (i.e., municipal limits and census sections), the extent of the macroseismic survey is focused on the “locality,” that is a territorial unit significant from the statistical point of view of the macroseismic intensity (Grünthal, 1998). In these terms, a locality such as a town or village, typically consists of an historical center and more recent outskirts around them. The localities investigated in the survey are those reported in the national geographic gazetteer used in the Italian Macroseismic DataBase (DBMI15; Locati et al., 2019), which grants the unequivocal association of a locality with a pair of geographical coordinates. In this way all the intensity data available in the DBMI15 for a given geographic reference, are really representative of the seismic history of that locality.
As a result, there is only a partial correspondence between the data acquired on individual buildings during the macroseismic survey and the aggregated ones provided by ISTAT. This situation is shown in Figure 8 where the surveyed areas (in blue) are overlapped on the census sections (in gray).
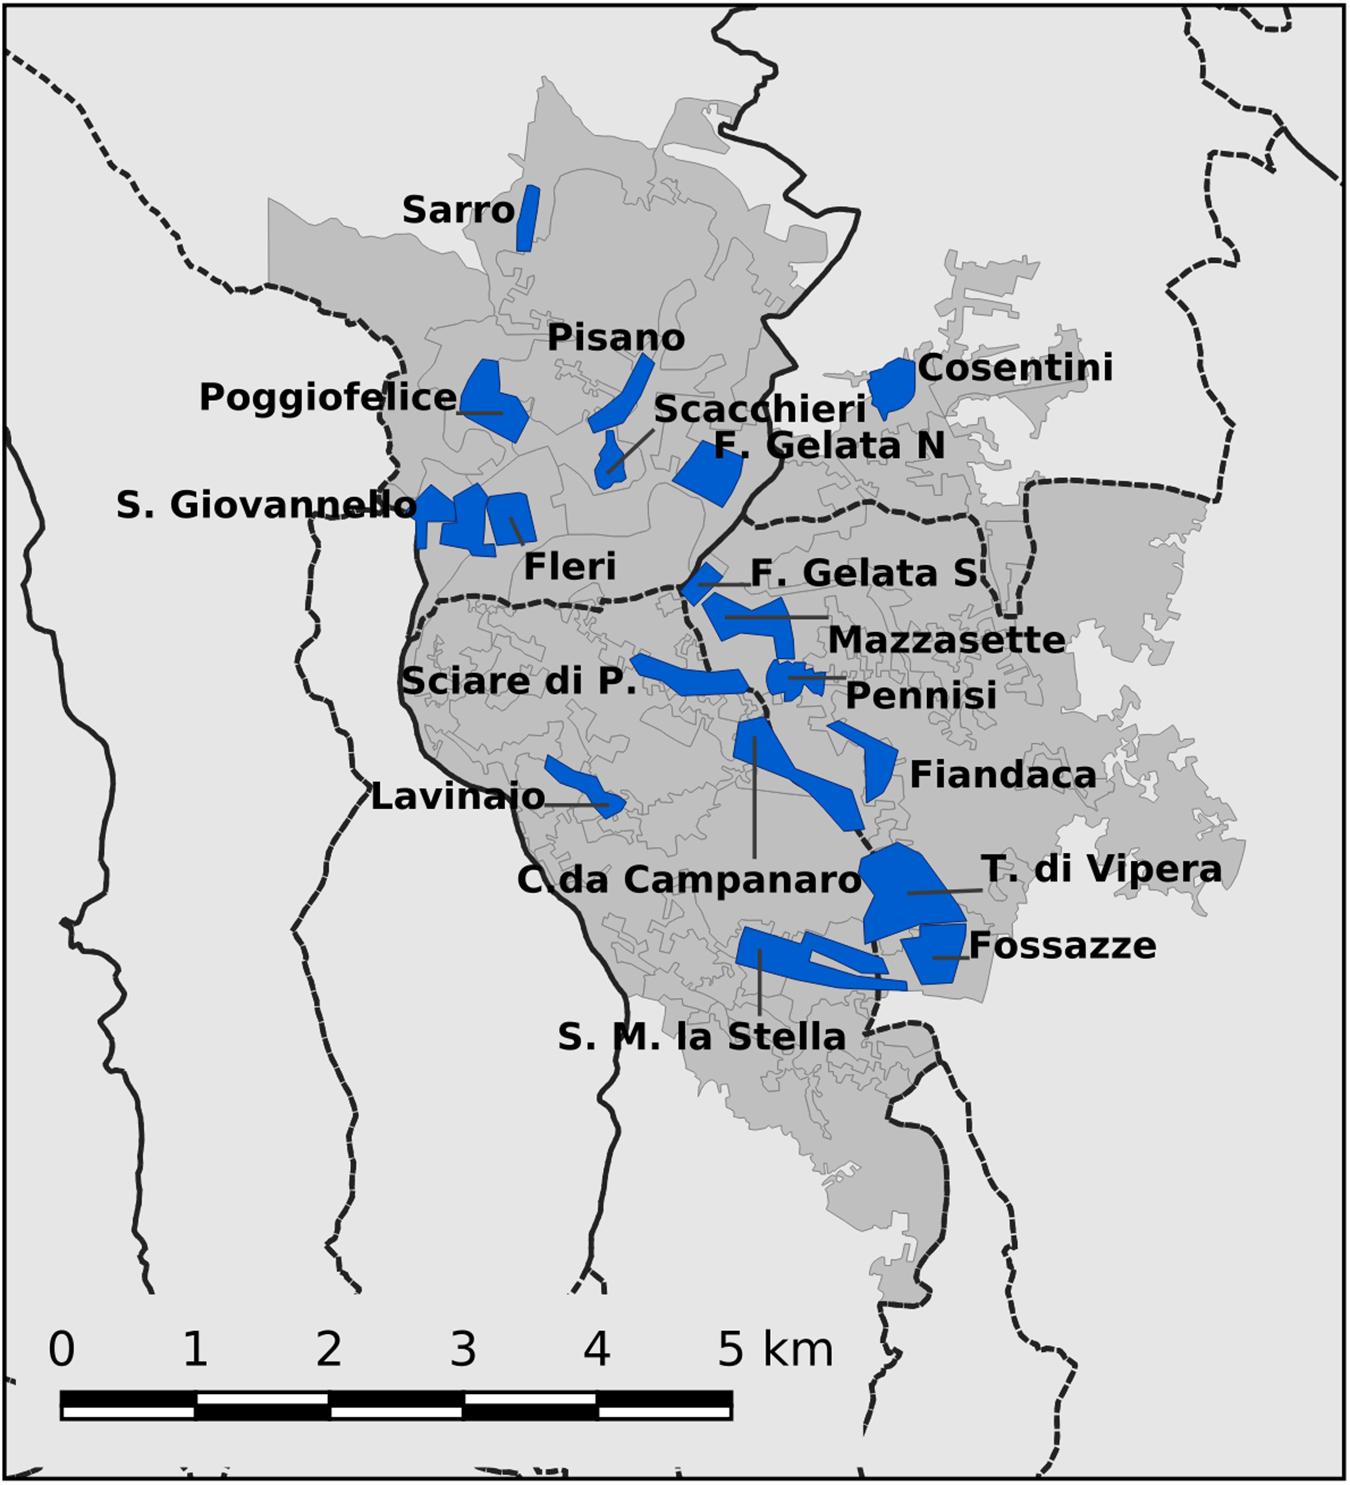
Figure 8. Investigated area: ISTAT, 2011 census tracts (gray polygons) and target zones of the macroseismic survey (blue polygons). Black lines are the administrative boundaries of municipalities.
The macroseismic survey collected data out of 1,278 buildings in the localities damaged by the December 26, 2018 earthquake, distributed in four different municipalities (Azzaro et al., 2020). The focus on the historical centers has the effect of considering mostly the old buildings or the more vulnerable structures in general, whereas the new urbanized zones result “sampled” only for the nearest outskirts, while the residential areas with sparse and isolated buildings are not considered in the macroseismic survey practice.
Figure 9A illustrates the case of Fleri, a locality of the municipality of Zafferana Etnea̧ which has been assigned an intensity I = 8 EMS. According to the 2011 ISTAT data, there are 453 buildings in the two census sections (red polygons) corresponding to this locality. During the macroseismic survey carried out in the areas marked by the green polygons, 205 buildings were inspected and classified in terms of vulnerability and damage (Figure 9B). The comparison between the simulated and surveyed damage distributions is shown in Figure 9C. Considering that no damage is expected in the recently urbanized areas with low vulnerability buildings, the surveyed damage distribution can be considered representative for the entire zone.

Figure 9. Locality of Fleri: (A) coverage of the ISTAT census section (red polygons) and the surveyed areas (green polygons). (B) Number of surveyed building according to vulnerability (A÷D) and damage classes. (C) Comparison of damage estimation between the simulated distributions (M_1 ÷ M_3) and the one derived by the survey in the green areas.
In this case, it is evident that the M_3 simulation provides values better approximating the observed data (Figure 9C). Further analyses on other localities show greater differences between the estimated and observed values, especially for the higher damage classes (D3 ÷ D5).
To quantify the comparison of the simulations with surveyed data, we calculated the index of the dispersion of the results by evaluating a sort of error , defined as a sum of residuals, expressed in terms of numbers of buildings.
The error for each j-th method (M_1 ÷ M_3) is:
where is the numbers of estimated buildings for the damage grade D (D0 ÷ D5) for the j-th method. The is the number of buildings surveyed during the macrosesmic campaign for the damage grades D.
The minimum value of sum of residuals defines the method better approximating the real damage distribution.
For the final damage scenario, we considered the whole investigated area (gray polygons of Figure 8). In order to perform a comparison with the observed damage, we extrapolated the damage distribution of the 1,278 surveyed buildings to the 4,793 buildings associated to the relevant census sections, assuming that the damage in the investigated area is representative of the overall damage distribution.
The minimum value of is obtained through the M_3 method (Di Pasquale et al., 2005). This method has a values (307) half of the values of M_1 and M_2 (661 and 582, respectively) and therefore the M_3 method is the one better approximating the distribution observed by the survey.
The comparison of the damage distributions for the overall damage scenario is illustrated in Figure 10. The simulations provide damage distributions more conservative than the surveyed data: the damage degree from moderate to heavy damage (D3 ÷ D5) is not properly estimated. The largest differences are obtained for class D3, considering that discrepancies for classes D4 and D5 can be neglected because the sample is too small.
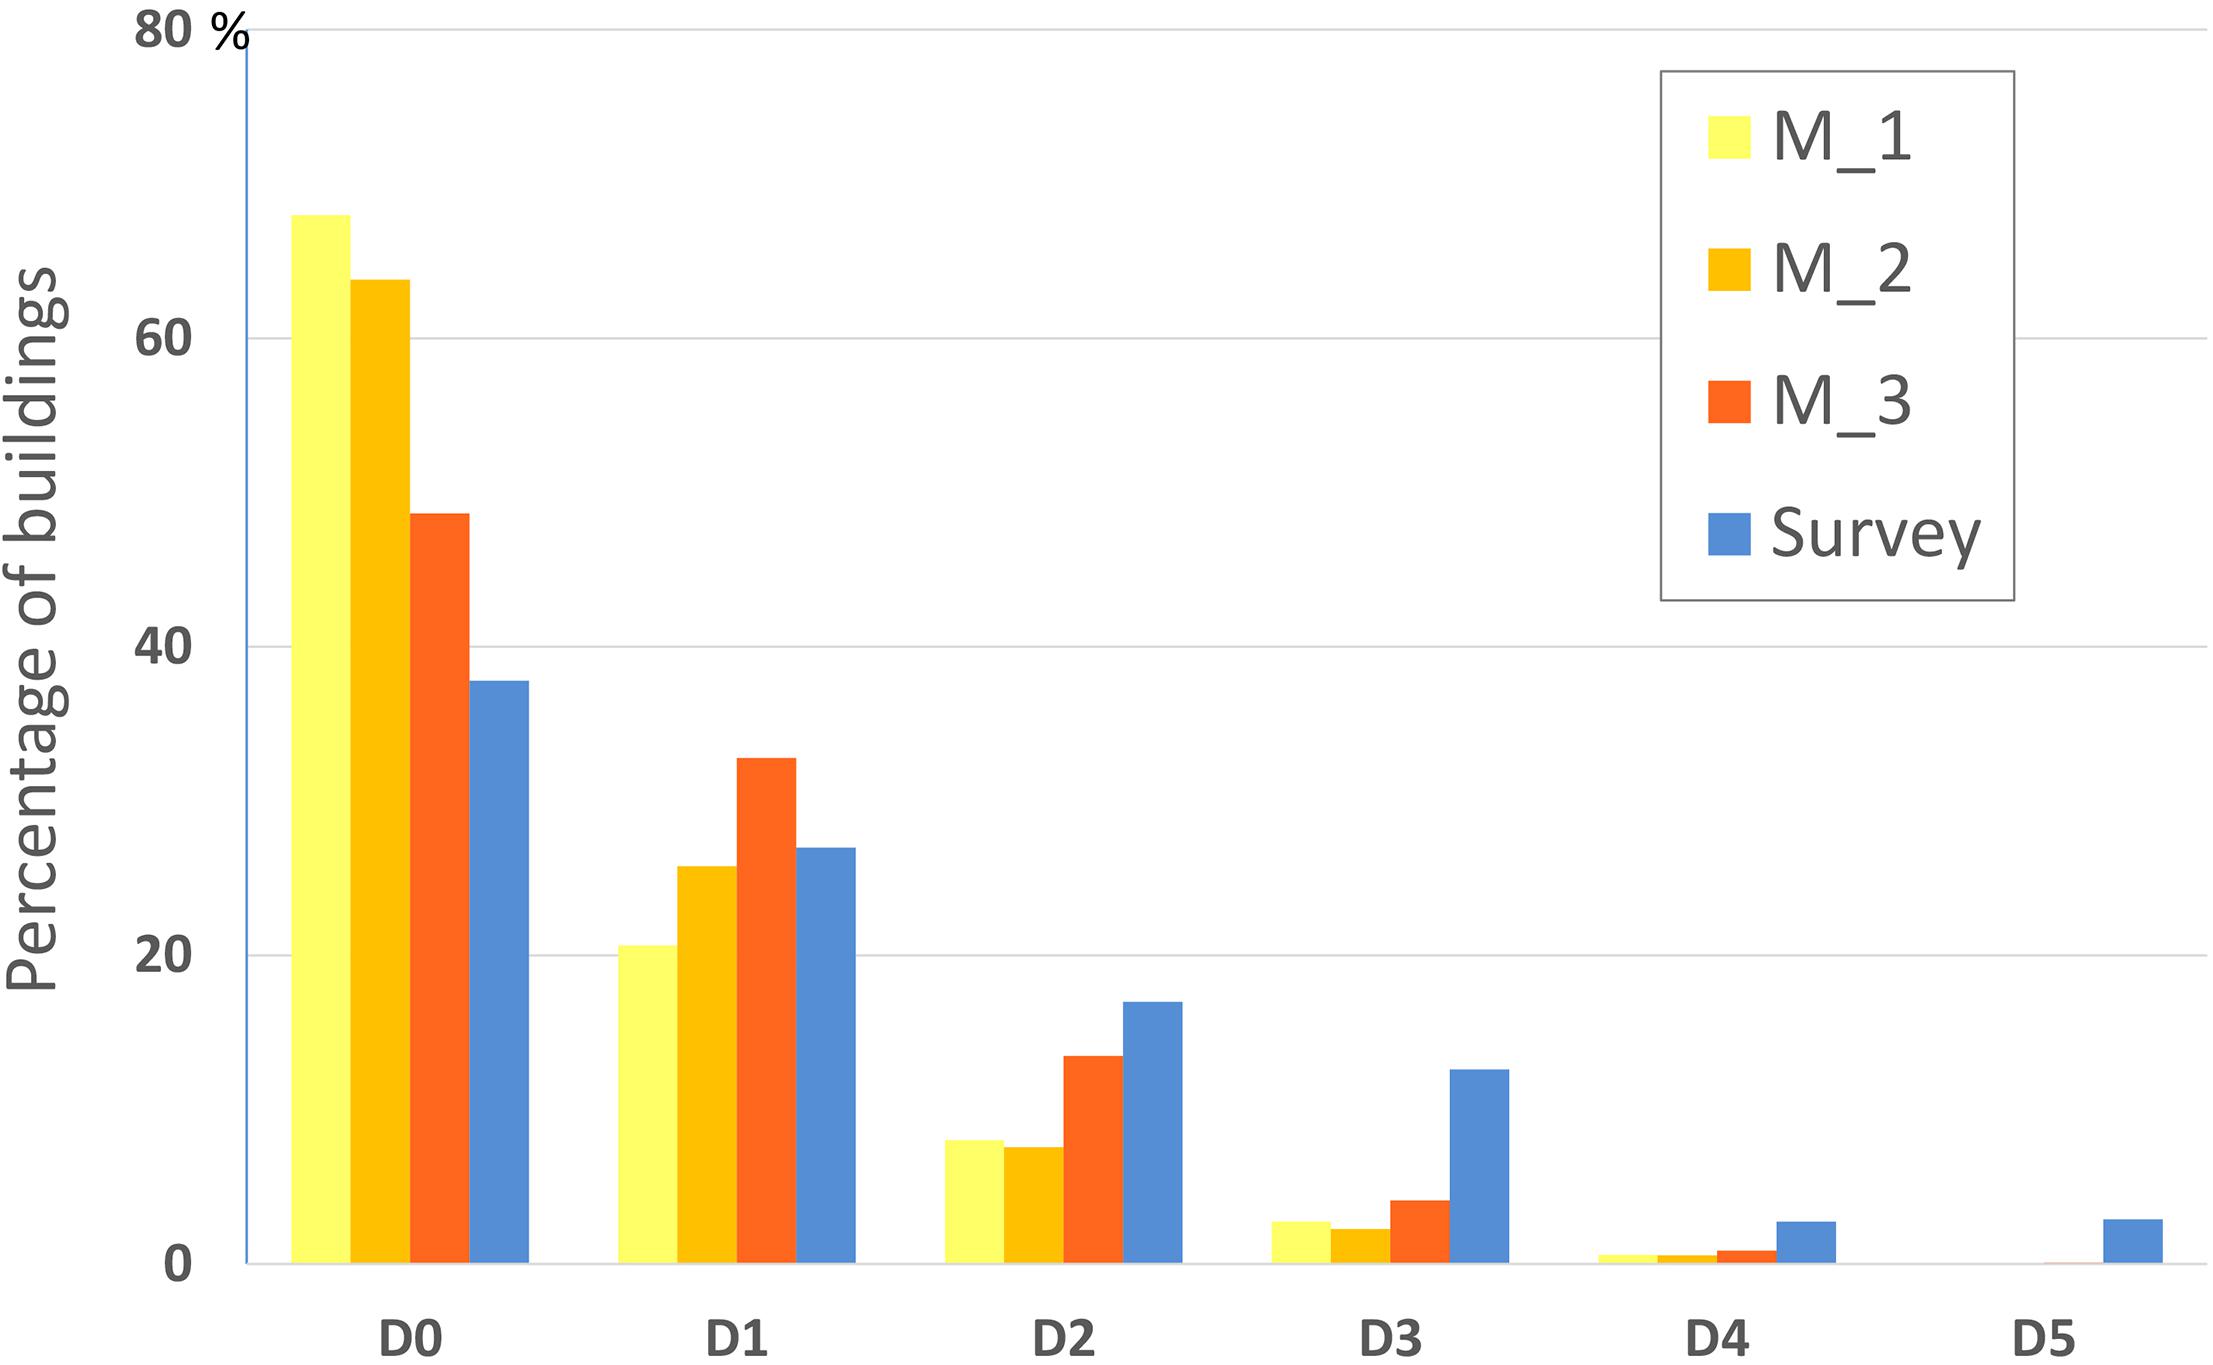
Figure 10. Comparison of damage estimations between simulated (M_1 ÷ M_3) and surveyed distribution, in percentage, for the whole damaged area.
The presence of buildings with a level of vulnerability higher than the average level can explain this difference. Indeed, the survey highlights the presence of many reinforced concrete buildings built in the timespan 1970–90’s that are particularly vulnerable. To simulate this condition, we forced the damage scenario by worsening the vulnerability of a part of the reinforced concrete buildings. In detail, 50% of the buildings of class C was classified as B. The downgrade of vulnerability is a practice suggested by the EMS guideline (Grünthal, 1998) in case of bad maintenance conditions or constructive defects, as in the case of reinforced concrete buildings without or with moderate level of resistant design. The new simulated distribution shows a minimum sum of residuals equal to 231 (the minimum value of all simulations), a result confirming the robustness of the method as well as the need to calibrate the vulnerability assessment with local data.
The number of damaged buildings in each census section calculated with the M_3 method is illustrated in Figure 11. The first map shows the value of collapsed or very heavy damaged buildings (D5 + D4): the presence of victims (dead and injured) can be associated with this spatial distribution. The unusable buildings, calculated as the weighted sum of buildings with heavy and substantial damage (D4 + 60%D3) (Dolce et al., 2020), are illustrated in the central map of Figure 11; while the remaining part (D1 + D2 + 40%D3) represents the slightly damaged buildings that can be repaired but imply economic costs (Lucantoni et al., 2001; Di Pasquale et al., 2005).
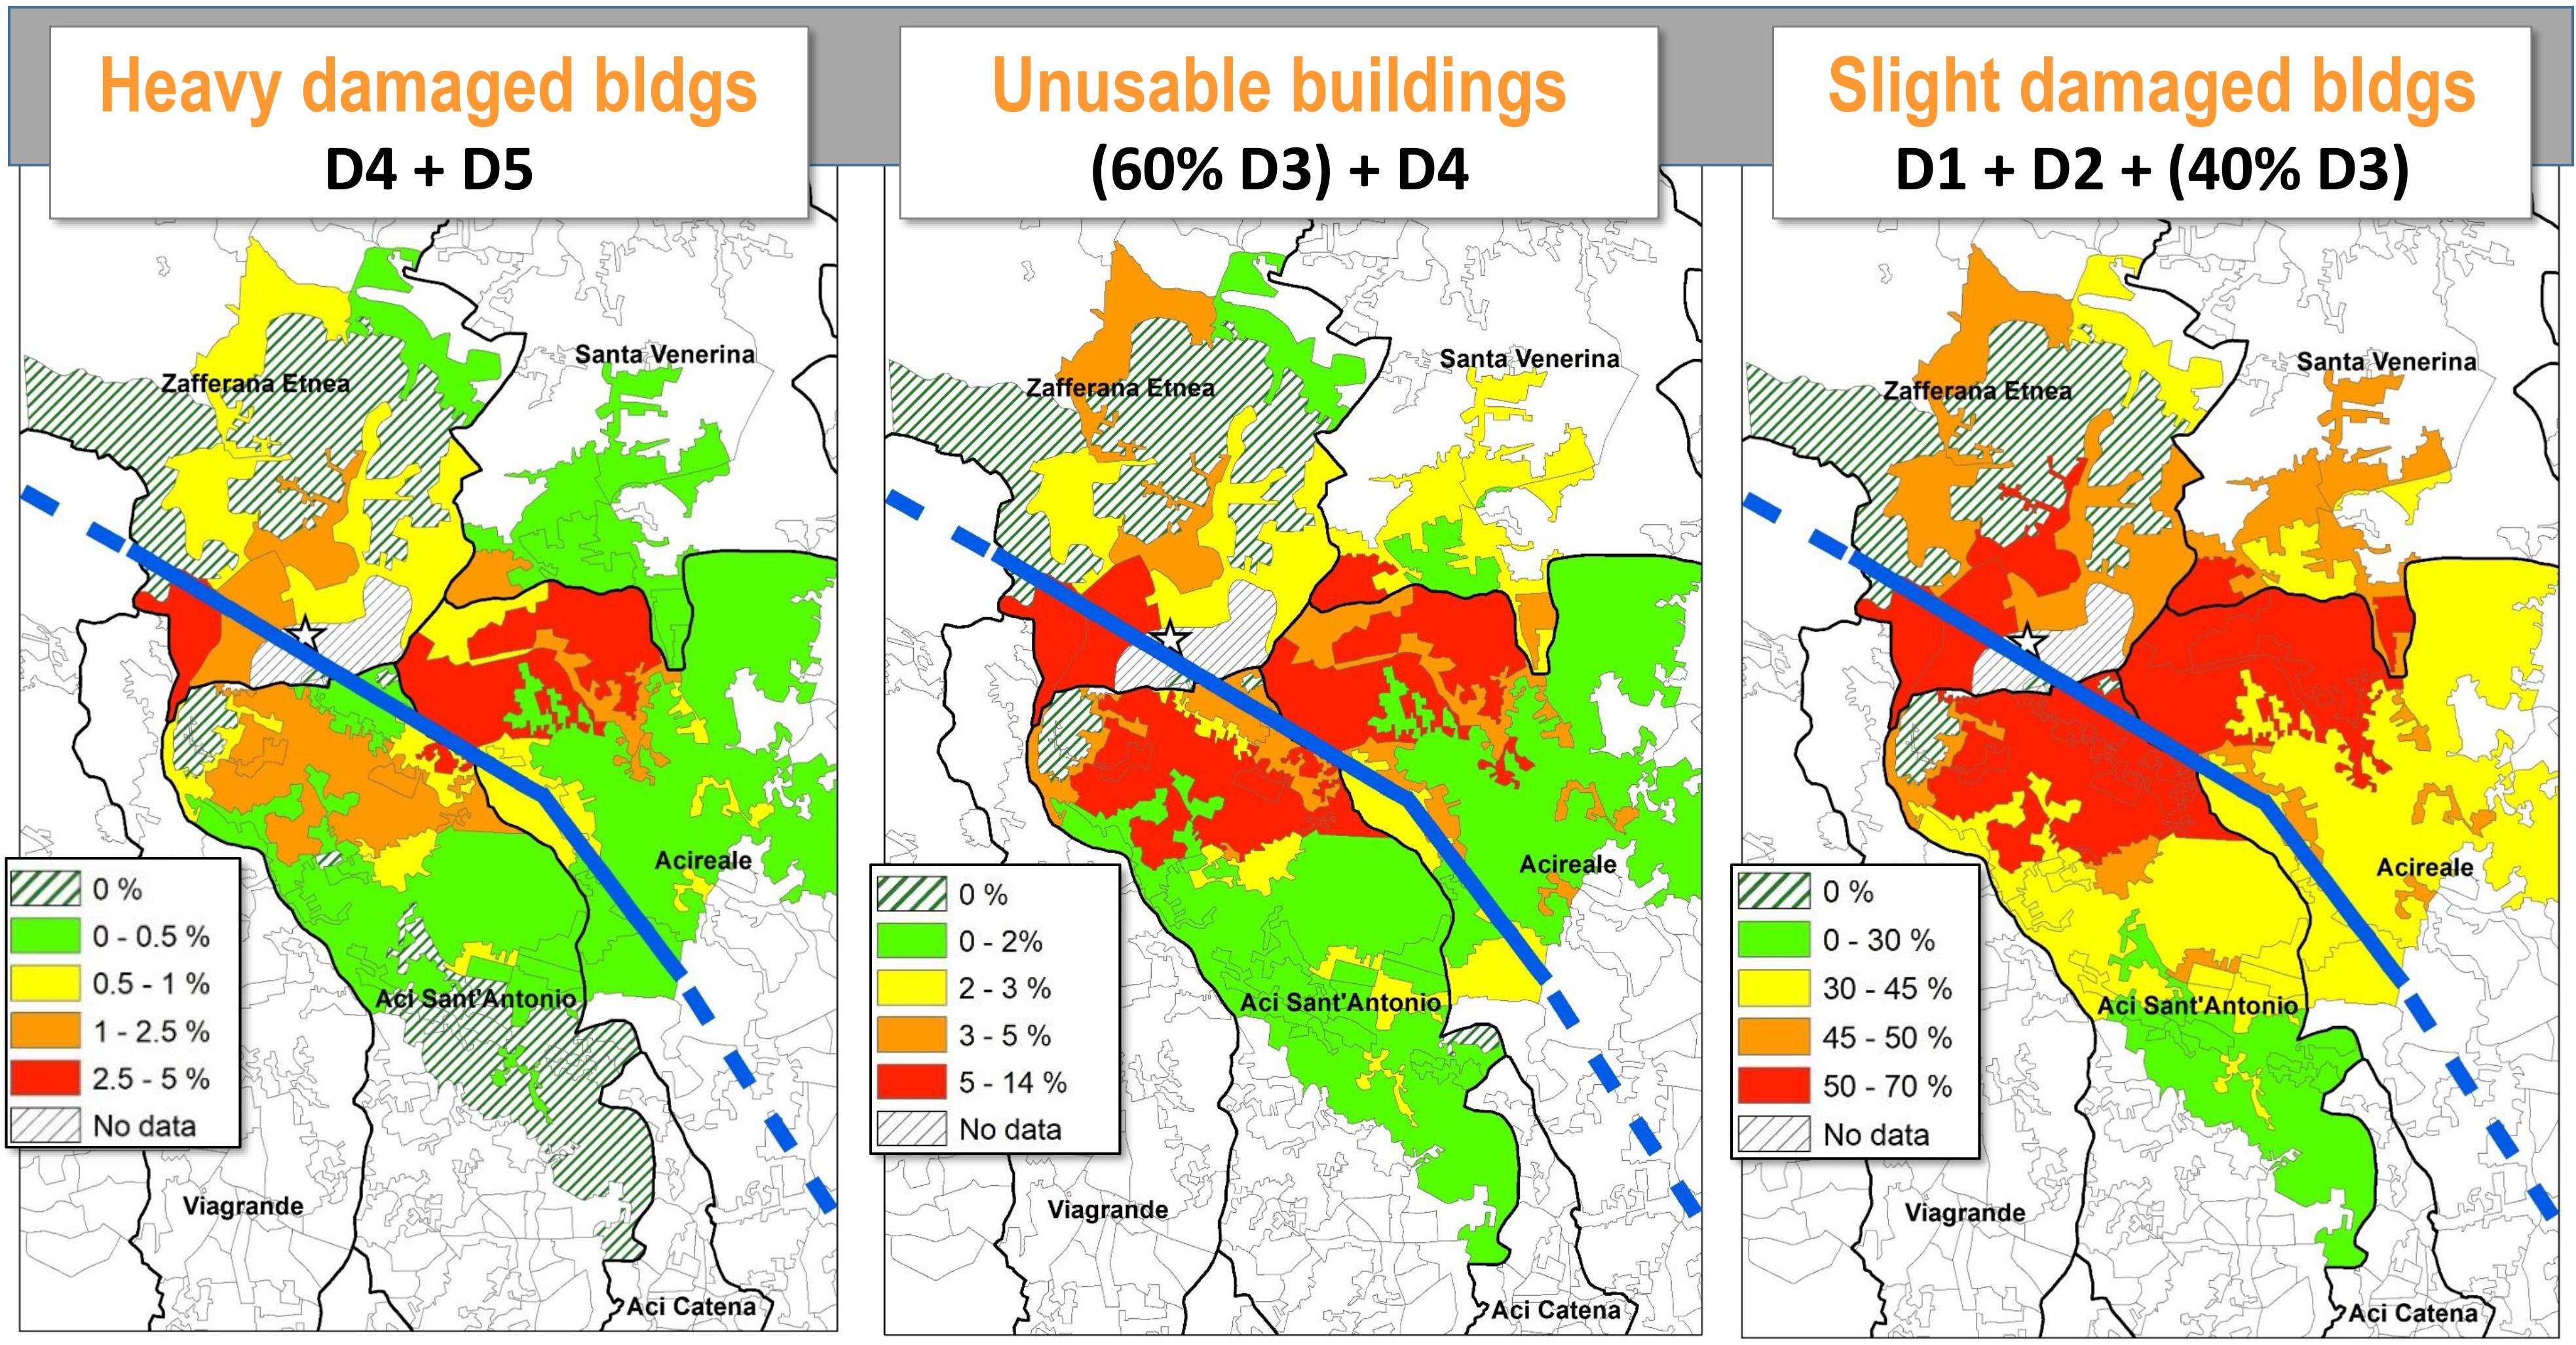
Figure 11. Damage maps calculated with M_3 method with values shown in percentage for each census section. Results are presented in percentage for groups of damage levels. Star indicates the epicenter, blue dashed line is the Fiandaca fault.
In general, the spatial distributions of damaged buildings, illustrated in Figure 11, are mainly concentrated along the Fiandaca fault and damage decreases with distance from the fault, reproducing the attenuation effects of the seismic shaking.
Conclusive Remarks
In this paper we compared the results of the earthquake damage scenarios obtained by theoretical vulnerability models and fragility curves with the real data collected through a macroseismic survey after a strong shock occurred at Etna volcano of the December 26, 2018 (MW 4.9). We used three models available in the literature, used in the Italian territory and in Europe, to test if suitable in the case of volcano tectonic earthquakes. The application of these models point out a number of issues that has to be solved, the main ones being:
1. the macroseismic data are collected according to the consolidated procedure for assigning the intensity, that is referred to a well-defined locality and cannot be extended to a territory or, worse, to single buildings;
2. the organization of the ISTAT data is critical to perform correct vulnerability and damage assessments, and strongly influences the quality of the final estimates: the recent and updated (ISTAT, 2011) data are available only in an aggregated form, preventing their immediate use in sophisticated damage models.
Furthermore, the perimeter of the census sections in the study area has considerably changed in the last decades, making difficult to track the changes determined by the recent urban growth. Since the localities of the macroseismic survey are unevenly located compared to the administrative boundaries or the census sections, the geographical match with the ISTAT data is not immediate.
The analysis of this case-study highlights the following considerations:
1. the seismic damage assessment methods M_1 (Bernardini et al., 2008) and M_2 (Giovinazzi and Lagomarsino, 2001) can be applied to disaggregated ISTAT data; in Italy, this typology of data (ISTAT, 1991) fixes the situation dating back 1991. In general, these models can be used for settlements where the urban development in the last 30 years has being scarce (for example in the Apennines, Central Italy), but not in areas with recent urban expansion, such as the slopes of Etna. In these cases, the use of approximations for the characterization of the recent urbanized areas is necessary, but may lead to estimation errors;
2. the simpler vulnerability model M_3 (Di Pasquale et al., 2005) can be used with more recent data (ISTAT, 2011). Despite the limited number of ISTAT parameters and a rougher haracterization of the building vulnerability, this method produces reliable estimates when calibrated with real data collected through the macroseismic survey;
3. the considered vulnerability models are calibrated on data mainly collected in Central Italy and do not fully adapt to some typologies of residential buildings in the Etna region. In general, bad quality of materials, construction errors, poor observance of the rules, subsequent structural changes may contribute to increase the effective level of vulnerability, and deserve a correct calibration. Validation remains an open issue until more detailed data will be available as, for instance, disaggregated updated ISTAT data or the AeDes data (Agibilità e Danno in Emergenza Sismica—“Post-earthquake damage and safety assessment and short-term countermeasures”) collected, buildings by buildings, in areas struck by strong earthquakes in Italy.
The common used damage estimation methods are calibrated for tectonic earthquakes and validated with data of strong events often presenting seismic sequences with cumulative damage (see the glaring example of the 2016–2017 Central Italy earthquakes in Graziani et al., 2019). In the present work we prove that it is possible to generate reliable damage scenarios in volcanic-tectonic regions, despite some different characteristics as the small-moderate magnitude, the shallow depth, the high values of peak ground motion parameters and their fast attenuation, and the low frequency content in the near field.
The necessary conditions are that the analysis has to be carried out on a detailed scale (census sections level) and the actual characteristics of the residential buildings have to be accounted for. At the present stage of our investigations, the M_3 method (Di Pasquale et al., 2005) provides a damage scenario better reproducing the effects of the 2018 Etna earthquake.
This application may also contributes to plan measures of intervention for the improvement of the building vulnerability in a densely populated areas such as the Etna volcano particularly exposed to seismic risk.
Data Availability Statement
The raw data supporting the conclusions of this article will be made available by the authors, without undue reservation.
Author Contributions
VP and FM assessed damage scenarios and compared the results with the collected data. RA and SD’A produced intensity shaking scenario, collected, and analyzed macroseismic survey data. All authors contributed to the article and approved the submitted version.
Conflict of Interest
The authors declare that the research was conducted in the absence of any commercial or financial relationships that could be construed as a potential conflict of interest.
Acknowledgments
We thank the reviewers for their suggestions that improved the paper.
Footnotes
- ^ https://knowriskproject.com/the-project/
- ^ Installation and systems are: drinking water systems, plumbing systems, drainage systems, connections to the sewage system, bathtub and/or shower installations, domestic hot water supply, and fixed heating installations.
References
Alparone, S., Barberi, G., Giampiccolo, E., Maiolino, V., Mostaccio, A., Musumeci, C., et al. (2020). Seismological constraints on the 2018 Mt. Etna (Italy) flank eruption and implications for the flank dynamics of the volcano. Terranova 32, 334–344. doi: 10.1111/ter.12463
Azzaro, R., Barbano, M. S., D’Amico, S., and Tuvè, T. (2006). The attenuation of seismic intensity on the Etna region and comparison with other Italian volcanic districts. Ann. Geophys. 49, 1003–1020. doi: 10.4401/ag-3113
Azzaro, R., Barberi, G., D’Amico, S., Pace, B., Peruzza, L., and Tuvè, T. (2017). When probabilistic seismic hazard climbs volcanoes: the Mt. Etna case, Italy – Part 1: model components for sources parameterization. Nat. Hazards Earth Syst. Sci. 17, 1981–1998. doi: 10.5194/nhess-17-1981-2017
Azzaro, R., D’Amico, S., Rotondi, R., Tuvè, T., and Zonno, G. (2013). Forecasting seismic scenarios on Etna volcano (Italy) through probabilistic intensity attenuation models: a Bayesian approach. J. Volcanol. Geotherm. Res 251, 149–157. doi: 10.1016/j.jvolgeores.2012.07.011
Azzaro, R., D’Amico, S., and Tuvè, T. (2016). Seismic hazard assessment in the volcanic region of Mt. Etna (Italy): a probabilistic approach based on macroseismic data applied to volcano-tectonic seismicity. Bull. Earthq. Eng. 14, 1813–1825. doi: 10.1007/s10518-015-9806-2
Azzaro, R., D’Amico, S., Tuvè, T., Mostaccio, A., and Scarfì, L. (2020). Terremoti con effetti macrosismici in Sicilia nel periodo gennaio 2014—Dicembre 2018. Quad. Geofis. 160, 1–62. doi: 10.13127/qdg/160
Bernardini, A., Giovinazzi, S., Lagomarsino, S., and Parodi, S. (2007). “The vulnerability assessment of current buildings by a macroseismic approach derived from the EMS-98 scale,” in Proceedings of 3rd Congreso National de Ingeniería Sismíca, (Girona: Asociación Espańola de Ingeniería Sismíca), 704–718.
Bernardini, A., Salmaso, L., and Solari, A. (2008). Statistical evaluation of vulnerability and expected seismic damage of residential buildings in the Veneto-Friuli area (NE Italy). Boll. Geofis. Teor. Appl. 49, 427–446.
Braga, F., Dolce, M., and Liberatore, D. (1982). “A statistical study on damage buildings and an ensuing review of the M.S.K.—76 scale,” in Proceedings of 7th European conference on Earthquake Engineering, (Athens).
Civico, R., Pucci, S., Nappi, R., Azzaro, R., Villani, F., Pantosti, D., et al. (2019). Surface ruptures following the 26 December 2018, Mw 4.9, Mt. Etna earthquake, Sicily (Italy): EMERGEO Working Group (Etna 2018). J. Maps 15, 831–837. doi: 10.1080/17445647.2019.1683476
Crowley, H., Colombi, M., Borzi, B., Faravelli, M., Onida, M., Lopez, M., et al. (2009). A comparison of seismic risk maps for Italy. Bull. Earthq. Eng. 7, 149–180. doi: 10.1007/s10518-008-9100-7
Cucci, L., D’Amico, S., De Martini, P. M., Nave, R., Pizzimenti, L., Azzaro, R., et al. (2019). Photographic Collection of the Coseismic Geological Effects Originated by the 26th December Etna (Sicily) Earthquake. Miscellanea, Vol. 48. Rome: INGV, 1–76.
D’Amico, S., Meroni, F., Sousa, M. L., and Zonno, G. (2016). Building vulnerability and seismic risk analysis in the urban area of Mt. Etna volcano (Italy). Bull. Earthq. Eng. 14, 1797–1811. doi: 10.1007/s10518-015-9804-4
De Natale, G., Petrazzuoli, S., Romanelli, F., Troise, C., Vaccari, F., Somma, R., et al. (2019). Seismic risk mitigation at Ischia island (Naples, Southern Italy): an innovative approach to mitigate catastrophic scenarios. Eng. Geol. 261:105285. doi: 10.1016/j.enggeo.2019.105285
Di Pasquale, G., and Orsini, G. (1997). “Proposta per la valutazione di scenari di danno conseguenti ad un evento sismico a partire dai dati ISTAT,” in Proceedings of 8th National Conference on Earthquake Engineering in Italy, Vol. 1, Taormina, 477–486.
Di Pasquale, G. and Orsini, G. (1998). “A probabilistic model for the assessment of the earthquake economic losses in Italy,” in Proceedings of the International Conference ‘Risk Analysis 98’, Valencia, Spain, 275–284.
Di Pasquale, G., Orsini, G., and Romeo, R. W. (2005). New development in seismic risk assessment in Italy. Bull. Earthq. Eng. 3, 101–128. doi: 10.1007/s10518-005-0202-1
Dolce, M., Prota, A., Borzi, B., da Porto, F., Lagomarsino, S., Magenes, G., et al. (2020). Seismic risk assessment of residential buildings in Italy. Bull. Earthq. Eng. doi: 10.1007/s10518-020-01009-5 [Epub ahead of print],
Giovinazzi, S., and Lagomarsino, S. (2001). “Una metodologia per l’analisi di vulnerabilità sismica del costruito,” in Proceedings of the X Congresso Nazionale “L’ingegneria Sismica in Italia”, Potenza-Matera.
Giovinazzi, S., and Lagomarsino, S. (2004). “Esposizione e vulnerabilità del costruito in provincia di Imperia,” in Italian meeting “Rischio sismico, territorio e centri storici”. Sanremo (IM), 2–3 July 2004, eds S. Lagomarsino and P. Ugolini (Milan: FrancoAngeli), 321–332.
Graziani, L., del Mese, S., Tertulliani, A., Arcoraci, L., Maramai, A., and Rossi, A. (2019). Investigation on damage progression during the 2016–2017 seismic sequence in Central Italy using the European Macroseismic Scale (EMS-98). Bull. Earthq. Eng. 17, 5535–5558. doi: 10.1007/s10518-019-00645-w
Grünthal, G. (1998). “European macroseismic scale 1998 (EMS-98),” in Cahiers du Centre Européen de Géodynamique et de Séismologie, Vol. 15, (Luxembourg: Conseil de l’Europe).
Iervolino, I. (2018). Editoriale. Il moto al suolo nel terremoto di Viagrande (CT). Progettazione Sismica 3, 5–8. doi: 10.1007/bf02906453
ISTAT (1991). 13° Censimento Generale Della Popolazione — Dati sulle Caratteristiche Strutturale Della Popolazione, Delle Abitazioni e Variabili Economiche. Available online at: http://www.istat.it/it/archivio/104317 (accessed Febrary, 2021)
ISTAT (2011). 15° Censimento Generale Della Popolazione e Abitazioni. Available online at: http://dati-censimentopopolazione.istat.it/Index.aspx?lang=it (accessed February 2021)
Kassaras, I., Kazantzidou-Firtinidou, D., Ganas, A., Kapetanidis, V., Tsimi, C., Valkaniotis, S., et al. (2018). Seismic risk and loss assessment in Kalamata (SW Peloponnese, Greece) from neighbouring shallow sources. Boll. Geof. Teor. Appl. 59, 1–26. doi: 10.4430/bgta0222
Kassem, M. M., Mohamed Nazri, F., and Noroozinejad Farsangi, E. (2020). The seismic vulnerability assessment methodologies: a state-ofthe-art review. Ain Shams Eng. J. 11, 849–864. doi: 10.1016/j.asej.2020.04.001
Lagomarsino, S., and Giovinazzi, S. (2006). Macroseismic and mechanical models for the vulnerability and damage assessment of current buildings. Bull. Earthq. Eng. 4, 415–443. doi: 10.1007/s10518-006-9024-z
Lagomarsino, S., Ottonelli, D., and Cattari, S. (2019). “Calibration of the macroseismic vulnerability model and derivation of the fragility curves for URM buildings,” in Proceedings of 38th National conference GNGTS, (Rome), 418–420.
Langer, H., Tusa, G., Scarfì, L., and Azzaro, R. (2016). Ground-motion scenarios on Mt. Etna inferred from empirical relations and synthetic simulations. Bull. Earthq. Eng. 14, 1917–1943. doi: 10.1007/s10518-015-9823-1
Lantada, N., Irizarry, J., Barbat, A. H., Goula, X., Roca, A., Susagna, T., et al. (2010). Seismic hazard and risk scenarios for Barcelona, Spain, using the Risk-UE vulnerability index method. Bull. Earthq. Eng. 8, 201–229. doi: 10.1007/s10518-009-9148-z
Locati, M., Camassi, R., Rovida, A., Ercolani, E., Bernardini, F., Castelli, V., et al. (2019). Database Macrosismico Italiano (DBMI15), versione 3.0. Rome: Istituto Nazionale di Geofisica e Vulcanologia.
Lucantoni, A., Bosi, V., Bramerini, F., De Marco, R., Lo Presti, T., Naso, G., et al. (2001). Il rischio sismico in Italia. Ing. Sismica 18, 5–36.
Meroni, F., Petrini, V., and Zonno, G. (2000). “Distribuzione nazionale della vulnerabilità media comunale,” in La Vulnerabilità Degli Edifici: Valutazione a Scala Nazionale Della Vulnerabilità Sismica Degli Edifici Ordinari, ed. A. Bernardini (Roma: GNDT-CNR), 105–131.
Meroni, F., Squarcina, T., Pessina, V., Locati, M., Modica, M., and Zoboli, R. (2017). A damage scenario for the 2012 Northern Italy earthquake and its economic losses assessment. Int. J. Disaster Risk Sci. 8, 326–341. doi: 10.1007/s13753-017-0142-9
Meroni, F., Zonno, G., Azzaro, R., D’Amico, S., Tuvè, T., Oliveira, C. S., et al. (2016). The role of the urban system dysfunction in the assessment of seismic risk in the Mt. Etna area (Italy). Bull. Earthq. Eng. 14, 1979–2008. doi: 10.1007/s10518-015-9780-8
Mosoarca, M., Onescu, I., Onescu, E., Azap, B., Chieffo, N., and Szitar-Sirbu, M. (2019). Seismic vulnerability assessment for the historical areas of the Timisoara city, Romania. Eng. Fail. Anal. 101, 86–112. doi: 10.1016/j.engfailanal.2019.03.013
Mota de Sá, F., Ferreira, M. A., and Oliveira, C. S. (2016). QuakeIST§earthquake scenario simulator using interdependencies. Bull Earthq. Eng. 14, 2047–2067. doi: 10.1007/s10518-016-9884-9
QUEST Working Group (2019). Il Terremoto Etneo del 26 Dicembre 2018, MW4.9: Rilievo Degli Effetti Macrosismici. Rapporto INGV n. 1 del 06/02/2019. Rome: INGV, 9. doi: 10.5281/zenodo.2558168
Riedel, I., Guéguen, P., Dalla Mura, M., Pathier, E., Leduc, T., and Chanussot, J. (2015). Seismic vulnerability assessment of urban environments in moderate-to-low seismic hazard regions using association rule learning and support vector machine methods. Nat. Hazards 76, 1111–1141. doi: 10.1007/s11069-014-1538-0
Rotondi, R., and Zonno, G. (2004). Bayesian analysis of a probability distribution for local intensity attenuation. Ann. Geophys. 47, 1521–1540. doi: 10.4401/ag-3356
Selva, J., Acocella, V., Bisson, M., Caliro, S., Costa, A., Della Seta, M., et al. (2019). Multiple natural hazards at volcanic islands:a review for the Ischia volcano (Italy). J. Appl. Volcanol. 8:5.
Sigbjörnsson, R., Zonno, G., and Oliveira, C. S. (2016). The European project UPStrat-MAFA: Urban disaster prevention strategies using MAcroseismic Fields and FAult Sources. Bull. Earthq. Eng. 14:357.
Sousa, M. L., and Campos Costa, A. (2016). Evolution of earthquake losses in Portuguese residential building stock. Bull. Earthq. Eng. 14, 2009–2029. doi: 10.1007/s10518-015-9809-z
Spence, R., and Le Brun, B. (2006). Special issue: earthquake scenarios for European cities – the RISK-UE project. Bull. Earthq. Eng. 4, 323–339. doi: 10.1007/s10518-006-9020-3
Tusa, G., Langer, H., and Azzaro, R. (2020). Localizing Ground-Motion Models in volcanic terranes: shallow events at Mt. Etna, Italy, revisited. Bull. Seism. Soc. Am. 110, 2843–2861. doi: 10.1785/0120190325
Working Group (2013). Gruppo di Lavoro Incaricato Della Definizione Dello Scenario di Riferimento per il Piano di Emergenza dei Campi Flegrei per il Rischio Vulcanico. Rapporto Finale. Available online at: http://www.lavoripubblici.regione.campania.it/joomla/jdownloads/Campi%20Flegrei/rapporto_gdl_campiflegrei_31gen2013.pdf (accessed February, 2021).
Zonno, G., Oliveira, C. S., Ferreira, M. A., Musacchio, G., Meroni, F., Mota-de-Sa, F., et al. (2010). Assessing seismic damage through stochastic simulation of ground shaking: the case of the 1998 Faial earthquake (Azores Islands). Surv. Geophys. 31, 361–381. doi: 10.1007/s10712-009-9091-1
Zonno, G., Rotondi, R., and Brambilla, C. (2009). Mining macroseismic fields to estimate the probability distribution of the intensity at site. Bull. Seism. Soc. Am. 99, 2876–2892. doi: 10.1785/0120090042
Zuccaro, G., and De Gregorio, D. (2019). Impact assessments in volcanic areas – the Vesuvius and Campi Flegrei cases studies. Ann. Geophys. 62:VO02. doi: 10.4401/ag-7827
Keywords: volcano seismicity, macroseismic survey, intensity data, seismic scenario, building vulnerability, damage scenario, Mt. Etna
Citation: Pessina V, Meroni F, Azzaro R and D’Amico S (2021) Applying Simulated Seismic Damage Scenarios in the Volcanic Region of Mount Etna (Sicily): A Case-Study From the MW 4.9, 2018 Earthquake. Front. Earth Sci. 9:629184. doi: 10.3389/feart.2021.629184
Received: 13 November 2020; Accepted: 09 April 2021;
Published: 10 May 2021.
Edited by:
Jorge Miguel Gaspar-Escribano, Polytechnic University of Madrid, SpainReviewed by:
Flora Faleschini, University of Padua, ItalyGiulio Zuccaro, University of Naples Federico II, Italy
Mario Andres Salgado-Gálvez, International Center for Numerical Methods in Engineering, Spain
Copyright © 2021 Pessina, Meroni, Azzaro and D’Amico. This is an open-access article distributed under the terms of the Creative Commons Attribution License (CC BY). The use, distribution or reproduction in other forums is permitted, provided the original author(s) and the copyright owner(s) are credited and that the original publication in this journal is cited, in accordance with accepted academic practice. No use, distribution or reproduction is permitted which does not comply with these terms.
*Correspondence: Vera Pessina, dmVyYS5wZXNzaW5hQGluZ3YuaXQ=