- 1EPICentre, Department of Civil, Environmental and Geomatic Engineering, University College London, London, United Kingdom
- 2Department of Civil Engineering, University of Moratuwa, Moratuwa, Sri Lanka
The failure of hospitals in recent tsunami have caused extensive social and economic losses. A simple but quantitative approach is required to assess the resilience of healthcare systems to tsunami, which relates not only to hospital building integrity, but also to maintaining hospital functionality. This paper proposes a new tsunami relative risk index (TRRI) that quantifies the impact of tsunami on critical units, (e.g. Intensive Care Unit, Maternity Ward, etc) in individual hospitals, as well as the impact on service provision across a network of hospitals. A survey form is specifically developed for collecting of field data on hospitals for the TRRI evaluation. In its current form TRRI is designed for hospital buildings of reinforced concrete construction, as these are the building types most commonly used worldwide for housing critical units. The TRRI is demonstrated through an application to three hospitals located along the southern coast of Sri Lanka. The TRRI is evaluated for three potential tsunami inundation events and is shown to be able to identify issues with both the building and functional aspects of hospital critical units. Three “what-if” intervention scenarios are presented and their effect on the TRRI is assessed. Through this exercise, it is shown that the TRRI can be used by decision makers to simply explore the effectiveness of individual and combined interventions in improving the tsunami resilience of healthcare provision across the hospital system.
Introduction
Hospitals and healthcare facilities are vital assets to communities and play a key role in recovery from natural disasters. During emergencies, hospital units must provide uninterrupted critical services such as emergency care to the injured, laboratories, blood banks, ambulances, pharmacies and immunization services to prevent outbreaks of diseases (WHO, 2010). In recognition of the critical role played by hospitals in disasters, the Hyogo Framework for Action (UNISDR, 2005) and subsequent Sendai Framework (UNDRR, 2015), have as one priority the achievement of safe and resilient hospitals through structural, non-structural and functional risk prevention. This has resulted in major global initiatives for hospital safety and several guidelines have been issued for the design, assessment and strengthening of hospital buildings for different hazards (FEMA, 1997; FEMA, 2003; FEMA, 2007; PAHO, 2008; WHO, 2015). However, it is only relatively recently that tsunami design codes have been issued, e.g., FEMA 55 (FEMA, 2005), MLIT 2570 (MLIT, 2011), ASCE 7–16 Standard (ASCE, 2017a). These have not been implemented in the design of most healthcare facilities worldwide, and failures of hospitals in recent tsunami have caused extensive social and economic losses, (e.g. Kirsch et al., 2010; EEFIT, 2011). One means of disaster management for reducing life loss in tsunami is evacuation to sites outside the inundation zone or to upper levels in buildings considered strong enough to withstand the tsunami inundation (e.g. MHNI, 2015). Clearly, the vulnerable nature and reduced mobility of hospital patients makes evacuation difficult. Moreover, evacuation is only viable for locations that have tsunami warning systems in place and which are at a significant distance from the tsunami source.
Despite not being designed for tsunami, most hospitals are built to higher standards than normal residential buildings and present an enhanced resistance to natural hazards that may allow them to withstand small tsunami inundation without structural damage. However, hospital resilience relates not only to hospital building integrity, but also to maintaining hospital functionality. The latter depends heavily on the integrity of both non-structural elements and the lifelines supporting the hospital operation, such electricity, water and communications. The 2011 Tohoku tsunami presented several examples of hospitals that withstood the tsunami but had compromised functionality and ability to care for patients in the aftermath due to loss of lifelines and back-up systems in the tsunami inundation (EEFIT, 2011, EEFIT, 2013; ASCE, 2017b).
Hospitals can be considered as part of a network of healthcare provision, where only some parts of the network can be relied upon for the provision of any particular healthcare service, (e.g. not all hospitals have a trauma unit). As tsunami can affect large tracts of the coastline, they can damage several hospitals and/or supporting lifelines simultaneously. This not only disrupts the provision of healthcare locally but can result in the loss of particular healthcare services across large parts of the network, (e.g. if all hospitals with trauma units are affected over an extended region). Such scenarios result in affected people having to travel large distances and wait for excessive times to obtain specific treatments.
The inherent organisational complexity of hospitals, and the interactions and independencies of healthcare units makes the tsunami risk assessment of hospital services a challenging task. To date, several studies have investigated the performance of individual hospital buildings for different natural hazards using advanced engineering analysis, (e.g. Casarotti et al., 2009; Di Sarno et al., 2011). However, the use of advanced engineering analysis for the risk assessment of several hospitals is prohibitively expensive in terms of human and computational resources, as hospitals are typically composed of several buildings, built at different times and which do not follow a standard design. Furthermore, these studies rarely consider lifelines and back-up systems explicitly. As an alternative, several hospital safety indices (PAHO, 2008; WHO, 2015) and hospital safety checklists (WHO, 2008; WHO, 2010) have been proposed that offer rapid diagnostic tools for use by policy makers and hospital managers. These indices and checklists provide a qualitative estimate of the risk to hospitals from a set of hazards, i.e., natural and man-made hazards. The indicators can be applied to assess either single healthcare facilities or networks of hospitals, and generally account for the potential loss of critical infrastructure lifelines. These can be used to identify potential problem areas and for the prioritization of interventions to reduce the disaster risk to hospitals. However, these methods present two major shortcomings: 1) lack of quantitative approaches to support the assessment of the relative risk associated with the hospital facilities; and 2) little consideration of the nature of single hazards, (e.g. tsunami) and their interactions and interdependencies when impacting hospital infrastructure.
In order to improve both the safety and resilience of healthcare systems to tsunami, a simple but quantitative approach is required for assessing tsunami risk to healthcare services distributed across networks of hospitals. Such an approach needs to focus on healthcare service continuity, and go beyond hospital building integrity to consider the integrity of the lifelines and back-up systems that support the service provision and hospital functionality. This paper presents a new tsunami relative risk index
Although the absence of numerical structural modeling to support the analysis can be seen as a limitation of this approach, the proposed relative risk index is based on objective engineering principles that are reflected in equations (and not merely expert opinions). The aim of using such an index is to be able to quickly assess a large portfolio of hospital facilities, identifying aspects of the facilities that require further detailed assessment, thus directing potential numerical modeling. For the case-study presented here, the inundation depths for the “what-if” intervention scenarios are based on limited onshore inundation scenarios based on the 2004 Indian Ocean Tsunami event, rather than on probabilistic data, since the latter is not available for Sri Lanka. Nevertheless, these scenarios give insight into the relative effectiveness of various mitigation measures that can be adopted by hospital administrators.
Methodology
The proposed Tsunami Relative Risk Index
The proposed
where
Building Relative Risk Index, RRIbldg
Post-tsunami reconnaissance studies provide a spectrum of tsunami-induced damage mechanisms in buildings, that result from the actions of hydrodynamic forces, buoyancy, impact from floating debris and foundation scouring (EEFIT, 2006). Figure 1 shows a typical load time series as a tsunami passes a building. Initially, as the front of the tsunami arrives and passes the building, there will be a sharp rise in force, which will then plateau and be maintained for several minutes, depending on the period of the wave and the proximity of the building to the shoreline. During this phase, there may be several short sharp spikes in loading from debris impacting with the building. The capacity of the building to withstand the tsunami loading will decrease during the course of inundation due to buoyancy forces reducing axial compression in vertical elements (Del Zoppo et al., 2020), and due to scour undermining the foundations. The impact of scour around the building can also have a considerable impact on the structural capacity of the building, by exposing the foundations and potentially leading to local collapse of vertical structural elements when local inundation levels increase, or under the return flow of the tsunami toward the sea.
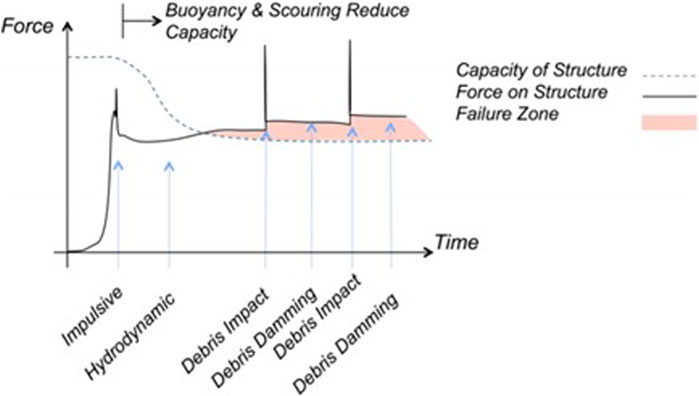
FIGURE 1. Typical qualitative time series of loading on a building during tsunami inundation (Yeh et al., 2014).
The relative risk index associated with the integrity of the hospital building, indicated as RRIbldg, looks to evaluate, in a simple way, the performance of a building subjected to the three main tsunami loading components, i.e., hydrodynamic loading, scouring and debris impact, as follows:
where RRIstruct. represents the ability of the structural system to resist the overall tsunami hydrodynamic force (including debris damming), RRIscour represents the ability of the building foundation system to resist scouring for the expected inundation, and RRIdebris represents the capacity and redundancy of the structure to resist debris impact from movable objects located within the hospital facility and in the surrounding areas. It is noted that each RRI component of RRIbldg takes values between 0 (no risk) and 1 (high risk).
A main difference between RRIbldg and other established tsunami building vulnerability indices for tsunami, is that RRIbldg is based on a simplified assessment of the building failure and damage mechanisms, evaluated using physics and engineering based formulations. This is significantly different from, for example, the well-established PTVA relative vulnerability index of Papathoma and Dominey-Howes. (2003) and Dall’Osso et al. (2016), which is constructed from a set of characteristics of the building that are thought to affect its tsunami resistance, combined through a weighting based on expert judgment.
Index for Structural Performance Under Hydrodynamic Loading RRIstruct
Tsunami hydrodynamic forces typically impact the lower floors of a building and generate large shear forces on the vertical elements of the structure, (i.e. the columns). Recent studies, (e.g. Alam et al., 2017; Petrone et al., 2017), have shown that in reinforced concrete (RC) structures this can lead to shear failure of columns at the ground storey, which precipitates global collapse if no strengthening measures are adopted. This failure mechanism is assumed in the development of the relative risk index for evaluating structural performance under hydrodynamic loading,
The tsunami load on a structure
where
where
where
Index for Structural Stability Under Scour, RRIscour
In the aftermath of the 2004 Indian Ocean Tsunami in Sri Lanka, one of the main damage mechanisms observed for multi-story building was the undermining of foundations due to the scouring of sandy soils at the corners of buildings (Dias et al., 2006). This occurred for relatively low tsunami inundation depths, (i.e. 3 m) and resulted in the collapse of end bays of several RC buildings, such as schools. Such failure mechanisms have also been observed in several past events, with RC buildings composed of few frames and with shallow foundations being seen to be the most susceptible to this failure type (EEFIT, 2006; EEFIT, 2011; ASCE, 2017b).
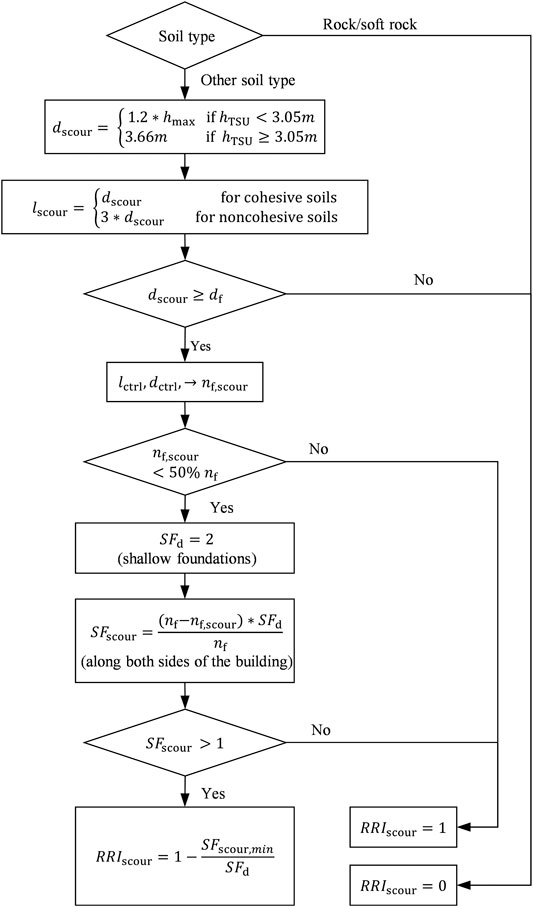
Tsunami design guidelines (ASCE, 2017a) assume that foundations on rock or other non-erodible materials are at no risk of scour. For other types of soil, the scour depth
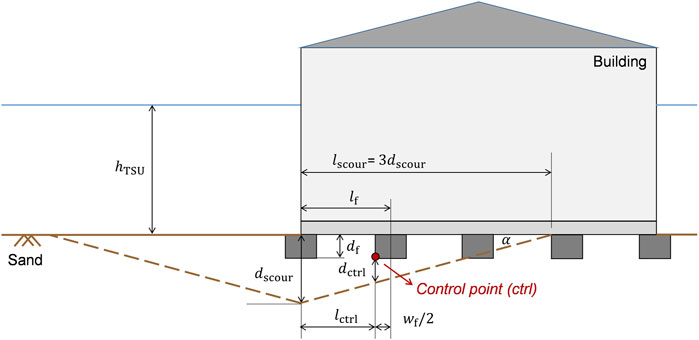
FIGURE 2. Example sketch illustrating the effects around building with shallow foundations on noncohesive soils and the calculations for the second footing from the left corner.
This approach requires soils to be classified as cohesive or non-cohesive. No indication is however provided in the ASCE 7–16 Standard or accompanying commentary, as to the procedure to be followed for this classification. For the RRIscour it is proposed that a simple soil analysis, (i.e. particle size distribution analysis through sieving) be used as the basis for the classification, whereby: 1) Non-cohesive or granular soils, (e.g. gravels and sands), defined as those with less than 50% of fines content as per ASTM D2487–17 (USCS)–if the fines content is higher than 12% and less than 50%, then the soil is coarse grained though controlled by the fine soil nature, i.e., non-cohesive; 12% fines content is usually considered as a reference percentage below which soils are defined as purely granular; 2) Cohesive soils, (e.g. silts and clays), defined as those with more than 50% of fines content. If soil analysis data at the building site are not available, simple assumptions should be made to classify the soils based on local knowledge.
The calculation of
For simple pad foundations, the overall design load-bearing capacity of the system can be estimated by multiplying the ultimate bearing capacity of individual pad foundations
where
when
When subjected to scour, the load-bearing capacity of the foundation system is reduced and is estimated as that deriving solely from those foundations that have not been affected by scour, i.e.,:
In Eq. 13,
Having evaluated the reduced design safety factor, RRIscour can be determined following the flowchart presented in Figure 3, and from Eq. 15:
where
Index for the Capacity and Redundancy of the Structure to Resist Debris Impact, RRIdebris
Generally, tsunamis transport a large volume of debris, including trees, cars, containers, utility poles and wood-frame houses. The perimeter structural components that are oriented perpendicular to the direction of the flow are at the greatest risk of impact. For instance, the loss of a perimeter column may compromise the ability of a structure to support gravity loads. The ASCE 7–16 Standard (ASCE, 2017a) provides a framework for the calculation of the impact forces determined by debris. This includes the effects of the impact by floating wood poles, logs and vehicles, which should be taken into account when tsunami depths are larger than 0.9 m. RRIdebris is presented in this paper for the common case where debris consists mainly of logs (or similar). However, by changing the debris impact loads, RRIdebris can be modified to account for potential impacts from shipping containers, ships, barges and other large objects. Such sized debris should be considered if the hospital is in close proximity to a port or container yard.
In the RRIdebris evaluation, the maximum instantaneous debris impact force (Fni) is first calculated using the impulse-momentum based formulation in the ASCE 7–16 Standard:
where
The debris impact of a log is a dynamic event. However, an equivalent static approach can be used by multiplying the debris force in Eq. 17 by a dynamic response factor
Considering an exterior column of a RC building, the natural period of the column (Tcol) can be estimated assuming fixed end boundary conditions:
where
The force given by Eq. 19 should not exceed the force from the alternative simplified impact load
where
If
The redundancy present in the structure can be beneficial to the stability of the building. In the context of RC structures, RRIdebris is calculated by taking the ratio between the number of impacted columns over the total number of columns present in the seaward side of the building. As the number of impacted columns cannot be predicted, it is assumed that two vertical columns (probably the corner columns) located within the seaward face of the building might fail due to debris impact. This assumption is based on observations that debris impact can be particularly common and severe for exposed corner columns of frames (EEFIT, 2006). Therefore, RRIdebris is calculated as follows:
Index Representing Risk to Critical Unit Functionality, RRIfunct
RRIfunct looks to represent the risk to continued function of a critical unit after a tsunami. The index is based on the location of the critical unit within the hospital complex with respect to the tsunami inundation. It is assumed that if the critical unit is inundated, the resulting damage to non-structural elements and medical equipment may prevent the unit from being fully operational in the aftermath of the event. RRIfunct is therefore binary, taking a value of zero if the critical unit lies outside the inundation zone or is located in a storey of the building above the local inundation depth, or 1 otherwise.
Index Representing Tsunami Risk to Lifeline Back-Up Systems, RRIbcs
The loss of essential lifelines such as power, water, wastewater, natural gas, can severely limit the functionality of hospitals and their critical units. For instance, one of the case-study hospitals presented later in the report, i.e., the Mahamodara Teaching Hospital, suffered the failure of backup generator, water supply and sewer systems when it was inundated during the 2004 Indian Ocean Tsunami (Harlan, 2016).
From PAHO (2008) and WHO (2015) it is possible to identify eight main lifeline systems that are required to ensure the functionality of hospital critical units: Power (P), Air conditioning (HVAC), Telecommunications (TLC), Water Supply (WS), Fire Protection (FP), Waste Water (WW), Medical Gas (MG) and Fuel and Gas reserves (FG). Where national or regional lifelines are compromised, as can be the case in a large tsunami, the presence of back-up systems can provide immediate continuity in the aftermath of a disaster, for a few hours or even days. Hence, the proposed index RRIbcs considers whether the back-up systems to lifelines needed for the functioning of critical units are 1) located within the hospital premises and 2) whether they are likely to be damaged under the expected inundation, as follows:
where
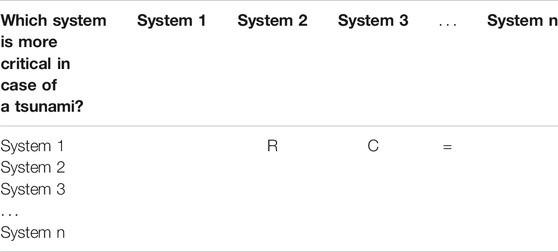
Evaluation of the back-up system weights also accounts for the local context. The weights are determined by from a ranking of the back-up systems in order of importance for the continued functioning of the critical unit being assessed. This ranking is determined from a structured expert elicitation technique termed paired comparison. The paired comparison method is well established, and although simple, it is reproducible, accountable and neutral. In this method, participants are invited to complete a ranking exercise individually without being influenced by an in-depth prior discussion of how critical each back-up system is. Participants are invited to compare every two back-up systems (one in a row and another in the column in the table) and using their judgment to identify which is the more important for the continued functioning of critical hospital units. If they believe the system in the row is more important than the one in the column, they enter “R” in the relevant box. If they believe the contrary is true then “C” is entered into the box. Else if they believe both the back-up systems are of equal importance, “ = ” is entered into the relevant box (Table 1).
The participants’ opinions are treated with equal weights. Only the participants who are found to provide very inconsistent responses, such that they appear statistically random are excluded, (i.e. consistent answers are those for which if A > B and B > C then A > C is true). The paired comparison responses are then analyzed using the probabilistic inversion technique, as described in Kraan and Bedford (2005) and implemented in the free-software “UNIBALANCE” (Macutkiewicz and Cooke, 2006). This produces a mean score for each back-up system as well as the standard deviation around this mean score, which represents the level of disagreement within the expert group. These mean scores are adopted as the weights for the different back-up systems in the RRIbcs calculation.
The level of agreement among the participants is examined in three different ways. Firstly, the degree of agreement is estimated by measuring how closely the pattern of the participants pairwise preferences match. Secondly, the degree of concordance is examined by measuring how similar the rank orders are among the group of participants. Thirdly, a chi-square test is used to check whether the group ranking preferences are made at random. Here, p-values below 0.05 indicate that the group ranking preferences have a structure and are not random. By contrast, p-values above 0.05 suggest a lack of consensus within the group regarding the ranking preferences.
TRRI Rapid Visual Survey (RVS) Form
The TRRI Rapid Visual Survey (TRRI-RVS) form is developed to assist surveyors in assessing existing health facilities in terms of the integrity of hospital buildings, lifelines and back-up systems that support the service provision and hospital functionality. The TRRI-RVS form is presented in the Appendix (see Supplementary Material). The Rapid Visual Survey consists of two sections:
1) Hospital Profile (“Form H”). Through this form, surveyors collect general information about 1) the hospital location; 2) hospital type and hospital capacity, e.g., catchment population; 3) tsunami evacuation plans and disaster response plans; 4) hospital building locations within the healthcare facility; 5) location of critical hospital units within buildings, e.g., ICU, Labor Rooms, Maternity Wards, Pediatric Wards, Operating Theaters; and 6) presence and location of back-up supply systems.
2) Building Structural and Non-Structural Assessment (“Form B”). Through this form, surveyors gather information about: 1) the hospital building, e.g., number of storeys, year of construction, inter-storey height, and location of critical units; 2) the building surroundings, e.g., presence of containers, perimeter walls and vegetation; 3) building layout and elevation; 4) structural and non-structural systems; 5) The dimensions and structural details of the main structural elements, e.g., RC columns. The technical information is gathered using equipment such as rebar detector, laser distance meter, tape measure, and 3D cameras.
The TRRI-RVS form is specifically developed for collecting the attributes of hospital surroundings, buildings, critical units, lifeline and back-up systems required to evaluate TRRI. This form is used in the survey of Sri Lankan hospitals used to test the TRRI in this paper.
Case-Study Application: Hospitals in Sri Lanka Southern Province
Sri Lanka provides universal healthcare to its people through an established and robust healthcare system. Thanks to this, no major disease outbreaks occurred after the 2004 tsunami (Carballo et al., 2005), which hit two-thirds of the coastline affecting one million people. However, over 17% of all healthcare institutions were severely damaged, causing an estimated £40 M worth of losses (Komesaroff and Sundram, 2006). Over the last 15 years some of the affected health infrastructure of Sri Lanka has been re-built further inland, but some significant hospitals still lie within 2–3 km from the coast and are at potential threat from tsunami inundation. The Sri Lankan Ministry of Health (MoH) in collaboration with World Health Organization (WHO) has been working to strengthen the health sector for emergencies, through the development of a comprehensive national disaster management plan (WHO, 2015). However, this plan comprises capacity building in emergency management and health financing, and does not yet look at the structural, non-structural and functional performance of hospitals in natural hazards. Furthermore, as Sri Lanka is threatened by distal tsunami generated either at the Sunda trench or Makran Subduction zone, the main disaster management approach considered to date is the evacuation of hospitals (DPRD, 2015).
In this case study application, three hospitals in Galle, Matara and Hambantota Districts in Sri Lanka are selected for testing whether the TRRI can be used to 1) identify weaknesses in the systems supporting the functionality of critical units in individual hospitals, and 2) as a tool for use in prioritizing interventions for improved functional resilience across a series of hospitals.
The three hospitals selected are the District General Hospital (DGH) in Matara and the base Hospitals (BH) in Balapitiya and Tangalle. These are chosen as they are key hospitals for the Southern Province, geographically distributed across the Province (Figure 4) and all located within 400 m from the coast (base Hospitals) or a litte further (approx. 600 m) but near a waterway that discharges into the sea (DGH Matara). The case study application focuses on the five critical units that were indicated as the most important in the case of a disaster by the Disaster Preparedness and Response Division (DPRD) of the Sri Lankan Ministry of Health, Nutrition and Indigenous Medicine. These are: 1) Intensive Care Units (ICU); 2) Operating Theaters (OT); 3) Labor Rooms (LR); 4) Maternity Wards (MW); and 5) Pediatric Wards (PW). In the three hospitals, 19 buildings were found to house these critical units, and were surveyed by a joint team from UCL and University of Moratuwa in April 2019 using the form described in TRRI Rapid Visual Survey (RVS) Form.
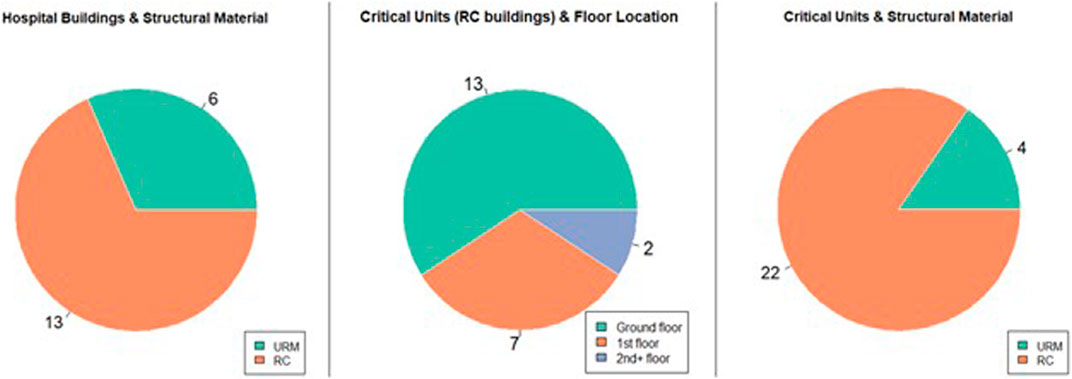
Thirteen of the buildings are reinforced concrete moment resisting frame structures of 2–4 storeys. These house 85% of all the critical units in these three hospitals. The remaining six buildings are one-storey load-bearing unreinforced masonry (URM) structures (Figure 5). These structures are highly vulnerable to tsunami and would not be expected to be in an operational state following tsunami inundation. Hence, this assessment concentrates on the assessment of the 22 critical units housed in the RC buildings. The survey of these buildings highlighted that most of the critical units are located at the ground floor and are therefore at high risk from damage if the tsunami inundation reaches the building. The soil type at each hospital is determined as non-cohesive from observational and borehole data analysis. Hence all buildings are susceptible to scour in this case study application. None of the buildings assessed were located near ports and harbors, and are therefore not exposed to impact from containers, ships or barges. Consequently, the assumption of logs as debris is appropriate for this case study.
The surveys showed the HVAC to be a local system of air conditioning units attached to the walls of critical units. Hence, they will continue to function if the critical unit is not inundated. The location of TLC systems is assumed to be in the hospital administrative offices. This is because Hospital Directors and administrative staff typically have access to the emergency systems for communicating with the national and district-level healthcare networks. Where back-up systems were not recorded during the field survey it is assumed they are missing. As this is detrimental to functional resilience, these back-up systems are still included in the calculation of RRIbcs and contribute to increasing its value. For example, no fire alarms, extinguishers or other fire protection systems were observed in any of the assessed buildings, hence a value of FP = 1 is applied for all buildings within the RRIbcs calculation.
Hazard Scenarios
A probabilistic tsunami hazard analysis for the Indian Ocean by (Burbidge et al., 2009) shows that tsunami wave heights along the Sri Lankan coast could reach between 2.9–3.7 m for a return period of 2000 years, with the south-east coast being associated with the highest hazard. However, this study does not provide the associated probabilistic tsunami onshore inundation depths (that would typically exceed the above) which would be what is required for the TRRI assessment.
A tsunami hazard map for Sri Lanka with associated inundation information was published by the Disaster Management Center (DMC, 2012), part of the Ministry of Public Administration and Disaster Management. This map is however not based on a probabilistic tsunami hazard assessment, but on deterministic inundations predicted by a numerical simulation of the 2004 Indian Ocean Tsunami by (Wijetunge, 2009). The DMC map identifies three distinct tsunami hazard zones along the Sri Lankan coast: 1) low hazard, where the inundation depth,
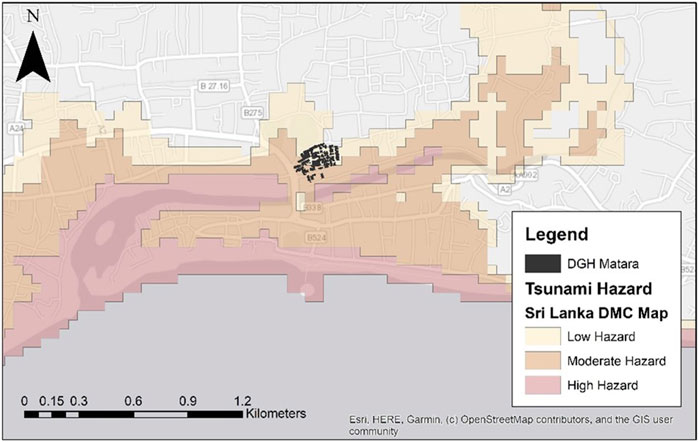
FIGURE 6. Tsunami hazard map for the city of Matara (DMC, 2012).
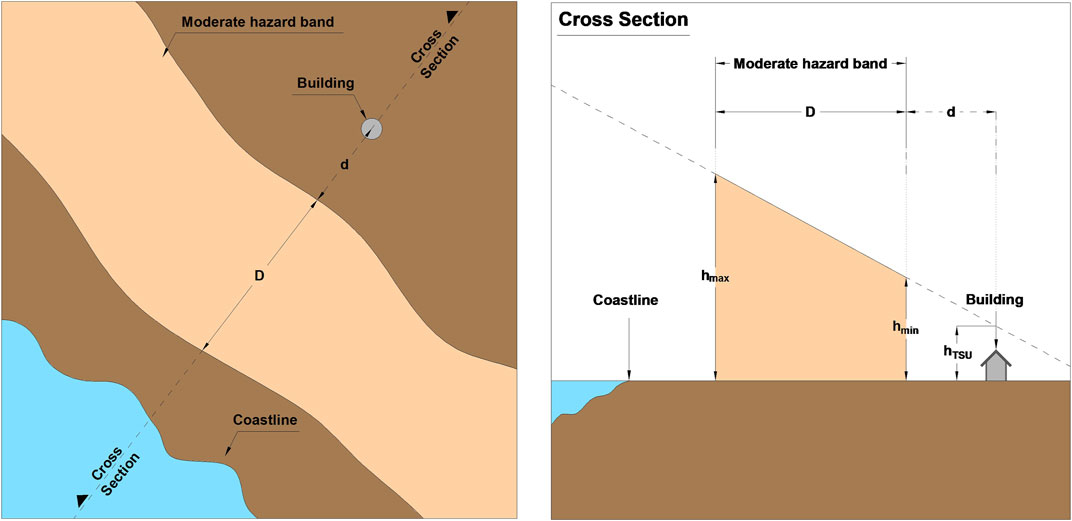
In the absence of probabilistic tsunami onshore inundation information and a detailed topographical map, this study employs a simplified approach for the development of three tsunami inundation scenarios to check the performance of TRRI for different hazard intensities. The first realization, indicated as Hazard Level 1, is derived directly from the DMC map and represents the 2004 Indian Ocean Tsunami. It should be noted that the DMC map only defines distinct inundation depths and geographical boundaries for the moderate tsunami hazard zone. Hence, this zone is adopted as a reference for estimating the inundation depth at the hospital building locations. This is done by first drawing a transect indicating the shortest distance between the coast and the building being assessed. A linear relationship is assumed to describe the change in inundation depth along the transect between the seaward and inland boundaries of the moderate hazard zone, as shown in Figure 7. The inundation depth at the building location
where
The second and third tsunami inundation scenarios, indicated as Hazard Levels 2 and 3, are derived by increasing the inundation depths defining the DMC moderate hazard zone by 1.5 m and 3 m, respectively. By so doing, more severe inundations are produced at the hospital sites in terms of depth and inland extent, helping to demonstrate the methodology. A limitation of such an approach is that the hazard levels do not reflect a specific probability of occurrence. Table 2 lists the resulting tsunami inundation depths for each buildings.
Weighting of Back-Up Systems for RRIbcs
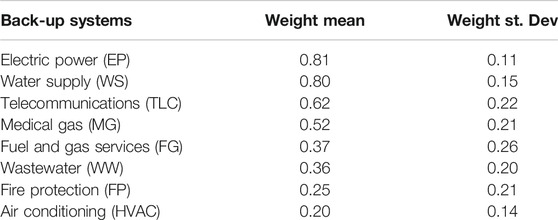
A small pool of five hospital administrators (doctors) from Sri Lanka participated in the paired comparison of back-up systems for the evaluation of RRIbcs. Table 3 presents the resulting mean scores, standard deviation, overall ranking and weights for the back-up systems. The p-values of individual participants is found to be less than 0.05, indicating that no participant randomly ranked the back-up systems. The high values of coefficients of concordance (0.73) and agreement (0.47) suggest an overall agreement among the participants regarding the position of each back-up system in the ranking order. The p-value below 0.05 obtained for the chi-square test also indicates that the group ranking preferences have a structure and are not random. In particular, the water supply and electric power systems have the two highest best estimate ranking scores, while fire protection and air conditioning the lowest.
Results of the Assessment of Critical Units for Sri Lankan Hospitals
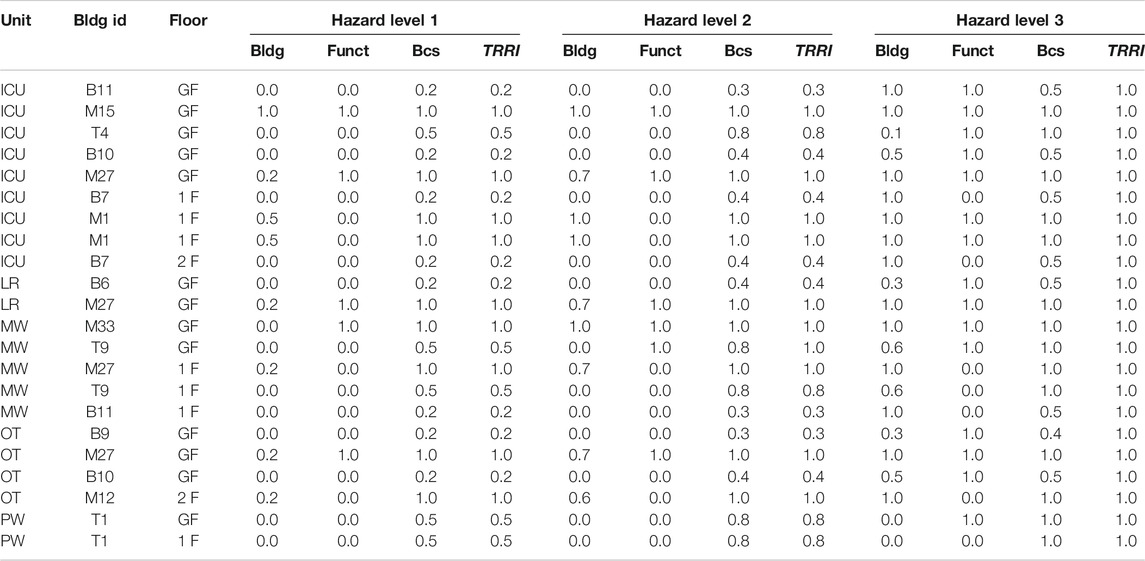
Table 4 presents the values of TRRI calculated for the five critical units of the three case-study hospitals, for the three hazard scenarios presented in Hazard Scenarios. Under Hazard Level 1, none of the buildings containing critical units in BH Balapitiya and BH Tangalle are subjected to tsunami inundation. Despite this, the
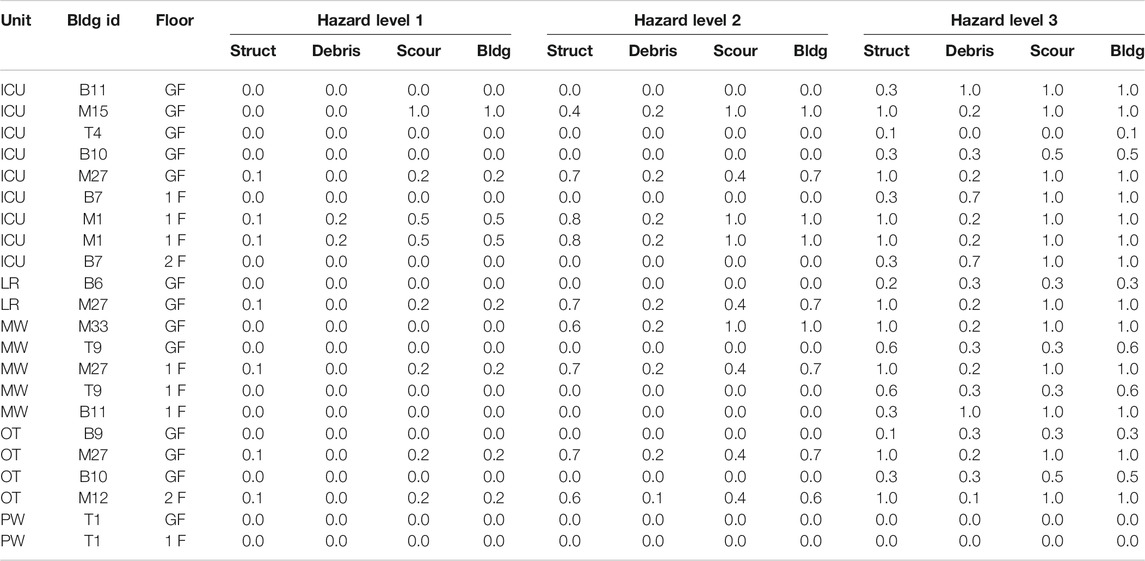
Under Hazard Level 2, BH Balapitiya remains outside the inundation zone, but building T9 of BH Tangalle is subjected to a small inundation of 0.29 m depth. This inundation is insufficient to cause structural damage in this building but does compromise the functionality of one of the Maternity Wards, as this is located at the ground floor of T9. Moreover, all other critical units in BH Tangalle are seen to be at significant risk of functionality loss from damaged back-up systems. Hazard Level 2 imposes a larger inundation depth at DGH Matara, which results in three predicted building collapses
When subjected to Hazard Level 3, all critical hospital units would likely be non-operational. As listed in Table 5, all hospital units in DGH Matara are located within buildings at significant risk of structural damage and severe scouring at the foundations. At BH Balapitiya, although power, water supply and medical gases would continue to function
The results of the analysis of TRRI for the three hospitals and Hazard Levels shows a high vulnerability of back-up systems and critical units under low levels of tsunami inundation. This is caused by most being located on the ground floor of inundated buildings (see Table 4). These two components of TRRI are seen to dominate whether or not critical units will be operational after a “small to moderate” tsunami event (Hazard Levels 1 and 2). Note that TRRI = 1.0 for nearly half of the units (45% of the total) at Hazard Level 2, although
What-If Scenarios
Given the findings in Results of the Assessment of Critical Units for Sri Lankan Hospitals, this section presents a comparison of the effectiveness of three possible interventions in reducing the immediate loss of operationality of critical units after a tsunami. The intervention effectiveness is examined by running “what-if” scenarios, wherein the intervention is applied to all buildings and TRRI is recalculated. The effectiveness of the intervention on each critical unit type is represented as the ratio between the number of functional units for the intervention and baseline scenarios (Note: the baseline is the no-intervention scenario). The “what-if” scenarios considered are:
• What-if 1 (WI1) consists in the relocation of back-up systems to places that are not affected by the tsunami inundation, e.g., by either relocating or elevating the system to be outside the inundation zone. Within this scenario, any missing back-up system, other than Fire Protection and HVAC (as these are co-located with the critical unit) are installed.
• What-if 2 (WI2) consists in the relocation of critical units one storey up from their current position in the building that houses them. Where the unit is already located in the uppermost floor of the building, it is assumed to remain in its current position.
• What-if 3 (WI3) combines the effects of adopting WI1 and WI2, i.e., both relocation of back-up systems and critical units. In this case Fire Protection and HVAC are also installed if missing, and are assumed to be co-located with the newly positioned critical units.
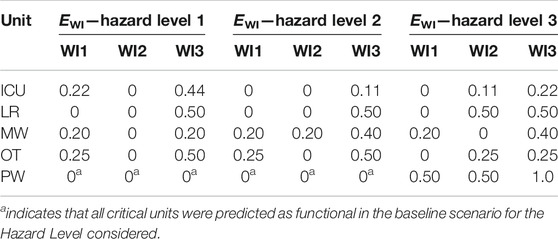
Table 6 presents the TRRI resulting from implementation of the three “what-if” scenarios and the baseline (no intervention) scenario for the three Hazard Levels. Table 7 summarizes the effectiveness of each “what-if” scenario in increasing the number of operational critical units after a tsunami, as compared to the baseline scenario. In Table 7, the effectiveness of the “what-if” scenario, indicated as
where
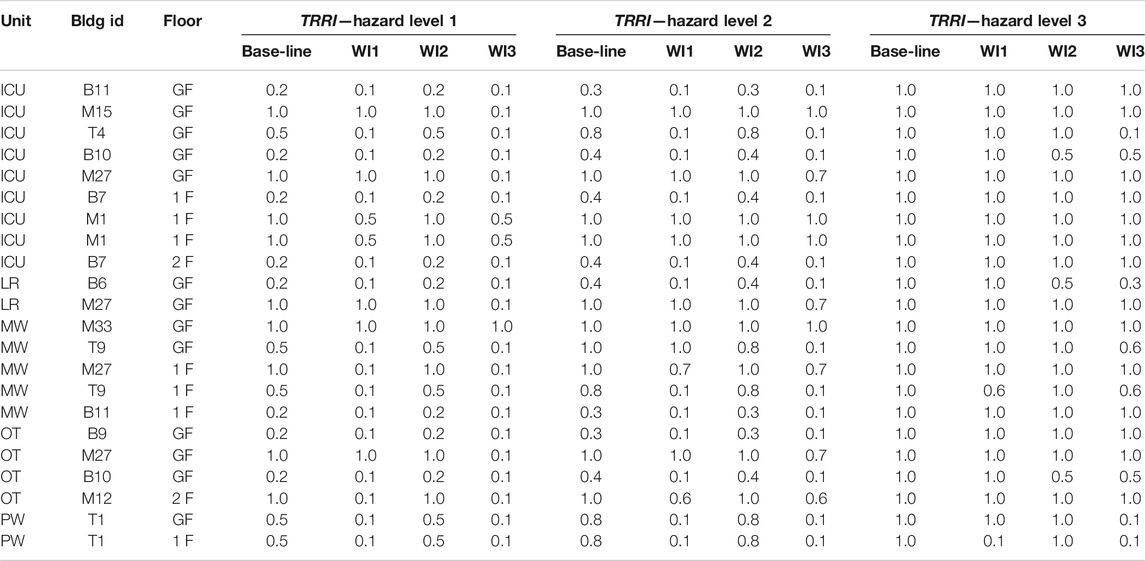
TABLE 6. Summary of TRRI for the critical units under three hazard levels: baseline scenario and three different What-If (WI) scenarios.
From Tables 6 and 7 it is observed that moving the back-up systems to a safe location (WI1) significantly improves the number of operational MW, OT and PW available after tsunami for all Hazard Levels, but is not effective in improving the number of operational ICU and LR units with respect to the baseline for tsunami above Hazard Level 1. This is because many critical units remain vulnerable to direct tsunami inundation.
Implementation of WI2 provides no/little improvement over the baseline scenario for Hazard Levels 1 and 2, as the failure of back-up systems in DGH Matara and BH Tangalle compromise their critical unit operationality and BH Balapitiya is not inundated at these Hazard Levels. However, for Hazard Level 3, despite inundation of BH Balapitiya, some of the back-up systems are not compromised and by elevating the critical units their risk of direct inundation is reduced and their operationality maintained.
An increased effectiveness is observed for What-If scenario 3, as compared to either WI1 or WI2 individually. The combined intervention on back-up systems and critical units is more beneficial than the sum of their individual effects. This is because in WI3 any missing back-up systems are added to the hospital buildings, and the HVAC and Fire Protection systems are moved to upper levels with the critical units, thus joining the other back-up systems in being in a safe location. This results in RRIbcs values close to zero, which when combined with the reduced risk of critical unit inundation, results in 95%, 82%, and 64% of all critical units being operational under Hazard Levels, 1, 2, and 3, respectively. It is highlighted that even in WI3, ICU and OT remain at significant risk from tsunami of Hazard Level 3, with only one quarter of the units predicted to remain operational. To further increase their tsunami resilience, interventions would be needed on the buildings that house these critical units, in order to improve their structural and foundation systems. The TRRI analysis prioritizes buildings M1, M15, and M27 in DGH Matara for such interventions, as these are predicted to suffer heavy damage and/or collapse under the tsunami hazard scenarios, even though the risk to back-up systems and critical units can be reduced through WI3.
The suggested interventions are not based on financial considerations or other constraints, and are applied to all three hospitals. However, it is clear that the TRRI and proposed efficiency measure
Conclusion
This paper presents a new tsunami relative risk index
Data Availability Statement
The raw data supporting the conclusion of this article will be made available by the authors, without undue reservation.
Author Contributions
TR, MB, and PD developed the aim, goals and scope of this study. MB, JP, DR, CS, and HH carried out the fieldwork activity in Sri Lanka. TR, MB, JP, PD, SLQ, and II developed the methodology. MB and JP developed the R script to perform the analysis. MB, TR, JP, and PD contributed to writing the text and producing the figures presented.
Funding
This work is part of the project titled “Hospital Engineering Assessment for Resilience to Tsunami and Storm surge—Sri Lanka” (HEARTS-SL), funded by Research England (Award 177,813) via Global Challenges Research Fund. The project grant was awarded to Prof Tiziana Rossetto.
Conflict of Interest
The authors declare that the research was conducted in the absence of any commercial or financial relationships that could be construed as a potential conflict of interest.
Acknowledgments
The authors acknowledge the support of Disaster Preparedness and Response Division (Ministry of Health, Nutrition and Indigenous Medicine, Sri Lanka) in providing valuable advice and assistance; and also the cooperation of the directors of the hospitals surveyed. Other members that are acknowledged for their support and help are Dr. Carmine Galasso and Prof Ian Eames from UCL, and Eng. Devmini Kularatne, Eng. Ishani Shehara, Mr. S. Harisuthan and Mr. Bahirathan Koneswaran from University of Moratuwa.
Supplementary Material
The Supplementary Material for this article can be found online at: https://www.frontiersin.org/articles/10.3389/feart.2021.626809/full#supplementary-material.
References
ACI (2005). Building code requirements for structural concrete (ACI 318-05) and commentary (ACI 318r-05). Farmington Hills, MI: ACI Committee 318, American Concrete Institute.
Alam, M. S., Barbosa, A. R., Scott, M. H., Cox, D. T., and van de Lindt, J. W. (2017). Development of physics-based tsunami fragility functions considering structural member failures. ASCE J. Struct. Eng. 144 (3), 04017221. doi:10.1061/(ASCE)ST.1943-541X.0001953
ASCE (2017a). Minimum design loads and associated criteria for buildings and other structures. Reston, VA, USA: ASCE/SEI 7-16.
ASCE (2017b). Tohoku, Japan, earthquake and tsunami of 2011: lifeline performance. Editor K. Alex Tang (Reston, VA, USA:Technical Council on Lifeline Earthquake Engineering).
Burbidge, D. R., SCummins, P. R., SLatief, H., SMleczko, R., SMokhtari, M., SNatawidjaja, D., et al. (2009). A probabilistic tsunami hazard assessment of the Indian Ocean Nations. Canberra, NSW, Australia: Geoscience Australia, Australian Government, Professional Opinion 2009/11.
Carballo, M., Heal, B., and Hernandez, M. (2005). Psychosocial aspects of the tsunami. J. R. Soc. Med. 98, 396. doi:10.1258/jrsm.98.9.396
Casarotti, C., Pavese, A., and Peloso, S. (2009). “Seismic response of the san salvatore hospital of coppito (L’Aquila) during the 6th April 2009 earthquake”, progettazione sismica. Pescara, Italy: Special Abruzzo, 159–172.
Dall’Osso, F., Dominey-Howes, D., Tarbotton, C., Summerhayes, S., and Withycombe, G. (2016). “Revision and improvement of the PTVA-3 model for assessing tsunami building vulnerability using ‘‘international expert judgment’’: introducing the PTVA-4 model”. Nat. Hazards 83, 1229–1256. doi:10.1007/s11069-016-2387-9
Del Zoppo, M., Rossetto, T., Di Ludovico, M., Prota, A., and Robertson, I. N. (2020). Structural response under tsunami-induced vertical loads, Proceedings of the 17th World Conference on Earthquake Engineering, Sendai, Japan, 13–18 September.
Di Sarno, L., Chioccarelli, E., and Cosenza, E. (2011). Seismic response analysis of an irregular Base isolated building. Bull. Earthquake Eng. 9 (5), 1673–1702. doi:10.1007/s10518-011-9267-1
Dias, P., Dissanayake, R., and Chandratilake, R. (2006). Lessons learned from tsunami damage in Sri Lanka. Proc. Inst. Civil Eng.—Civil Eng. 159, 74–81. doi:10.1680/cien.2006.159.2.74
DMC (2012). Tsunami Hazard Map. Coastal Research Design, Coast Conservation and Resource Management Department with the assistance from Disaster Management Centre. Srilanka. Available online at: http://www.dmc.gov.lk/images/hazard/hazard/Tsunami.html (Accessed March 22, 2021).
DPRD (2015). “Standard operating procedures for tsunami warnings.” disaster preparedness and response division, Ministry of health, nutrition and indigenous medicine. Colombo, Srilanka: DPRD.
EEFIT (2006). The Indian Ocean Tsunami of 26 december 2004: mission findings in Sri Lanka and Thailand Earthquake engineering field investigation team. London, United Kingdom: Institution of Structural Engineers.
EEFIT (2011). “The Mw9.0 tōhoku earthquake and tsunami of 11th march 2011. A field report by EEFIT.” earthquake engineering field investigation team. London, United Kingdom: Institution of Structural Engineers.
EEFIT (2013). “Recovery two years after the 2011 Tōhoku earthquake and tsunami: a return mission report by EEFIT.” Earthquake Engineering Field Investigation Team. London, United Kingdom: Institution of Structural Engineers.
FEMA (1997). “Commentary on the guidelines for the seismic rehabilitation of buildings”. FEMA 274 NEHRP rehabilitation. Washington, DC, United States: FEMA.
FEMA (2003). Incremental seismic rehabilitation of hospital buildings. Washington, DC, United States: FEMA, 396.
FEMA (2007). Design guide for improving hospital safety in earthquakes, floods, and high winds. Washington, DC, United States: FEMA, 577.
Harlan, E. (2016). After the tsunami, a Sri-Lanka hospital springs to life. A wave of compassion. Evanston, IL: The Rotarian.
Kirsch, T., Mitrani-Reiser, J., Bissell, R., Sauer, L., Mahoney, M., Holmes, W., et al. (2010). Impact on hospital functions following the 2010 Chilean Earthquake. Disaster Med. Public Health Prep. 4, 122–128. doi:10.1001/dmphp.4.2.122
Komesaroff, P. A., and Sundram, S. (2006). Challenges of post-tsunami reconstruction in Sri Lanka: health care aid and the Health Alliance. Med. J. Aust. 184, 23–26. doi:10.5694/j.1326-5377.2006.tb00091.x1
Kraan, B., and Bedford, T. (2005). Probabilistic inversion of expert judgments in the quantification of model uncertainty. Manag. Sci. 51, 995–1006. doi:10.1287/mnsc.1050.0370
MHNI (2015). Standard operating procedures (SOPs) for the health institutions to respond to tsunami warnings. Colombo, Sri Lanka: Disaster Preparedness and Response Division, Ministry of Health, Nutrition & Indigenous Medicine.
MLIT (2011). Further information concerning the design method of safe buildings that are structurally resistant to tsunamis—technical advice No. 2570. Tokyo, Japan: Ministry of Land, Infrastructure, Transport and Tourism.
PAHO (2008). Hospital safety index: guide for evaluators. Geneva, Switzerland: Pan-American Health Organization (PAHO).
Papathoma, M., and Dominey-Howes, D. (2003). Tsunami vulnerability assessment and its implications for coastal hazard analysis and disaster management planning, Gulf of Corinth, Greece. Nat. Hazards Earth Syst. Sci. 3 (6), 733–747. doi:10.5194/nhess-3-733-2003
Petrone, C., Rossetto, T., and Goda, K. (2017). Fragility assessment of a RC structure under tsunami actions via nonlinear static and dynamic analyses. Eng. Structures 136, 36–53. doi:10.1016/j.engstruct.2017.01.013
Robertson, I. N. (2020). Tsunami loads and effects: guide to the tsunami design provisions of ASCE 7-16. Reston, VA: ASCE.
Tonkin, S. P., Francis, M., and Bricker, J. D. (2014). Limits on coastal scour depths due to tsunami. Int. Efforts Lifeline Earthquake Eng. 9780784413234 , 671–678.
UNDRR (2015). Sendai framework for disaster risk reduction 2015—2030, UN office for disaster risk reduction. Available online at: https://www.unisdr.org/files/43291_sendaiframeworkfordrren.pdf (Accessed November 4, 2020).
UNISDR (2005). Hyogo framework for action 2005-2015: building the resilience of nations and communities to disasters. World Conference on Disaster Reduction 18-22 January 2005, Kobe. Hyogo, Japan, 18–22 January, 2005. Available online at: https://www.unisdr.org/2005/wcdr/intergover/official-doc/L-docs/Hyogo-framework-for-action-english.pdf (Accessed November 6, 2020).
WHO (2008). Hospitals should be safe from disasters: reduce risk, protect health facilities, save lives. Manila, Philippines: WHO Regional Office for the Western Pacific.
WHO (2010). Safe hospitals in emergencies and disasters: structural, non-structural and functional indicators. Manila, Philippines: WHO Regional Office for the Western Pacific.
WHO (2015). Hospital safety index: guide for evaluators. 2nd ed. Geneva, Switzerland: World Health Organization https://apps.who.int/iris/handle/10665/258966.
Wijetunge, J. J. (2009). Field measurements and numerical simulations of the 2004 tsunami impact on the south coast of Sri Lanka. Ocean Eng. 36 (12-13), 960–973. doi:10.1016/j.oceaneng.2009.06.002
Keywords: tsunami risk, relative risk index, hospitals, tsunami engineering, disaster risk reduction
Citation: Baiguera M, Rossetto T, Palomino J, Dias P, Lopez-Querol S, Siriwardana C, Hasalanka H, Ioannou I and Robinson D (2021) A New Relative Risk Index for Hospitals Exposed to Tsunami. Front. Earth Sci. 9:626809. doi: 10.3389/feart.2021.626809
Received: 06 November 2020; Accepted: 04 February 2021;
Published: 31 March 2021.
Edited by:
Christina Robyn Magill, Macquarie University, AustraliaReviewed by:
Yo Fukutani, Kanto Gakuin University, JapanQi Yao, China Earthquake Networks Center, China
Copyright © 2021 Baiguera, Rossetto, Palomino, Dias, Lopez-Querol, Siriwardana, Hasalanka, Ioannou and Robinson. This is an open-access article distributed under the terms of the Creative Commons Attribution License (CC BY). The use, distribution or reproduction in other forums is permitted, provided the original author(s) and the copyright owner(s) are credited and that the original publication in this journal is cited, in accordance with accepted academic practice. No use, distribution or reproduction is permitted which does not comply with these terms.
*Correspondence: Marco Baiguera, bS5iYWlndWVyYUB1Y2wuYWMudWs=
 Marco Baiguera
 Tiziana Rossetto
 Juan Palomino
 Priyan Dias2
 Chandana Siriwardana