 Huang Xiaowei1,2
 Jin Zhijun2,3,4*Liu Quanyou2,3*
 Meng Qingqiang2,3Zhu Dongya2,3Liu Jiayi2,3Liu Jinzhong5
- 1School of Energy Resources, China University of Geosciences, Beijing, China
- 2State Key Laboratory of Shale Oil and Gas Enrichment Mechanisms and Effective Development, SINOPEC, Beijing, China
- 3Research Institute of Petroleum Exploration and Production, SINOPEC, Beijing, China
- 4Institute of Energy, Peking University, Beijing, China
- 5State Key Laboratory of Organic Geochemistry, Guangzhou Institute of Geochemistry, Chinese Academy of Sciences, Guangzhou, China
As a link between the internal and external basin, the deep derived fluids play a key role during the processes of hydrocarbon (HC) formation and accumulation in the form of organic-inorganic interaction. Two questions remain to be answered: How do deep-derived fluids affect HC generation in source rocks by carrying a large amount of matter and energy, especially in post-mature source rocks with weak HC generation capability? Can hydrogen and catalysts from deep sources significantly increase the HC generation potential of the source rock? In this study, we selected the post-mature kerogen samples of the early Cambrian Yurtus Formation in the Tarim Basin of China. Under the catalytic environment of ZnCl2 and MoS2, closed system gold tube thermal simulation experiments were conducted to quantitatively verify the contribution of catalytic hydrogenation to "HC promotion" by adding H2. The catalytic hydrogenation increased the kerogen HC generation capacity by 1.4–2.1 times. The catalytic hydrogenation intensity reaction increased with temperature. The drying coefficient of the generated gas decreased significantly as the increasing yield of heavy HC gas. In the simulation experiment, alkane δ13C becomes lighter after the catalytic hydrogenation experiment, while δ13CCO2 becomes heavier. In the process of catalytic hydrogenation, the number of gaseous products catalyzed by ZnCl2 is higher than that catalyzed by MoS2 under the same conditions, indicating that ZnCl2 is a better catalyst for the generation of gaseous yield. Meanwhile, Fischer-Tropsch synthesis (FFT) reaction was happened in the catalytic hydrogenation process. The simulation experiment demonstrates that hydrogen-rich components and metal elements in deep-derived fluids have significant catalytic hydrogenation effects on organic-rich matter, which improved the HC generation efficiency of post-mature source rocks.
Introduction
The deep-derived fluids refer to the mantle source volatile fluid below the basement of the sedimentary basin, which is originated from the dehydrating fluid generated in the process of plate subduction or deep metamorphism, and the deep circulating fluid driven by the heat from the mantle or the deep shell source (Jin et al., 2002; Jin et al., 2004; Jin et al., 2007; Liu et al., 2018). A large amount of gas components carried by the deep-derived fluids contain volatile materials, such as H2, CH4, H2S, CO2, N2, and He. As one of the main volatile fluids, the distribution of geologic H2 (molecular hydrogen) is widespread in ocean ridges, active tectonic belts, and the Precambrian or Cenozoic strata distributed on land (Jeffrey and Kaplan, 1998; Allen and Seyfried, 2004; Newell et al., 2007; Tivey, 2007; Bradley and Summons, 2010; Sherwood-Lollar et al., 2014; Meng et al., 2015; Etiope, 2017; Guélard et al., 2017; Etiope and Whiticar, 2019; Bougault et al., 2019; Klein et al., 2019; Klein et al., 2020). H2 has a variety of genetic types, including the release of deep magma degassing, the serpentinization of ultrabasic-basic rocks (Sherwood-Lollar et al., 2014; Etiope, 2017; Klein et al., 2019; Klein et al., 2020), radiolysis of water due to the presence of radioactive minerals (Sherwood-Lollar et al., 2014; Milesi et al., 2016), mechanical cracking of Si-bearing rock (Hirose et al., 2011; Telling et al., 2015), and the reduction of organic matter by microorganisms (Shuai, et al., 2010). The deep-derived fluids not only carry energy and hydrogen-rich matter, but a large amount of metal catalysts and other elements such as Mg, Fe, Mn, Ni, Zn, Mo, and Cu (Coveney, 1987; Pinto et al., 1999; Tivey, 2007; Proskurowski et al., 2008; Resing et al., 2015). Meanwhile, in sedimentary basins the enrichment of organic matter is normally accompanied by abundant metal elements (e.g., Fe, Mn, Zn, and Mo) (Lv et al., 2018).
The geological kerogen catalytic hydrogenation reaction is a reduction reaction that generates new products and is accompanied by energy conversion. To study the contribution of material conditions in organic-inorganic interactions to hydrocarbon (HC) generation from organic matter, previous studies examined different external hydrogen sources and catalysts (Hawkes, 1972; Jin et al., 2002; Jin et al, 2004). As the energy of the H-H bond is theoretically 436 kJ mol−1, which is less than the H-OH bond energy of 497 kJ mol−1 (Luo, 2004), H2 is easier to hydrogenate organic matter than H2O under simulated experimental conditions (Jin et al., 2004). Lewan et al. (1979), Lewan, (1997)and Seewald (2003) confirmed that the contribution of exogenous H plays a key role in HC generation and distribution of underground HC components. Mango et al. (1996, 1997) showed in an open system that the reaction of exogenous hydrogen with organic matter promotes the rate of HC generation under the action of transition metals. Meng et al. (2015) confirmed that deep hydrogen-rich fluids can activate and increase the HC regeneration of ancient source rocks through experiments. Liu et al. (2016) showed that there is Fischer-Tropsch-type (FTT) interaction between H2 and CO2 produced by the thermal alteration of source rocks in the geological environment to synthesize HCs.
These deep-derived fluids can hydrogenate post-mature kerogen, thereby activating kerogen’s ability to regenerate HCs, by activating the original inert carbon in kerogen and generating HCs (Meng et al., 2015). The post-mature kerogen is rich in polycyclic aromatic HC compounds and polymer groups and has a low H/C ratio. H is a hydrocarbon-generating restrictive reactant for high-maturity kerogen. The hydrocracking reaction can hydro-isomerize and crack (including ring-opening) aromatic compounds and macromolecular groups, i.e., break long-chain alkanes into short-chain alkanes, so that aromatic or naphthenic HCs can be opened to form long-chain alkanes. The hydrocracking reaction can further break the chain (Han, 2001) to promote the reactivation of kerogen to generate HCs (Liu et al., 2018; Liu et al., 2019). In order to simulate the geological regularities of catalytic hydrogenation more accurately in a more consistent environment with deep-derived fluids, on the basis of previous studies, we further optimized the hydrogen quantification in the simulation experiment. The main objectives of this work are to examine the potential of HC generation in high-maturity marine I-type kerogen in the quantitative hydrogenation process, which involves different catalysts under closed system conditions. Meanwhile, it provided to understand the characteristics of HC isotope fractionation of alkane gas under the influence of deep-derived fluids; and to provide theoretical support for the evaluation of organic HC generation.
Experimental Samples and Methods
Experimental Samples
In this study, kerogen was selected from the argillaceous source rocks of the early Cambrian Yurtus Formation in the Dongergou section of the Tarim Basin. Kerogen (Ker) was type I with the vitrinite reflectance (Ro) of 1.91%. The experimental samples were approximately 200 meshes. Total organic carbon (TOC) content of kerogen is 64.0% with purification, atomic ratio H/C = 0.87, Tmax = 530°C, pyrolysis parameter S1 = 1.43 mg HC/g ker, S2 = 10.95 mg HC/g ker, S3 = 16.17 mg CO2/g ker, hydrocarbon index (HI) = 18, oxygen index (OI) = 28. The catalysts used in this study, ZnCl2 and MoS2, had a particle size of 200 mesh and met the experimental analytical purity requirements. Deionized water was prepared in the laboratory, and H2 was high-purity hydrogen gas containing 5% internal standard helium (He).
Experimental Method
The simulation experiment was conducted in the State Key Laboratory of Organic Geochemistry, Guangzhou Institute of Geochemistry, Chinese Academy of Sciences in a closed system composed of gold tubes. During the sample loading process, the loading method of solid-liquid samples described in detail by Liu and Tang (1998) was used. In short, we added the weighed kerogen powder, deionized water, and catalyst powder (10:10:1, wt: wt: wt) into a gold tube (6 mm inner diameter and 70 mm length), which was welded and sealed for cleaning, placed the tube in an argon atmosphere for 25 min to replace the air in the tube, pinched the wall of the gold tube with manual pliers, and sealed the top port with argon arc welding to complete the loading steps. For the hydrogenation sample loading, we made sure precise quantitative volume H2 injected into a larger gold tube. The tube (10 mm inner diameter, 120 mm long) was used. The pre-solid and liquid reactant injection method was the same as above: when quantitatively injecting H2 (containing 5% He as the internal standard gas), temperature control was carried out under room temperature (25°C) with two high-sensitivity pressure gauges connected in series to ensure the amount of H2 injection using the principle of hydrogen gas replacement to effectively eliminate air interference. The mass of the reactants added to the tube was 40 mg kerogen powder, 40 mg deionized water, 4 mg catalyst powder, and 0.65 mg H2. Then we pressed the top port of the gold tube with a pressure clamp to seal the hydrogen component inside the gold tube and flattened the port with the pressure clamp after the wall of the gold tube was welded by argon arc welding. Next, the gold tube was placed in hot water (>60°C) without bead-shaped bubbles overflowing to ensure gas tightness in the tube.
After the sample loading of gold tubes was completed, the tubes were placed in the high-temperature reaction kettle set for heating. The temperature was first raised in 2 h to reach each predetermined temperature point, and then constant heating was performed for 72 h. There were five groups of experimental samples with each set at six temperature points, 350°C, 375°C, 400°C, 450°C, 500°C, and 550°C. Group I is kerogen + deionized water, group II is kerogen + deionized water + ZnCl2, group III is kerogen + deionized water + MoS2, group IV is kerogen + deionized water + ZnCl2+H2, group V is kerogen + deionized water + MoS2+H2. The simulated experimental pressure was constant at 500 bar, and the abnormal pressure change in the kettle did not exceed 1 bar.
Experimental Analysis
Following the research method of Pan et al. (2006) and Jia et al. (2014), the gold tube was removed and carefully placed into a custom-made vacuum glass tube. The vacuum tube was connected to an Agilent 6890 N full-component gas chromatograph (GC), which was modified by Wasson ECE Instrumentation for determination of gas molecular composition. The GC contains three detection channels, one flame ionization detector (FID), and two thermal conductivity detectors (TCD). N2 was the carrier gases for the organic detection channel (FID) and inorganic channel (TCD1), and He was the carrier gas for hydrogen and helium detection channel (TCD2). The detection column was a Paraplot Q-type capillary column. The vacuum environment of the system was maintained by connecting a vacuum pump in the glass tube and piercing the gold tube inside to release the gas component. There are two valves connected in series to the vacuum tube and the chromatograph, which are used to measure the pressure change of the gas component and release part of the gas into the chromatograph to measure its molecular composition. We determined the type and composition of the gas products through different detection response values and corresponding time points. The method used the peak areas of different detection values of FID and TCD to complete the quantification of different gaseous products generated by the peak area ratio of the known quantitative standard gas (Liu and Tang, 1998).
After the GC detection analysis, a gas-tight syringe was used to extract a small amount of gas was extracted from the vacuum tube using a compact gas sampling needle for the carbon and hydrogen isotope analysis. The ratios of carbon and hydrogen isotopes refer to the Vienna Peedee belemnite standard (VPDB). The carbon isotope ratio detection and analysis were performed using a GV Isoprime IRMS interfaced with an Agilent 6890 N-Isoprime 100 instrument. The detection value of each sample was measured two to three times. If there was no obvious difference between the previous two detection values, the average value was taken as the same position value of the sample. If the difference between the first two test values was large, the third test was required, and the average value of the two adjacent values in three tests was taken as the final sample isotope composition. The carbon isotope analysis accuracy of this equipment was within ±0.4‰. Hydrogen isotope ratio detection was performed using the Thermo Trace GC 1310-Delta V Advantage instrument. The detection method was consistent with the carbon isotope analysis, and the hydrogen isotope accuracy was within ±3‰. During the detection process, the pre-determined δ13C value calibration gases were periodically analyzed to check the accuracy of the measured value.
Results
Total Gas Yield
The total gas yield of different simulated experimental samples showed an upward trend with increasing temperature (Table 1). The total gas yield of group I was measured at the initial temperature of 350°C at 56.6 m3/t Ker, and the yield increased substantially after 400°C. At the highest temperature of 550°C, the yield reached a maximum value of 241.8 m3/t Ker. After the catalysts ZnCl2 and MoS2 were added to groups II and III, the total gas yield increased from the lowest values of 70.0 m3/t Ker (350°C) and 70.5 m3/t Ker (350°C), respectively, and began to increase significantly at 400°C. The maximum yields were 513.4 m3/t Ker and 347.5 m3/t Ker, which were 2.1 to 1.4 times the maximum value in group I, respectively. The addition of ZnCl2 and MoS2 significantly promoted the reaction, and the yield increased more by the addition of ZnCl2 than MoS2, and the gas increase was mainly from CH4 and CO2. In groups IV and V, the total gas yields (without accounting for H2 yield) were 55.7 m3/t Ker (350°C) and 29.2 m3/t Ker (350°C), respectively, and then the yield increased greatly at 375°C. The maximum yields were 506.5 m3/t Ker and 368.4 m3/t Ker at 550°C, respectively. Compared with groups II and III, the groups IV and V showed little change in the total yield. With the addition of H2 reaction resulted in the alkane yield increased, but the CO2 yield decreased, resulting in an insignificant change in the total gas yield overall.
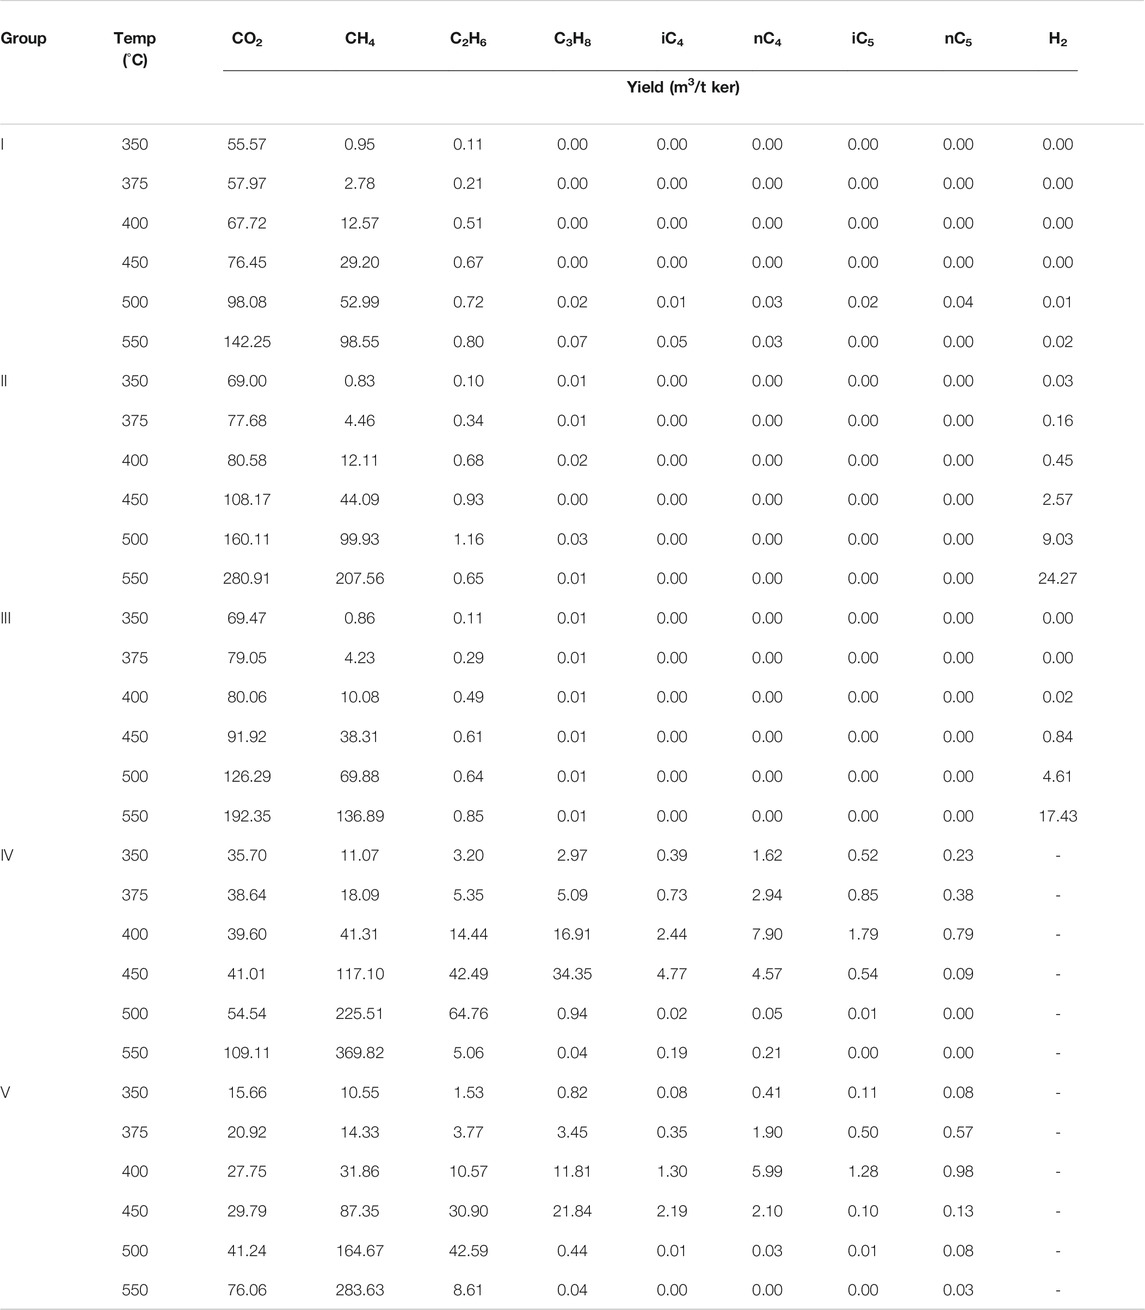
TABLE 1. Types and concentrations (m3/t Ker) of gas generated during the catalytic pyrolysis experiments at 350°C/72 h, 375°C/72 h, 400°C/72 h, 450°C/72 h, 500°C/72 h, and 550°C/72 h.
Product Components
In terms of the total yield distribution of gaseous HCs, the ∑C1-5 yield of group I increased continuously with temperature, and the maximum yield was 99.49 m3/t Ker. After the catalysts ZnCl2 and MoS2 were added to groups II and III, the maximum yields of ∑C1-5 were 208.22 m3/t Ker and 137.77 m3/t Ker, which were increased 2.1 and 1.4 times as much as group I, respectively. It proved that the addition of ZnCl2 and MoS2 significantly promoted the generation of the gas components. In groups IV and V, the maximum yields of ∑C1-5 were 375.34 m3/t Ker and 292.32 m3/t Ker, representing 1.8 and 2.1 times increase compared to groups II and III. The catalytic hydrogenation.
The methane (C1) yield increased with temperature and reached the maximum at 550°C. The maximum C1 yield in group I was 98.55 m3/t Ker. When the catalysts ZnCl2 and MoS2 were added to groups II and III, the maximum yields of C1 were 207.56 m3/t Ker and 136.89 m3/t Ker, which were 2.0 and 1.4 times as much as the yield of group I, respectively. In groups IV and V, the maximum yields of C1 were 369.82 m3/t Ker and 283.63 m3/t Ker, respectively, which were 1.8 and 2.1 times the yields of groups II and III (Figure 1).
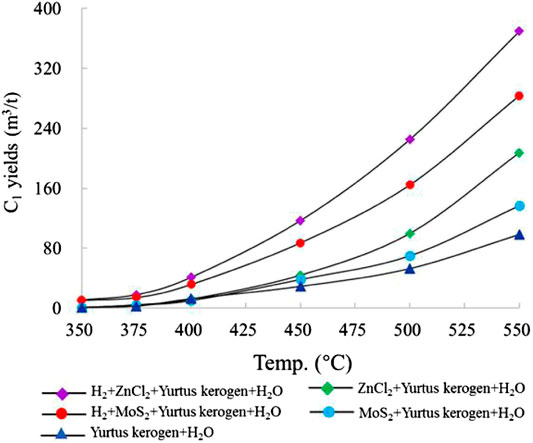
FIGURE 1. Characteristics of C1 yield simulated under different catalytic hydrogenation control conditions of the closed system.
The change in the ethane (C2) yield of group I with temperature was very small, and the maximum C2 yield was 0.8 m3/t Ker (500°C). After the catalysts ZnCl2 and MoS2 were added to groups II and III, the maximum C2 yields were 1.16 m3/t Ker and 0.85 m3/t Ker, respectively. The addition of ZnCl2 and MoS2 did not increase the C2 yield significantly. In groups IV and V, the maximum yields of C2 were 64.76 m3/t Ker and 42.59 m3/t Ker (both 500°C), which were 80 and 50 times those of groups II and III without H2, respectively. Exogenous H2 reacts more easily than H2O to promote the generation of C2 (Figure 2).
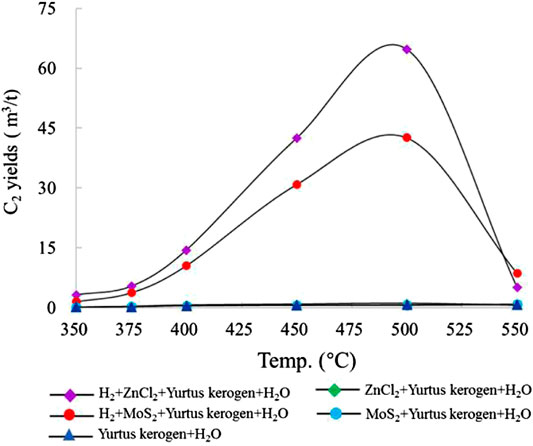
FIGURE 2. Change in C2 yield simulated under different catalytic hydrogenation control conditions of the closed system.
The change in the propane (C3) yield of group I with temperature was close to 0.0 m3/t Ker. After adding the catalysts ZnCl2 and MoS2 to groups II and III, the change in the C3 yield was still 0.0 m3/t Ker, indicating that the addition of metal salts did not significantly increase the C3 yield. In groups IV and V, the maximum yields of C3 were 34.4 m3/t Ker and 21.8 m3/t Ker (450°C), respectively; the addition of external H2 and catalysts exceedingly improved the C3 yield (Figure 3). The comparison of the results of C1, C2, and C3 shows that the addition of exogenous H2 increases the HC generation yield, and the peak temperature of HC generation decreases sequentially with the increasing carbon number.
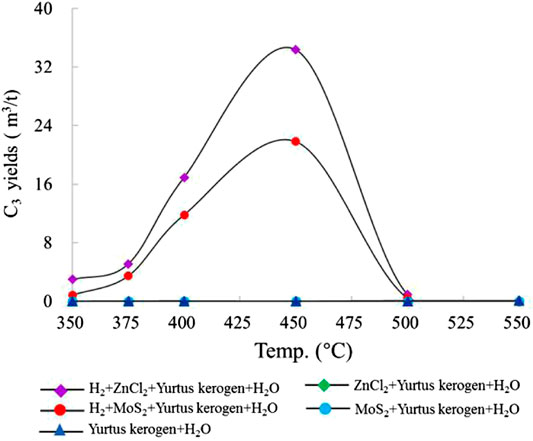
FIGURE 3. Change in C3 yield simulated under different catalytic hydrogenation control conditions of the closed system.
The catalytic addition of the H cracking reaction had a significant effect on the drying coefficient of natural gas (C1/∑C1-5) (Table 1). The C1/∑C1-5 ratio of group I (kerogen + deionized water) increased with temperature, from a minimum of 0.90 (350°C) to 0.99 (550°C). When the catalysts ZnCl2 and MoS2 were added to groups II and III, the C1/∑C1-5 ratio became larger with increasing temperature at the ratios of 0.89–1.00 and 0.87–0.99, respectively. The addition of ZnCl2 and MoS2 promoted the formation of C2+ HCs at relatively low temperatures (≤400°C). After adding H2 and catalysts ZnCl2 and MoS2, the addition of exogenous H2 greatly increased the heavy HC (C2+) components, and the C1/∑C1-5 ratios at 350°C were 0.55 and 0.78, respectively. The C1/∑C1-5 ratio gradually decreased with the increasing temperature and dropped to the lowest point at 0.48 and 0.50, respectively, at 400°C. After 400°C, C1 produced by the hydrocracking of kerogen continued to increase, as well as C2+ HCs in the product. The conversion to C1 significantly increased the C1 yield, and the natural gas drying coefficient reached the maximum values of 0.99 and 0.97 at 550°C.
The CO2 yield in each group of experiments increased with increasing temperature and reached the maximum value at 550°C. The CO2 yield of group I gradually increased with increasing temperature, and the maximum CO2 yield was 142.25 m3/t Ker. In groups II and III, with the addition of catalysts ZnCl2 and MoS2, the maximum yields of CO2 were 280.91 m3/t Ker and 192.35 m3/t Ker, respectively, which are 2.0 and 1.4 times the maximum yield without the addition of the catalysts. The increase in CO2 and HC components was similar, indicating that the metal ions mainly catalyze the lysis of kerogen itself rather than decomposing the bond between H and O. The CO2 yields in groups IV and V were 0.39–0.40 times those of groups II and III, respectively (Figure 4). The significant decrease in the yield of CO2 resulted from the reaction that occurred with the addition of H2.
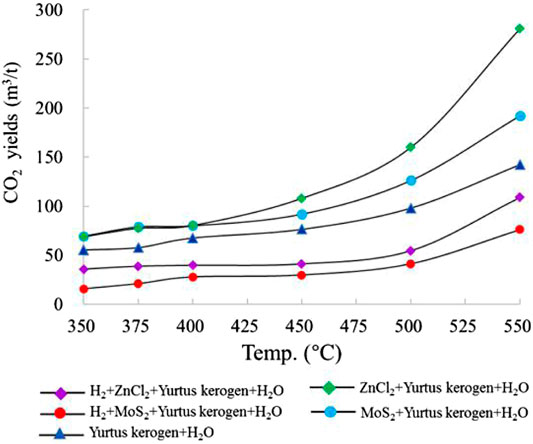
FIGURE 4. Change in CO2 yield simulated under different catalytic hydrogenation control conditions of the closed system.
The experimental comparison of groups I, II, and III showed that the H2 yield did not increase significantly with temperature (the highest is 0.02 m3/t Ker at 550°C in group I), but the maximum yields after adding ZnCl2 and MoS2 were 24.27 m3/t Ker and 17.43 m3/t Ker at 550°C. The yield increased by one to two orders of magnitude, indicating that the H2 production was significantly promoted by the addition of catalysts, combined with the C2 yield. The dominant reason of the H increase is the cracking of organic matter.
Product Component Carbon Isotope Changes
The results show that δ13C becomes heavier with increasing temperature. Since kerogen of the Yurtus Formation is at a high maturity stage, only C1, C2, and CO2 isotope values can be effectively detected in product components. For the δ13C value of gaseous HCs under different control conditions at the same temperature point, the δ13C value of each gaseous HCs increased with the intensity of reaction between catalysis and hydrogen addition (Table 2). The δ13C1 value of group I increased continuously with the increase in temperature from −39.8 to −34.9‰. When ZnCl2 and MoS2 were added to groups II and III, the δ13C1 values changed from −44.7 to −36.7‰ and from −43.6 to −36.2‰. In groups IV and V, the δ13C1 values changed from −45.9 to −40.2‰ and from −52.4 to −43.4‰, showing an increase before the 400°C stage, then a decrease in the 400–450°C interval, and finally becoming heavier with increasing temperature. For the C1 yield after 400°C, catalytic hydrocracking plays a major role in promoting the disproportionation of small low-carbon molecules. Since the bond energy of 12C–12C is less than the bond energy of 12C–13C, the δ13C1 fractionation follows; as the intensity of catalytic hydrogenation increases, δ13C1 becomes lighter (Figure 5).
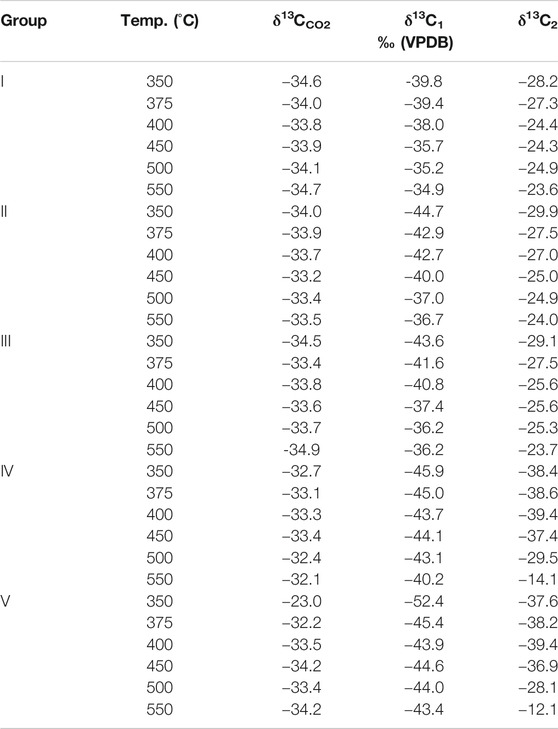
TABLE 2. δ13C values of gas generated during the catalytic pyrolysis experiments at 350°C/72 h, 375°C/72 h, 400°C/72 h, 450°C/72 h, 500°C/72 h, and 550°C/72 h.
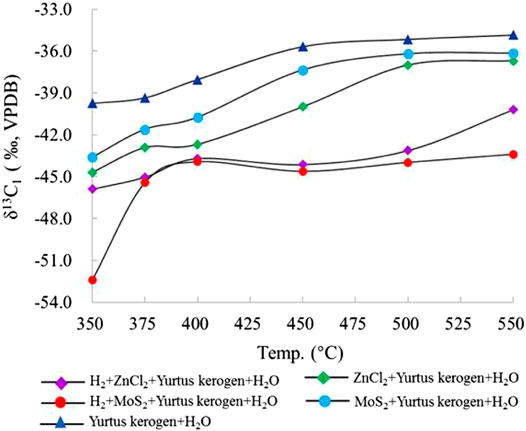
FIGURE 5. Change in δ13C1 simulated under different catalytic hydrogenation control conditions of the closed system.
The δ13C2 value increased sequentially with the increasing temperature. In group I, the value of δ13C2 changed from −28.2 to −24.4‰ at 350–400°C. After 400°C, the δ13C2 value only changed from −24.4 to −23.6‰. In groups II and III with catalysts ZnCl2 and MoS2, the δ13C2 value was generally stable, similar to group I, changing from −29.9 to −24.0‰ and from −29.1 to −23.7‰, respectively. The addition of ZnCl2 and MoS2 promoted the reaction and the exchange of C elements to a lesser extent. The δ13C2 value changed in groups IV and V from −38.4 to −14.1‰ and from −37.6 to −12.1‰, indicating that catalytic hydrogenation significantly increases the formation of C2 and the exchange of C elements. At 550°C, the δ13C2 value was the largest because the addition of H2 promoted the catalytic cracking reaction. When the temperature exceeded the gas generation window (<500°C), a large amount of C2 cracked to form C1, resulting in an abnormally large δ13C2 value (Figure 6).
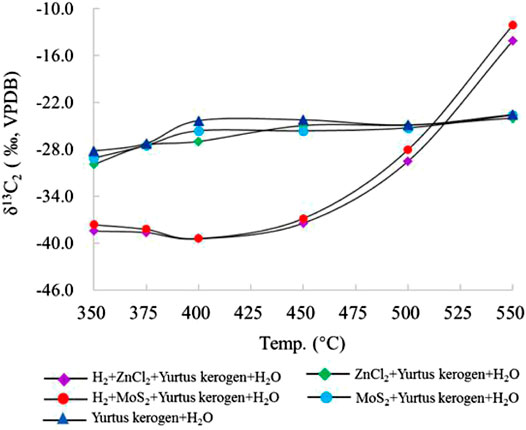
FIGURE 6. Change in δ13C2 simulated under different catalytic hydrogenation control conditions of the closed system.
As one of the main reaction products, the CO2 isotope fractionation value is mainly controlled by its own molecular quality. The comparison of the experimental results between the hydrogenated and unhydrogenated groups showed that the δ13CCO2 value in the hydrogenated group was larger than the unhydrogenated group, which is negatively correlated with the change in the fractional distillation of the δ13C value of alkanes. The δ13CCO2 value of CO2 generated by hydrocracking was relatively stable. The δ13CCO2 values of groups I, II, and III were distributed between −35‰ and −33‰. The δ13CCO2 values in groups IV and V showed a decreasing trend first and then an increasing trend. The participation of ZnCl2 catalyst increased the δ13CCO2 value of the product. The joint addition of H2 and the catalyst further increased the fractionation of the δ13CCO2 value. The effect of MoS2 on the δ13CCO2 value was larger at the early stage of the reaction (Figure 7). At the same time, relative to the changes in δ13C values for C1 and C2, the range of carbon isotope fractionation of CO2 was smaller than that of alkanes because of the oxidative decarboxylation of its controlled long-chain HCs, rather than the bond energy difference controlled by the C-C bond leading to preferential cracking (Lu et al., 2010).
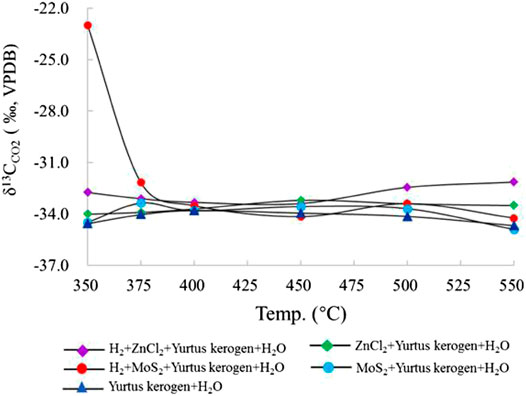
FIGURE 7. Change in δ13CO2 simulated under different catalytic hydrogenation control conditions of the closed system.
Discussion
Catalytic Hydrogenation Mechanism
Catalytic hydrogenation showed that the yield and isotopic value of the gaseous product components changed significantly and were also accompanied by FTT synthesis reaction products. The source supply angle mainly depends on the control influence of H2 and different metal elements in the reaction environment.
Product Component Comparison
The post-mature kerogen of the Yurtus Formation has very weak pyrolysis and HC generation capacity. With the increase in temperature and the catalysis of hydrogenation by different catalysts, the kerogen HC generation capacity significantly improved. As the most stable HC molecule, C1 had an increased yield. In addition to the catalytic hydrogenation reaction of kerogen, there were other gaseous HCs produced by catalytic hydrocracking. The yield of different catalysts changed significantly. Under the same hydrogenation conditions, the yield of C1 under the action of ZnCl2 was greater than that of MoS2, with a yield ratio of 1.0–1.4 and average of 1.3. The results of the control experiment between the experimental group with added H2 and catalyst and the experimental group with catalyst only showed that the addition of H2 delayed the decomposition of heavy HCs such as C2 and C3, leading to a higher temperature of HC generation peaks. Meanwhile, the heavy HC group bond energy was smaller than the methyl group energy, which led to the preferential participation of heavy HC groups in hydrocracking and thus to a significant increase in the yield of C2+ HCs and a significant reduction in the drying coefficient of the product. The addition of exogenous H2 greatly changed the kerogen's own cracking mode, and heavy HC component C2+ increased significantly. It was well consistent with the results that the drying coefficient of the product gases with the increased intensity of catalytic hydrogenation is significantly lower than that of the ordinary geological environment (Lewan et al., 1979; Mango et al, 1994; Ma et al., 2018).
Change in the i/n-Alkane Ratio
Among gaseous HC components, normal paraffins are formed by free radical reactions, and isoparaffins are derived from free radical cracking on kerogen and asphalt branches under acidic cationic ion reaction (Eisma and Jurg, 1969; Almon and Johns, 1977; Kissin, 1987; Pan et al., 2006). The Yurtus Formation kerogen is high maturity, and the branched chains of its molecular structure is not developed; thus, the main source of isoparaffin is the acidification cation reaction. Thompson and Creath, (1966) showed that in North American industrial HC reservoirs mainly generated by free radical HC generation, the iC4/nC4 ratio is around 0.5, generally not greater than 1.0; the iC5/nC5 ratio is around 1.0 and generally less than 2.0. In this study, the comparison of the same component at the same temperature showed that the value of iCn/nCn under the action of ZnCl2 was larger than MoS2. For the products of butane (C4), from the initial temperature of 350°C–400°C, the iC4/nC4 value of the products produced by the two catalysts was relatively stable, ranging from 0.241 to 0.309 and 0.184 to 0.217, respectively. The maximum values were 1.045 and 1.042, respectively, at 450°C. For the products of pentane (C5), the temperature changed greatly from the initial temperature of 350°C–500°C; the range of the iC5/nC5 ratio under the action of ZnCl2 was 2.200–6.252 and under the action of MoS2 was 0.096–1.409 (Table 1, Figure 8). The results showed that under the action of ZnCl2, more HCs were generated by the cationic reaction, which promoted more formation of the isoparaffins. The higher the temperature is, the more significant changes in the cationic reaction are. The results further reveal that the catalytic effect of ZnCl2 on promoting HC generation by the cation reaction is stronger than that of MoS2.
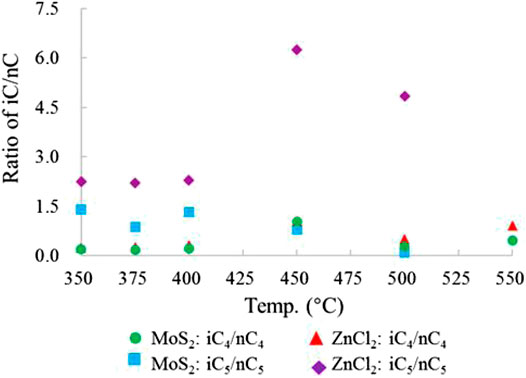
FIGURE 8. Comparison of the iC5/nC5 alkane ratio between butane and pentane under the condition of ZnCl2/MoS2 of the closed system.
Reaction Mechanism
HC generation of catalytic hydrogenation is mainly carried out in the form of H radicals and H ions. There are two modes of catalysis: “Lewis acid” catalysis and “Brønsted acid” catalytic processes (Figure 9). When performing Lewis acid site catalytic processes, the main chemical reactions are decarboxylation and C-C bond breaking (Li et al., 2002; He et al., 2011; Ma et al., 2018). Since the Lewis acid site composed of Zn2+ or Mo2+ is an empty orbital position with high affinity for electrons, when the organic matter is decarboxylated, Zn2+ or Mo2+ at this position gets an electron from the adsorbed organic molecule, and carboxylic acid loses CO2. Free radicals further undergo a rearrangement reaction with H radicals, leading to the breakage of the C-C bond and the formation of free HCs with shorter bond lengths. The product of the decarboxylation reaction is mainly CO2. The breakage of the C-C bond mainly promotes the generation of free HCs. When performing Brønsted acid catalytic processes, through contact with Zn2+ and Mo2+, H2 or water molecule lose an electron to generate H ions, promoting the kerogen unsaturated cycloalkane addition reaction. As the hydrogenation reaction continues, low-molecular-weight saturated chain HCs are eventually formed (Wu et al., 2012; Ma et al., 2018).
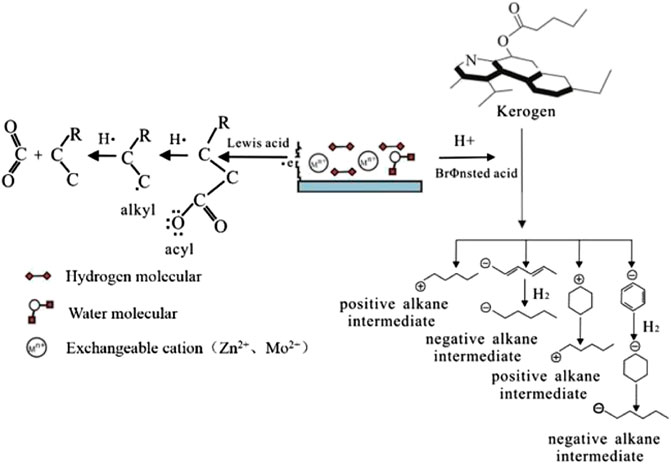
FIGURE 9. Catalytic mechanism of transition metal based on free radical cracking and H ion reaction (modified according to Johns, 1979; Mango et al, 1994; Mango, 1996; He et al., 2011; Wu et al., 2012; Ma et al., 2018).
The yield results show that Zn2+ has a better catalytic effect than Mo2+ because Zn2+ has a more stable and long-lasting catalytic activity than Mo2+, and it is easier to fully contact the reactants. The chemical properties of Cl− are extremely stable. Previous studies suggest that Cl− has a certain inhibitory effect on the catalyzed cracking of kerogen (Li et al., 2002). In the catalytic hydrogenation experiment of H2, ZnCl2 shows a strong catalytic effect on hydrogen generation. S2−reacts with H2 to generate part of H2S, which has a catalytic effect on HC generation (He et al., 2011), but the product test results show that the H2S content is relatively low, and the catalytic contribution is not significant.
Stable Carbon and Hydrogen Isotope Change Mechanism
δ13C1/δ13C2
For the HC isotope composition of oil and natural gas, relative to its parent material, kerogen is lean in 13C and 2H. This is because the kerogen 12C–12C bond and the C-C bond in 1H-CC-1H are more easily broken than the 12C–13C bond and the 2H-CC-1H CC bond, thereby allowing lighter isotopes to enter HC (Lu et al., 2010).
The change in δ13C1-δ13C2 values can reflect the catalytic hydrogenation effects effectively. The data of groups I, II and III showed that δ13C1-δ13C2 has a strong linear relationship (Figure 10). After adding the catalysts, the change in the δ13C1-δ13C2 value was decreased significantly and the range changed widely, but C2 yield changed little (Figure 2). The results showed that C2 mainly promotes the elemental exchange between carbon isotopes after the catalyst were added and has little effect on the yield reaction equilibrium. The comparison of the experimental results showed that the catalyst addition leads to lighter δ13C1 and δ13C2. Meanwhile, the metal ions are involved in enhancing the reaction process and promoting the isotope fractionation level during the reaction. The catalytic hydrogenation extremely promotes the activation of the carbon source in post-mature kerogen. Within a certain temperature range (≤450°C), the distribution of δ13C1-δ13C2 is clustered and distributed in a stable lighter interval. At 500°C, the δ13C1/δ13C2 ratio is close to the range with no H2 added. The C2 component passed the peak of HC generation because the C2 component with a smaller δ13C value starts to crack into C1, which led to the leaving C2 with heavier δ13C. At the same time, C3 cracked completely due to the δ13C kinetic fractionation to promote the formation of lighter δ13C1 and heavier δ13C2. Restricted by high temperature and the amount of carbon material, the heavier carbon content retained in generated C2 increases at 550°C, resulting in larger change of linear variations. It also implies the δ13C1-δ13C2 parameters can provide supplementary verification to evaluate whether the HC generation process of source rocks was affected by catalytic hydrogenation in sedimentary basins.
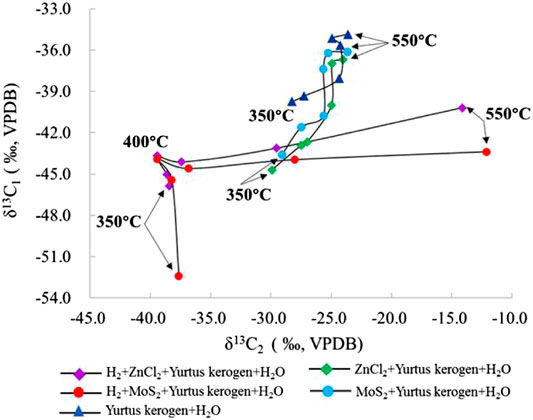
FIGURE 10. Change in the δ13C1-δ13C2 contrast simulated under different catalytic hydrogenation control conditions of the closed system.
Relationship Between CO2 and Alkane δ13C
CO2 is one of the main by-products of the reaction process. Its δ13C fractionation change is opposite to that of alkane δ13C. δ13CCO2 increases with the enhancing intensity in the reaction (Figures 11, 12). When the catalytic hydrogenation stage is weak, the kerogen HC generation is mainly carried out by self-cracking; thus, the changes in kerogen δ13C in the low temperature stage are greatly affected by temperature and the external H2 participation in the reaction. The δ13CCO2 value became larger accompanied by an increasing intensity of the catalytic reaction. In group I, the δ13CCO2 change from the large to the small was at the 400 °C inflection point. In group II and III, the δ13CCO2 change from large to small was at the 450°C inflection point and the HC generation mode of kerogen was affected distinctly by the catalytic elements during pyrolysis reaction. In group IV and V, the addition of H2 changed the characteristics of the original kerogen evolution process and promoted isotope exchange in the HC generation. The change in δ13CCO2 from lighter to heavier was mainly controlled by the dynamic fractionation of carbon isotope of CO2. The maximum δ13CCO2 temperature under the action of ZnCl2 is delayed compared to that under the action of MoS2. The δ13C2 value under the action of ZnCl2 is less than that under the action of MoS2, which demonstrates that the catalytic effect of ZnCl2 under the same conditions is stronger than that of MoS2.
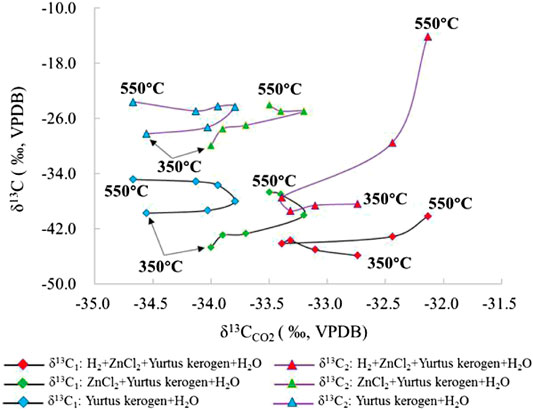
FIGURE 11. Change in the δ13C values of different alkanes and CO2 under the simulated ZnCl2 catalyzed hydrogenation control condition of the closed system.
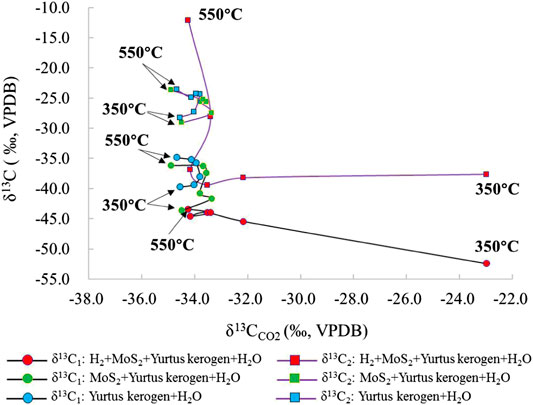
FIGURE 12. Change in the δ13C values of different alkanes and CO2 under the simulated MoS2 catalyzed hydrogenation control condition of the closed system.
Accompanying Secondary Reaction—Fischer-Tropsch-Type Synthesis
As one of the main modes of inorganic HC generation, FTT synthesis is well verified in geological discoveries and experiments (Fu et al., 2007; Hosgörmez, 2007; McCollom, 2013; Suda et al., 2014; McCollom, 2016; Etiope, 2017; Liu et al., 2018) and greatly affected by the redox conditions of the environment. The catalytic hydrogenation experiment provides a good reduction environment and source supply conditions. As shown in Figure 13, the relationship between CO2 and CH4 in the catalytic hydrogenation state of ZnCl2 was y = 1.1359x-17.687, R2 = 0.9375. Under the catalytic hydrogenation state of MoS2, the relationship between CO2 and CH4 changed to y = 2.1496x-97.873, R2 = 0.9533. Under the stable reaction at >400°C, the relationship between CO2 and CH4 changed to y = 1.9199x-73.472, R2 = 0.9921, indicating that the decrease in the yield of CO2 in the hydrogenation reaction showed a strong linear relationship with the increase in C1. The CO2 yield decreased rapidly at 375 °C owing to the solubility of water at high temperatures. In the high-temperature stage (≥400°C) under the catalytic state, the activation reaction of hydrogen radicals and carbon molecules was accelerated. In the catalytic hydrogenation reaction of CO2, a large quantity of HCs and water mainly composed of C1 are produced in the FTT synthesis reaction accompanying H2 and CO2. The change in the slope of the equation shows that the catalytic effect of ZnCl2 on kerogen pyrolysis and HC generation is stronger than that of MoS2.
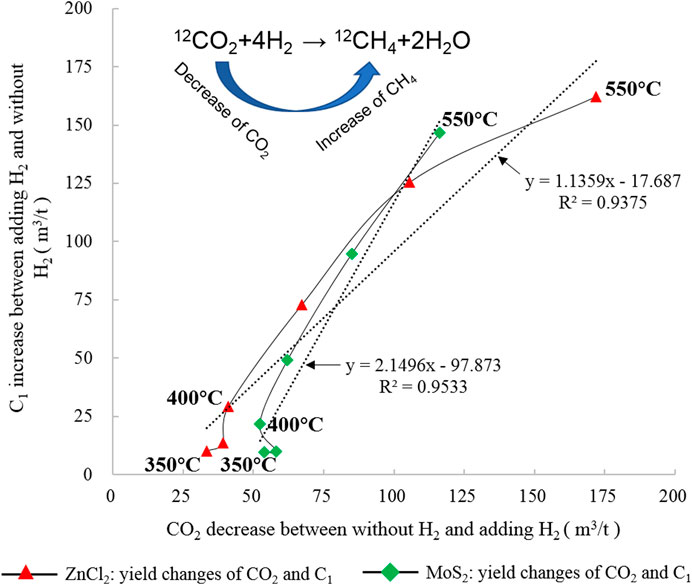
FIGURE 13. Changes in the characteristics of C1 and CO2 under different catalytic hydrogenation control conditions simulated of the closed system.
With H2 added to the HC generation reaction, the CO2 yield decreased significantly. However, the CO2 yield remained stable after falling to a certain value. The yield was stable under the influence of different temperature points. According to the δ13CCO2 isotope change, a heavier trend in both H2 added groups implies that 12C is more likely to participate in the catalytic hydrogenation response than 13C. Combined with the experimental results described in Table 1, Figures 4, 13, the addition of H2 inhibited the CO2 generation. The FTT synthesis decreased the generated CO2 and H2 yield. The results of the control experiment showed that the final CO2 conversion rate was a constant under a different reaction environment. The amount of activated C with the H2 addition reaction indicated that activated C reactants would not react in the geological environment.
The catalysis reaction by the addition of H2 was carried out in a neutral reduction system, and the FTT synthesis accompanied by CO2 generated HCs, which had a significant effect on the total HC yield. In geological processes, the FTT synthesis reaction plays an important role as a link between the deep hydrogen-rich fluid and the hydrogen generation of post-mature organic matter.
Conclusion
For the ancient source rocks of the Yurtus Formation in the Tarim Basin, the catalytic substances and exogenous hydrogen carried under deep-derived fluids can “secondarily generate HCs” for the activation of source rocks. ZnCl2 and MoS2 have a strong catalytic effect on the reaction of post-mature kerogen and H2. Catalytic addition of H2 promotes the HC generation capacity of kerogen and the increase in HCs by 0.4–1.1 times, significantly reduces the natural gas drying coefficient, and promotes FTT synthesis of secondary reactions. Isotope fractionation mainly follows the laws of kinetics and shows good identification characteristics. By comparing the composition of gaseous products and isotope characteristics, the catalytic effect of ZnCl2 is stronger than MoS2 under the same conditions. Meanwhile, it implies deep-derived hydrogen fluids containing Zn, Mo and other metal elements can make a remarkable contribution to reactivate the post-mature source rocks for HC generation.
Data Availability Statement
The original contributions presented in the study are included in the article/Supplementary Material, further inquiries can be directed to the corresponding authors.
Author Contributions
All authors listed have made a substantial, direct, and intellectual contribution to the work and approved it for publication.
Funding
This work was supported by National Key R&D Program of China (Grant No. 2017YFC0603102), National Natural Science Foundation of China (Project No.: 41625009 and 41673066), Strategic Priority Research Program of Chinese Academy of Sciences (Project No.: XDA14010404) and National Oil and Gas Major Project (No. 2017ZX05008-002-050).
Conflict of Interest
Author JZ, LQ, MQ, ZD, and LJ were employed by the company SINOPEC.
The remaining authors declare that the research was conducted in the absence of any commercial or financial relationships that could be construed as a potential conflict of interest.
Acknowledgments
We are grateful to Yunpeng Wang, Hong Lu, and Qiang Wang for their experimental supports. The authors also thank Xiaoqi Wu for his critical comments that significantly improved the quality of manuscript.
References
Allen, D. E., and Seyfried, W. E. (2004). Serpentinization and heat generation: constraints from Lost City and Rainbow hydrothermal systems 1 1Associate editor: J. C. Alt. Geochem. Cosmochim. Acta. 68 (6), 1347–1354. doi:10.1016/j.gca.2003.09.003
Almon, W. R., and Johns, W. D. (1977). “Petroleum-forming reactions. The mechanism and rate of clay catalyzed fatty acid decarboxylation,” in Advances in organic Geochemistry Editors R. Campos, and J. Goni (Madrid: Enadimsa), 157–172.
Bougault, H., and Dpt, M.G. (2019). Hydrothermal hydrogen and methane: scientific insight a new potential resource? [J]. Mines & carrieres. Les techniques, 196(hors series), 73–80.
Bradley, A. S., and Summons, R. E. (2010). Multiple origins of methane at the lost city hydrothermal field. Earth Planet. Sci. Lett. 297 (1–2), 34–41. doi:10.1016/j.epsl.2010.05.034
Coveney, R.M.J. (1987). Serpentinization and the origin of hydrogen gas in Kansas[J]. American Association of Petroleum Geologists Bulletin, 71 (1), 39–48.
Eisma, E., and Jurg, J. W. (1969). “Fundamental aspects of the generation of petroleum,” in Organic Geochemistry, methods and results. Editors G. Eglinton, and M.T.J. Murphy (Berlin: Springer-Verlag), 675–698.
Etiope, G. (2017). Abiotic methane in continental serpentinization sites: an overview. Procedia Earth Planet. Sci. 17, 9–12. doi:10.1016/j.proeps.2016.12.006
Etiope, G., and Whiticar, M. J. (2019). Abiotic methane in continental ultramafic rock systems: towards a genetic model. Appl. Geochem. 102, 139–152. doi:10.1016/j.apgeochem.2019.01.012
Fu, Q., Sherwood Lollar, B., Horita, J., Lacrampe-Couloume, G., and Seyfried, W. E. (2007). Abiotic formation of hydrocarbons under hydrothermal conditions: constraints from chemical and isotope data. Geochem. Cosmochim. Acta. 71 (8), 1982–1998. doi:10.1016/j.gca.2007.01.022
Guélard, J., Beaumont, V., Rouchon, V., Guyot, F., Pillot, D., Jézéquel, D., et al. (2017). Natural H2in Kansas: deep or shallow origin?. Geochem. Geophys. Geosyst. 18 (5), 1841–1865. doi:10.1002/2016gc006544
Hawkes, H. E. (1972). Free hydrogen in genesis of petroleum: Geological notes. AAPG Bull. 56 (11), 2268–2270. doi:10.1306/819a4202-16c5-11d7-8645000102c1865d
Han, C. (2001). Hydrocracking Process and Engineering (in Chinese). Beijing: China Petrochemical Press, 224–226.
He, K., Zhang, S., Mi, J., Chen, J., and Cheng, L. (2011). Mechanism of catalytic hydropyrolysis of sedimentary organic matter with MoS2. Petrol. Sci. 8 (02), 134–142. doi:10.1007/s12182-011-0126-0
Hirose, T., Kawagucci, S., and Suzuki, K. (2011). Mechanoradical H2 generation during simulated faulting: implications for an earthquake-driven subsurface biosphere. Geophys. Res. Lett. 38 (17), L17303. doi:10.1029/2011gl048850
Hosgörmez, H. (2007). Origin of the natural gas seep of Çirali (Chimera), Turkey: site of the first Olympic fire. J. Asian Earth Sci. 30 (1), 131–141. doi:10.1016/j.jseaes.2006.08.002
Jeffrey, A. W. A., and Kaplan, I. R. (1988). Hydrocarbons and inorganic gases in the gravberg-1 well, siljan ring, Sweden. Chem. Geol. 71 (1–3), 237–255. doi:10.1016/0009-2541(88)90118-0
Jia, W., Wang, Q., Liu, J., Peng, P., Li, B., and Lu, J. (2014). The effect of oil expulsion or retention on further thermal degradation of kerogen at the high maturity stage: a pyrolysis study of type II kerogen from Pingliang shale, China. Org. Geochem. 71, 17–29. doi:10.1016/j.orggeochem.2014.03.009
Jin, Z., Zhang, L., and Yang, L. (2002). Preliminary study on geochemical characteristics of fluids in deep sedimentary basins and Hydrocarbon Accumulation Effect. [J]. Earth Sci. 27 (6), 659–665. doi:10.3321/j.issn:1000-2383.2002.06.001
Jin, Z., Zhang, L., Yang, L., and Hu, W. (2004). A preliminary study of mantle-derived fluids and their effects on oil/gas generation in sedimentary basins. J. Petrol. Sci. Eng. 41 (1–3), 45–55. doi:10.1016/s0920-4105(03)00142-6
Jin, Z., Hu, W., and Zhang, L. (2007). Deep fluid activity and hydrocarbon accumulation effect [M]. Beijing: Science Press.
Johns, W. D. (1979). Clay mineral catalysis and petroleum generation. Annu. Rev. Earth Planet Sci. C. 7 (1), 183–198. doi:10.1146/annurev.ea.07.050179.001151
Kissin, Y. V. (1987). Catagenesis and composition of petroleum: origin of n-alkanes and isoalkanes in petroleum crudes. Geochem. Cosmochim. Acta. 51 (9), 2445–2457. doi:10.1016/0016-7037(87)90296-1
Klein, F., Grozeva, N. G., and Seewald, J. S. (2019). Abiotic methane synthesis and serpentinization in olivine-hosted fluid inclusions. Proc. Natl. Acad. Sci. U.S.A. 116 (36), 17666–17672. doi:10.1073/pnas.1907871116 |
Klein, F., Tarnas, J. D., and Bach, W. (2020). Abiotic sources of molecular hydrogen on Earth. Elements 16 (1), 19–24. doi:10.2138/gselements.16.1.19
Lewan, M. D., Winters, J. C., and McDonald, J. H. (1979). Generation of oil-like pyrolyzates from organic-rich shales. Science 203 (4383), 897–899. doi:10.1126/science.203.4383.897 |
Lewan, M. D. (1997). Experiments on the role of water in petroleum formation. Geochem. Cosmochim. Acta. 61 (17), 3691–3723. doi:10.1016/s0016-7037(97)00176-2
Li, S., Lin, S., and Guo, S. (2002). Effects of minerals on kerogen pyrolysis hydrocarbon generation. J. Petrol. Univ. (Nat. Sci.) 26 (1), 69–74. doi:10.3321/j.issn:1000-5870.2002.01.022
Liu, Q., Dai, J., Jin, Z., Li, J., Wu, X., Meng, Q., et al. (2016). Abnormal carbon and hydrogen isotopes of alkane gases from the Qingshen gas field, Songliao Basin, China, suggesting abiogenic alkanes? J. Asian Earth Sci. 115, 285–297. doi:10.1016/j.jseaes.2015.10.005
Liu, Q., Zhu, D., Meng, Q., Liu, J., Wu, X., et al. (2018). The scientific connotation of oil and gas formations under deep fluids and organic-inorganic interaction[J]. Science China Earth Sciences. doi:10.1007/s11430-018-9281-2
Liu, J., Liu, Q., Zhu, D., et al. (2019). The function and impact of deep fluid on the organic matter during the hydrogeneration and evolution process[J]. J. Nat. Gas Geosci. 4 (4), doi:10.1016/j.jnggs.2019.07.002
Liu, J., and Tang, Y. (1998). Kinetics of early methane generation from Green River shale. Chin. Sci. Bull. 43 (22), 1908–1912. doi:10.1007/bf02883470
Liu, Q., Zhu, D., Meng, Q., Liu, J., Wu, X., Zhou, B., et al. (2018). Basic connotation of hydrocarbon Formation under deep fluid and Organic-inorganic interaction. Sci. China Earth Sci., 1–22.
Lu, S., Xue, H., and Li, J. (2010). Dynamics of isotope fractionation of natural gas and hydrocarbon and its application [M]. Beijing: Petroleum Industry Press.
Lv, Y., Liu, S., Wu, H., Hohl, S. V., Chen, S., Li, S., et al. (2018). Zn‐Sr isotope records of the Ediacaran Doushantuo Formation in South China: diagenesis assessment and implications[J]. Geochimica et Cosmochimica Acta, 239, doi:10.1016/j.gca.2018.08.003
Ma, X., Zheng, G., Sajjad, W., Xu, W., Fan, Q., Zheng, J., et al. (2018). Influence of minerals and iron on natural gases generation during pyrolysis of type-III kerogen. Mar. Pet. Geol. 89, 216–224. doi:10.1016/j.marpetgeo.2017.01.012
Mango, F. D. (1996). Transition metal catalysis in the generation of petroleum and natural gas. Geochem. Cosmochim. Acta. 56 (1), 553–555. doi:10.1016/0016-7037(92)90153-a
Mango, F. D. (1996). Transition metal catalysis in the generation of natural gas. Org. Geochem. 24 (10–11), 977–984. doi:10.1016/s0146-6380(96)00092-7
Mango, F. D., and Hightower, J. (1997). The catalytic decomposition of petroleum into natural gas. Geochem. Cosmochim. Acta. 61 (24), 5347–5350. doi:10.1016/s0016-7037(97)00310-4
Mango, F. D., Hightower, J. W., and James, A. T. (1994). Role of transition-metal catalysis in the formation of natural gas. Nature 368 (6471), 536–538. doi:10.1038/368536a0
McCollom, T. M. (2013). Laboratory simulations of abiotic hydrocarbon Formation in earth's deep subsurface. Rev. Mineral. Geochem. 75 (1), 467–494. doi:10.2138/rmg.2013.75.15
McCollom, T. M. (2016). Abiotic methane formation during experimental serpentinization of olivine. Proc. Natl. Acad. Sci. U.S.A. 113 (49), 13965–13970. doi:10.1073/pnas.1611843113 |
Meng, Q., Sun, Y., Tong, J., Fu, Q., Zhu, J., Zhu, D., et al. (2015). Distribution and geochemical characteristics of hydrogen in natural gas from the Jiyang Depression, Eastern China. J. Acta Geol. Sin. (Engl. Ed.) 89 (5), 1616–1624. doi:10.1111/1755-6724.12568
Milesi, V., Mccollom, T. M., and Guyot,, F. (2016). Thermodynamic constraints on the formation of condensed carbon from serpentinization fluids [J]. Geochimica Et Cosmochimica Acta. 391–403. doi:10.1016/j.gca.2016.06.006
Newell, K. D., Doveton, J. H., Merriam, D. F., Lollar, B. S., Waggoner, W. M., and Magnuson, L. M. (2007). H2-rich and hydrocarbon gas recovered in a deep precambrian well in northeastern Kansas. Nat. Resour. Res. 16 (3), 277–292. doi:10.1007/s11053-007-9052-7
Pan, C., Yu, L., Liu, J., and Fu, J. (2006). Chemical and carbon isotopic fractionations of gaseous hydrocarbons during abiogenic oxidation. Earth Planet Sci. Lett. 246 (1–2), 70–89. doi:10.1016/j.epsl.2006.04.013
Pinto, F., Gulyurtlu, I., Lobo, L. S., and Cabrita, I. (1999). The effect of catalysts blending on coal hydropyrolysis. Fuel 78 (7), 761–768. doi:10.1016/s0016-2361(98)00212-9
Resing, J. A., Sedwick, P. N., German, C. R., Jenkins, W. J., Moffett, J. W., Sohat, B. M., et al. (2015). Basin-scale transport of hydrothermal dissolved metals across the South Pacific Ocean. Nature 523 (7559), 200–203. doi:10.1038/nature14577 |
Seewald, J. S. (2003). Organic-inorganic interactions in petroleum-producing sedimentary basins. Nature 426 (6964), 327–333. doi:10.1038/nature02132 |
Sherwood Lollar, B., Onstott, T. C., Lacrampe-Couloume, G., and Ballentine, C. J. (2014). The contribution of the Precambrian continental lithosphere to global H2 production. Nature 516 (7531), 379–382. doi:10.1038/nature14017 |
Shuai, Y., Zhang, S., Su, A., et al. (2010). Geochemical evidence for strong ongoing methanogenesis in Sanhu region of Qaidam Basin[J]. Science in China, 53 (001): 84–90. doi:10.1007/s11430-009-0081-4
Suda, K., Ueno, Y., Yoshizaki, M., Nakamura, H., Kurokawa, K., Nishiyama, E., et al. (2014). Origin of methane in serpentinite-hosted hydrothermal systems: the CH4-H2-H2O hydrogen isotope systematics of the Hakuba Happo hot spring. Earth Planet Sci. Lett. 386, 112–125. doi:10.1016/j.epsl.2013.11.001
Telling, J., Boyd, E. S., Bone, N., Jones, E. L., Tranter, M., MacFarlane, J. W., et al. (2015). Rock comminution as a source of hydrogen for subglacial ecosystems. Nat. Geosci. 8 (11), 851–855. doi:10.1038/ngeo2533
Thompson, R. R., and Creath, W. B. (1966). Low molecular weight hydrocarbons in Recent and fossil shells. Geochem. Cosmochim. Acta. 30 (11), 1137–1152. doi:10.1016/0016-7037(66)90034-2
Tivey, M. (2007). Generation of seafloor hydrothermal vent fluids and associated mineral deposits. Oceanogr. 20 (1), 50–65. doi:10.5670/oceanog.2007.80
Keywords: yurtus formation, simulation experiment, catalytic hydrogenation, gaseous yield, isotope fractionation
Citation: Xiaowei H, Zhijun J, Quanyou L, Qingqiang M, Dongya Z, Jiayi L and Jinzhong L (2021) Catalytic Hydrogenation of Post-Mature Hydrocarbon Source Rocks Under Deep-Derived Fluids: An Example of Early Cambrian Yurtus Formation, Tarim Basin, NW China. Front. Earth Sci. 9:626111. doi: 10.3389/feart.2021.626111
Received: 04 November 2020; Accepted: 06 January 2021;
Published: 01 March 2021.
Edited by:
Guodong Zheng, Chinese Academy of Sciences, ChinaReviewed by:
AneKceй BaxиH, Kazan Federal University, RussiaMohamed El Nady, Egyptian Petroleum Research Institute, Egypt
Copyright © 2021 Xiaowei, Zhijun, Quanyou, Qingqiang, Dongya, Jiayi and Jinzhong. This is an open-access article distributed under the terms of the Creative Commons Attribution License (CC BY). The use, distribution or reproduction in other forums is permitted, provided the original author(s) and the copyright owner(s) are credited and that the original publication in this journal is cited, in accordance with accepted academic practice. No use, distribution or reproduction is permitted which does not comply with these terms.
*Correspondence: Jin Zhijun, amluemouc3lreUBzaW5vcGVjLmNvbQ==; Liu Quanyou, bGl1cXkuc3lreUBzaW5vcGVjLmNvbQ==