 Sarah E. Minson
 Elizabeth S. Cochran
 Stephen Wu
 Shunta Noda5
94% of researchers rate our articles as excellent or good
Learn more about the work of our research integrity team to safeguard the quality of each article we publish.
Find out more
ORIGINAL RESEARCH article
Front. Earth Sci. , 02 June 2021
Sec. Geohazards and Georisks
Volume 9 - 2021 | https://doi.org/10.3389/feart.2021.620467
This article is part of the Research Topic The New Frontiers of Earthquake Early Warning Systems View all 22 articles
Earthquake early warning (EEW) systems provide a few to tens of seconds of warning before shaking hits a site. Despite the recent rapid developments of EEW systems around the world, the optimal alert response strategy and the practical benefit of using EEW are still open-ended questions, especially in areas where EEW systems are new or have not yet been deployed. Here, we use a case study of a rail system in California’s San Francisco Bay Area to explore potential uses of EEW for rail systems. Rail systems are of particular interest not only because they are important lifeline infrastructure and a common application for EEW around the world, but also because their geographically broad yet networked infrastructure makes them almost uniquely well suited for utilizing EEW. While the most obvious potential benefit of EEW to the railway is to prevent derailments by stopping trains before the arrival of shaking, the lead time for warnings is usually not long enough to significantly reduce a train’s speed. In reality, EEW’s greatest impact is preventing derailment by alerting trains to slow down or stop before they encounter damaged track. We perform cost-benefit analyses of different decision-making strategies for several EEW system designs to find an optimal alerting strategy. On-site EEW provides better outcomes than source-parameter-based EEW when warning at a threshold of 120 gal (the level of shaking at which damage might occur) regardless of false alarm tolerance. A source-parameter-based EEW system with a lower alerting threshold (e.g., 40 gal) can reduce the exposure to potentially damaged track compared to an on-site system alerting at 120 gal, but a lower alerting threshold comes at the cost of additional precautionary system stops. The optimal EEW approach for rail systems depends strongly on the ratio of the cost of stopping the system unnecessarily to the potential loss from traversing damaged tracks.
The original idea for EEW is generally credited to a piece by Dr J. D. Cooper in the November 3, 1868, San Francisco Daily Evening Bulletin (Nakamura, 1996; Saita and Nakamura, 2003). The idea as first proposed was to send an electrical signal from a network of earthquake sensors to trigger an alarm in the city. The first practical implementation of an EEW system began nearly a hundred years later, in 1965, when a M6.1 earthquake led what is now the Japan Railways Group (JR) to install seismometers every 20–25 km along the Shinkansen bullet train tracks to issue an alert to slow trains if horizontal accelerations exceeding 40 gal were observed (Saita and Nakamura, 2003). In 1984, this EEW system was supplemented by JR’s Coastline Detection System based on seismometers placed along the coast to detect offshore earthquakes. A P-wave scaling relationship was then used to estimate source magnitude and thus decide whether a warning should be issued to the inland Shinkansen system. The Coastline Detection System was later upgraded and replaced with the Urgent Earthquake Detection and Alarm System (UrEDAS) (Saita and Nakamura, 2003). In 2004, JR replaced the UrEDAS with another new EEW system that also estimates source parameters, while continuing its ground-motion-based system of stopping trains if acceleration, bandpass filtered between 0.5 and 5 Hz, exceeds a given threshold (Yamamoto and Tomori, 2013).
In the past three decades, EEW systems designed to notify the general public have been developed all around the world. Some, such as Mexico’s Seismic Alert System (SAS) that began operating August 1991 (Aranda et al., 1995), used similar approaches to JR’s coastline system with near-coast seismometers detecting offshore earthquakes and transmitting warnings to inland population centers. Other systems, such as the Japan Meteorological Agency (JMA) EEW system for Japan (Hoshiba et al., 2008; Doi, 2011), the Central Weather Bureau (CWB) system for Taiwan (Hsiao et al., 2009), and the United States’ ShakeAlert system, which provides warning to the States of California, Oregon, and Washington, take a fundamentally different approach: they all use a network of stations (both onshore and offshore) to detect earthquakes within, and provide warning to, a broad region. In contrast, the JR and original SAS systems were designed only to protect a localized area. Despite this fundamental difference with the JR and original SAS systems, these regional EEW systems typically use methods similar to UrEDAS: seismic data are used to infer the source parameters of the earthquake (i.e., location and magnitude), and this information is then input to a ground motion prediction equation (GMPE) in order to forecast whether the expected shaking will exceed some critical threshold for triggering a warning.
In recent years, different EEW approaches have proliferated, such as algorithms that utilize geodetic data (Murray et al., 2018) or store seismogram filter banks (Meier et al., 2015). JMA has updated their source parameter algorithm using the Integrated Particle Filter (IPF) method and complemented that approach with the ground-motion-based Propagation of Local Undamped Motion (PLUM) method. The IPF method uses a particle filter technique to combine, in a Bayesian estimation framework, ground motion observations and information about where shaking has not been observed (Tamaribuchi et al., 2014). The PLUM method is noteworthy for using ground motion to directly forecast ground motion without first estimating earthquake source parameters (Kodera et al., 2018). But with a few exceptions such as the PLUM method, EEW systems are still largely divided into two camps: source-parameter-based methods (which infer earthquake location and magnitude, and then input that information into a GMPE to identify which regions should be alerted) and on-site methods (which trigger alerts to specific assets when strategically placed seismometers observe shaking above some critical threshold). The ShakeAlert and UrEDAS systems are typical examples of the former, whereas the original JR EEW system exemplifies the latter.
Despite the rapid advancement of EEW in recent years, studies on effective applications of EEW are few, often focusing on creating a cost-benefit analysis framework for rapid decision-making under uncertain EEW information (Iervolino, 2011; Wu et al., 2013). Those studies that have been done on specific EEW engineering applications have tended to explore rather simple scenarios, such as elevator control (Wu et al., 2016), although Cauzzi et al., 2016 focused on the complexities of utilizing EEW for nuclear power plants. Even fewer are the studies that look at specific EEW engineering examples for complex systems and attempt to optimize the EEW system’s performance for that application, with Veneziano and Papadimitriou (2003) being a notable exception. In that study, the authors compared different approaches for determining which sections of the Shinkansen rail system the JR early warning system should close for inspection while minimizing both the total system delay and expected number of derailments.
One of the major challenges of studying EEW applications comes from the complexity of the uncertainty of the EEW system itself interacting with the uncertainty of human decision-makers, especially because EEW-related decisions often involve the potential for human casualties. Another major challenge comes from the physical limitations of EEW. For example, the on-site approach has obvious limitations on the amount of warning it can provide because an alert cannot be issued until shaking is already impinging somewhere along the rail system. On the other hand, previous studies have demonstrated the difficulty in providing timely source-parameter-based EEW especially for the very strong levels of shaking that pose a hazard to heavy infrastructure (e.g., Meier, 2017; Minson et al., 2018; Trugman et al., 2019).
While understanding the role of EEW in a real application is extremely difficult, knowing the true value of EEW and finding an optimal EEW-based emergency response strategy for mitigating seismic risk is essential. In this study, we considered a rail system based on the Northern California Bay Area Rapid Transit (BART) system as an example of a special type of infrastructure network where it is critical not just to forecast shaking at the user’s (i.e., train’s) current location but also at distant parts of the track that the train will later encounter in its route. This presents an almost unique opportunity for EEW since long warning times are possible when an earthquake damages track far from any train’s current location. However, this usefulness is tempered by the fact that trains require a significant amount of time, and thus track length, to stop. By going through an end-to-end case study (from event catalog to cost-benefit analysis of the decision to stop trains), we examine the performance of several different EEW alerting strategies for a rail network located in California. Furthermore, our approach demonstrates a general framework to design decision-making strategies for large-scale EEW applications.
While our goal is to present a framework that can be employed by the relevant decision-makers to guide EEW application to rail systems, it would not be appropriate here to make specific recommendations for rail system operations. Rather than focusing on a specific application, we instead present an example of our framework in which we evaluate the utility of different EEW system designs assuming the theoretical performance of an ideal system with zero noise, data latency, or computational delays, thus quantifying the maximum possible risk reduction from EEW. In so doing, we quantify the maximum theoretical potential benefit of EEW for rail systems, that is, the amount of risk reduction that can be accomplished with EEW given physical limitations such as the closeness between the faults and the track system, and the relative speeds of seismic waves and trains.
Distributed infrastructure networks such as rail systems can utilize EEW uniquely well because there is value to be had from protecting the network as a whole even if timely warning is not possible in the near field where shaking is strongest. An example cartoon of EEW applied to a rail system is shown in Figure 1. Useful EEW for a train directly threatened by the earthquake is actually quite difficult because it takes significant time to bring a train to a complete stop (In the examples that follow, a commuter train in the United States takes ∼17 s to stop while a Shinkansen bullet train can take more than a minute (Arai et al., 2008).) Thus, it would be nearly impossible to halt a train before shaking arrives at its location, especially for trains in the near field of the rupture where shaking is strongest. However, the goal of using EEW to slow and stop trains is generally not to prevent the train from being directly derailed by ground shaking; in fact, being stopped does not necessarily prevent a train from being toppled (e.g., Veeraraghavan et al., 2019). Instead, the goal is to slow or stop the train before it encounters damaged track that might itself trigger a derailment (Veneziano and Papadimitriou, 2003). This means that, except in the unfortunate case where the train’s current location is hit with damaging ground shaking, the train has additional time to stop or take other protective action before it encounters damaged track.
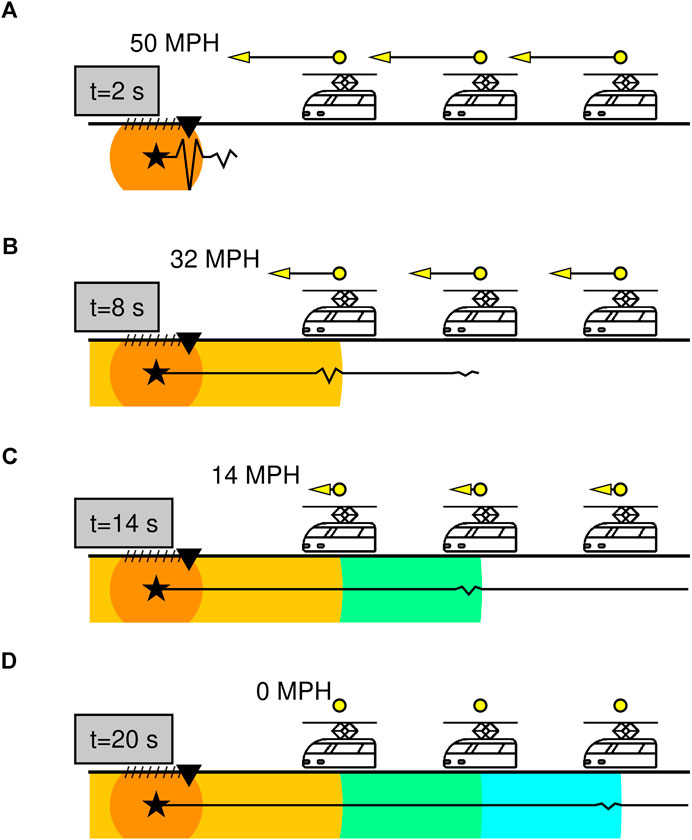
FIGURE 1. Cartoon example of EEW for a rail system. (A) An earthquake nucleates (star) and when shaking reaches a seismometer (black inverted triangle), all trains are signaled to start braking. As time increases (B–D), decreasing amplitudes of shaking reach the locations of more distant trains, which will have been able to further slow. The trains will still be traveling at 32 MPH when the shaking reaches the closest train (B), they will have slowed to 14 MPH by the time shaking reaches the middle train (C), and the trains will be completely stopped just as shaking reaches the most distant train (D). While all but the most distant train will still be traveling at significant speed when the shaking arrives at their locations, they can all be successfully slowed and stopped before traveling to a region where they might encounter damaged track (denoted by hatches). Black wiggles show move-out of P-wave and S-wave, and how shaking amplitude decays with distance. Seismic wave arrival times and amplitudes are calculated assuming a Poisson medium with S-wave velocity of 3.5 km/s and shear modulus of 30 GPa.
For this study, we use the track geometry of the BART system, the light rail serving California’s San Francisco Bay Area (Figure 2). To assess seismic hazard, we use a 1,000-year-duration catalog of earthquake rupture scenarios generated from the earthquake probabilities of the Third Uniform California Earthquake Rupture Forecast with spatiotemporal clustering (UCERF3-ETAS) (Field et al., 2017) (Figure 2A). For each scenario rupture, we calculate the expected horizontal peak ground acceleration (PGA) at all track locations using the Chiou and Youngs (2014) GMPE with the Vs30 model of Allen and Wald (2009) (Figure 2B). Our analysis is done on the rail system as a whole: when potentially damaging shaking is expected at any location along the tracks, all trains are signaled to start braking and potentially halted to allow track inspection. We assume that an alert is issued when the expected shaking exceeds a low level of non-damaging shaking (40 gal) with the goal of slowing or stopping trains before they encounter potentially damaged track (Figure 2C) (40 gal is ∼4% g, equivalent to Modified Mercalli Intensity, MMI, IV-V.) We further assume that track damage occurs at accelerations greater than 120 gal (∼12% g, equivalent to about MMI VI) (Figure 2D). These shaking levels (including the use of units of gal) are taken directly from the original design of the JR EEW system for Japan’s Shinkansen bullet train. In the original system, trains were halted when seismometers detected shaking along the tracks that exceeded 40 gal (Nakamura and Tucker, 1988; Nakamura and Saita, 2007). Shaking corresponding to 40 gal, or MMI ∼ IV, is also a good comparison point for EEW performance in California; when ShakeAlert went live in December 2018, the initial public alerting threshold was set to MMI IV, although that level has since been lowered (Cochran and Husker, 2019). A study of Japan earthquakes that caused track damage found that damage was concentrated at shaking levels exceeding 120 gal (Nakamura, 1996), which is also the level used for triggering stops based on shaking at coastal seismometers (Ogura, 2006; Japan Transport Safety Board, 2013; Strauss and Allen, 2016). More recently, 120 gal has been adopted as a general shaking threshold for safe operation of high-speed rail (Hu et al., 2014).

FIGURE 2. (A) Plot of 1,000 years of ruptures generated with UCERF3-ETAS probabilities. Red box is area shown in plots b-d. (B) Vs30 from topographic proxy. Black lines show train tracks. Numbers in circles show sample locations along tracks for which detailed results will be shown. (C) Frequency of ground motion exceeding 40 gal, i.e., how often alerts to stop trains would be generated. While no location is expected to trigger an alert more than five times per decade, when shaking is expected anywhere, the entire system is alerted. The total number of times the train system would be stopped for this catalog is ∼10 times per decade or once per year. (D) The frequency of potentially damaging ground motions exceeding 120 gal. Text labels denote San Andreas Fault (SAF), Hayward Fault (HF), Calaveras Fault (CF), and the Santa Clara Valley (SCV).
If those criteria were applied to BART track locations using UCERF3-ETAS seismic hazard probabilities, we would expect the rail system to be alerted to PGA>40 gal shaking approximately once per year (Figure 2C), but most of those system alerts would be precautionary. No individual site is expected to be impacted by damaging shaking (PGA>120 gal) more than once per decade (Figure 2D), but damage anywhere could impact system operations everywhere. The rate of earthquakes with hazardous expected ground motions impinging anywhere on the track system is ∼2/decade. These numbers are average shaking rates based on median ground motions, neglecting hazard from small magnitude earthquakes with anomalously strong shaking and temporal clustering of earthquakes. Earthquakes are often clustered in time with, for example, periods of little to no seismicity separating productive mainshock-aftershock sequences. In our 1,000-year chronology, location 13 (city of Fremont) goes as long as 126 years between earthquakes that are expected to produce potentially damaging shaking (PGA>120 gal), but also experiences 12 such events within a one-year period.
All trains in the rail system will be alerted to slow down (and potentially stop) if an alert is triggered for any track location. 78% of system alerts will be precautionary, that is the peak shaking somewhere along the track is forecast to exceed 40 gal (triggering an alert) but potentially damaging shaking (PGA>120 gal) is not experienced anywhere along the tracks. However, this is calculated for median expected ground motions. In reality, ground motion variability can result in a greater number of smaller magnitude earthquakes producing greater than expected shaking (e.g., Minson et al., 2021) making some of these precautionary alerts, in fact, necessary (Minson et al., 2019).
Shaking hazard is not the same everywhere. Among the 22% of alerts that are necessary for the rail system because potentially damaging (PGA>120 gal) shaking occurred somewhere along the tracks (assuming median expected shaking), some track locations are more likely to be directly threatened by shaking and some are more likely to be alerted to stop for shaking in some other part of the rail system. In Figure 3, we plot the breakdown between how often each of 15 sample locations along the tracks will itself be threatened vs. be alerted for potentially damaging shaking elsewhere in the system. Strong shaking is more probable along the southern Hayward Fault and Santa Clara Valley (Figure 2D), and thus sites such as location 12 and location 13 (city of Fremont) are more likely to be directly threatened. However, other locations, such as location 2 (southern San Francisco) and location 9 (eastern exurbs) have low shaking hazard because they are farther from high hazard faults. These locations are mostly alerted to stop when some other part of the system is expected to be in danger due to shaking, their local track is less likely to be damaged, and they are more likely to have plenty of time to slow or stop before encountering damaged track elsewhere. For example, of the 22% of alerts where >120 gal is expected somewhere in the track system, location 13 (Fremont), situated near the Hayward Fault in the flatlands of the East Bay, experiences >120 gal in 36% of those events, while location 2 (south San Francisco) experiences >120 gal in just 10% of those events. Again, note that these percentages are calculated for median expected ground motions.

FIGURE 3. In this example, we consider only median expected ground motions and the system is alerted to stop all trains when 40 gal is observed (for on-site systems) or forecast (for source-parameter-based systems) somewhere on the tracks. Based on the 1,000-year catalog of ruptures, 78% of these alerts will be unnecessary because, although shaking exceeds 40 gal, it does not exceed 120 gal anywhere on the tracks, and thus is not damaging. Of the 22% of cases where stops were required because 120 gal was exceeded somewhere along the tracks, we categorize the alerts into an alert required because >120 gal shaking was recorded at the marked location vs. those required to accommodate stopping the whole system and inspecting for damage because 120 gal was recorded somewhere along the tracks. Shaking of 120 gal is most frequently observed on sites along the southern Hayward Fault (e.g., locations 12 and 13). Locations far from high rupture probability faults (e.g., location 9) most frequently stop due not to local strong shaking but instead strong shaking elsewhere in the train network. Background color shows population density, with darker blues indicating more population.
To date, most EEW analyses focus on how much warning time a particular location receives, defined as the time difference between when a location is alerted until when hazardous shaking arrives at that location (e.g., Meier, 2017; Minson et al., 2018). With trains, the main goal is to give the train enough warning to stop not before the shaking gets to the train's current location, but before the train traverses damaged tracks. For completeness and comparison to existing studies, we first analyze how much warning time a train gets before it experiences shaking. But then, in the next section, we instead explore how the distributed nature of track systems makes them ideal for EEW because there is potentially significant time to take protective action before a train encounters damaged track.
The amount of warning time at any location will be the elapsed time from when the rail system is alerted until shaking arrives at that location. But when is the rail system alerted? The answer depends on the type of EEW system deployed.
In Japan, the first EEW system installed by JR was what might be termed an on-site ground-motion-based EEW system: seismometers were deployed along the tracks and if shaking above 40 gal was detected anywhere, the local tracks were de-energized (Nakamura and Tucker, 1988). More recently, this system has been augmented with a network source-parameter-based EEW system that uses seismic waveforms to estimate the location and magnitude of an earthquake, inputs that information into a GMPE to forecast shaking, and, if the predicted shaking exceeds the alerting threshold, issues an alert. This latter system design is the same as the ShakeAlert EEW system being operated in California, Oregon, and Washington States (Given et al., 2018).
At each second as the rupture expands, we compute the peak shaking at every point along the tracks to determine when an on-site ground motion system could issue an alert (i.e., when shaking exceeds 40 gal) and when dangerous shaking arrives (i.e., shaking exceeds 120 gal). Because we assume ideal noise-free EEW system performance, one station exceeding 40 gal is sufficient to trigger an alert. Real-world system operators might prefer to use data from multiple seismometers (co-located or not) to confirm an event before issuing an alert, but not necessarily. The original on-site JR system de-energized track and warned controllers when any seismometer exceeded 40 gal (Nakamura and Tucker, 1988).
We also input the current accumulated magnitude and rupture extent at each second of the evolving rupture into a GMPE (Chiou and Youngs, 2014) to forecast shaking at every point along the tracks to determine when a source-parameter-based system could issue an alert. Note that this is an ideal limit to how fast EEW could operate. We have ignored all system latencies including data telemetry, analysis, and alert distribution, and have implicitly assumed an infinitely dense seismic network. We have further assumed that all EEW shaking forecasts are perfect when, in reality, ground motion is highly variable and will cause source-parameter-based EEW to have many missed alerts and some false alerts even if the source parameters of the earthquake rupture are known perfectly (Minson et al., 2019; Saunders et al., 2020).
Several points are worth noting about how ground motion variability affects EEW performance and how we treat shaking variability in this study. While ground motion models (i.e., GMPEs) constrain the variability of shaking at any location due to an earthquake rupture, unfortunately little is known about the spatial covariance of shaking. Thus, for much of the analyses that follow, all ground motions by necessity are fixed to the median expected value predicted by the GMPE. We compute the hazard exposure of the rail system, and potential gains and losses, as long-term expected values so that the specific spatial variation of shaking in any particular earthquake averages out. But two important caveats about our analysis remain. First, we will be missing additional exposure from earthquakes that produce unusually strong shaking for their magnitude. Second, as discussed earlier, because ground motion varies from median expected values, real source-parameter-based EEW shaking forecasts will be uncertain, leading to missed and false alerts when shaking turns out be stronger or weaker than expected, respectively. On-site ground-motion-based EEW systems, barring some sort of instrumental malfunction, never produce these types of missed and false alerts because they are triggering warnings based on the actual observed shaking. (These missed and false alerts are separate and in addition to unnecessary stops resulting from the alerting threshold being lower than the shaking threshold at which damage is expected, as in our example where we alert at 40 gal but damage is expected at PGA>120 gal.) By ignoring forecasting errors from source-parameter-based EEW systems, our analysis inflates the potential usefulness of source-parameter-based approaches relative to both their real-world performance and the performance of on-site ground-motion-based approaches.
It is worth noting that ground motion variability is not addressed explicitly in most EEW systems. Instead, the most common way that EEW systems incorporate ground motion variability is by setting an alerting threshold that is significantly less than the target level of ground motion for which the user would actually like to take action, thus helping ensure that the user is alerted to take action in cases that an earthquake produces stronger shaking than expected. For example, the original on-site JR EEW system used an alerting threshold of 40 gal even though damage is not expected for shaking that is less than 120 gal (Nakamura and Tucker, 1988; Nakamura, 1996; Nakamura and Saita, 2007; Hu et al., 2014). Another example would be the ShakeAlert EEW system in the United States. When the system went live in December 2018, the alerting threshold was MMI IV for a target level of MMI VI. Since then, the target level has been decreased to felt shaking (MMI IV) and the alerting level has been correspondingly lowered (Cochran and Husker, 2019).
Most trains in the BART system have a maximum speed of 70 MPH and make 20-s stops at each station [http://bart.gov/about/history/facts]. We assume that a train in motion has an average speed of 50 MPH. When braking, BART trains can decrease their speed by 3 MPH every second requiring just under 17 s to come to a complete stop over a distance of 0.1 mi (186 m) (https://www.bart.gov/guide/safety/earthquake).
In Figures 4, 5, we present an example of the performance, in the conventional EEW view, of a source-parameter-based EEW system that alerts when forecast shaking exceeds 40 gal (although damage is not expected unless shaking exceeds 120 gal). (Up to now our analysis has held equally for on-site and source-parameter-based systems.) For each earthquake in the full 1,000-year-duration UCERF3-ETAS catalog, we compute the final velocity to which a train at each of the 15 example locations in Figure 1 could decelerate before peak shaking arrives. (For simplicity, we assume that peak shaking is carried by the direct S-wave.) These example locations were chosen to explore the variety of experiences a train could encounter from being close to a high hazard fault to far from any fault, from being in a place with high local ground motion amplification to being on a hard rock site.
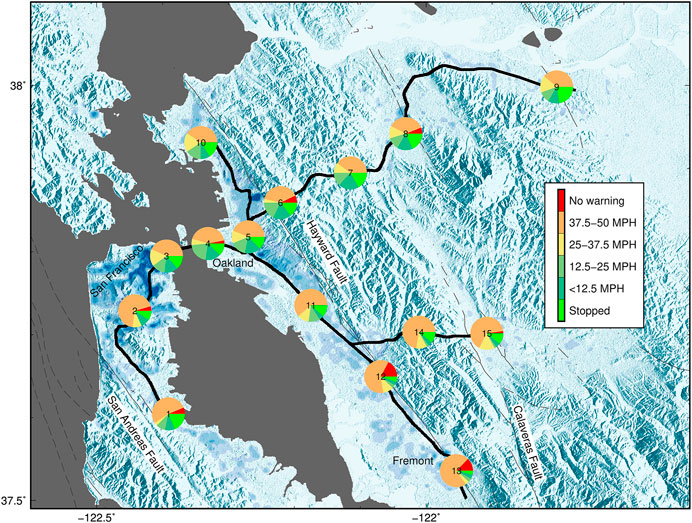
FIGURE 4. Based on the 1,000-year UCERF3-ETAS rupture catalog, we plot the percentage of earthquakes for which trains traveling at 50 MPH have sufficient warning time to stop, to slow to less than 12.5 MPH, to slow to 12.5–25 MPH, 25–37.5 MPH, 37.5–50 MPH, or have no warning at all. In general, the no warning outcome only occurs for locations very close to major faults, such as locations 12–13 on the southern Hayward Fault. But locations that are far from major faults, e.g., location 3 in downtown San Francisco, always receive at least some warning. However, at every location, warning is usually not sufficient to decrease velocity by even half. Background color shows population density, with darker blues indicating more population. Warning times are calculated for a source-parameter-based EEW system that alerts all trains to stop when 40-gal shaking is forecast anywhere in the track system.
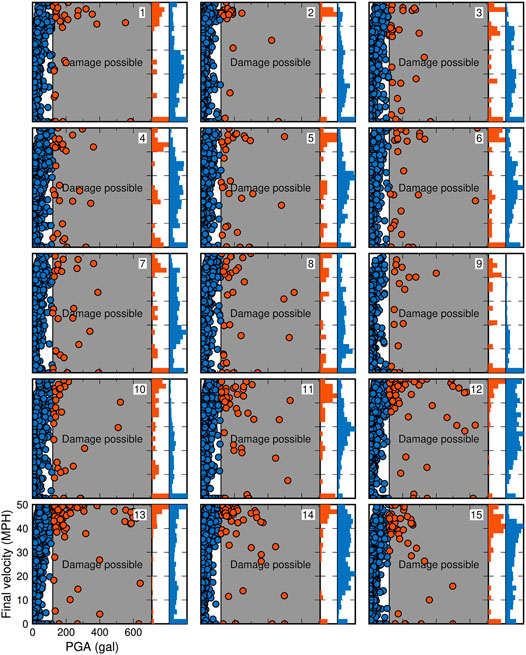
FIGURE 5. Final train velocity at all locations due to all earthquakes in the 1,000-year UCERF3-ETAS catalog. Each circle represents the final velocity to which a train at that location could decelerate for a single earthquake. Circles are colored red if the median expected ground motion is at least 120 gal at that location and thus could cause damage at the train’s current location, blue otherwise. Marginal histograms show total frequency of occurrence. While trains can often be slowed to low velocities, most damaging shaking (red circles) arrive with little warning time, generally allowing trains to only slow by 10 MPH or so. EEW system design is same as Figure 4.
The average amount of warning is 8.4 s, averaged over all track locations for all earthquakes in the scenario catalog. This is about half the time necessary to completely stop a train traveling at 50 MPH, and it is rare for any location to receive enough warning to completely halt a train before peak shaking arrives (Figure 4). However, not all trains are traveling at full speed, and 8 s is sufficient to decrease train velocity by more than 20 MPH.
The above statistics are for all earthquakes in the 1,000-year catalog, including the events that did not cause hazardous shaking at the example location. In Figure 5, we separate outcomes based on whether hazardous shaking (defined as PGA>120 gal or ∼12% g) is experienced at that specific location (assuming median ground motions). Locations that experience hazardous shaking typically have short warning times such that only minimal braking can occur. For example, at location 13 (Fremont), of the 78 events with hazardous median expected shaking (>120 gal or ∼12% g), 63 events (81%) result in such little warning that a train could only decelerate <10 MPH before dangerous shaking arrived.
Neglecting any false alarms due to technical or forecasting errors, an EEW system (either on-site or source-parameter-based) that alerts at 120 gal would have zero unnecessary stops (Figure 6). However, raising the alert threshold to 120 gal would decrease potential warning times since the EEW system would have to wait for the waveforms to increase in amplitude (for on-site EEW systems) or wait for more moment to be released by the evolving rupture (for source-parameter-based EEW systems) before it could issue an alert. If an on-site system is triggered by the S-wave arrival, the average warning time across the track system would be 7.3 s for an on-site system and 7.1 s for a source-parameter-based system. The source-parameter-based system lags slightly behind the on-site system despite benefiting from observations near the earthquake source because it takes substantial time for the earthquake source process to release sufficient magnitude that the source-parameter-based system can forecast at least 120 gal shaking anywhere along the tracks (Minson et al., 2018), while the on-site system can issue an alert as soon as strong shaking impinges anywhere on the track system. If we consider only sites along the track that experience damaging shaking (PGA>120 gal), the average warning time decreases to just 3.6 and 3.3 s for on-site and source-parameter-based EEW, respectively.
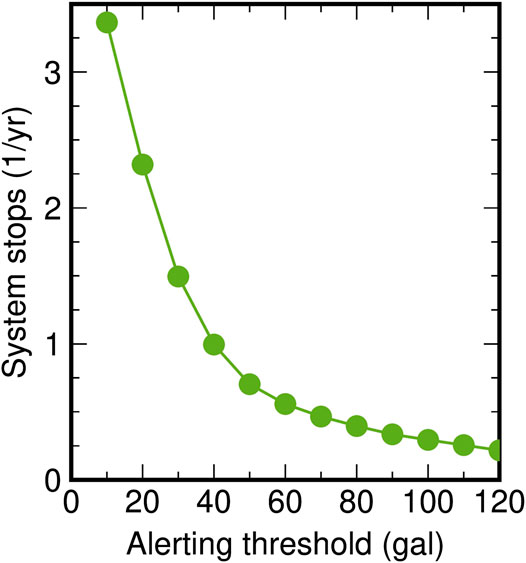
FIGURE 6. Number of system stops for different choices of the forecast ground motion level that triggers an alert. This represents both the number of stops for a source-parameter-based system that perfectly forecasts observed shaking or an on-site system neglecting ground motion variability.
Conversely, warning times could be increased by lowering the alerting threshold. However, lower alerting thresholds also increase the frequency with which the train system would be halted unnecessarily. It is worth noting that seismicity rates are so low in the San Francisco Bay Area that choosing an alert threshold of just 10 gal (∼1%g) would cause ∼3.5 system stops per year, but allow for an average of 11.7 s warning at all sites and 7.5 s at sites exceeding 120 gal for a source-parameter-based EEW system.
The preceding analysis looks at the ability to stop a train at any location before dangerous shaking arrives at that location. But when it comes to protecting rail systems, EEW does not need to stop (or slow) the train before the shaking arrives at the train’s location. It primarily needs to stop the train before it arrives at a location where the tracks are damaged. In this section, we consider how EEW can best accomplish this (much more achievable) goal.
We again assume that the entire rail system is halted if observed (for on-site EEW systems) or forecast (for source-parameter-based EEW systems) shaking exceeds the alerting threshold anywhere along the tracks. If the train’s current location is not itself subject to damaging shaking, it is assumed that the train can be safely slowed or stopped without danger of encountering damaged track. If the PGA at the current location does end up being so large as to potentially cause damage, the train is assumed to be able to begin safely slowing. However, once the S-wave arrives, the tracks might be damaged, and the train faces the hazard of traversing potentially damaged track for the distance of track it travels from that time until it comes to a complete stop. If braked at 3 MPH/second, it takes about 186 m to come to a stop from an initial speed of 50 MPH. The longer the advance warning the train receives from the EEW system, the more braking will occur before the S-wave arrives, and the stopping distance from that reduced velocity (that is, the amount of potentially damaged track traversed) will be proportionately lowered.
We compute the distance of potentially damaged track that a train at two sample locations (3-San Francisco and 13-Fremont) is expected to traverse based on the 1,000-year-duration UCERF3-ETAS catalog given alerts from ideal on-site and source-parameter-based EEW systems (Figures 7A,B). The distance of potentially damaged track crossed in each earthquake is simply the fraction of the stopping distance that is traveled after the arrival of potentially damaging (>120 gal) shaking. (Peak shaking at each point along the track is calculated as described in the Methodology section.)
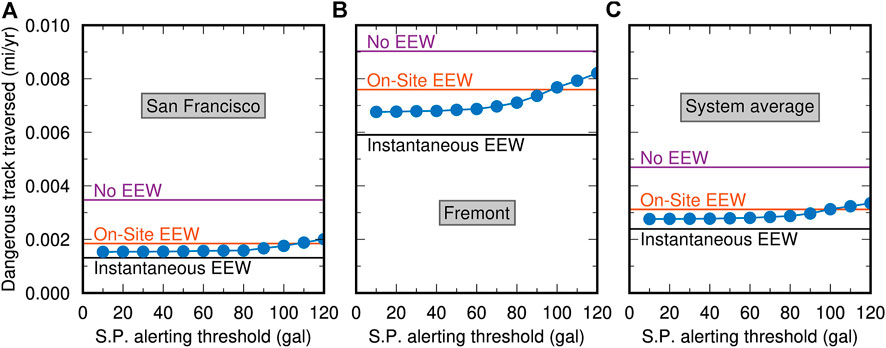
FIGURE 7. Exposure to potentially damaged track, that is, track that is expected to experience at least 120 gal shaking, in miles per year. Blue lines and symbols show expected performance for a source-parameter-based EEW system as a function of the threshold expected shaking that triggers an alert. Performance is shown for track locations in (A) San Francisco and (B) Fremont, and (C) averaged over the entire track system. For comparison, we also show the expected dangerous track traversed for an on-site EEW system (that alerts when 120 gal is observed anywhere in the train system), an instantaneous EEW system that alerts at the instant the earthquake nucleates, and the situation of no EEW system in which case the train began braking once shaking arrived. The lower the alerting threshold, the earlier an alert is triggered, and the less stopping distance occurs after shaking has arrived and potentially damaged the track.
We also plot the average exposure to potentially damaged track across the whole system (Figure 7C). San Francisco and Fremont represent end-members: San Francisco is farther from hazardous faults, and thus less often directly impacted by dangerous shaking (Figure 3), so trains located there more often can completely avoid encountering damaged track. Fremont is close to the hazardous Hayward Fault, more often directly impacted, and thus trains there will more often encounter damaged track. The expected exposure averaged over all locations in the track system is, as expected, in between these two end-members.
In addition to considering an alerting threshold of 40 gal, we examine how different alerting thresholds change the outcomes. Lower alerting thresholds allow alerts to be issued earlier because less of the rupture has to be observed to forecast that shaking will exceed a lower threshold than a higher threshold (Minson et al., 2018), and earlier alerting means braking initiates sooner after the earthquake begins and reduces stopping distance over potentially damaged track (Figure 7). However, the cost of lowering the alerting threshold is that the EEW system will issue more precautionary alerts, resulting in possibly many stops for smaller earthquakes that never go on to produce potentially damaging shaking (Figure 6). For the source-parameter-based EEW system, we consider expected outcomes for alert thresholds ranging from 10 gal (∼1% g) to the damage threshold (120 gal, or ∼12% g).
Ideally, we would repeat this comparison of different alerting thresholds for on-site EEW as well. Indeed, we should note that the original threshold for triggering a warning based on observations at along-track seismometers (as opposed to coastal seismometers) is not the damage threshold of 120 gal but rather 40 gal (Nakamura and Tucker, 1988; Nakamura and Saita, 2007), which presumably yields additional warning time from when the 40 gal threshold is crossed until shaking reaches 120 gal at the cost of causing unnecessary system stops when an event that causes 40 gal shaking does not go on to produce 120 gal shaking. However, given limited knowledge of the ratio of S-wave amplitudes to P-wave amplitudes, or the evolution of shaking amplitudes throughout an earthquake rupture, we cannot reliably model when specific thresholds of shaking will be exceeded in a waveform. So we can only consider the performance of a reference on-site ground-motion-based EEW system that is triggered when the S-wave impinges somewhere on the track system and, for simplicity, we assume that the threshold that triggers alerts is set to 120 gal and thus there are zero unnecessary system stops.
We also consider the reference case of a rail system that does not have the benefit of EEW. For this case, we assume that the train operator begins braking as soon as they feel shaking, specifically the arrival of the S-wave (This assumption is based on author S.N.’s interview with JR drivers, 2008.) If the S-wave amplitude is > 120 gal, then the train is exposed to potentially damaged track for the full stopping distance.
The final case we explore is that of a system that receives an EEW alert the instant that an earthquake nucleates that will eventually grow to produce damaging shaking and which never triggers unnecessary system stops. This is not a realistic scenario. The purpose of this scenario is not to explore any actual potential EEW system performance but rather to quantify how much damaged track is simply impossible to avoid given the geometry between earthquake ruptures and track locations, as well as the stopping distance of trains. The performance of any other EEW system design should then not be evaluated based on whether it eliminates the possibility of traversing any damaged track but rather on how close the amount of potentially damaged track traversed is to this theoretical floor.
We find that on-site warning systems provide more protection (as measured by the amount of potentially damaged track traversed) than source-parameter-based EEW systems when the alerting threshold is set to the level of potentially damaging shaking (120 gal, or ∼12% g). However, a source-parameter-based EEW system that utilizes an alerting threshold less than 120 gal could potentially provide trains with additional braking time before the S-wave arrives, decreasing the amount of potentially damaged track traversed. Lowering the ground motion level that triggers an on-site alert would presumably also increase warning time and decrease the amount of hazardous track traversed. Unfortunately, we cannot quantify whether it adds more or less warning time than lowering the source-parameter-based EEW alerting threshold. Regardless of the type of EEW system, alerting at lower thresholds comes at the cost of more systemwide stops (Figure 6); but, for on-site systems, the number of stops may be further increased by ground motion variability triggering an alert due to outlier motions from small earthquakes.
We can perform a rudimentary cost-benefit analysis by assuming that there is some expected loss for running a train over a unit distance of potentially damaged track (track that has been exposed to 120 gal or higher) and that there is also some loss associated with stopping the system be it necessarily (to inspect potentially damaged tracks) or unnecessarily (when an alert was issued for an earthquake too small to cause damage). Following the approach in Minson et al., 2019, Minson et al., 2020, and Saunders et al., 2020, we non-dimensionalize the costs by defining a ratio, r, the false alarm tolerance of the system. That is, r is the expected loss per unit distance of potentially damaged track traveled to the cost for stopping the train system (either necessarily or unnecessarily). If this ratio is large, then the system is very false-alarm tolerant and it is advantageous to alert for little earthquakes just in case they grow into damaging earthquakes even though that will result in unnecessary system stops. If r is small (a relatively false-alarm-intolerant system), then the optimal strategy is to stop the system only when it is very likely that damage could occur so as to minimize the number of relatively costly system stops (Figure 8).
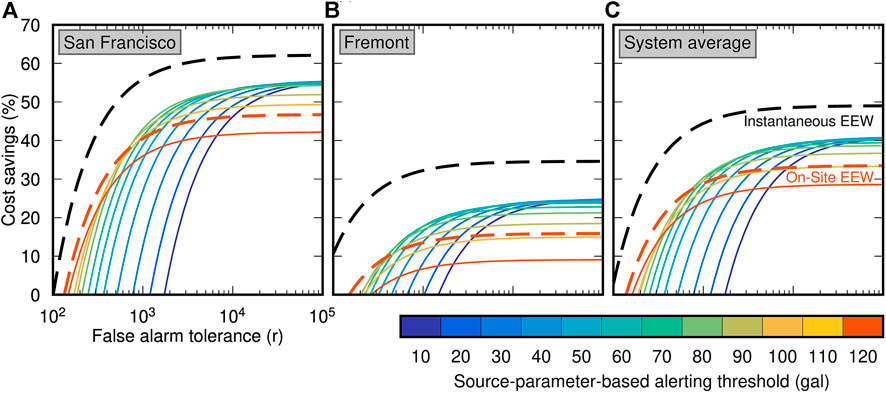
FIGURE 8. Cost savings for different alerting strategies as a function of false alarm tolerance. Each colored line is the cost savings that could be realized if a source-parameter-based EEW system alerted when the forecast shaking exceeded a specified threshold (ranging from 10 to 120 gal). The black dashed line shows the cost savings for a perfect instantaneous EEW system that alerted at the moment the earthquake nucleated. This is the maximum possible cost savings that could be realized but is less than 100% due to the physical limitations that trains require a finite distance to stop and the fact that even necessary stops due to hazardous shaking incur some cost. Finally, the red dashed line shows the expected cost savings from an on-site EEW system that triggers an alert when 120 gal is observed anywhere along the tracks (The two red lines present cost savings for EEW systems with alerting thresholds of 120 gal. The dashed red line is an on-site EEW system and the solid red line is a source-parameter-based EEW system.) Cost savings is computed for locations in (A) San Francisco and (B) Fremont, and averaged over the entire track system (C).
Each rail system must determine its own false alarm tolerance, r, in order to identify the optimal EEW alerting strategy for that rail system. The value may vary from system to system depending on factors such as infrastructure fragility, train speeds and braking ability, seismicity rates, shaking hazard, and public expectations about earthquake safety and public transit reliability. The considerations surrounding EEW for Shinkansen trains are not the same as California commuter rail systems in almost every aspect from operations (e.g., speed), to seismic hazard (the most significant earthquakes in Japan are offshore while onshore continental faults dominate in California), to the expectations of its ridership. But what we can say is that, if r is large, then a source-parameter-based approach with a low alerting threshold (such as has been adopted by both JR and the new ShakeAlert EEW system) may be the best approach. But if r is smaller, then the winning approach is to use on-site ground-motion-based alerting (similar to the original JR system). Further, on-site EEW provides better outcomes than source-parameter-based EEW when warning at the damage threshold of 120 gal regardless of false alarm tolerance.
For the systemwide analysis (Figure 8C), the minimum r value for which source-parameter-based EEW could outperform on-site EEW is just less than r = 800 (for an alerting threshold of 80 gal or ∼8% g). So, for example, if running over 1 mi of track exposed to >120 gal shaking has a 50% chance of causing a derailment costing $1.6 million in loss (so that the expected loss is $800,000) and the loss to the rail operator and its passengers for stopping the entire system unnecessarily is just $1,000, then r = 800. If the cost of halting all trains unnecessarily is relatively higher than this example ratio, then on-site EEW is the winning strategy; if the expected loss for running a train over a unit length of dangerous track is relatively higher, then source-parameter-based EEW with a low alerting threshold is the optimal choice.
However, that conclusion comes with two enormous caveats. First, we were unable to quantify the effects of lowering the alerting threshold for on-site EEW, and thus we cannot determine how an on-site EEW system with low alerting threshold compares to a source-parameter-based system with low alerting threshold. Second, this cost-benefit analysis assumed that the source-parameter-based EEW system could perfectly forecast shaking without error or uncertainty. But ground motion is in reality highly variable; observed ground motions are log-normally distributed with typically a factor of 2 scatter (e.g., Gregor et al., 2014). Minson et al., 2019 demonstrated that the effects of this variability are so large that, even if a source-parameter-based EEW system always perfectly forecast the median expected shaking, the choice to alert or not alert for an earthquake would turn out to be incorrect the majority of the time when an earthquake expected to be dangerous ended up producing weaker-than-expected shaking or a small earthquake thought inconsequential ended up producing hazardous shaking. Because of this, source-parameter-based EEW systems must be tuned to alert for smaller earthquakes than those expected to cause damaging shaking so as to avoid missing an alert when an earthquake produces shaking stronger than the median expected shaking that is forecast when its magnitude and location are input to a GMPE. In contrast, on-site ground-motion-based EEW is in a sense a perfect shaking forecast: either shaking was seen at the tracks and an alert was required, or there was no shaking and no alert was needed. This contrast between the large uncertainty in source-parameter-based EEW systems and relative lack of uncertainty in on-site ground motion systems, combined with neglecting increased warning times for on-site systems with low alerting thresholds, might mean that the on-site approach is favorable for all values of r. Further, we have not considered system latencies, such as telemetry latencies to send networked data back to a processing center, or latencies to transmit messages to slow trains or trigger de-energization. If these latencies are significant, on-site systems may have additional advantages in that they do not need to send data to a center for processing and may even be able to directly trigger automated actions.
Alternatively, perhaps the effects of the uncertainty in the shaking forecast would be absorbed into the desire to alert for low levels of shaking so as to potentially give trains additional warning time. (This is especially likely for systems where r is large.) Or perhaps JR’s approach of combining source-parameter-based and on-site EEW systems provides optimal protection. Untangling these factors would require a much larger study and knowing the value of r for real-world rail systems.
While EEW has been utilized for rail systems in Japan since 1966 (Nakamura and Tucker, 1988), public EEW in California did not begin until the end of 2018. There are several important differences between United States rail systems and JR’s Shinkansen line. On one hand, United States trains travel much slower than bullet trains and can be stopped sooner; a Shinkansen train traveling at full speed has similar braking speed but takes an order of magnitude longer to stop: 4,000 m or 2.5 miles (Arai et al., 2008) compared to 186 m or 0.1 miles for BART. On the other hand, seismic hazard in California is dominated by continental faults such that hazardous earthquakes rupture much closer to railways than the subduction zone events that contribute significantly to seismic hazard in Japan, and thus warning times will tend to be shorter in California. In fact, the only derailment of an in-service passenger train due to earthquake shaking suffered in the 40-year history of the Shinkansen line was caused by the 2004 Mw6.6 Niigata-Chuetsu earthquake, an onshore earthquake that occurred too close to the tracks (Horioka, 2013). Additionally, a test train derailed during the 2011 Mw9.0 Tohoku-oki earthquake (Horioka, 2013; Japan Transport Safety Board, 2013), an in-service train derailed in 2013 in poor weather (Straits Times, 2013), and an out-of-service train derailed during the 2016 Kumamoto sequence (Goda et al., 2016).
By analyzing a 1,000-year chronology of scenario earthquake ruptures from UCERF3-ETAS, we have explored how effective EEW might be for California rail systems and how it can best be utilized. Despite the slower speed of the trains, the warning is generally only enough to slow but not completely stop trains before dangerous shaking arrives. However, rail systems are uniquely good candidates for utilizing EEW, because it is just as important to stop trains before they reach some other part of the track system that may have been damaged. In this second, unique framework, there is significant potential for EEW to limit trains’ exposure to damaged tracks. Although, it is worth noting that even so, one of EEW’s greatest benefits may be psychological (in terms of reassuring the ridership) (Nakayachi et al., 2019) or as a training opportunity for rail systems to practice earthquake response. In fact, of the 100 times that the Shinkansen system was stopped due to EEW alerts in the first 20 years that its EEW system was operating, only twice were tracks deformed and, in both cases, the deformation was so minor that it did not pose a derailment hazard (Nakamura and Tucker, 1988).
Rail systems can additionally benefit from EEW because warnings have value even if the warning time is too short to complete protective actions. Many potential EEW protective actions are all or nothing or, worse, may lead to increased harm if shaking arrives mid-action. For example, some piece of infrastructure that is in the process of being moved into a protected state may be more vulnerable to shaking than if it had been left in its normal operational state. But even if a train does not receive sufficient warning to completely stop before encountering damaged track, it can still utilize whatever warning it does receive to slow as much as possible before reaching the damaged area.
These observations indicate that EEW should be seen less as a standalone system and more as part of a continuum of real-time and near-real-time earthquake information. Here, too, rail systems have been forerunners. Long before ShakeAlert development began in the United States, the United States Geological Survey provided freight and passenger trains with normal (non-EEW) locations of M5+ earthquakes as soon as they were available so that the railroads could slow and stop trains and inspect tracks (Hasenberg, 2019). This is not EEW in its strict definition as the alert came after the earthquake rupture had finished and shaking had ceased. But it functioned exactly as EEW should; it provided users with warning so that their trains could take protective action before they encountered dangers caused by earthquake shaking.
In this paper, we have explored the many ways that rail systems can especially benefit from EEW or even real-time earthquake information that is too slow to be considered early warning in other applications. Other types of networked infrastructure could similarly derive these extra benefits. Besides passenger and freight rail, any type of transportation system that involves moving discrete items, such as road networks, should be able to receive similar benefits. While systems that involve continuous flow, such as power and gas lines, may not be able to achieve all the benefits of discrete systems like rail (where there is always some chance that the shaking will impact an unoccupied section of the network), our analysis illustrates how warnings can be used to mitigate loss across the system even if the warning does not come early enough to prevent exposure and loss everywhere in the system.
Our analysis indicates that on-site EEW provides better outcomes than source-parameter-based EEW when warning at the damage threshold of 120 gal regardless of false alarm tolerance. This is because it takes too long for an earthquake rupture to evolve to a large enough magnitude that a source-parameter-based system can forecast that shaking will exceed 120 gal (See Conventional Earthquake Early Warning View: How Much Warning Does Each Location Receive? for warning time comparison and Minson et al., 2018 for background discussion.). A source-parameter-based EEW system with a lower alerting threshold (e.g., 40 gal) can further reduce the exposure to potentially damaged track compared to an on-site system alerting at 120 gal, increasing the average warning time to 8.4 s compared to 7.9 s for on-site warning. However, this comes at the cost of more frequent halting of the rail system unnecessarily. An alerting threshold of 40 gal would result in one stop/yr on average, which is about 4.5 times the rate of earthquakes whose median expected ground motion is potentially damaging (>120 gal) anywhere in the system. The optimal EEW approach for rail systems depends strongly on the ratio of the cost of traversing damaged tracks to the cost of halting the system, with a higher potential benefit if that ratio is large.
We demonstrated a framework with which to examine the application of EEW to distributed systems. Our framework uses earthquake rupture probabilities and ground motion models to forecast both hazard and potential warning times across a geographically distributed infrastructure network. It then uses a cost-benefit analysis that considers expected gains and losses across the entire network as well as potential marginal increases in gain with changes in warning time (also varying across the network) to guide selection of the optimal EEW system design. Real-world use of this framework to make actionable decisions on the appropriate alerting threshold will be highly dependent on what amplitude of ground motion is damaging, r values, and other considerations of the specific application. In this paper, we have developed the framework for application to rail systems, but each rail system must consider and assign values (including monetary and societal consideration) to the costs associated with precautionary stops and the benefit from slowing trains when damaging shaking occurs.
Lack of knowledge limits our analysis in two areas. First, we lack models for the spatial covariance of ground motions, limiting our ability to calculate shaking hazard across the entire rail system. Second, the lack of models for S to P ratios and for how shaking amplitudes evolve with time during a rupture prevents us from considering how lowering the alerting threshold for on-site ground-motion-based EEW systems could increase warning time. If the seismological community were to develop models for shaking covariance and evolution, it could potentially have significant impacts on the EEW community including improved performance assessments of ground-motion-based EEW methods such as PLUM, quantifying the potential utility of EEW methods that aim to predict peak shaking from P-wave amplitudes (Kodera, 2018), and improving real-time shaking forecasts.
The raw data supporting the conclusions of this article will be made available by the authors, without undue reservation.
SM, EC, and SW jointly designed the analysis. SM conducted the analysis. SN provided technical data on EEW and rail systems. SM, EC, SW, and SN jointly prepared the manuscript.
Any use of trade, firm, or product names is for descriptive purposes only and does not imply endorsement by the United States Government.
The authors declare that the research was conducted in the absence of any commercial or financial relationships that could be construed as a potential conflict of interest.
The authors would like to thank a host of people at BART for helpful background discussions on EEW for rail systems. These kind people include Kevin Copley, Chung-Soo Doo, Kristyl Horton, and Charles Weiland. Morgan Page and Kevin Milner generously provided a chronology of scenario earthquakes drawn from the UCEF3-ETAS model (Field et al., 2017). The authors would also like to thank Bob deGroot for facilitating this collaboration; and Annemarie Baltay, Andy Michael, and Evelyn Roeloffs for reviewing the manuscript.
Allen, T. I., and Wald, D. J. (2009). On the Use of High-Resolution Topographic Data as a Proxy for Seismic Site Conditions (VS30). Bull. Seismological Soc. America 99, 935–943. doi:10.1785/0120080255
Arai, H., Kanno, S., and Yanase, N. (2008). Brake System for Shinkansen Speed Increase. JR East Tech. Rev. 12, 12–15.
Aranda, J. M. E., Jimenez, A., Ibarrola, G., Alcantar, F., Aguilar, A., Inostroza, M., et al. (1995). Mexico City Seismic Alert System. Seismological Res. Lett. 66 (6), 42–53. doi:10.1785/gssrl.66.6.42
Cauzzi, C., Behr, Y., Le Guenan, T., Douglas, J., Auclair, S., Woessner, J., et al. (2016). Earthquake Early Warning and Operational Earthquake Forecasting as Real-Time hazard Information to Mitigate Seismic Risk at Nuclear Facilities. Bull. Earthquake Eng. 14 (9), 2495–2512. doi:10.1007/s10518-016-9864-0
Chiou, B. S.-J., and Youngs, R. R. (2014). Update of the Chiou and Youngs NGA Model for the Average Horizontal Component of Peak Ground Motion and Response Spectra. Earthquake Spectra 30 (3), 1117–1153. doi:10.1193/072813EQS219M
City of Los Angeles Emergency Management Department’s 2019 Report, “Earthquake Alerts: City of LA Announces New Earthquake Early Warning App”. (last accessed December 18, 2019).
Cochran, E. S., and Husker, A. L. (2019). How Low Should We Go when Warning for Earthquakes? Science 366, 957–958. doi:10.1126/science.aaz6601
Doi, K. (2011). The Operation and Performance of Earthquake Early Warnings by the Japan Meteorological Agency. Soil Dyn. Earthquake Eng. 31, 119–126. doi:10.1016/j.soildyn.2010.06.009
Field, E. H., Milner, K. R., Hardebeck, J. L., Page, M. T., van der Elst, N., Jordan, T. H., et al. (2017). A Spatiotemporal Clustering Model for the Third Uniform California Earthquake Rupture Forecast (UCERF3‐ETAS): Toward an Operational Earthquake Forecast. Bull. Seismological Soc. America 107 (3), 1049–1081. doi:10.1785/0120160173
Given, D. D., Allen, R. M., Baltay, A. S., Bodin, P., Cochran, E. S., Creager, K., et al. (2018). Revised Technical Implementation Plan for the ShakeAlert System-An Earthquake Early Warning System for the West Coast of the United States. Geol. Surv. Open-File Rep. 2018–1155, 42. doi:10.3133/ofr20181155
Goda, K., Campbell, G., Hulme, L., Ismael, B., Ke, L., Marsh, R., et al. (2016). The 2016 Kumamoto Earthquakes: Cascading Geological Hazards and Compounding Risks. Front. Built Environ. 2, 2–17. doi:10.3389/fbuil.2016.00019
Gregor, N., Abrahamson, N. A., Atkinson, G. M., Boore, D. M., Bozorgnia, Y., Campbell, K. W., et al. (2014). Comparison of NGA-West2 GMPEs. Earthquake Spectra 30, 1179–1197. doi:10.1193/070113eqs186m
Hasenberg, C. (2019). Development of Earthquake Early Warning Systems. Geological Society of the Oregon Country. Available at:
Horioka, K. (2013). Clarification of Mechanism of Shinkansen Derailment in the 2011 Great East Japan Earthquake and Countermeasures against Earthquakes. JR East Tech. Rev. (27), 13–16.
Hoshiba, M., Kamigaichi, O., Saito, M., Tsukada, S. Y., and Hamada, N. (2008). Earthquake Early Warning Starts Nationwide in Japan. Eos Trans. AGU 89 (8), 73–74. doi:10.1029/2008eo080001
Hoshiba, M. (2013). Real-time Prediction of Ground Motion by Kirchhoff-Fresnel Boundary Integral Equation Method: Extended Front Detection Method for Earthquake Early Warning. J. Geophys. Res. Solid Earth 118, 1038–1050. doi:10.1002/jgrb.50119
Hsiao, N. C., Wu, Y. M., Shin, T. C., Zhao, L., and Teng, T. L. (2009). Development of Earthquake Early Warning System in Taiwan. Geophys. Res. Lett. 36 (5), L00B02. doi:10.1029/2008gl036596
Hu, Q., Gao, N., and Zhang, B. (2014). High Speed Railway Environment Safety Evaluation Based on Measurement Attribute Recognition Model. Comput. Intell. Neurosci. 2014, 1–10. doi:10.1155/2014/470758
Iervolino, I. (2011). Performance-based Earthquake Early Warning. Soil Dyn. Earthquake Eng. 31 (2), 209–222. doi:10.1016/j.soildyn.2010.07.010
Japan Transport Safety Board (2013). “Train Derailment Accident in the Premises of Sendai Station of the Tohoku Shinkansen of the East Japan Railway Company,” in Railway Accident Investigation Report. Available at: (Accessed February 22, 2013).
Kodera, Y., Yamada, Y., Hirano, K., Tamaribuchi, K., Adachi, S., Hayashimoto, N., et al. (2018). The Propagation of Local Undamped Motion (PLUM) Method: a Simple and Robust Seismic Wavefield Estimation Approach for Earthquake Early Warning. Bull. Seismol. Soc. America 108, 983–1003. doi:10.1785/0120170085
Kodera, Y. (2018). Real-time Detection of Rupture Development: Earthquake Early Warning Using P Waves from Growing Ruptures. Geophys. Res. Lett. 45, 156–165. doi:10.1002/2017GL076118
Meier, M. A., Heaton, T., and Clinton, J. (2015). The Gutenberg Algorithm: Evolutionary Bayesian Magnitude Estimates for Earthquake Early Warning with a Filter Bank. Bull. Seismol. Soc. America 105 (5), 2774–2786. doi:10.1785/0120150098
Meier, M.-A. (2017). How "good" Are Real-Time Ground Motion Predictions from Earthquake Early Warning Systems? J. Geophys. Res. Solid Earth 122, 5561–5577. doi:10.1002/2017JB014025
Minson, S. E., Meier, M.-A., Baltay, A. S., Hanks, T. C., and Cochran, E. S. (2018). The Limits of Earthquake Early Warning: Timeliness of Ground Motion Estimates. Sci. Adv. 4, eaaq0504. doi:10.1126/sciadv.aaq0504
Minson, S. E., Baltay, A. S., Cochran, E. S., Hanks, T. C., Page, M. T., McBride, S. K., et al. (2018). The Limits of Earthquake Early Warning: Accuracy and Best Alerting Strategy. Scientific Rep. 9 (1), 2478. doi:10.1038/s41598-019-39384-y
Minson, S. E., Saunders, J. K., Bunn, J. J., Cochran, E. S., Baltay, A. S., Kilb, D. L., et al. (2020). Real-Time Performance of the PLUM Earthquake Early Warning Method during the 2019 M 6.4 and 7.1 Ridgecrest, California, Earthquakes. Bull. Seismol. Soc. Am. 110, 1887–1903. doi:10.1785/0120200021
Minson, S. E., Baltay, A. S., Cochran, E. S., McBride, S. K., and Milner, K. R. (2021). Shaking Is Almost Always a surprise: the Earthquakes that Produce Significant Ground Motion. Seismol. Res. Lett. 92, 460–468. doi:10.1785/0220200165
Murray, J. R., Crowell, B. W., Grapenthin, R., Hodgkinson, K., Langbein, J. O., Melbourne, T., et al. (2018). Development of a Geodetic Component for the U.S. West Coast Earthquake Early Warning System. Seismol. Res. Lett. 89 (6), 2322–2336. doi:10.1785/0220180162
Nakamura, Y., and Saita, J. (2007). “UrEDAS, the Earthquake Warning System: Today and Tomorrow,” in Earthquake Early Warning Systems. Berlin, Heidelberg: Springer, 249–281.
Nakamura, Y., and Tucker, B. E. (1988). Japan's Earthquake Warning System: Should it Be Imported to California? Calif. Geology., 33–40.
Nakamura, Y. (1996). “Real-time Information Systems for Hazards Mitigation,” in Proceedings of the 11th World Conference on Earthquake Engineering. Mexico: Acapulco. doi:10.2514/6.1996-2078
Nakayachi, K., Becker, J. S., Potter, S. H., and Dixon, M. (2019). Residents' Reactions to Earthquake Early Warnings in Japan. Risk Anal. 39 (8), 1723–1740. doi:10.1111/risa.13306
Ogura, M. (2006). The Niigata Chuetsu Earthquake-Railway Response and Reconstruction. Jpn. Railway Transport Rev. 43 (44), 46–63.
Saita, J., and Nakamura, Y. (2003). Early Warning Systems for Natural Disaster Reduction. Berlin, Heidelberg: Springer, 453–460. doi:10.1007/978-3-642-55903-7_58
Saunders, J. K., Aagaard, B. T., Baltay, A. S., and Minson, S. E. (2020). Optimizing Earthquake Early Warning Alert Distance Strategies Using the July 2019 Mw 6.4 and Mw 7.1 Ridgecrest, California, Earthquakes. Bull. Seismol. Soc. America 110 (4), 1872–1886. doi:10.1785/0120200022
Straits Times, (2013). High-speed Bullet Train Derails in Japan: Media. Available at: (Accessed March 2, 2013).
Strauss, J. A., and Allen, R. M. (2016). Benefits and Costs of Earthquake Early Warning. Seismological Res. Lett. 87 (3), 765–772. doi:10.1785/0220150149
Tamaribuchi, K., Yamada, M., and Wu, S. (2014). A New Approach to Identify Multiple Concurrent Events for Improvement of Earthquake Early Warning. Jssj 67 (67), 41–55. (in Japanese with English abstract and figure captions). doi:10.4294/zisin.67.41
Trugman, D. T., Page, M. T., Minson, S. E., and Cochran, E. S. (2019). Peak Ground Displacement Saturates Exactly when Expected: Implications for Earthquake Early Warning. J. Geophys. Res. Solid Earth 124, 4642–4653. doi:10.1029/2018jb017093
Veeraraghavan, S., Heaton, T. H., and Krishnan, S. (2019). Lower Bounds on Ground Motion at Point Reyes during the 1906 San Francisco Earthquake from Train Toppling Analysis. Seismological Res. Lett. 90 (2A), 683–691. doi:10.1785/0220180327
Veneziano, D., and Papadimitriou, A. G. (2003). “Optimizing the Seismic Early Warning System for the Tohoku Shinkansen,” in Early Warning Systems for Natural Disaster Reduction. Berlin, Heidelberg: Springer, 727–734. doi:10.1007/978-3-642-55903-7_97
Wu, S., Beck, J. L., and Heaton, T. H. (2013). ePAD: Earthquake Probability‐based Automated Decision‐making Framework for Earthquake Early Warning. Computer‐Aided Civ. Infrastruct. Eng. 28 (10), 737–752. doi:10.1111/mice.12048
Wu, S., Cheng, M. H., Beck, J. L., and Heaton, T. H. (2016). An Engineering Application of Earthquake Early Warning: ePAD-Based Decision Framework for Elevator Control. J. Struct. Eng. 142 (1), 04015092. doi:10.1061/(asce)st.1943-541x.0001356
Keywords: earthquake early warning, cost-benefit analysis, rail systems, San Francisco Bay area, natural hazards warning
Citation: Minson SE, Cochran ES, Wu S and Noda S (2021) A Framework for Evaluating Earthquake Early Warning for an Infrastructure Network: An Idealized Case Study of a Northern California Rail System. Front. Earth Sci. 9:620467. doi: 10.3389/feart.2021.620467
Received: 22 October 2020; Accepted: 21 May 2021;
Published: 02 June 2021.
Edited by:
Huseyin Serdar Kuyuk, Harvard University, United StatesReviewed by:
Matteo Picozzi, University of Naples Federico II, ItalyCopyright © 2021 Minson, Cochran, Wu and Noda. This is an open-access article distributed under the terms of the Creative Commons Attribution License (CC BY). The use, distribution or reproduction in other forums is permitted, provided the original author(s) and the copyright owner(s) are credited and that the original publication in this journal is cited, in accordance with accepted academic practice. No use, distribution or reproduction is permitted which does not comply with these terms.
*Correspondence: Sarah E. Minson, c21pbnNvbkB1c2dzLmdvdg==
Disclaimer: All claims expressed in this article are solely those of the authors and do not necessarily represent those of their affiliated organizations, or those of the publisher, the editors and the reviewers. Any product that may be evaluated in this article or claim that may be made by its manufacturer is not guaranteed or endorsed by the publisher.
Research integrity at Frontiers
Learn more about the work of our research integrity team to safeguard the quality of each article we publish.