
94% of researchers rate our articles as excellent or good
Learn more about the work of our research integrity team to safeguard the quality of each article we publish.
Find out more
ORIGINAL RESEARCH article
Front. Earth Sci., 04 May 2021
Sec. Volcanology
Volume 9 - 2021 | https://doi.org/10.3389/feart.2021.619587
This article is part of the Research TopicSeismicity in Volcanic AreasView all 20 articles
 Ardianto Ardianto1
 Andri Dian Nugraha2,3*
 Haunan Afif4
 Devy Kamil Syahbana4
 David P. Sahara2
 Zulfakriza Zulfakriza2,3
 Sri Widiyantoro2,5
 Awali Priyono2
 Shindy Rosalia2Asep Saepuloh6,7Kasbani Kasbani4Faiz Muttaqy1
 Puput P. Rahsetyo1Imam C. Priambodo1,4
 Martanto Martanto1,4
Local seismic tomography is a well-known and commonly used method for obtaining detailed information about the internal structure of volcanoes. The eruption of Mt. Agung in 2017 was a vital opportunity scientifically because it is the first eruption that had sufficient seismic observation networks to carry out local seismic tomography at this volcano. In this study, we investigate the subsurface structure of Mt. Agung in Bali, which is one of the highest risk volcanoes in Indonesia. We conducted travel-time tomography using P- and S-wave arrival times of volcano-tectonic (VT) events to determine the three-dimensional (3D) Vp, Vs, and Vp/Vs ratio structure beneath Mt. Agung. We used 1,926 VT events, with corresponding 9482-P and 8683-S wave arrival times recorded by eight seismic stations over an observation time spanning from October 18 to December 31, 2017. We obtain the hypocenter solution for VT events using the maximum likelihood estimation algorithm and use an optimum 1D velocity model as input for the Joint 3-D seismic tomographic inversion. Local earthquake tomography revealed five anomalous regions that are useful to describe the overall seismic activity around Mt. Agung. We interpret these anomalous regions qualitatively due to limited data resolution in this study. We have successfully localized a high Vp/Vs ratio (∼1.82), low Vs (−1.9%) and high Vp (+3.8%), within a low seismicity zone at depths between 2 and 5 km below the Mt. Agung summit, which may be related to a shallow magma reservoir. There is also an anomalous region between Mt. Agung and Batur with moderate to high Vp/Vs ratios (1.76–1.79) where most of the earthquakes recorded before the 2017 eruption originated. We interpret this anomaly to be related to the existence of sub-vertical dyke complex at depths between 8 and 14 km. The results of our study provide new insights into the subsurface structure of the magma plumbing system beneath Mt. Agung, which can be used to improve the quality of determining the location of the hypocenter and source modeling for future eruption forecasting.
Seismic delay time tomography is one of the most commonly used methods to provide detailed information about the internal structure of a volcano. Subsurface velocity structures can provide knowledge about geometry, location and dimensions of volcano’s plumbing system, and can be used to improve the quality of hypocenter location and source modeling that are useful for eruption forecasting. Seismic tomography has been proven successful in providing images of the magmatic system beneath volcanoes in Indonesia, such as Mt. Merapi (Widiyantoro et al., 2018) and Mt. Sinabung (Nugraha et al., 2019). The 2017 Mt. Agung eruption was a vital opportunity scientifically because it was instrumentally recorded for the first time at this volcano. This event encourages more advanced studies of the subsurface magmatic system of Mt. Agung.
Mt. Agung in Bali island is one of the highest-risk volcanoes in Indonesia, given the dense population and the intense socio-economic activities around the volcano; moreover, the volcano is one of the most popular tourist destinations in Indonesia. In August 2017, Mt. Agung started to show a significant increase in volcanic activity indicated by the emergence of an earthquake swarm, thermal anomaly, and deformation that eventually followed by series of eruptions from November 21, 2017 to June 13, 2019. The overall crisis has triggered the evacuation of ∼140,000 people within an area of 9–12 km from the volcano’s summit (Syahbana et al., 2019). Prior to the 2017 eruption, Mt. Agung experienced a VEI 5 eruption in 1963 that led to ∼1,700 casualties and considerable damage to buildings and infrastructures, mainly due to volcanic bombs, pyroclastic flows, and lahars (Zen and Hadikusumo, 1964). The 1963 eruption produced significant stratospheric aerosol clouds and affected global climate conditions (Rampino and Self, 1982). Consequently, this event was considered one of the most important volcanic eruptions in the twentieth century (Rampino and Self, 1984). Based on tephrostratigraphic analysis, Mt. Agung has, on average, one VEI ≥2–3 eruption per century with the possibility of about 25% of the eruptions having an equal or larger magnitude than the 1963 event (Fontijn et al., 2015). Therefore, studying this volcano’s behavior is very important as a basis in the framework of volcanic disaster mitigation.
Mt. Agung is an active Sunda arc stratovolcano which was formed in the subduction zone where the Indo-Australian plate subducts below the Sunda block (Figure 1A). The edifice of Mt. Agung consists of an almost symmetrical cone, aligned along a NW-SE direction with the nearby Abang and Batur-Pawon volcanoes (PVMBG, 2014). Mt. Agung’s composition range is limited to basaltic andesite, and occasionally andesite, e.g., the 1963 lava flow and the 1843 eruption, and there is no evidence for large Plinian-style fall or ignimbrite deposits (Fontijn et al., 2015). In contrast Mt. Batur has a broader compositional range from basalt to rhyolite, over time the composition of erupted rocks becomes more mafic (Sutawidjaja, 2009). Mt. Batur has several dacitic ignimbrite deposits as markers of the formation of Batur Caldera. The volcanic activities of Mt. Agung and Mt. Batur were correlated a number of times, such as in the eruptions in 1821 and 1963 (PVMBG, 2014). This temporal correlation and occurrence of an earthquake swarm between Mt. Agung and Mt. Batur before the 2017 eruption raises the possibility of a subsurface connection between these two volcanoes. However, currently there is no concrete evidence regarding the connectivity of the magma chamber between Mt. Agung and Mt. Batur. Furthermore, the lavas from the two volcanoes have different compositions (Geiger et al., 2018), and fumarolic activity prior to the 2017 eruption was limited to the Mt. Agung crater (Syahbana et al., 2019).
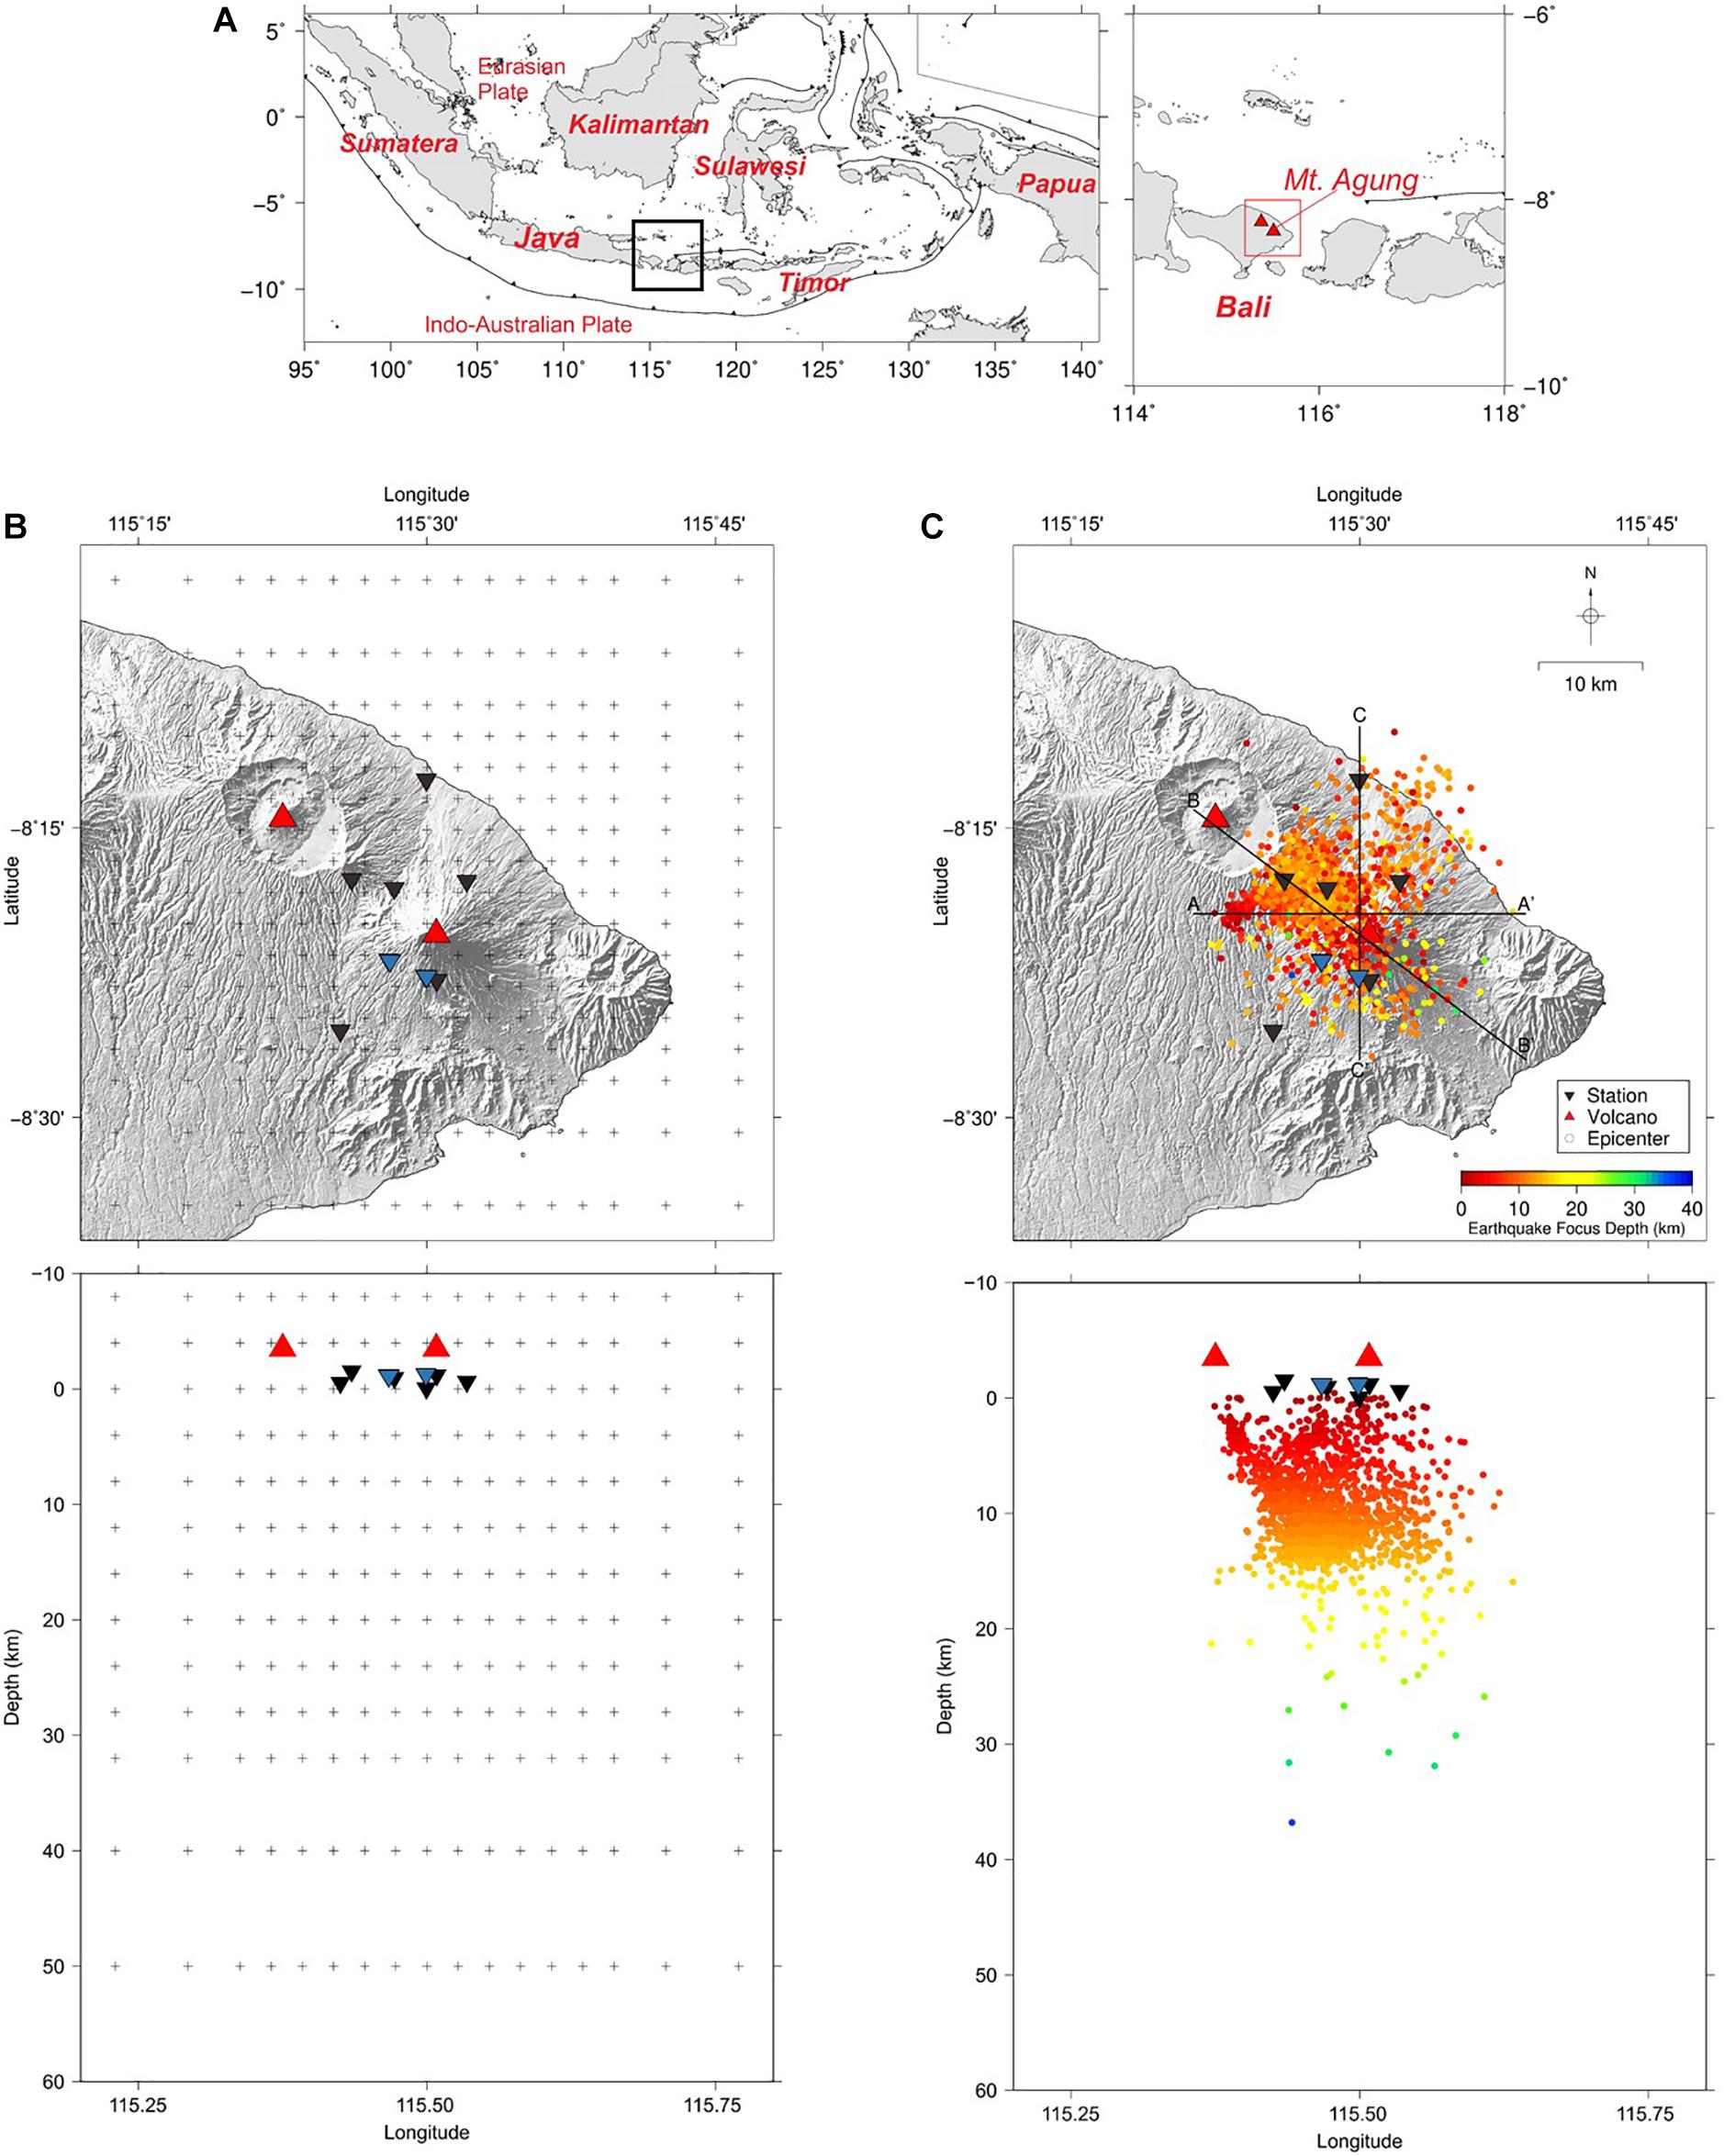
Figure 1. (A) Map of Indonesia: jagged black lines denote the subduction trench; the black square denotes the local area of Bali (right); the red square in the inset map defines the study area. (B) Map of the study area. The red triangles represents the summits of Mt. Agung and Mt. Batur; blue and black inverted triangles show the distribution of the one and three component seismic stations used in this study; exact locations of the seismic stations are provided in Supplementary Table 1. The grid node location used for tomographic inversion is denoted by black plus symbols. (C) Epicenter and hypocenter distributions of 1, 926 VT events used in this study are shown as colored dots; color indicates the event focal depth. The hypocenters are projected along longitude (below) to show focus depth distribution. Three labeled black lines: A-A’ (east to west), B-B’ (southwest to northeast), and C-C’ (north to south) depict the locations of the vertical cross-sections through Mt. Agung; these sections are used for plotting the synthetic resolution test results (Figure 2) and the seismic velocity structures (Figures 3, 4).
Several studies have been conducted to infer the structure of the volcanic features. A petrological analysis using mineral-melt thermobarometry data of the 1963 lava flows shows the existence of two major magma storage regions: the first region is located around the Moho depth at about 18–22 km, and the second one is in the shallower region at about 3–7 km depth (Geiger et al., 2018). The most recent study of the ambient seismic noise tomography around the areas also shows a low-velocity anomaly zone between Mt. Agung and Mt. Batur at a depth of about 2 km below the surface (Zulfakriza et al., 2020). The authors interpreted the low-velocity zone as volcanic deposits from past eruptions in the topographic saddle between Mt. Batur and Mt. Agung and the presence of over-pressurized hydrothermal fluids where seismicity may be induced at shallow depths. Unfortunately, these studies were limited to the shallower structures; thus, there is still little information about this volcano’s magma plumbing system.
Syahbana et al. (2019) proposed two conceptual models of Mt. Agung, using multi-disciplinary approaches, including seismicity, deformation, geochemistry, and remote sensing analysis. The authors explained that the first model was initially used during the beginning of the crisis; they speculated that the magma rising beneath the Agung volcano led to over-pressurization of groundwater; the stress then activated a pre-stressed fault causing VT earthquakes between Mt. Agung and the Batur Caldera. The fault geometry was deduced based on the focal mechanism of the existing earthquake swarm. However, the authors found that this model was not consistent with the newly acquired InSAR Sentinel-1 data (i.e., Albino et al., 2019). Therefore, they preferred the second model based on the intrusion of a dyke at ∼10 km depth northwest of Mt. Agung. This dyke intrusion model would further imply that pre-eruptive seismicity was due to magma intrusion. However, pressurization of groundwater or magmatic fluids in the region above the inferred dyke could have played a role in triggering earthquakes. The intrusion of the dyke was responsible for the observed inflation and the swarm of VT earthquakes. These conceptual models provide an opportunity for more detailed subsurface investigations for validation.
In developing the previous conceptual models, the authors have used the data from the Center for Volcanology and Geological Hazard Mitigation (CVGHM) of Indonesia and the regional station network of the Indonesian Meteorology, Climatology, and Geophysics Agency (BMKG). The seismicity analysis used local observation networks. In this paper, we mainly employed seismic tomography to provide more detailed information on subsurface structures and refine the aforementioned conceptual models.
The data used throughout this paper were obtained from eight seismic stations installed around Mt. Agung by the CVGHM (Figure 1B). Initially, there were only 2 vertical (1-C) short-period seismometers (TMKS and PSAG) to monitor seismic activity on Mt. Agung. In response to increased seismic activity, 6 three components (3-C) broadband seismometers (ABNG, CEGI, REND, YHKR, BATU, and DUKU) were deployed and the installation was completed on 18 October 2017. All stations record seismic data continuously with sample rates of 100 and 50 samples per second. We analyzed seismic data from 18 October to 31 December 2017, where the station network was sufficiently large. This timeframe includes the period before, during, and after the Mt. Agung eruption, which occurred on November 21, 2017. Syahbana et al. (2019) show that the seismic activity increased rapidly in mid-September 2017 and then started to decrease significantly on 20 October. Our data captured the end of the seismic crisis. The spatiotemporal distributions of the earthquake hypocenter we used (Supplementary Figure 1) showed an earthquake swarm at a shallow depth between Mt. Agung and Batur, and then the seismicity cluster moved toward Mt. Agung. After the eruption, the number of recorded VT earthquakes decreased and the distribution of the hypocenter location became more diffuse than before the eruption.
Data processing begins with event identification; we used the Filter Picker algorithm from Lomax et al. (2012) for automatic event detection. The minimum signal to noise ratio (SNR) value for the signal categorized as an event is 1.5 in all detecting stations. Additionally, at least two other stations are required to have identified the signal as an event within 10 s of the detection time from one of the stations. This criteria effectively reduces false positives, which may occur due to random noise. We have successfully used this algorithm for identifying the aftershocks of the 2018 Lombok earthquakes (Sasmi et al., 2020).
Afterward, the waveform traces were manually picked using Seisgram2K software (Lomax and Michelini, 2009) to determine the P- and S-wave first arrival times of each identified event. Only local volcano-tectonic (VT) earthquake arrival times that were successfully determined by at least three stations were used in the next stage. In total, 4,618 VT events were identified using automatic event detection. The events’ selection and arrival times picking resulted in 3,948 VT events with 18,741 P- and 17,237 S-phases, respectively. Our results show that most of the VT events occurred in October 2017 and diminished as the date of the initial eruption drew nearer; this result is in accordance with that described by Syahbana et al. (2019).
We used the Non-LinLoc program (Lomax et al., 2000), a non-linear inversion method to determine the hypocenter’s location and its origin time. The program uses the octree approach, namely, recursive sampling and division of cells in 3D space based on the maximum posterior density function (pdf) in the center of the cell being evaluated. The optimum solution for the hypocenter location and origin time is obtained based on the maximum likelihood or the minimum misfit. The Non-LinLoc hypocenter solution’s quality is evaluated using the RMS error value and the largest principal axis value of 68% confidence ellipsoid, which was obtained by conducting singular value decomposition (SVD) of the matrix covariance.
The initial hypocenter solution and its origin time were obtained using the 1D seismic velocity model of Central Java (Koulakov et al., 2009) to generate the travel time calculated; this model was used because there is no local seismic velocity model available in this area. The 1D velocity model was then updated using the VELEST program (Kissling et al., 1994) to obtain the optimum local 1D velocity model. The seismicity catalog used for inversion tomography was obtained after inverting the data using Non-LinLoc by utilizing the optimum 1D velocity model. Further details regarding the hypocenter location’s determination and the final catalog can be seen in Sahara et al. (2020), along with this publication.
We used the 3-D inversion program SIMULPS12 (Evans et al., 1994) to invert the 3-D velocity structure and relocate the hypocenter solution. This program applied an iterative, damped least-squares algorithm to simultaneously update the hypocenter solution and 3-D Vp and Vp/Vs structure. The Vp/Vs structure was updated using S-P times directly; this approach is considered to be more robust than computing Vp/Vs by Vp and Vs division (Eberhart-Phillips, 1986). The synthetic travel times for P- and S-waves were solved using a pseudo-bending technique through an updated 3D velocity model (Um and Thurber, 1987; Supplementary Figure 2).
Prior to the stated processes, we selected events from the seismic catalog based on the following criteria: hypocenter spatial uncertainty of less than 5 km, an azimuthal gap of less than 300°, and the number of recorded P and S phase pairs at more than three stations. After the quality control process, there were a total of 1,926 VT events, corresponding to 9,482 and 8,683 P- and S-wave arrival times, respectively. Although this selection process significantly reduced the number of used events, it yields well-constrained hypocenters to stabilize inversion results. The hypocenter distribution used as input can be seen in Figure 1C. Most of the VT events were located inside the seismic network between Mt. Agung and Mt. Batur. The VT event’s focus depth is shallower than 30 km, with the highest density of VT events located at a depth range of 5–15 km on the northwest side of Mt. Agung.
Appropriate grid parameters were obtained by considering the recovery of checkerboard resolution tests (CRT) for a wide variety of grid sizes. Due to the inverse problem’s mix-determined nature, damping was imposed to produce a stable solution for each tested grid parameter. Optimum values for Vp and Vp/Vs initial damping parameters were derived by comparing data variance (misfit) with model variance for a series of one-step inversions with a variation of damping values forming an L-curve or trade-off curve (Eberhart-Phillips, 1986), and we allow the SIMULPS program to automatically update the damping values for succeeding iterations. CRT was performed using these damping parameters for each tested grid parameter. In order to evaluate the synthetic resolution test results more appropriately, we add Gaussian noise with a mean of 0 and a standard deviation of 0.2 s to the synthetic data. The grid parameters that provided the best recovery for this data set were a grid node size of 3 × 3 km horizontally and 4 km for vertical parameterization (Figure 1B). The appropriate station, Vp, and Vp/Vs damping values for this configuration are 10, 50, and 40, respectively (Supplementary Figure 3).
The tomographic inversion was first performed to obtain a 3-D Vp model using the optimum 1-D velocity in determining the hypocenter solution as the initial velocity model (Supplementary Figure 4). We used an initial Vp/Vs value of 1.70 as constant, estimated from a Wadati diagram of the data recorded on our local network (Sahara et al., 2020). We compared the results of the two tomographic inversion workflows. The first method starts with generating a detailed Vp model and then proceeds to a simultaneous inversion for both Vp and Vp/Vs. When inverting the 3-D Vp model, the S-wave travel time was used to constrain the hypocenter location, but the Vp/Vs value was kept constant. The 3-D Vp model was used as the initial model for the Vp/Vs inversion. This second inversion process allows for updating both 3-D Vp and Vp/Vs. The second method is to directly invert Vp and Vp/Vs simultaneously from the initial 1D velocity model. Both inversion processes use the same grid and damping parameters, as obtained in the preliminary steps.
Then we evaluate the effect of the inversion grid by comparing the inversion results of the grid parameters that have been shifted from their initial position. We shift the grid 1 km upward, eastward, and northward. For the initial grid velocity model that is shifted eastward and northward, it remains the same as the initial grid, because the initial model used is 1D, but in the upward direction it is necessary to make adjustments by doing linear interpolation. If the grid spacing is close to the true resolution capability and the damping is properly chosen, then the inversion result of the shifted grid should give comparable results.
To investigate the robustness of our new 3-D seismic velocity model, the inversion result was tested using mathematical parameters and a synthetic model. The mathematical parameters used are: ray hit count (RHC), derivative weight sum (DWS) (Toomey and Foulger, 1989), and diagonal resolution elements (DRE) (Menke, 1989), while checkerboard resolution tests (CRT) were used for synthetic tests. The synthetic test was first performed by making a synthetic velocity model, an alternating positive and negative perturbation (±10%) of the optimum 1D velocity model. We added Gaussian noise with a mean of 0 and a standard deviation of 0.2 s to the synthetic data. Then the inversion was carried out using the same procedure, parameters, and grid spacing as used in the inversion of real observation data. The well-resolved regions are indicated by the excellent recovery of synthetic velocity anomaly patterns in CRT and high RHC, DWS, and DRE values. In general, this method is useful for detecting regions that lack resolution but provides limited information regarding the real model recovery (Lévěque et al., 1993; Rawlinson and Spakman, 2016).
First, we compare the results of the two inversion workflows. The resulting total weighted RMS, final P- and S-P data variance from the first method (first invert 3D Vp with constant Vp/Vs, then do simultaneous inversion of Vp, Vp/Vs, and hypocenter from the initial 3D Vp velocity model) is 0.09030 s, 0.00773 s2, and 0.00860 s2, respectively. Whereas the second method (simultaneous inversion of Vp, Vp/Vs, and hypocenter from the 1D velocity model) is 0.09057 s, 0.00788 s2, and 0.00855 s2. Comparison of the final travel time residuals for P- and S-waves of the two methods is plotted as histograms in Supplementary Figure 5 and seismic velocity structure in vertical cross-sections (A-A’, B-B’, C-C’) in Supplementary Figures 6–10. It can be observed that the first method can give better results in terms of misfit compared to the second method. The Vp and Vp/Vs results of the two methods appear comparable, but Vs produces a slightly different pattern. However, in the first method, it can be seen that the result of the velocity structure Vs is very similar to the Vp. This may be due to the inversion scheme. Because the Vp value is optimum and the program inverts the Vp/Vs value instead of Vs, so the Vs value will only be slightly updated. These two factors cause the anomaly pattern of Vs to have a tendency to follow the anomaly pattern of Vp, while the second method does not have such a tendency. We, therefore, decided to use the second method even though first method has a smaller misfit.
The RHC, DWS, and DRE values for horizontal and vertical cross-sections are presented in Supplementary Figures 11–18. The CRT results for horizontal slices and vertical cross-sections are presented in Supplementary Figures 19–23 and Figure 2. Reconstruction of the synthetic test results shows reasonably good recovery for depths from 0 to 8 km but lower resolution for the deeper layer (Supplementary Figures 19–23); this is similar to regions with relatively high DRE, DWS, and RHC values. A fair resolution was achieved in the area between Mt. Agung and Batur (northwest of Mt. Agung). The eastern region of Mt. Agung lacks resolution because most of the events and the stations are in the western part of the volcano. The results of the inversion of the velocity model obtained have sufficient resolution, this is indicated by the similarity of the Vp, Vs, and Vp/Vs patterns between the initial grid parameters and those that have been shifted upward, eastward, and northward (Supplementary Figures 24–26).
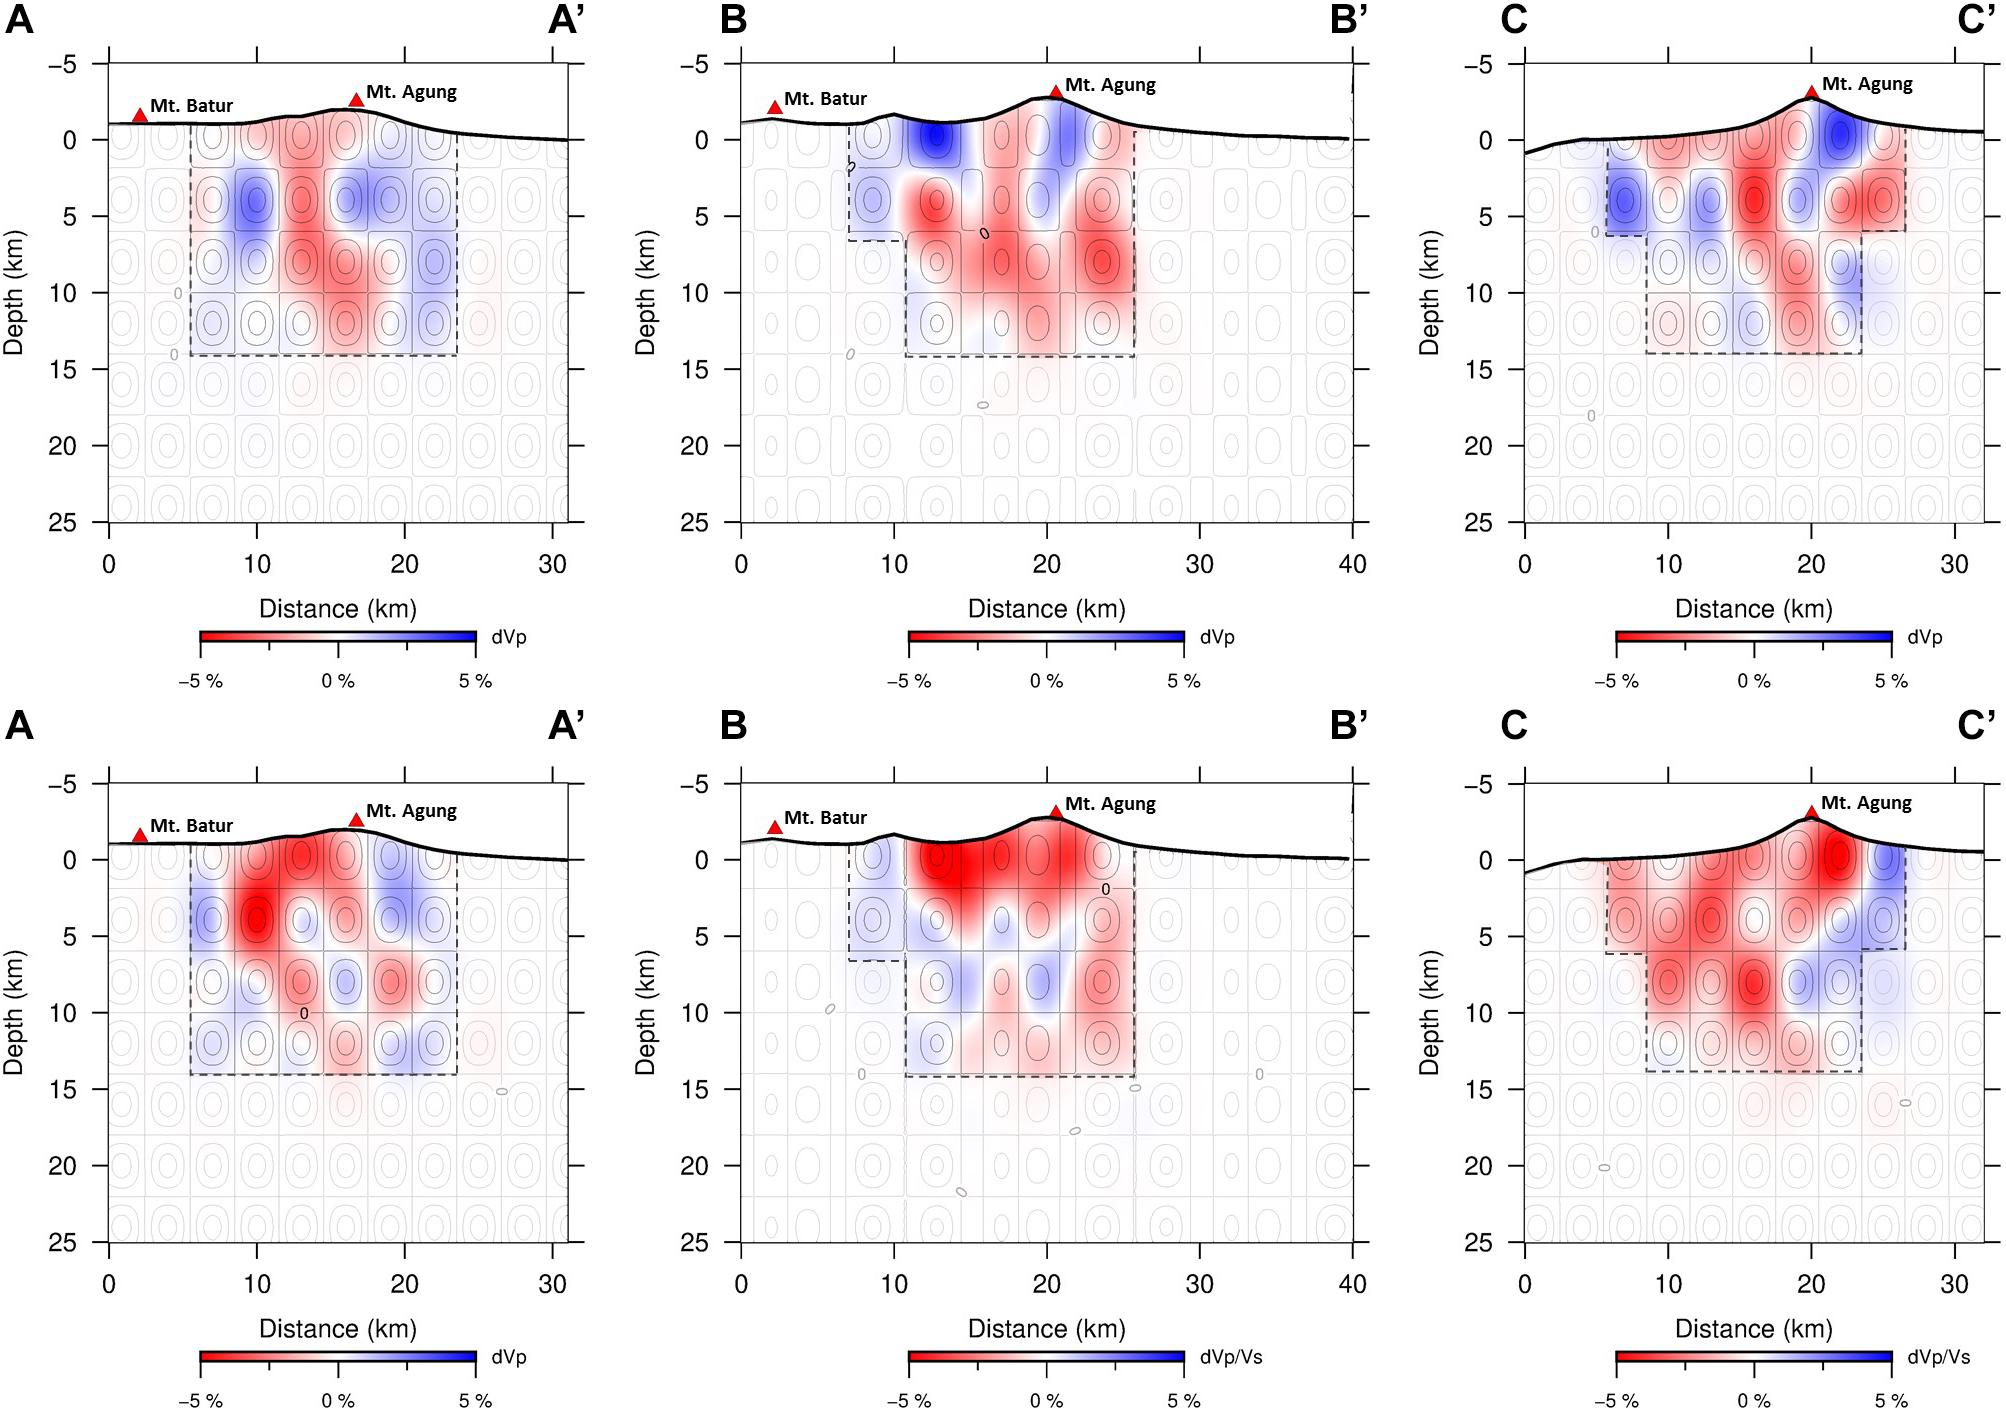
Figure 2. Vertical cross-sections of recovered Vp checkerboard resolution tests (CRT) model (top row), and recovered Vp/Vs CRT model (bottom row). The thin black line is the contour of the initial CRT model for Vp and Vp/Vs with interval of 4. Dashed black lines define the area which has a good resolution. Blue and red colors respectively represent high and low seismic velocity anomaly values, according to the scale at the bottom of each row. The vertical cross-section is taken at (A-A’) (first column), (B-B’) (second column), (C-C’) (third column), the spatial location of each cross-section, as seen in Figure 1C.
Our tomographic inversion procedure produced a 3-D velocity model and relocated the VT events, which led to a total weighted RMS reduction from 0.125 to 0.09057 s. The initial P- and S-P data variance associated with the initial model is 0.01588 and 0.01522 s2. The P- and S-P data variances for the final model are 0.00788 and 0.00855 s2, respectively. This inversion procedure allowed to simultaneously update the velocity model and hypocenter solution resulting in a reduction of the total RMS to 27.5%, with a 90% value of travel time between 1.65 and 4 s, so the average percentage of data misfit estimates from source to receiver ranges from 2.5 to 5.5%. We visualize the final 3-D Vp, Vs, and Vp/Vs ratio model along with the CRT results as a series of horizontal slice sections in Supplementary Figures 19–23. We also show three vertical cross-sections (A-A’, B-B’, C-C’) for CRT results, 3-D velocity models, and 3-D absolute velocity in Figures 2–4, respectively. In these figures, the Vp and Vs are plotted as percent perturbations relative to the 1-D initial velocity model, while Vp/Vs are plotted as absolute values.
There are three relocated VT event clusters visible in vertical cross-sections (Figures 3, 4). The first cluster is a swarm earthquake with a depth of 5–15 km below sea level between Mt. Agung and Mt. Batur, shown in vertical cross-sections of A-A’, and B-B’. The second cluster is located below the summit of Mt. Agung at depths of about 1–5 km below sea level; this cluster appears in three vertical cross-sections. The third cluster is located west of Mt. Agung at depths of about 1–5 km below sea level, trending southwest to northeast as identified in the A-A’ slice but less visible in the B-B’ cross-section. The fact that the third cluster is only clearly visible in cross-section A-A’ shows this only appears in a limited area. Based on these relocated hypocenters and 3-D velocity structure results, we identified five anomalous regions (marked as R1–R5 in Figures 3, 4).
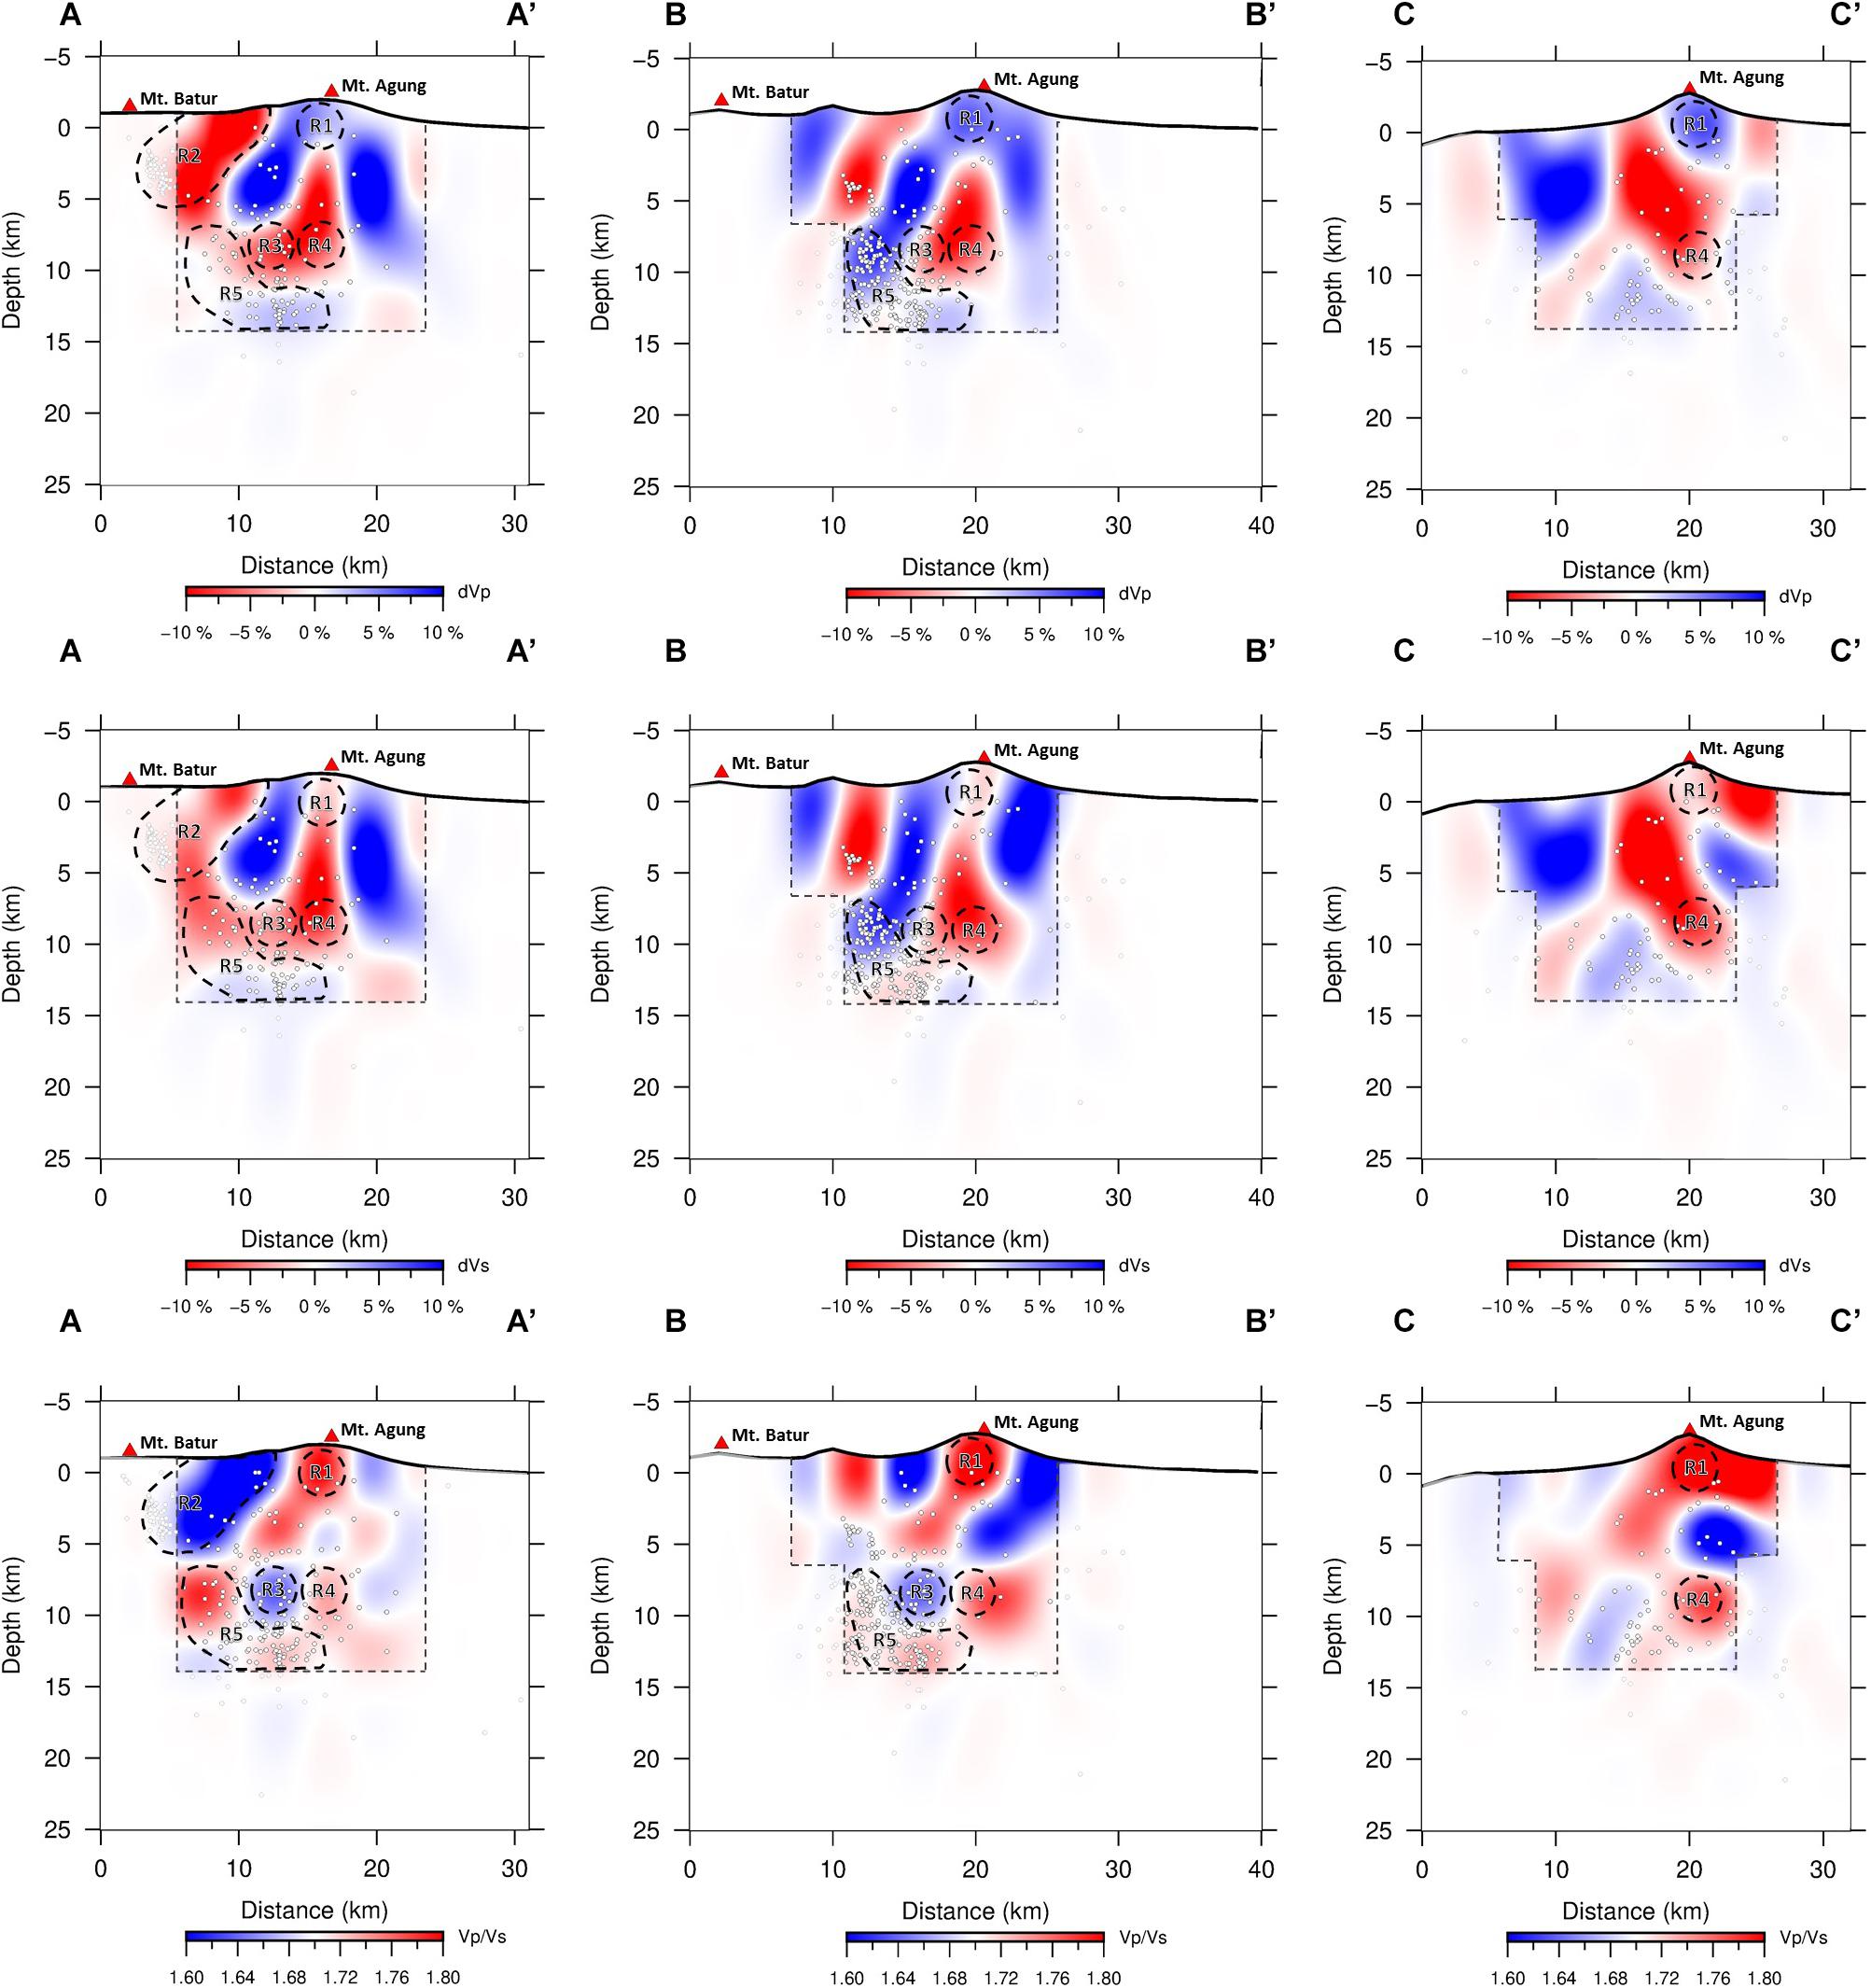
Figure 3. The vertical cross-sections of the Vp, Vs, and Vp/Vs models from top to bottom, respectively; for slice (A-A’) (first column), (B-B’) (second column), (C-C’) (third column), the spatial location of each cross-section can be seen in Figure 1C. Blue and red colors respectively represent high and low seismic velocity anomaly values and inverted for Vp/Vs, according to the scale at the bottom of each column. Vp and Vs are plotted as percent perturbations relative to the 1-D optimum initial velocity model, and Vp/Vs are plotted as absolute values. The white dot represents the hypocenter’s projection to the vertical cross-section; only events with depths less than 0.5 km from the centerline are plotted here. Dashed black lines define the area which has a good resolution based on resolution test results. Labeled regions (R1–R5) depicted by these figures are discussed in the text.
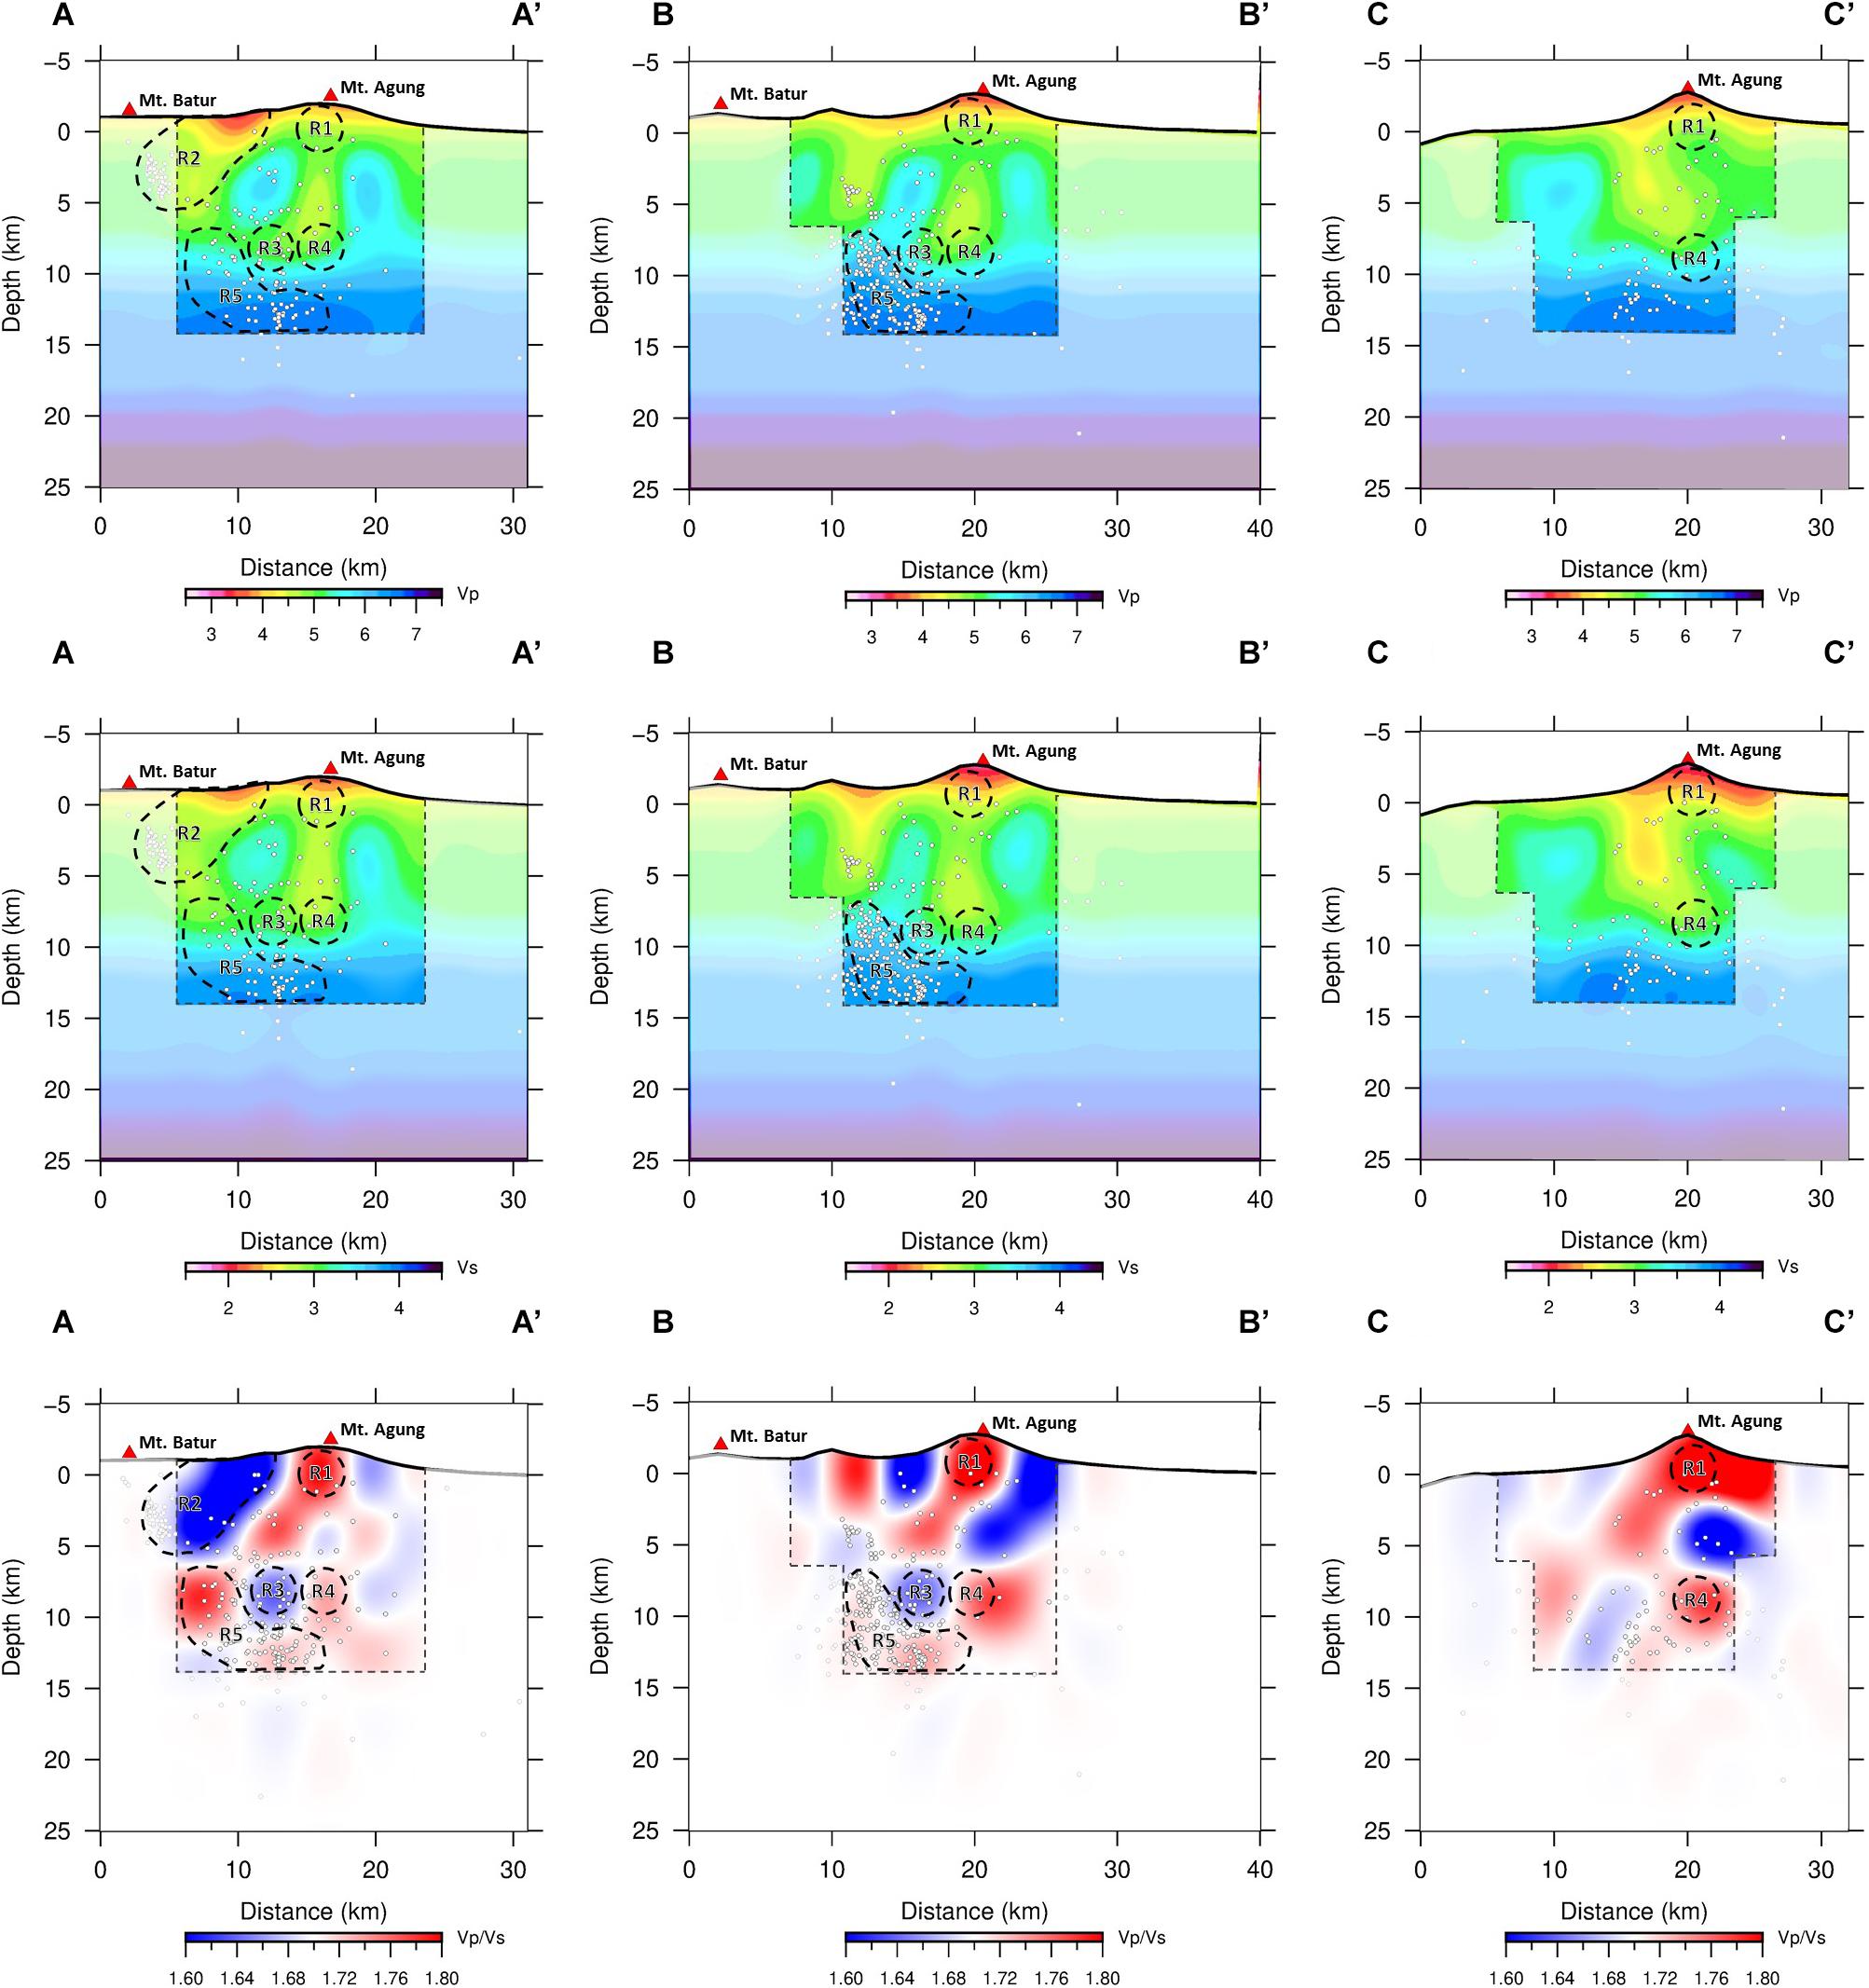
Figure 4. The vertical cross-sections of the Vp, Vs, and Vp/Vs models from top to bottom, respectively; for slice (A-A’) (first column), (B-B’) (second column), (C-C’) (third column), the spatial location of each cross-section can be seen in Figure 1C. Vp, Vs and Vp/Vs are plotted as absolute values. The white dot represents the hypocenter’s projection to the vertical cross-section; only events with depths less than 0.5 km from the centerline are plotted here. Dashed black lines define the area which has a good resolution based on resolution test results. Labeled regions (R1–R5) depicted by these figures are discussed in the text.
1. Region 1 (R1) is identified in cross-section A-A’, B-B’, and C-C’; this region is located right below the summit of Mt. Agung at depths between −2 and 2 km relative to sea level or ∼1 to 5 km relative to the summit of the volcano and has high Vp (+3.8%), low Vs (−1.9%), and high Vp/Vs (1.82) with low seismicity.
2. Region 2 (R2) is located around 10 km west of the Mt. Agung (section C-C’) with depths of 0–4 km below sea level; this region is characterized by low Vp (−16%) and Vs (−8.5%), and low Vp/Vs (1.55) with high seismicity.
3. Region 3 (R3) is located slightly northwest of Mt. Agung (section A-A’ and B-B’) at depths between 6 and 10 km below sea level; this region is characterized by low Vp (−8.1%), low Vs (−4.2%), and low Vp/Vs (1.63) with high seismicity.
4. Region 4 (R4) is located beneath the summit of Mt. Agung at a depth 6–10 km below sea level; it is identified in cross-sections A-A’, B-B’, and C-C’ as low Vp (−4.5%), low Vs (−8.1%), and moderate to high Vp/Vs (1.77) with low seismicity. High Vp/Vs indicates that Vs’ value is reduced more than the Vp anomaly value in this area.
5. Region 5 (R5) is co-located with a large cluster of VT events 6 km northwest of Mt. Agung at depths between 8 and 14 km below sea level (sections A-A’ and B-B’). This region is imaged as a sub-vertical structure characterized by a transition from low to high Vp and Vs, moderate to high Vp/Vs (1.76–1.79), and very high seismicity.
We qualitatively interpret our results using known relationships between seismic velocity and rock physics parameters. A quantitative analysis of volcanic tomography data (such as temperature determination or fractions of partial melt) has two sources of uncertainty; namely, the inaccuracy of the amplitude determination of the anomalous seismic velocity due to limited resolution and an imperfect understanding of the relationship between physical parameters and seismic velocity (Hammond and Humphreys, 2000). Besides, there are many physical rock parameters such as pressure, temperature, rock composition, porosity, fluid content, saturation, and crack density, which can affect the Vp, Vs values and Vp/Vs ratios (Nur and Simmons, 1969; Toksoz et al., 1976; Moos and Zoback, 1983; Hammond and Humphreys, 2000; Takei, 2002; Lees, 2007). Therefore, if we want to make a quantitative analysis of rock physic parameters using seismic tomograms, this problem will be highly underdetermined. We also acknowledge that our seismic observation network is less than ideal due to the lack of ray path coverage in the eastern part of Mt. Agung, limiting the resolution beneath the volcano. Because most of the VT events are located within the station’s coverage the data set is sufficient to produce a subsurface velocity structure that can be interpreted qualitatively.
Considering the limitations mentioned earlier, we interpret the five anomalous regions labeled in Figure 3 as follows. The first region (R1) has low seismicity, high Vp (+3.8%), low Vs (−1.9%), and is characterized by a high Vp/Vs value, reaching 1.82 at that location. We interpret this region as a shallow magma reservoir confined by consolidated, older volcanic intrusive rocks from previous large eruptions. Similar conditions are also observed at other stratovolcanoes, such as Mt. Etna (Laigle et al., 2000), Tungurahua volcano (Molina et al., 2005), and Sinabung volcano (Nugraha et al., 2019). The location of the high Vp/Vs anomaly (∼1.82) is at the sea level and the Vp/Vs value is significantly reduced to 1.7 at a depth of 4 km. Based on these significant changes in Vp/Vs value, we speculate that there may be shallow magma reservoirs at a depth of between −2 and 2 km relative to the sea level or about 1–5 km below the summit of the volcano.
There have been several studies regarding the presence of shallow magma reservoirs at Mt. Agung. Chaussard and Amelung (2012) conducted deformation analysis using ALOS InSAR time-series data from 2006 to 2009. Their results showed a clear uplift signal in a circular pattern inflating at rates of 3–8 cm/yr. Using inversion with the pressurized finite spheres approach in an elastic half-space, they estimated the existence of a pressure source at a depth of 4.4 km below the summit. But based on the results of a recent study for that data, Yip et al. (2019) show that the deformation signals previously reported at Agung are not the result of magmatic sources but correlate with atmospheric artifacts. Albino et al. (2019) after correcting the atmosphere and removing the deformation related to the dyke intrusion found a small concentric pattern of uplift remains at the summit of Agung. They interpret this inflation as pressurization of the hydrothermal system rather than magmatic source because the location of the source is very shallow and local. Despite the absence of evidence of sufficient surface deformation, the shallow magma chambers at Mt. Agung can still exist because it is probably not resolved by the data; this depends on the rate of accumulation and the depth of the source (Yip et al., 2019). The existence of shallow magma chambers is supported by the results of Geiger et al. (2018), based on mineral-melt equilibrium thermobarometry of lavas produced by the 1963 eruption, Their results show the existence of magma from an upper crustal chamber at 3–5 km depth.
Region 2 (R2) is located 10 km west of the Mt. Agung summit with high seismic activity and is just low Vp (−16%), Vs (−8.5%), and low Vp/Vs (1.55). This region is on the boundary of the area with resolution, so the interpretation of this seismic velocity anomaly should be performed carefully. However, considering this area is located in the lowlands west of Mt. Agung and that there is a continuation of low-velocity patterns at shallow depths between Mt. Agung and this area, we associate this low-velocity anomaly with the accumulation of volcanic deposits. Previous studies using ambient seismic noise tomography also describe the low Vs at depths up to 2 km at the topographic saddle between Mt. Agung and Mt. Batur (Zulfakriza et al., 2020). High seismicity in this area forms a separate cluster in a fairly limited area; it may be related to activated faults triggered by the over-pressurization of groundwater or gas exsolution from the magma intrusion beneath the volcano (Coulon et al., 2017; Syahbana et al., 2019).
Region 3 (R3) is located between 5 and 10 km below the summit characterized by low Vp (−8.1%), low Vs (−4.2%), and low Vp/Vs (1.63), and high seismic activity during the observation period. The anomaly may indicate that the rock mass has a high crack density that is dry or filled with supercritical fluid. The effect of supercritical fluid is similar to adding a small amount of gas: the reduction in Vp value will be much faster than that in the Vs, so that the Vp/Vs value will also decrease (Ponko and Sanders, 1994). Because of its location, which is close enough to a high-temperature heat source to cause evaporation of fluids and gas expansion, this can further reduce seismic velocity and become one of the factors that affect seismic activity in these fractured rocks. An increase in pore-pressure decreases the normal stress on the rock volume, which becomes more prone to slippage (Pearson, 1981). In their study, Bachmann et al. (2012) use data from the natural laboratory of the Basel-1 enhanced geothermal systems to explain the mechanism of pore-pressure changes that causes the presence of high b-value anomalies (increased probability of small earthquakes); similar mechanisms can also occur in volcanoes.
Region 4 (R4) is under the summit at a depth of 6–10 km; this area is next to Region 3. Similar to R3, this area has low Vp (−4.5%), low Vs (−8.1%), anomalies but moderate to high Vp/Vs (1.77) values, and low seismicity. Low Vp, low Vs, and high Vp/Vs anomalies are often found in active volcanic areas (Nakajima and Hasegawa, 2003; Lees, 2007; Ramdhan et al., 2019). These researchers agree that this anomaly provides evidence of melt or fluid accumulation. Therefore, we interpret that this region may be related to high crack density rock mass with high-temperature melts or increased fluid content saturation, compared to R3. Differentiation between high temperatures and fluid melts can be achieved with additional information, such as heat flow or earthquake occurrence (Sanders et al., 1995); therefore, we consider this area to be more affected by melts due to low seismicity.
Region 5 (R5) has low to high Vp and Vs, moderate to high Vp/Vs (1.77–1.79), which is similar to R1; however, this region has significantly high seismic activity. The results of earthquake relocation using a 3D velocity model, or using a 1D velocity model from the initial location, show that most of the recorded earthquakes are around the anomalous zone at a depth of 8–14 km. We interpret this as a dyke complex; the observed seismic swarm during the observation period was related to the dyke intrusion. Albino et al. (2019) performed a non-linear inversion using InSAR deformation data to obtain the position and the volume change of the dyke and then viewed the temporal relationship with seismic activity. They conclude that the optimum location of the dyke is between Mt. Agung and Mt. Batur at a depth of ∼10 km below sea level. They also find a positive correlation between the rate of change in dyke volume and seismic activity. The compatibility of this anomaly location and the spatio-temporal relationship between seismicity and the dyke volume can further confirm that the second conceptual model proposed by Syahbana et al. (2019) is the most appropriate for describing the subsurface structures of Mt. Agung.
The high temperature melts described as high Vp values in R1 and R5 seem quite puzzling. However, this type of anomalies is frequently found in seismic tomography results carried out at active stratovolcanoes around the world and often interpreted as new magma penetrated through older intrusives rock (Lees, 2007). In our study, most stations are located in the low-velocity zone (Zulfakriza et al., 2020); therefore, the 1D optimum velocity model produced by VELEST for shallow depths is low. As a result, the anomaly below the top of the mountain is described as high velocity. This argument is acceptable to explain R1 but not R5. Perhaps using a denser seismic network and a 3D initial velocity model, or a graded inversion scheme (inversing using a finer and finer grid) could produce appropriate anomalies in these regions. De Natale et al. (2004) analyzed the Somma-Vesuvius volcano using local earthquake data and dense artificial sources as well as a 3D initial velocity model. Their results show these anomalous features (high Vp, high Vp/Vs, and high seismicity) as found by previous studies, but with detailed petrological analysis they interpreted this as a region of quenched magma.
Based on our hypocenter relocation and 3D Vp, Vs, and Vp/Vs model, and the results of previous studies, we summarize our interpretation using a schematic model, as shown in Figure 5. First, magma rose from deep magma storage up to a depth of about 14 km from the mean sea level below R3. This first phase occurred between mid-May and late August 2017; sufficient seismicity has been detected to confirm this, but no significant surface deformation has been observed; this may be because the source is still very deep. The magma then migrated to Region 4 with a flow rate lower than the inflow from the deep magma reservoir, accounting for the accumulation of high melt temperature under R3. An increase in temperature or magma devolatilization in this area caused an increase in pressure distributed to the surrounding area, which explains the triggered VT events in R2 and R3. Then the dyke penetrated upward toward the west-northwest of Mt. Agung (R5) and its size continued to increase, although at a decreasing rate; this may have been due to an increased flow rate from Region 4 to Region 1 or reduced inflow from the deep magma reservoir. Then, between November 8 and November 20, 2017 (1 day before the first eruption), a significant reduction in intrusion dyke volume took place, which is interpreted as magma withdrawal into a shallow reservoir.
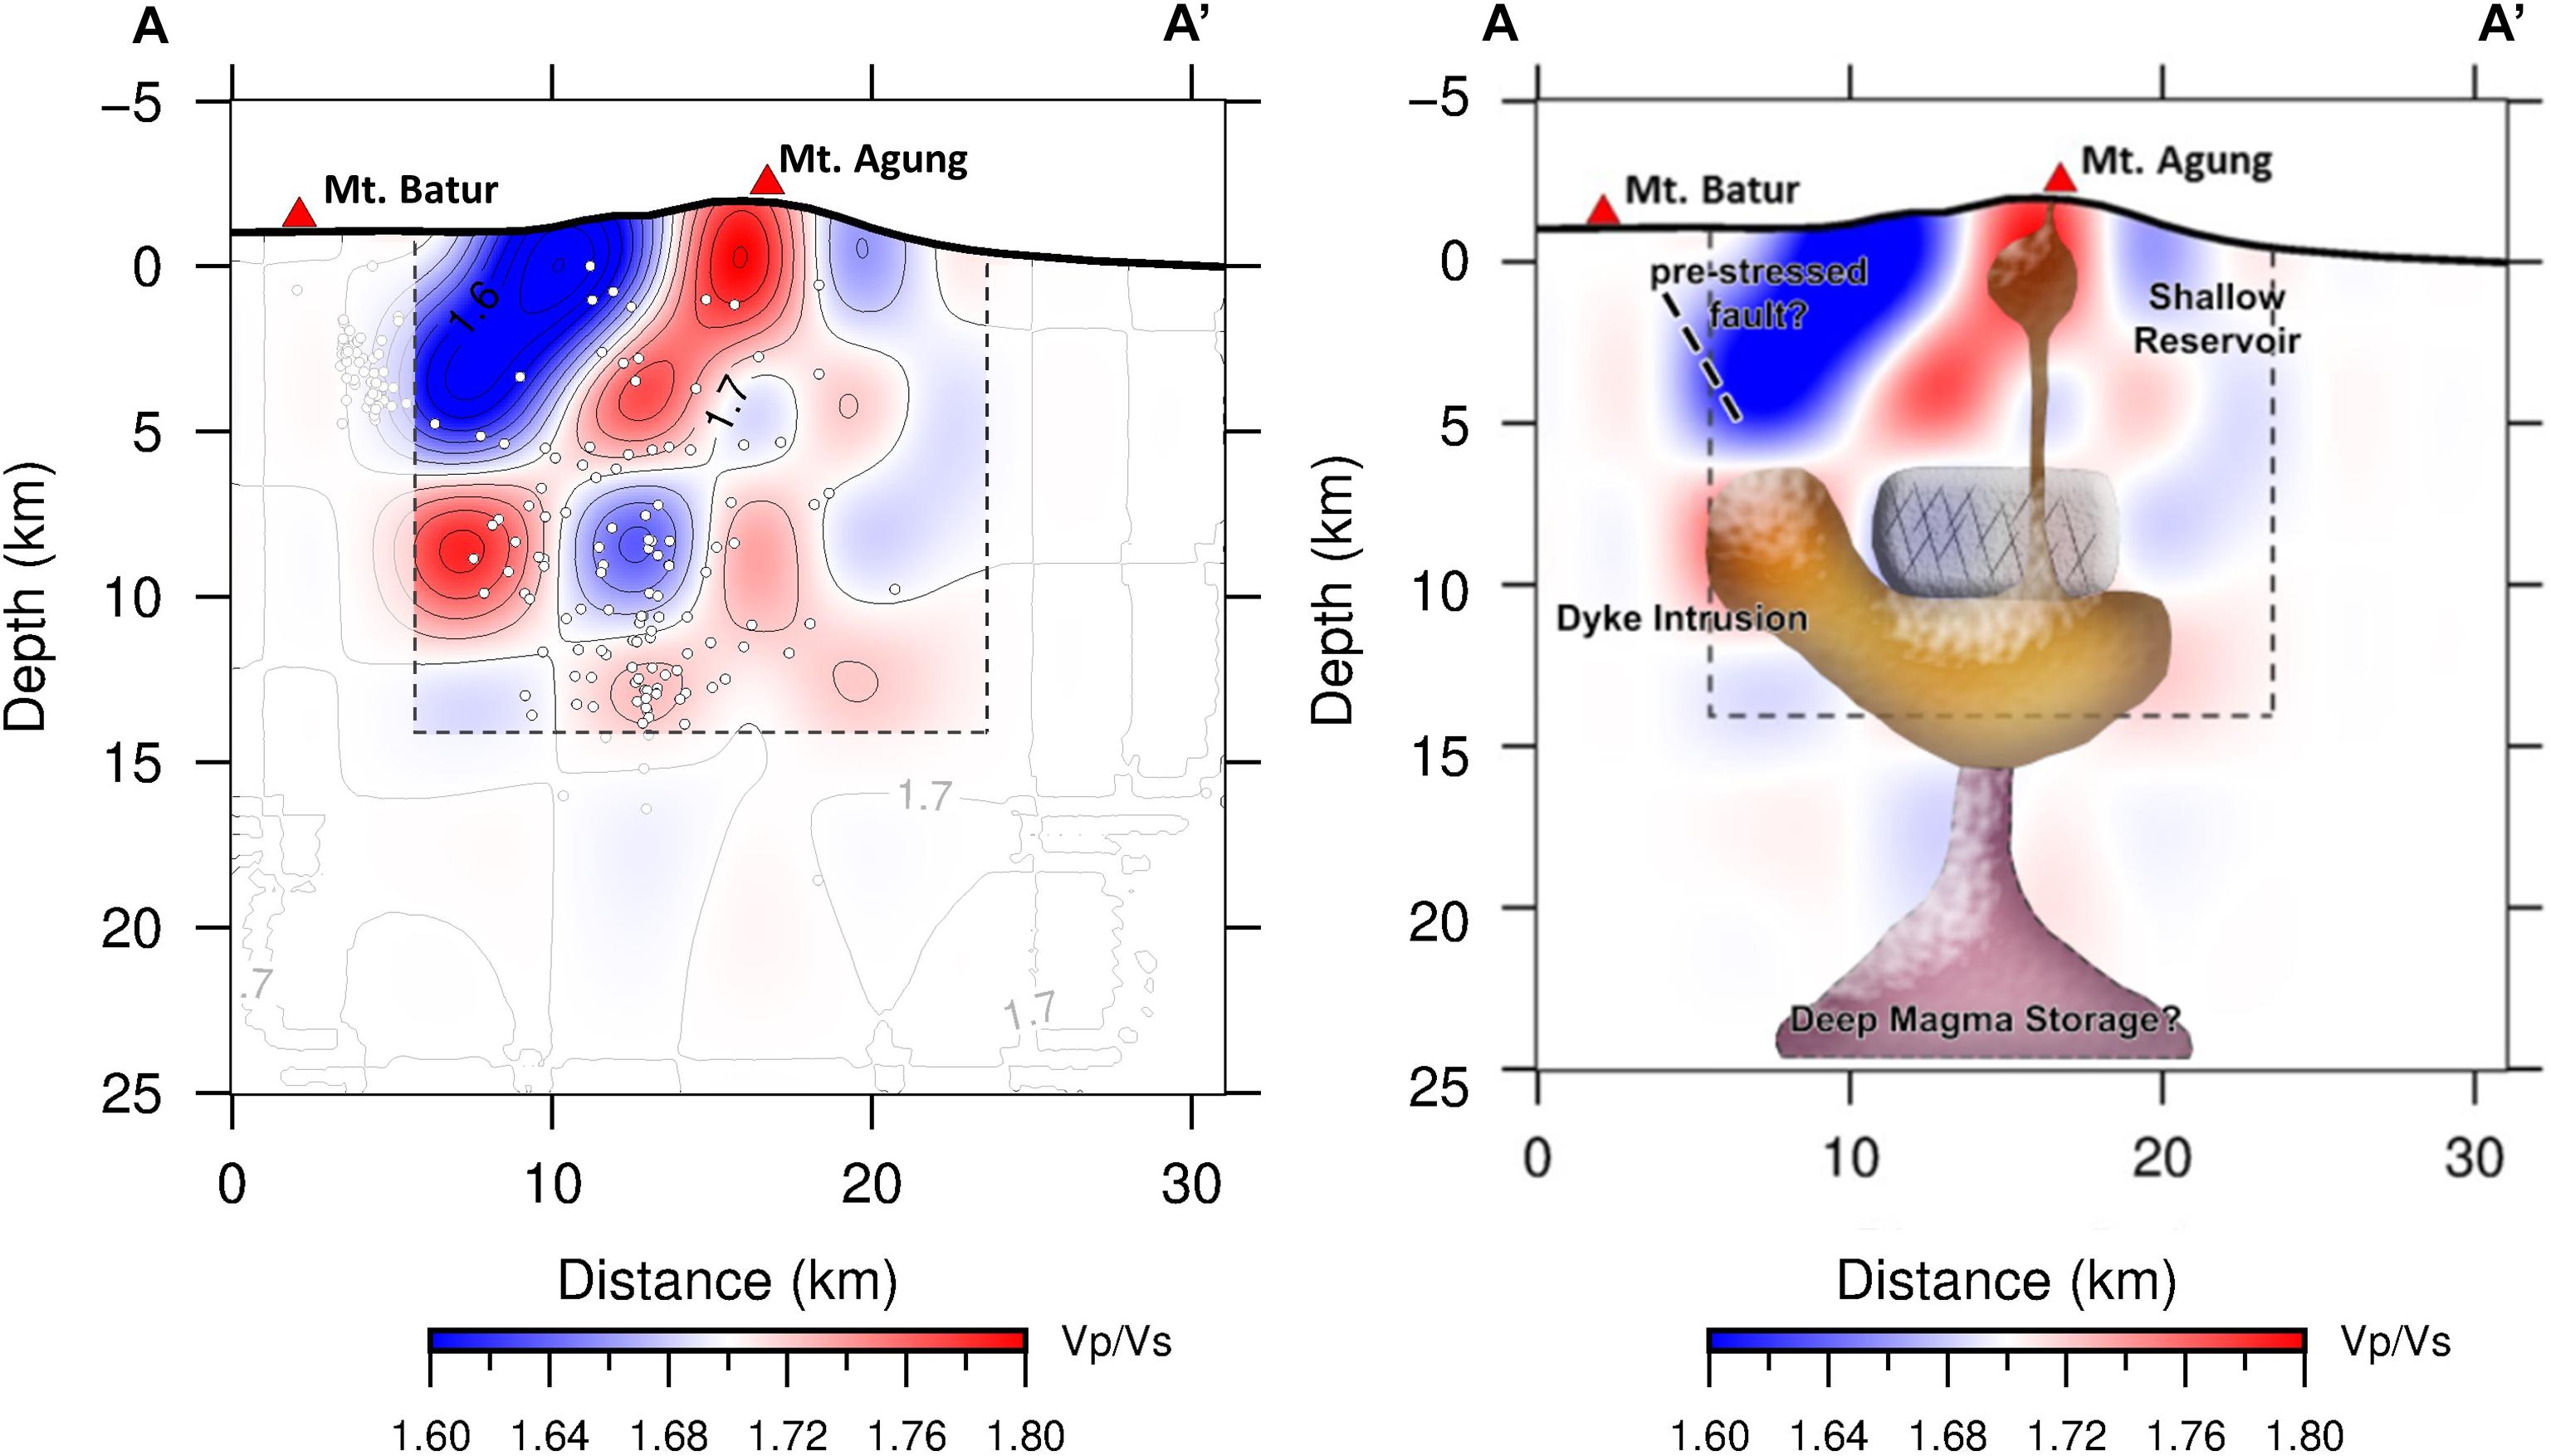
Figure 5. (A) Vp/Vs vertical cross-sections along section A-A’, This image description is the same as in Figure 3 with the addition of the Vp/Vs contour. (B) The schematic diagram for interpretation of the results along section A-A’ is derived from the Vp/Vs ratio structure. Dyke intrusion penetrated upward toward the west-northwest of Mt. Agung. Based on the resolution test results, we define well-resolved regions inside dashed black lines.
Based on our ray coverage, getting a more accurate picture of the subsurface beneath Mt. Agung would need to add seismic stations on the east side. If we aim at defining the shallow magma reservoir geometry we would have to rearrange or add observation stations, so that the spacing between stations reaches the same order as the minimum size of the target anomalies. Then the resolved depth of the local tomography would not be larger than the maximum depths of sources, so that the seismic station should fully capture a seismic crisis and give information about the deeper location of the magma.
We have successfully relocated the VT earthquakes and determined the first 3D seismic velocity structure (Vp, Vs, and Vp/Vs ratio) to describe subsurface conditions beneath Mt. Agung. We used a combination of permanent [2 vertical short-period seismometers (1-C)] and temporary [6 three components (3-C) broadband seismometers] observation stations installed by the CVGHM during the period from October 18 to December 31, 2017. Based on resolution tests, the area between Mt. Agung and Mt. Batur has a reasonably satisfactory resolution down to a depth of 15 km.
The results of our VT earthquakes tomography reveal five anomalous regions, which we interpret as follows: (i) a shallow magma reservoir located just below the summit of Mt. Agung at depths between ∼1 and 5 km, which is characterized by very high Vp/Vs ratio and low seismicity; (ii) a fault zone characterized by shallow seismicity with depths up to ∼5 km below sea level, which may be triggered by over-pressurization of groundwater due to magma intrusion; (iii) high crack density dry rock mass or filled with a supercritical fluid, as indicated as low Vp, Vs, and Vp/Vs with high seismicity; (iv) the same rock mass as Region 3 but dominated by high-temperature melt. This area is probably a conduit associated with a shallow magma reservoir as characterized by moderate to high Vp/Vs and low seismicity; (v) a sub-vertical dyke complex at depths of 8–14 km below sea level, which is described as moderate to high Vp/Vs with significantly high seismicity around this anomalous body.
Our study reveals new insight into the magma plumbing system’s subsurface structure beneath Mt. Agung. However, we are not able to delineate the deeper magma storage due to the limited resolution. We have succeeded in obtaining the shallow magma reservoir’s location, and the estimated location and dimensions show good agreement with previous studies (Chaussard and Amelung, 2012; Geiger et al., 2018). We confirm the presence of a dyke complex intrusion with an accompanying seismic swarm prior to the 2017 eruption of Mt. Agung (Albino et al., 2019; Syahbana et al., 2019). The temporal relationship between seismicity and changes in dyke volume (Albino et al., 2019) and the spatial relationship between the hypocenter solution and the high Vp/Vs anomaly increases the level of confidence for our interpretation of the dyke complex intrusion. Further research is still needed, employing different geophysical methods such as gravity, magnetic, electromagnetic, to provide better constraints in the conceptual model, especially at greater depths, so that we can have a better comprehension of the subsurface conditions of Mt. Agung, which may contribute to better mitigation of volcanic disasters in the future.
The original contributions presented in the study are included in the article/Supplementary Material, further inquiries can be directed to the corresponding author/s.
ZZ, AN, SW, DSa, IP, and MM conceived the survey and seismic study on ABVC. AA, AN, AS, HA, DSy, and FM contributed to the writing of the manuscript. All authors contributed to the preparation of the manuscript, read and approved the final manuscript.
This study was supported by the ITB Research 2019–2020 Program and the Master’s Thesis Research Program BP-PTNBH Kemristek/BRIN 2020, World Class Research Kemristek/BRIN 2021 awarded to AN. The study was also partially supported by the USAID’s PEER (Partnership for Enhance Engagement in Research) program with agreement number AID-OAA-A-11-00012, and the Center for Earthquake Science and Technology, Research Center for Disaster Mitigation, Institut Teknologi Bandung (CEST, PPMB, ITB).
The authors declare that the research was conducted in the absence of any commercial or financial relationships that could be construed as a potential conflict of interest.
This study was a collaboration between Institut Teknologi Bandung (ITB), the Geological Agency of Indonesia c.q. the Center for Volcanology and Geological Hazard Mitigation (CVGHM), and the Volcano Disaster Assistance Program (VDAP) of the United States Geological Survey (USGS). Generic Mapping Tools (Wessel and Smith, 1998) were used to produce the figures.
The Supplementary Material for this article can be found online at: https://www.frontiersin.org/articles/10.3389/feart.2021.619587/full#supplementary-material
Albino, F., Biggs, J., and Syahbana, D. K. (2019). Dyke intrusion between neighbouring arc volcanoes responsible for 2017 pre-eruptive seismic swarm at Agung. Nat. Commun. 10:748. doi: 10.1038/s41467-019-08564-9
Bachmann, C. E., Wiemer, S., Goertz-Allmann, B. P., and Woessner, J. (2012). Influence of pore-pressure on the event-size distribution of induced earthquakes. Geophys. Res. Lett. 39:L09302. doi: 10.1029/2012GL051480
Chaussard, E., and Amelung, F. (2012). Precursory inflation of shallow magma reservoirs at west Sunda volcanoes detected by InSAR. Geophys. Res. Lett. 39:21311. doi: 10.1029/2012GL053817
Coulon, C. A., Hsieh, P. A., White, R., Lowenstern, J. B., and Ingebritsen, S. E. (2017). Causes of distal volcano-tectonic seismicity inferred from hydrothermal modeling. J. Volcanol. Geotherm. Res. 345, 98–108. doi: 10.1016/j.jvolgeores.2017.07.011
De Natale, G., Troise, C., Trigila, R., Dolfi, D., and Chiarabba, C. (2004). Seismicity and 3-D substructure at Somma-Vesuvius Volcano; evidence for magma quenching. Earth Planet Sci. Lett. 221, 181–196. doi: 10.1016/S0012-821X(04)00093-7
Eberhart-Phillips, D. (1986). Three-dimensional velocity structure in northern California coast ranges from inversion of local earthquake arrival times. Bull. Seismol. Soc. Am. 76, 1025–1052.
Evans, J. R., Eberhart-Phillips, D., and Thurber, C. H. (1994). User’s manual for SIMULPS12 for imaging vp and vp/vs: a derivative of the ‘Thurber’ tomographic inversion SIMUL3 for local earthquakes and explosions. U.S. Geol. Surv. Open File Rep. 94–431, 101. doi: 10.3133/ofr94431
Fontijn, K., Costa, F., Sutawidjaja, I., Newhall, C. G., and Herrin, J. S. (2015). A 5000-year record of multiple highly explosive mafic eruptions from Mt. Agung (Bali, Indonesia): implications for eruption frequency and volcanic hazards. Bull. Volcanol. 77:59. doi: 10.1007/s00445-015-0943-x
Geiger, H., Troll, V. R., Jolis, E. M., Deegan, F. M., Harris, C., Hilton, D. R., et al. (2018). Multi-level magma plumbing at Agung and Batur volcanoes increases risk of hazardous eruptions. Sci. Rep. 8:10547. doi: 10.1038/s41598-018-28125-2
Hammond, W., and Humphreys, E. (2000). Upper mantle seismic wave velocity: effects of realistic partial melt geometries. J. Geophys. Res. Solid Earth 105, 10975–10986. doi: 10.1029/2000JB900041
Kissling, E., Ellsworth, W. L., Phillips, D. E., and Kradolfer, U. (1994). Initial reference models in local earthquake tomography. J. Geophys. Res. 99, 19635–19646. doi: 10.1029/93JB03138
Koulakov, I., Jakovlev, A., and Luehr, B. G. (2009). Anisotropic structure beneath central Java from local earthquake tomography. Geochem. Geophys. Geosyst. 10:Q02011. doi: 10.1029/2008GC002109
Laigle, M., Hirn, A., Sapin, A., and Le’ pine, J. C. (2000). Mount Etna dense array local earthquake P and S tomography and implications for volcanic plumbing. J. Geophys. Res. Solid Earth 105, 21633–21646. doi: 10.1029/2000JB900190
Lees, J. M. (2007). Seismic tomography of magmatic systems. J. Volcanol. Geotherm. Res. 167, 37–56. doi: 10.1016/j.jvolgeores.2007.06.008
Lévěque, J.-J., Rivera, L., and Wittlinger, G. (1993). On the use of the checker-board test to assess the resolution of tomographic inversions. Geophys. J. Int. 115, 313–318. doi: 10.1111/j.1365-246X.1993.tb05605.x
Lomax, A., and Michelini, A. (2009). Mwpd: a duration-amplitude procedure for rapid determination of earthquake magnitude and tsunamigenic potential from P waveforms. Geophys. J. Int. 176, 200–214. doi: 10.1111/j.1365-246X.2008.03974
Lomax, A., Satriano, C., and Vassallo, M. (2012). Automatic picker developments and optimization: filterpicker – a robust, broadband picker for real-time seismic monitoring and earthquake early warning. Seismol. Res. Lett. 83, 531–540. doi: 10.1785/gssrl.83.3.531
Lomax, A., Virieux, J., Volant, P., and Berge-Thierry, C. (2000). “Probabilistic earthquake location in 3D and layered models BT – Advances in seismic event location,” in Advances in Seismic Event Location. Modern Approaches in Geophysics, eds C. H. Thurber and N. Rabinowitz (Dordrecht: Springer), 101–134. doi: 10.1007/978-94-015-9536-0_5
Menke, W. (1989). Geophysical Data Analysis: Discrete Inverse Theory, 1st ed. San Diego, CA: Academic Press.
Molina, I., Kumagai, H., Le Pennec, J. L., and Hall, M. (2005). Threedimensional P-wave velocity structure of Tungurahua volcano, ecuador. J. Volcanol. Geotherm. Res. 147, 144–156. doi: 10.1016/j.jvolgeores.2005.03.011
Moos, D., and Zoback, M. D. (1983). In situ studies of velocity in fractured crystalline rocks. J. Geophys. Res. Solid Earth 88, 2345–2358. doi: 10.1029/JB088iB03p02345
Nakajima, J., and Hasegawa, A. (2003). Tomographic imaging of seismic velocity structure in and around the Onikobe volcanic area, northeastern Japan: implications for fluid distribution. J. Volcanol. Geotherm. Res. 127, 1–18. doi: 10.1016/S0377-0273(03)00155-0
Nugraha, A. D., Indrastuti, N., Kusnandar, R., Gunawan, H., Triastuty, H., and McCausland, W. (2019). Joint 3-D tomographic imaging of Vp, Vs and Vp/Vs and hypocenter relocation at Sinabung volcano, Indonesia from November to December 2013. J. Volcanol. Geotherm. Res. 382, 210–223. doi: 10.1016/j.jvolgeores.2017.09.018
Nur, A., and Simmons, G. (1969). The effect of saturation on velocity in low porosity rocks. Earth Planet Sci. Lett. 7, 183–193. doi: 10.1016/0012-821X(69)90035-1
Pearson, C. (1981). The relationship between microseismicity and high porepressures during hydraulic stimulation experiments in low permeability granitic rocks. J. Geophys. Res. Solid Earth 86, 7855–7864. doi: 10.1029/JB086iB09p07855
Ponko, S. C., and Sanders, C. O. (1994). Inversion for P and S wave differential attenuation structure, long valley Caldera, California. J. Geophys. Res. Solid Earth 99, 2619–2635. doi: 10.1029/93JB03405
PVMBG, (2014). Gunung Agung, Kementrian Energi dan Sumber Daya Mineal, Badan Geologi. Available online at: https://vsi.esdm.go.id/index.php/gunungapi/data-dasar-gunungapi/468-g-agung?start=2 (accessed December 13, 2020).
Ramdhan, M., Widiyantoro, S., Nugraha, A. D., Métaxian, J. P., Rawlinson, N., Saepuloh, A., et al. (2019). Detailed seismic imaging of Merapi volcano, Indonesia, from local earthquake travel-time tomography. J. Asian Earth Sci. 177, 134–145. doi: 10.1016/j.jseaes.2019.03.018
Rampino, M. R., and Self, S. (1982). Historic eruptions of Tambora (1815), Krakatau (1883), and Agung (1963), their stratospheric aerosols, and climatic impact. Quat. Res. 18, 127–143. doi: 10.1016/0033-5894(82)90065-5
Rampino, M. R., and Self, S. (1984). Sulphur-rich volcanic eruptions and stratospheric aerosols. Nature 310, 677–679. doi: 10.1038/310677a0
Rawlinson, N., and Spakman, W. (2016). On the use of sensitivity tests in seismic tomography. Geophys. J. Int. 205, 1221–1243. doi: 10.1093/gji/ggw084
Sahara, D. P., Rahsetyo, P. P., Nugraha, A. D., Syahbana, D. K., Widiyantoro, S., Zulfakriza, Z., et al. (2021). Use of local seismic network in analysis of volcano-tectonic (VT) events preceding the 2017 agung volcano eruption (Bali, Indonesia). Front. Earth Sci. (Accepted).
Sanders, C., Ponko, S., Nixon, L., and Schwartz, E. (1995). Seismological evidence for magmatic and hydrothermal structure in Long Valley caldera from local earthquake attenuation and velocity tomography. J. Geophys. Res. Solid Earth 100, 8311–8326. doi: 10.1029/95JB00152
Sasmi, A. T., Nugraha, A. D., Muzil, M., Widiyantoro, S., Zulfakriza, Z., Wei, S., et al. (2020). Hypocenter and magnitude analysis of aftershocks of the 2018 Lombok earthquakes, Indonesia, UsinglLocal seismographic networks. Seismol. Res. Lett. 91, 2152–2162. doi: 10.1785/0220190348
Sutawidjaja, I. (2009). Ignimbrite analyses of Batur Caldera, Bali, based on 14C dating. J. Geol. Indones. 4, 189–202.
Syahbana, D. K., Kasbani, K., Suantika, G., Prambada, O., Andreas, A. S., Saing, S. L., et al. (2019). The 2017–19 activity at Mount Agung in Bali (Indonesia): intense unrest, monitoring, crisis response, evacuation, and eruption. Sci. Rep. 9:8848. doi: 10.1038/s41598-019-45295-9
Takei, Y. (2002). Effect of pore geometry on Vp/Vs: from equilibrium geometry to crack. J. Geophys. Res. Solid Earth 107:2043. doi: 10.1029/2001JB000522
Toksoz, M. N., Cheng, C. H., and Aytekin, T. (1976). Velocities of seismic waves in porous rock. Geophysics. 41, 621–645. doi: 10.1190/1.1440639
Toomey, D. R., and Foulger, G. R. (1989). Tomographic inversion of local earthquake data from the Hengill-Grensdalur central volcano complex, Iceland. J. Geophys. Res. Solid Earth 94, 17497–17510. doi: 10.1029/JB094iB12p17497
Um, J., and Thurber, C. H. (1987). A fast forward algorithm for two-point seismic ray tracing. Bull. Seismol. Soc. Am. 77, 972–986.
Wessel, P., and Smith, W. H. F. (1998). New, improved version of generic mapping tools released. Eos Trans. Am. Geophys. Union 79:579. doi: 10.1029/98EO00426
Widiyantoro, S., Ramdhan, M., Métaxian, J. P., Cummins, P. R., Martel, C., Erdmann, S., et al. (2018). Seismic imaging and petrology explain highly explosive eruptions of Merapi Volcano, Indonesia. Sci. Rep. 8:13656. doi: 10.1038/s41598-018-31293-w
Yip, S. T. H., Biggs, J., and Albino, F. (2019). Reevaluating volcanic deformation using atmospheric corrections: implications for the magmatic system of Agung volcano, Indonesia. Geophys. Res. Lett. 46, 13704–13711. doi: 10.1029/2019GL085233
Zen, M. T., and Hadikusumo, D. (1964). Preliminary report on the 1963 eruption of Mt. Agung in Bali (Indonesia). Bull. Volcanol. 27, 269–300. doi: 10.1007/BF02597526
Keywords: seismic tomography, Mt. Agung, magma plumbing system, 3D seismic structure, volcano seismology
Citation: Ardianto A, Nugraha AD, Afif H, Syahbana DK, Sahara DP, Zulfakriza Z, Widiyantoro S, Priyono A, Rosalia S, Saepuloh A, Kasbani K, Muttaqy F, Rahsetyo PP, Priambodo IC and Martanto M (2021) Imaging the Subsurface Structure of Mount Agung in Bali (Indonesia) Using Volcano-Tectonic (VT) Earthquake Tomography. Front. Earth Sci. 9:619587. doi: 10.3389/feart.2021.619587
Received: 20 October 2020; Accepted: 06 April 2021;
Published: 04 May 2021.
Edited by:
Derek Keir, University of Southampton, United KingdomReviewed by:
Michele Paulatto, Imperial College London, United KingdomCopyright © 2021 Ardianto, Nugraha, Afif, Syahbana, Sahara, Zulfakriza, Widiyantoro, Priyono, Rosalia, Saepuloh, Kasbani, Muttaqy, Rahsetyo, Priambodo and Martanto. This is an open-access article distributed under the terms of the Creative Commons Attribution License (CC BY). The use, distribution or reproduction in other forums is permitted, provided the original author(s) and the copyright owner(s) are credited and that the original publication in this journal is cited, in accordance with accepted academic practice. No use, distribution or reproduction is permitted which does not comply with these terms.
*Correspondence: Andri Dian Nugraha, bnVncmFoYUBnZi5pdGIuYWMuaWQ=
Disclaimer: All claims expressed in this article are solely those of the authors and do not necessarily represent those of their affiliated organizations, or those of the publisher, the editors and the reviewers. Any product that may be evaluated in this article or claim that may be made by its manufacturer is not guaranteed or endorsed by the publisher.
Research integrity at Frontiers
Learn more about the work of our research integrity team to safeguard the quality of each article we publish.