
95% of researchers rate our articles as excellent or good
Learn more about the work of our research integrity team to safeguard the quality of each article we publish.
Find out more
ORIGINAL RESEARCH article
Front. Earth Sci. , 23 June 2021
Sec. Quaternary Science, Geomorphology and Paleoenvironment
Volume 9 - 2021 | https://doi.org/10.3389/feart.2021.606588
This article is part of the Research Topic Integrating Paleoclimate, Stratigraphy, Sedimentology & Paleontology in Human Evolution and Dispersal Studies - from Early Hominins to the Holocene View all 22 articles
 Gabriele E. Arnold1,2*
 Verena Foerster3
 Martin H. Trauth2
 Henry Lamb4,5
 Frank Schaebitz3
 Asfawossen Asrat6,7
 Claudia Szczech1,2Christina Günter2
Establishing robust environmental proxies at newly investigated terrestrial sedimentary archives is a challenge, because straightforward climate reconstructions can be hampered by the complex relationship between climate parameters and sediment composition, proxy preservation or (in)sufficient sample material. We present a minimally invasive hyperspectral bidirectional reflectance analysis on discrete samples in the wavelength range from 0.25 to 17 µm on 35 lacustrine sediment core samples from the Chew Bahir Basin, southern Ethiopia for climate proxy studies. We identified and used absorption bands at 2.2 μm (Al–OH), at 2.3 μm (Mg–OH), at 1.16 μm (analcime), and at 3.98 μm (calcite) for quantitative spectral analysis. The band depth ratios at 2.3/2.2 μm in the spectra correlate with variations in the potassium content of the sediment samples, which also reflect periods of increased Al-to-Mg substitution in clay minerals during drier climatic episodes. During these episodes of drier conditions, absorption bands diagnostic of the presence of analcime and calcite support this interpretation, with analcime indicating the driest conditions. These results could be compared to qualitative analysis of other characteristic spectral properties in the spectral range between 0.25 and 17 µm. The results of the hyperspectral measurements complement previous sedimentological and geochemical analyses, allowing us in particular to resolve more finely the processes of weathering in the catchment and low-temperature authigenic processes in the sediment. This enables us to better understand environmental changes in the habitat of early humans.
Reliable and precise climate indicators (proxies) are essential for reconstructing paleoenvironmental conditions from sedimentary archives. The development of robust climate proxies is a challenge due to the complex and often highly site-specific relationship between various potential indicators (such as, geochemical or physical composition, micro- or macro fossils that are typically found in terrestrial climate archives) and actual climate conditions of the past (Mann, 2002; Huntley, 2012; Chevalier and Chase, 2016; Wilke et al., 2016; Foerster et al., 2018). Paleoenvironmental studies are often hampered by constraints on sufficient sample material, discontinuous preservation of proxy carriers through the record, or missing contextualization of data sets. Efforts to link geochemical high-resolution X-ray fluorescence data (XRF) with mineralogical X-ray diffraction data (XRD) from lacustrine sediments of the Chew Bahir Basin, south Ethiopia, have shown that the establishment of new climate proxies necessitates a multi-dimensional understanding of processes in the catchment that control the ultimate composition of the sediments, including the relative impact of weathering and erosion, transport and deposition, and post-depositional processes (Foerster et al., 2018; Viehberg et al., 2018).
A profound understanding of the nature and amplitude of past hydroclimatic variations has become increasingly important to the growing debate on the role of climate in the evolution, cultural development and dispersal of Homo sapiens (e.g., Roberts and Stewart, 2018; Mounier and Lahr, 2019; Stewart et al., 2019). As a contribution toward an enhanced understanding of human-climate interactions, the Hominin Sites and Paleolakes Drilling Project (HSPDP) has cored five fluvio-lacustrine archives covering the last ∼3.5 Ma of climate change in eastern Africa. All five sites in Ethiopia and Kenya are adjacent to key paleoanthropological research areas encompassing diverse milestones in human evolution, and times of dispersal and technological and cultural innovation (Cohen et al., 2016; Campisano et al., 2017; Owen et al., 2018, 2019; Potts et al., 2018). In late 2014, the Chew Bahir Drilling Project (CBDP), addressing one of the key HSPDP sites, recovered a ∼293 m-long composite sediment core from Chew Bahir (CHB), a tectonically-bound basin (4°45′40.5″N, 36°46′1.0″E) in the southern Ethiopian Rift (Figure 1). The ∼620 ka Chew Bahir record covers recent phases of hominin evolution, a time interval marked by intense climatic changes and including milestones, such as, the transition from the Acheulean to the Middle Stone Age and the emergence of archaic and modern H. sapiens in Africa, as well as the dispersal of this species (e.g., Stringer, 2016; Stringer and Galway-Witham, 2017; Roberts et al., submitted).
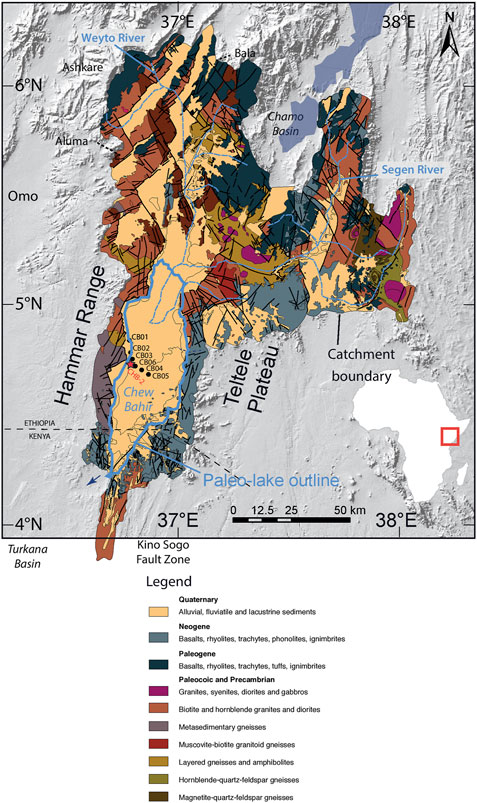
FIGURE 1. Geologic map of the Chew Bahir Basin based on Omo River Project Map (Davidson, 1983), Geology of the Sabarei Area (Key, 1987), Geology of the Yabello Area (Hailemeskel and Fekadu, 2004), and Geology of the Agere Maryam Area (Hassen et al., 1997). The red star marks the location of CHB14-2 coring site.
As part of the Chew Bahir Drilling Project, X-ray diffractometric investigations were carried out on a set of over 1,000 samples (Foerster et al., 2018). The results provided information through time on the sediment origin, potential transport mechanisms, post-depositional conditions and inferred precipitation distributions. Micro-X-ray fluorescence analyses (µXRF) showed that potassium content of the CHB sediment appears to be a reliable proxy for aridity (Foerster et al., 2012; Trauth et al., 2015, 2018, 2019; Viehberg et al., 2018). K-fixation in the sediment smectites was found to be enhanced by changes in octahedral occupancy of clay minerals. These results suggest that the most likely process linking climate with potassium concentrations is authigenic illitization of smectites during periods of higher alkalinity and salinity in the closed-basin lake of CHB, due to a drier climate (Foerster et al., 2018; Fischer et al., 2020).
Hydrochemical processes of authigenic clay alteration can readily be tracked by means of visible and infrared spectral investigation methods. This paper reports the results of a study that applied advanced hyperspectral analysis to support the non-destructive study of CHB sediment core samples. We examine the relationship between the derived mineralogical and geochemical properties of selected samples to test their linkage to the hydroclimate history of the CHB region. Visual and infrared reflectance spectroscopy (VIR) is a well-known and remote sensing evaluated method for composition analysis (e.g., Clark et al., 1999). In sedimentology, methods for visual and near infrared (VNIR) spectral characterization in the range of 0.35–2.5 µm have been applied, e.g., by Grosjean et al. (2014), Butz et al. (2015, 2017) and Körting et al. (2015).
In contrast to these earlier analyses, a very wide spectral range of 0.2–17 µm was used for the CHB samples investigated. The wide wavelength coverage allows use of both the absorption bands of electronic solid state processes in the ultraviolet/visual (UV, VIS) spectral range, and the fundamental lattice vibration absorption bands in the mid infrared (MIR), as well as their overtone and combination tone vibration bands in the short wavelength infrared (SWIR). Synergy in the use of the overall complex of compositional and textural information resulting from these spectral surveys will ensure improved and unambiguous mineralogical analysis. Aspects of this method have already been partly tested in planetary remote sensing (e.g., Christensen et al., 2003; Bibring et al., 2006; Bishop et al., 2008) and are being extended here for the analysis of CHB samples. Our goal is to characterize wet and dry climate phases based on the spectral properties of the CHB samples and to compare them with the results of previous XRF and XRD analyses, and thus to contribute to improvements in climate proxy interpretation.
Chew Bahir is a deep tectonically-bound basin (4.1–6.3°N; 36.5–38.1°E) in the southern Ethiopian Rift. It holds an extensive saline playa mudflat, but was repeatedly filled with paleolake Chew Bahir during pronounced pluvial phases (Foerster et al., 2012; Viehberg et al., 2018; Fischer et al., 2020) (Figure 1). The north-south trending rift basin is separated from the Turkana Basin to the west by the Hammar Range and bound to the east by the eastern Rift escarpment, the Teltele Plateau, part of the Teltele-Konso Range. The Hammar Range is underlain by Neo-Proterozoic basement rocks dominantly composed of granitic and mafic gneisses with minor occurrences of meta-sedimentary rocks. The basement rocks are partially covered by largely Oligocene to Quaternary volcanic rocks. The Teltele range on the other hand is predominantly composed of Miocene basaltic lava flows with subordinate rhyolite-trachyte and felsic tuff intercalations. The northeastern, northern and northwestern parts of the catchment comprise basalt flows with subordinate rhyolites, trachytes, tuffs and ignimbrites in most cases overlying the Precambrian basement (Davidson, 1983; Foerster et al., 2012, 2018).
Various feldspars and micas with different degrees of resistance to weathering, and volcanic glass in volcanic terrain have been characterized as precursors of the sediments in the Chew Bahir Basin. Metamorphic rocks of the Hammar Range are the most probable source of primary feldspars, such as, albite, anorthite and orthoclase (Pawar et al., 2008; Sak et al., 2010; Locsey et al., 2012; Foerster et al., 2012, 2018). They are also potential suppliers of potassium and the basis for the formation of smectite by aqueous weathering which in turn is the starting point for further alteration processes of the sediments. Therefore the deposits transported into the Chew Bahir Basin contain, among feldspars, mica and quartz, clay minerals (smectite, illite), zeolites (analcime) and carbonates (calcite) (Navarre-Stichler and Brantley, 2007; Vebel and Loisak, 2008; Navarre-Stichler et al., 2009; Sak et al., 2010; Ehlmann Mc et al., 2012; Foerster et al., 2012; Viehberg et al., 2018). Alternatively, the smectites could have resulted from weathering of basalts in the eastern and northeastern part of the CHB or silicate hydrolysis during wet climate conditions and diagenetic reactions (Renaut, 1993; Hay and Kyser, 2001; Foerster et al., 2018). Post-depositional processes have been shown to alter detrital deposits within the Chew Bahir Basin, mostly driven by the extreme hydrochemistry of the lake and paleolake. Saline and alkaline paleolake brines alter the octahedral composition of deposited minerals, while samples associated with wet phases reflect di-octahedral Al-rich phases. Mg-rich minerals dominate the spectra during arid intervals and an increase of trioctahedral phases has been observed (Foerster et al., 2018).
The 32,400 km2 catchment is drained by the perennial rivers Segen and Weyto in the northeast and northwest, respectively (Figure 1). The endorheic Chew Bahir Basin is a terminal sink for detrital weathering products from the wider catchment and surrounding rift flanks. It was hydrologically connected to lakes Chamo and Abaya to the north via overflow from lake highstands during pluvial phases (Fischer et al., 2020). Paleolake Chew Bahir reached the overflow sill to Lake Turkana in the south during maximum lake-level high stands at ∼45 m above the basin floor. The extensive alluvial fans along the escarpment, draining the Hammar Range to the west and the Teltele Plateau to the east, become seasonally and episodically reactivated after strong rainfall events, when they contribute coarser fluvial sediment flux into the basin (Foerster et al., 2012).
Silt-sized aeolian sediments are deposited mainly during predominantly drier conditions and are of more distal origin, mostly from the south of the catchment. Evidence of pyroclastic components in the Chew Bahir core is scarce, mainly due to intense alteration processes after deposition. The Konso Silver Tuff (154 ± 7 ka, Clark et al., 2003) as a tuffaceous marker (Silver Vitric Tuff, SVT) could be identified at ∼75 mcd in the Chew Bahir core (Roberts et al., submitted). The at least ∼2.5 km deep Chew Bahir Basin infill, representing predominantly Miocene to Quaternary fluvio-lacustrine sedimentary deposits, has been largely undisturbed by tectonic processes because rifting declined after the formation of the Chew Bahir rift (Pik et al., 2008). However, the sediments have been subject to intense post-sedimentary authigenic alteration processes that are indicative of paleohydrochemical variations of paleolake and porewaters (Foerster et al., 2018).
The present-day climate in eastern and northeastern Africa is influenced by a number of major air streams and convergence zones, with their effects superimposed on regional influences associated with topography, large lakes, and the nearby oceans. Rainfall in the area is associated with the seasonal migration of the tropical rain belt, resulting in bimodal rainy seasons in March-May and October-November (Nicholson, 2017, 2018). However, Chew Bahir is adjacent to regions of unimodal and trimodal rainfall distributions, which may have shifted in the course of long-term climate change (Nicholson, 2017, 2018). Inter-annual rainfall intensity also strongly depends on Atlantic and Indian Ocean sea-surface temperature (SST) variations caused by the Indian Ocean Dipole (IOD) and the El Niño-Southern Oscillation (ENSO) (Viste and Sorteberg, 2013).
From the western margin of the Chew Bahir Basin, duplicate cores CHB-2A and CHB-2B (hereafter in summary also referred to as CHB14-2) were retrieved, to 278.58 and 266.38 m below surface (mbs), respectively, with the parallel coring sites being ∼20 m part (Cohen et al., 2016; Figure 1). The Chew Bahir long cores consist of more than 115 sections each, which all sum up to nearly 3 t of lacustrine sediment. All core sections were opened, lithologically described, processed, photographed, measured and sampled (∼32 cm routine resolution) according to the HSPDP laboratory protocols at the U.S. National Lacustrine Core Facility (LacCore), the University of Minnesota. The two CHB14-2 cores 2A and 2B were subsequently spliced together on a common depth scale (meters composite depth = mcd). The merged CHB profile comprises 292.87 m in composite depth (mcd) and is with ∼90% near continuous. (Cohen et al., 2016; Campisano et al., 2017; Roberts et al., submitted). The standard core analyses included Multi Sensor Core Logger (MSCL)-based color reflectance values from 360 to 740 nm in 10 nm steps, magnetic susceptibility, gamma-ray density and p-wave velocity, X-ray fluorescence (XRF) scanning and entailed a detailed multi-proxy campaign, including geochemical, biological, physical analyses on ∼14,000 discrete samples.
To determine the varying elemental composition of the CHB sediment profile, X-ray fluorescence (XRF) core scanning was performed at 5 mm resolution at the Large Lake Observatory (LLO) of the University of Minnesota following HSPDP protocols (Campisano et al., 2017). The Itrax core scanner (https://www.coxsys.se) was used with a chromium (Cr) tube as radiation source, a tube voltage of 30 kV, current of 30 mA and scanning time of 10 s. For normalization, and compensation of the aging of the Cr tube (Schlolaut et al., 2018), the element counts were divided by coherence scattering and multiplied by a correction factor (c.f.), that was determined for all XRF data by dividing the week’s measurements by long-term average values of a set of SRM (Standard Reference Materials). Finally, all compositional data sets have been cleaned sub-cm wise by a quality flag system, avoiding coring artifacts, such as, cracks and voids (Trauth et al., 2020).
The potassium (K) content of the sediment has been established as a reliable proxy for dry climate phases in the Chew Bahir Basin, corresponding to increased evaporation, reduced vegetation cover and a lower lake level (Foerster et al., 2012; Trauth et al., 2015, 2018, 2020; Fischer et al., 2020). Figure 2 displays the variations in potassium (K) content of the composite CHB14-2 core (in normalized counts per second) plotted against age and core depth.
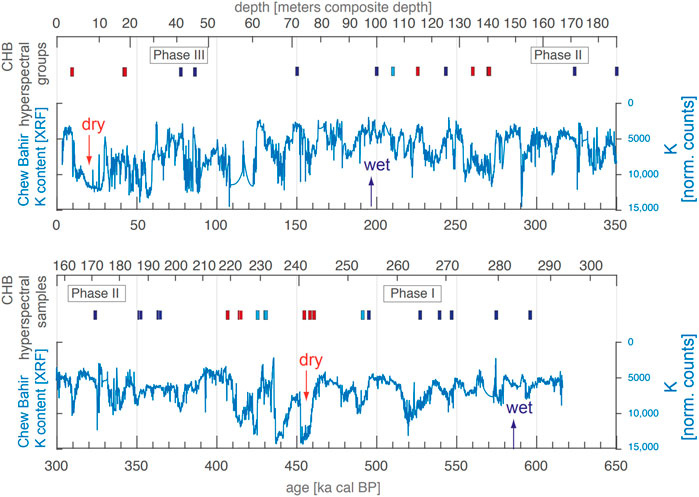
FIGURE 2. Variation in the potassium (K) content of the composite CHB14-2 core from the Chew Bahir Basin (in normalized counts per second) (Trauth et al., 2020) plotted against age (Roberts et al., submitted) and core depth. The potassium content is an established aridity proxy for the CHB sediments (Foerster et al., 2018). The bars and the phases refer to the results of the hyperspectral analyses as discussed in “Conclusion” section (red: dry-climate sediment; light blue: wet-to-dry-transition-climate sediment; blue: wet-climate sediment).
Increased influx of detrital K-rich weathering products may be associated with arid phases, when the extensive, sparsely-vegetated alluvial fans became activated during rare and short-lived strong rainfall events, transporting weathered feldspar and mica from the potassium-rich gneisses and granites of the adjacent Hammar Range into the basin (Foerster et al., 2012, 2015; Trauth et al., 2018). In addition, high K abundances in the Chew Bahir sediment cores are linked to an increase in alkalinity and salinity of the paleolake and porewater favoring so-called reverse weathering processes, such as, the low-temperature authigenic illitization of smectites. The hydrochemistry can be shown to control the degree of mineral alteration in the sedimentary deposits, and in the case of K-concentrations, Al-to-Mg substitutions lead to excess octahedral layer charge, which in turn further enhances K fixation in smectites (Foerster et al., 2018).
Mineral compositions of 1,040 discrete samples at 32 cm resolution along the composite core was determined applying X-ray diffraction (XRD). All samples were processed and analyzed at the University of Potsdam following the principles of Moore and Reynolds (1997) on an EMPYREAN X-ray diffractometer (PANalytical) using CuKα radiation. HighScore Plus version 4.0 (including the PDF reference data base) was used as analytical reference software for phase identification following the protocols developed for the Chew Bahir short cores (Foerster et al., 2018). Selected clay separates were further treated by air drying (N), ethylene glycol (EG) solvation and heating (H) at 550 °C for 1 h for phase identification. Analcime occurrences in the Chew Bahir sediment cores are markers for pronounced arid conditions with increased evaporation, pH and salinity (Renaut, 1993; Foerster et al., 2012, 2018; Viehberg et al., 2018). For smectites, variations in semi-quantitative abundances downcore were determined by a PCA that clustered similar diffraction patterns into clusters 0–10. To see tentative shifts in analcime occurrences downcore, the 112 analcime peak intensities (Bravais Miller index) of XRD patterns were used in counts and normalized by baseline correction.
For age-depth control, a Bayesian stratigraphic age model was applied to independent directly dated chronometers including radiocarbon dating of ostracodes, OSL dating of quartz, 40Ar/39Ar dating of K-feldspar grains from tuffaceous zones, and geochemical correlation of the Konso Silver Tuff (Silver Vitric Tuff, SVT) to a visible tephra unit in the core (Brown and Fuller, 2008; Clark et al., 2003; Brown et al., 2012; Roberts et al., submitted). With a basal age of ∼617 ka BP, and a spatial resolution for XRF elemental proxies of 0.5 cm, the temporal resolution of the CHB14-2 K record averages ∼10 years per data point (Trauth et al., 2020; Roberts et al., submitted)1.
The spectral measurements were carried out in DLR's Planetary Spectral Laboratory (Maturilli et al., 2018). PSL is a multi-country access facility that operates two identical Bruker Vertex 80V Fourier Transform Interferometers (FTIR) among other instruments. They allow measurements in the ultraviolet (UV), visible (VIS), near infrared (NIR) and mid infrared (MIR) spectral range. With a Bruker 513 accessory the bi-directional reflectance of samples with variable angles of incidence and emergence between 13° and 85° can be measured. The reflectance measurements are calibrated by comparison with spectroscopic measurements of well characterized standard references. These references are certificated standards of BaSO4 for the UV range, spectralon for the VIS and NIR and a rough gold surface standard for the MIR spectral range. A GaP diode detector was used in the UV, a Si diode in the VIS and an MCT detector in the MIR part of the electromagnetic spectrum.
Thirty-five CHB samples from core CHB14-2, previously prepared for XRD and quantitative XRF analyses including fine-grain fractionation, were selected for spectral measurement (Foerster et al., 2018). All 35 samples have equal and homogeneous particle-size distributions. Sample selection was primarily based on covering the range of XRF-determined potassium content of the core, because K- content has been shown to be a proxy for hydroclimate (Davies et al., 2015; Foerster et al., 2018). In selecting the CHB14-2 samples, importance was attached to sampling different drilling depths and thus different chronological intervals (Table 1).
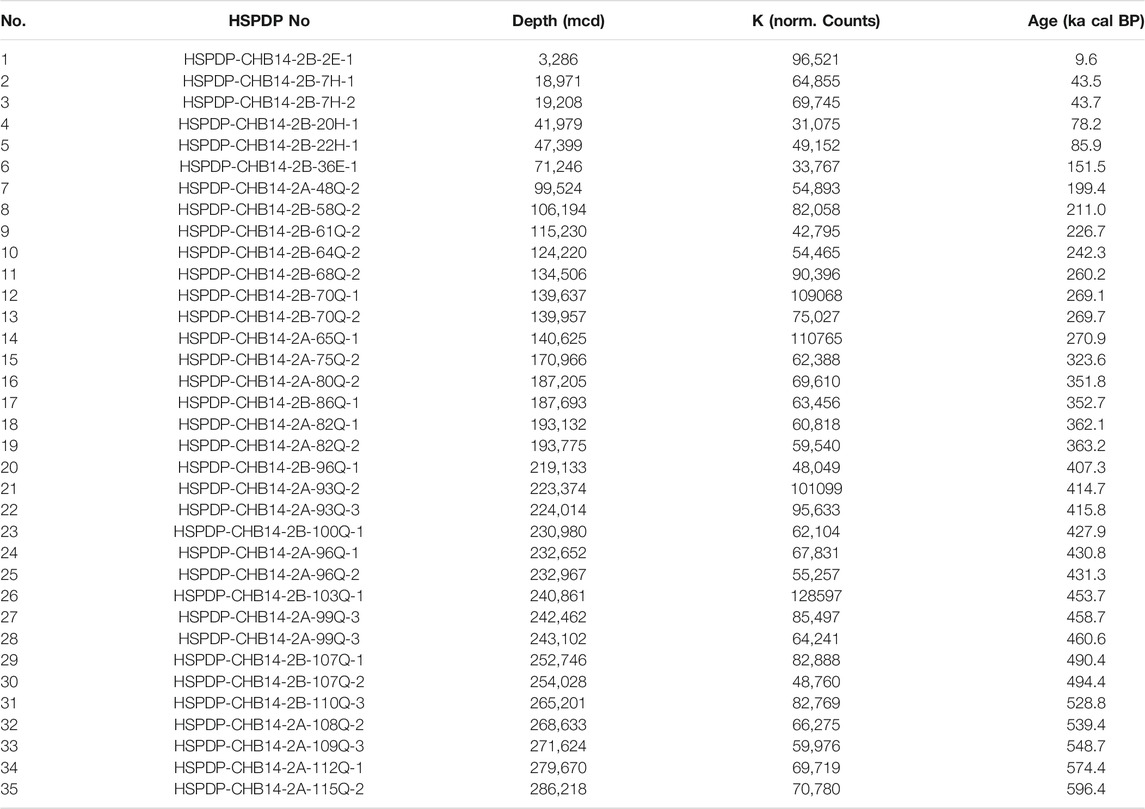
TABLE 1. Overview of all spectrally measured CHB14-2 samples with information on sample ID, core depth (midpoint) in meters composite depth (mcd), and potassium counts (normalized counts per 10 s) (Trauth et al., 2020) and interpolated sediment age in ka cal BP (Roberts et al., submitted).
Spectral measurements were performed at atmospheric pressure between 0.25 and 17 μm, at room temperature, at 15° incident and emergence angles, and with a spectral resolution of ≥4 cm−1. Standardized measurement procedures and data handling as well as a detailed error analyses for the entire measurement procedure at the PSL guarantee standardized and reliable measurement results, which make the obtained spectral data comparable with those of other international databases (Maturilli et al., 2018).
For spectral measurements, the samples were filled into aluminum sample cups according to a standardized procedure and placed in the Bruker 513 accessory for the measurement of the bi-directional reflectance. The filling of sample dishes ensures a constant packing texture by testing constant density for comparison. After each sample measurement, the reference standard is measured under identical environmental conditions. The quotient of both radiances is the bi-directional reflectivity, which is subsequently referred to as reflectance (R). This quantity is in the UV to NIR spectral range directly comparable with measurement results of spectral remote sensing and in the MIR with R = 1 − ε, where ε is the directional emissivity.
Figure 3 shows three CHB14-2 spectra obtained for samples with variable potassium content and core depth. The upper part (A) shows the total reflectance spectra between 0.25 and 17 μm, while B and C (centre) enhance the spectral information in the wavelength ranges between 0.25–5 and 7–17 μm, respectively. In addition, spectra B and C are shown with an offset for better clarity. The UV–VIS spectral part of the spectra is dominated by weaker absorption bands due to different electronic processes (Burns, 1993). The overall strong slope from the UV to the VIS is due to an Fe3+ → O2− charge transfer that results in a strong absorption band at around 0.27 µm. Superimposed on the long wavelength flank of this band absorption bands near 0.44 and 0.63 µm can appear that are caused by crystal field transitions. Absorption bands at about 1 µm can be caused by Fe2+ crystal field transitions (see spectrum 21). Features between 0.4 and 0.8 µm can be excited by Fe3+, intervalence charge transfer transitions between Fe2+ and Fe3+ generate bands between 0.55 and 0.8 µm. These absorption bands provide useful information on transition metal ions in minerals.
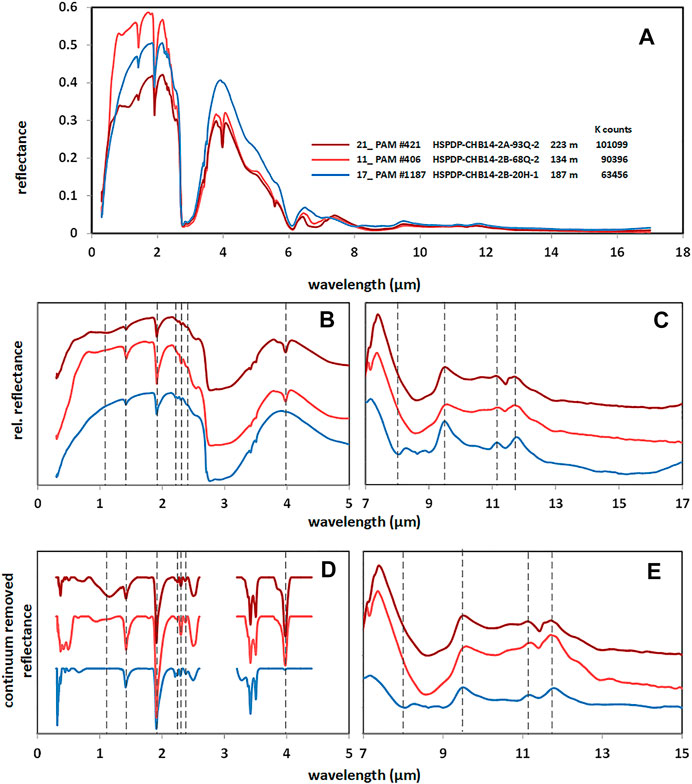
FIGURE 3. (A) Typical reflectance spectra of three selected CHB14-2 drill core samples in the wavelength range from 0.3 to 7 μm. (B, C) Detailed view of the 0.3–5 μm and the 7–17 μm range. (D, E) Continuum removed spectra between 0.25 and 5 μm and between 7 and 17 μm. For reasons of clarity, the spectra are presented with an offset in reflectance (left and right offsets are different).
In the range of wavelengths longer than 1 μm, overtones and combination tones of the mineral lattice vibration bands occur in the NIR. This wavelength range is particularly suitable for the investigation of hydrochemically weathered minerals and rocks. The molecules of the hydroxyl and the H2O group embedded during aqueous weathering cause characteristic absorption bands near 1.4 and 1.9 µm, which are clearly visible in the CHB spectra. The strong band near 1.9 µm is a combination of the H–O–H bend and the asymmetric O–H stretch and thus indicative for molecular water. Absorption bands at 1.4 µm are caused by an O–H stretch in molecular water and structural OH. The simultaneous appearance of both absorption bands is a spectral indication of phyllosilicates with a three-layer structure, such as, smectites. These clay minerals are dioctahedral smectites with, primarily Al, but also Mg and Fe ions in octahedral coordination with oxygen and hydroxyl in a sheet-like structure. These layers are loosely bond to each other with cations (e.g., Ca and Na) and variable amount of water in the interlayer (Grim, 1968; Singer, 1982).
Spectra of smectites are known to form weak absorption bands in the spectra between 2 and 2.5 µm. These absorption bands can be attributed to combination overtones of structural hydroxyl stretches with lattice modes. The exact wavelength position depends on the cation present. An Al–OH vibration results in an absorption band near 2.2 µm and is therefore typical for montmorillonite. Magnesium, on the other hand, causes a corresponding absorption band at 2.3 µm, as occurs for saponite (Gaffey et al., 1993). Al–Mg mixing stages and contributions of other metal ions can influence the variability of the band positions between 2 and 2.5 µm. The exact positions and spectra of the CHB sample within this range are shown in Figure 5 in more detail. The X-ray examinations of the CHB samples suggest that during dry climate episodes, an illitization of the CHB smectites and an octahedral Al-to-Mg substitution takes place. The authigenic enrichment of Mg in clays has been observed in several other saline and alkaline lakes, such as, Paleolake Olduvai and is diagnostic for the intense clay mineral alteration under increasingly saline and alkaline conditions (Deocampo et al., 2009; Deocampo and Tactikos, 2010; Foerster et al., 2018). Therefore, especially the investigation of these absorption bands should provide valuable information about these processes.
Figure 4 shows spectra of possible CHB mineral endmembers in the 0.25–5 µm range (kaolinite, analcime, saponite, illite, Ca- and Na-montmorillonite). Figure 4 can directly be compared to Figure 3B. The kaolinite belongs to the phyllosilicate type with two-layer structure. It primarily bonds OH not H2O, which is shown in the spectra by an only weakly pronounced water absorption band at 1.9 µm. Analcime can be discriminated among the possible sediment candidates by an absorption band at 1.16 µm. Montmorillonites and saponite can be distinguished using the 2–2.5 µm band positions. While the montmorillonite spectra are characterized by an Al–OH band near 2.2 µm in the absence of other absorption bands in this region, the saponite spectra show an Mg–OH absorption band at 2.3 µm and no absorption band near 2.2 µm. Illite spectra, on the other hand, show several absorption bands of variable band depth close to 2.2, 2.3, and 2.38 µm depending on the Al/Mg ratio.
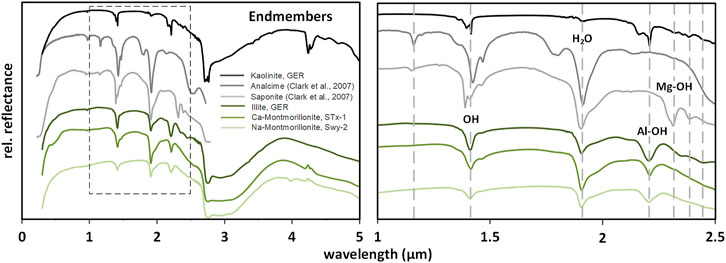
FIGURE 4. Left–Relative reflectance spectra between 0.25 and 5 μm of possible mineral endmembers for comparison to CHB. Right—Detailed view of the spectral range between 1 and 2.5 μm with marking of characteristic absorption bands: 1.16 μm—analcime, 1.4 μm—OH, 1.9 μm—H2O, 2.2 μm—Al–OH, 2.3 μm—Mg–OH and bands at 2.4 and 2.5 μm which can be assigned to illite. The positions of the absorption bands of the structural H2O and OH as well as those of the Al–OH and Mg–OH absorption bands are marked in the plot.
With increasing wavelength (Figure 3) the first fundamental lattice vibration bands occur at about 2.7 µm and close to 6 μm, which can be assigned to the OH complex and the bond water. These bands are strong and nearly saturated. They are also significantly overlaid by adsorbed water bands, which are not indicative of the crystal structure of the CHB sediments (Figure 3). The long-wave flank of the 2.7 µm absorption band is superimposed by low-contrast bands in the 3.4 µm range. These absorption bands are associated with organic components. Of particular interest is an absorption band in the vicinity of 4 µm. It is clearly visible in the CHB spectra that are also marked by high potassium values (see Figures 3A,B). This feature can be attributed to calcite (Clark et al., 1999; Arnold et al., 2020). This absorption band thus also proves to be an important spectral paleoclimate indicator, as it can be a measure of evaporative concentration of the lake water during dry periods.
In the MIR the fundamental vibration bands of silicates and other minerals occur in the reflectance spectra. Low-contrast double structure occurs in the CHB spectra around 11 µm together with an absorption band at ∼9.5 µm (see Figure 3C). This behavior is consistent with smectites, predominately montmorillonites. The depth of the MIR absorption bands is reduced due to the fine particle size structure of the samples (Arnold 1991). The double structured band around 11 µm is a result of an Al–Fe–OH vibration (∼11.1 µm) and an Al–Mg–OH vibration (∼11.7 µm). The band at ∼9.5 µm is from a Si–O stretching and bending vibration. Weaker absorption bands, which are hardly discernible in the spectra of Figure 3C (sample spectrum 17, blue color), occur at ∼8.25 and ∼12.35 µm. The 8.25 µm band is due to SiO2 and the 12.35 µm absorption band is produced by an Mg–Fe–OH vibration (Farmer and Russel, 1964; Bishop et al., 1994, 2008). In addition, a local reflectance minimum appears at ∼8 µm in the spectrum of sample 17 (Figure 3C, blue color). This is the Christiansen Feature (CF) (Salisbury, 1993), which is a result of the optical properties of the mineral grains and their environment (air). At the specific wavelength of the CF the optical properties of the mineral and the medium surrounding it are very similar. This results in a reflectance minimum, which is diagnostic for the mineral as well. However, CF can only be used for spectra of CHB samples with low calcite concentration. As Figure 3C demonstrates, the presence of calcite masks the spectral properties of spectra 11 and 21 (red color) in the 8 µm spectral range.
Overall, the simultaneous use of the spectral indicators in the wavelength ranges from the UV to the MIR allows a comprehensive evaluation of the aqueous weathering processes of the CHB sediments. For further discussion and quantitative data evaluation, the use of the defined spectral indicators next requires a continuum correction of the spectra. The spectral continuum is defined as a series of linear progressions and then the continuum-correlated reflectance spectrum is calculated. This common method ensures the exact determination of the wavelength positions of absorption bands and allows the calculation of band depths. Since all 35 CHB samples have the same particle size distribution, particle size effects due to grain size variations need not be considered. Figures 3D,E show the results of the continuum correction for CHB samples 11, 17, and 21. The continuum-corrected reflectance spectra form the basis for further data handling.
We used the spectral properties of climate-relevant indicators near 1.16, 2.2, 2.3, 2.4, and 3.98 µm to quantify climate-related dependencies and to analyze cross-correlations with the X-ray data. Other spectral indicators mentioned above are discussed as qualitative indicators.
The CHB14-2 sample reflectance spectra show that the sediment core samples are mainly composed of smectites, with a dominance of montmorillonites. In addition, calcite is present in samples with high potassium content (see Figure 3A, red spectra). At low K content of the samples, pronounced Al-OH absorption bands near 2.2 µm appear in the reflectance spectra while the calcite band near 3.98 µm does not occur or is only weakly pronounced (see Figure 3A, blue spectrum). In contrast, spectra of samples with high calcium content show absorption bands near 2.3 and 2.38 µm due to an Mg–OH stretch while the 2.2 µm absorption band either disappears completely or is only weakly pronounced. Simultaneously, strong calcite absorption bands at 3.98 µm are observed to be correlating with high K values. At the highest potassium contents, an additional absorption band at 1.16 µm appears in the spectra, which indicates the presence of analcime. Furthermore, there are differences in the characteristics of absorption bands in the UV–NIR range, of organic constituents that occur on the long-wave flank of the 2.7 µm band and some variations of the strength of MIR absorption bands. In the UV–NIR spectral range, differences in mean reflectance must also be considered. These differences can be caused by materials that can act as gray body reflectors without producing selective absorption bands (dark agents). Such dark materials can reduce the spectral contrasts of the other absorption bands, an effect that is stringently considered in quantitative data evaluation of the 2.2 and 2.3 µm bands by the use of spectral ratios.
Figure 5 displays continuum removed reflectance spectra of the 35 CHB14-2 samples in the spectral ranges between 1 and 1.25 µm (left), 2.15 and 2.45 µm (middle) and between 3.7 and 4.3 µm (right). The spectra are shown with a vertical offset to illustrate the evolution of the sediment composition over time (samples down-core). The left diagram of Figure 5 displays the variation of the 1.16 µm absorption band characteristic for analcime. The middle diagram shows three groups of spectra. Spectra in dark blue color have clearly visible and dominant Al–OH absorption bands near 2.2 µm with larger band contrasts, and moderately pronounced bands at 2.3 and 2.38 µm. In the light blue spectra (group 2) the absorption bands are weaker near 2.2 µm. In the third group (red spectra 1–3, 11–14, 21, 22, and 26–28), contrasts of the absorption band near 2.2 µm are either very small or the band disappears completely. On the other hand, the Mg-OH absorption band near 2.3 µm is clearly visible and can completely dominate the red spectra in individual cases. These spectra in red correspond to those samples for which higher potassium contents were determined from the XRF measurements whereas the spectra in blue belong to samples with lower potassium content. Spectra of samples with high potassium content (red) have distinct calcite absorption bands at 3.98 µm (Figure 5, right, red spectra). The appearance of absorption bands at 1.16 µm, near 2.2 and 2.3 µm and at 3.98 µm correlates with the trend potassium contents and can be used to evaluate the degree of mineral alteration in the course of varying pore water alkalinity and salinity. Consistently, this means that during humid climate episodes the formation of aluminum-rich montmorillonites is favored. In dry climate periods, however, aluminum is replaced by magnesium resulting in an enhanced K-fixation and formation of a trioctahedral phase under alkaline and saline conditions (Foerster et al., 2018). This is consistent with authigenic illitization and at the same time a higher alkalinity and salinity in the closed lake of CHB, due to the drier climate, which can be associated with the calcite enrichment of the high potassium samples.
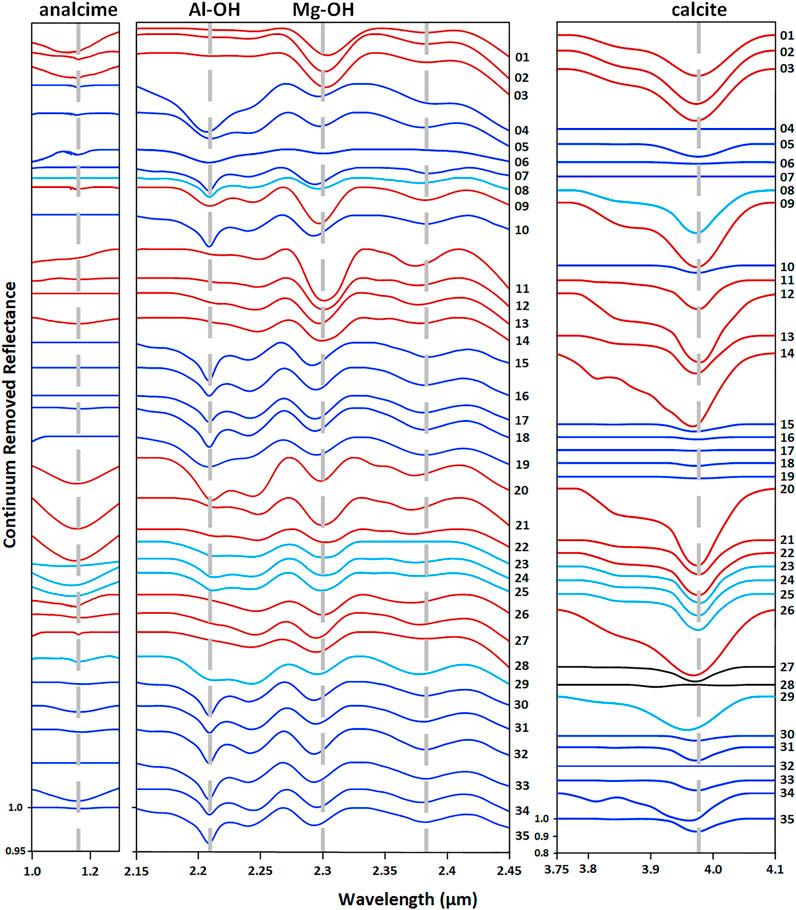
FIGURE 5. Continuum removed reflectance spectra of all 35 CHB14-2 samples. Left—Spectral range between 1.0 and 1.25 μm (analcime). Middle—2.15 and 2.45 μm. Right—Spectral range from 3.7 to 4.3 μm (calcite). All spectra are offset relative to the spectrum of sample 35. For information on sample depth and age see Table 1.
In this argument, it is possible to divide the spectra into groups that can be assigned to (a) dry-climate sediments, (b) wet-to-dry-transition-climate sediments, and (c) wet-climate sediments. This is done in Figure 5 by assigning a color: (a)—red spectra, (b)—light blue spectra and (c)—blue spectra. Only the spectra of samples 27 and 28 show a deviation from the general trend in the range around 3.98 µm (Figure 5, right), which is manifested by the fact that despite the absence of the 2.2 µm band and a clear band at 2.3 µm, no or only a weakly contrasted calcite band occurs. These spectra are shown in black on the right side of Figure 5. This could possibly be related to the fact that during the corresponding short dry period between the longer humid climate episodes an Al-to-Mg substitution was initiated, but the period was too short to deposit significant amounts of calcite for spectral detection. With these results a general picture of the temporal sequence of weathering within the alternating humid and dry climate phases in the CHB Basin is obtained.
Figure 6 shows a comparison of XRF and XRD results for the selected 35 samples in this study with indicative band depths near 2.2 and 2.3 µm caused by Al and/or Mg inclusions in the minerals of the CHB14-2 samples vs. their core depth. The first column (A) in Figure 6 shows the elemental variations in between samples for Al (scanning XRF data in normalized counts per second). The second column (B) indicates the variations in smectite abundances, determined in groups 0–10 according to diagnostic variations in diffractograms (XRD results). The third, middle column (C) displays the variation in the potassium (K) content among CHB14-2 samples, each displayed data point representing an average of 5 data points, determined by X-ray fluorescence (XRF) core scanning in 5 mm resolution in normalized counts per second (cps). Each discrete sample equals a 2 cm increment. A clear inverse relationship between K-values and smectite abundances (reflecting illitization at the expense of smectites) is apparent. The aluminum content of the samples follows this trend showing that primarily montmorillonites dominate the mineral spectrum during wet phases as products of aqueous weathering. Smectites in CHB are weathering products and poor in potassium. Inverse correlation of K contents and smectite abundances supports the hypothesis that K concentration is largely controlled by the K-fixation in smectites altering them into low-temperature authigenic illite. Thus, high potassium contents correlate with dry climate periods whereas wet episodes are characterized by lower potassium values. Under dry climatic conditions and with increasing evaporation, octahedral Al-to-Mg substitution in the phyllosilicates leads to an increase in the layer charge, which facilitates potassium fixation (Deocampo et al., 2009; Foerster et al., 2018). Therefore, the potassium content is a direct indicator for paleohydrological conditions in the Chew Bahir Basin.
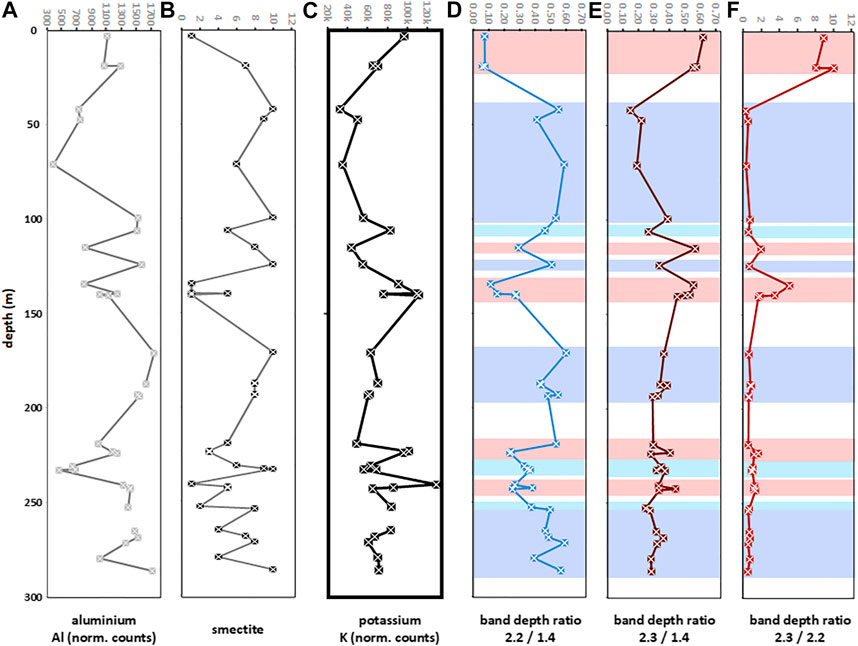
FIGURE 6. Comparison of absorption band ratios at 2.2/1.4, 2.3/1.4 and 2.3/2.2 (hyperspectral analysis) (D–F) for the CHB14-2 samples with elemental variations (XRF, A, C) and semi quantitative phase abundances (XRD, B) of analyzed samples downcore. (A) Aluminum, (B) smectite, (C) potassium, (D) 2.2/1.4 band depth ratio, (E) 2.3/1.4 band depth ratio, and (F) 2.3/2.2 band depth ratio. CHB potassium values (K) (scanning XRF, in normalized counts per second) show an inverse correlation with smectite abundances (XRD) in corresponding samples. Al content (scanning XRF, in normalized counts per second) largely follow smectite abundances (XRD) that are typically rich in Al. Color shading indicates inferred hydroclimate: red: dry-climate sediment; light blue: wet-to-dry-transition-climate sediment; blue: wet-climate sediment, derived from spectral analysis.
The following three columns D–F in Figure 6 show the ratios of the band depths at 2.2 and 2.3 µm divided by those at 1.4 µm and the ratio of the two band depths at 2.3 µm against 2.2 µm from left to right. The use of ratios for the comparison takes into account the possible influence of variable dark agents of the different samples. In addition, rationing to 1.4 µm enables to control significant variation of molecular water and structural OH by comparing the single sample spectra with each other. The colored crossbars in the three right-hand columns are based on the results of the discussion in Figure 5. Red crossbars correspond to dry-climate sediments, light blue to wet-to-dry-transition-climate sediments and blue ones to wet-climate sediments.
The analysis of the spectral indicators (absorption bands near 2.2 and at 2.3 µm) shown in the right part of Figure 6 are in full agreement with these previous X-ray measurement results. Column D with the depth of the 2.2 µm band, which is generated by an Al–OH stretch, shows higher values mainly for wet-climate samples. Thus, higher aluminum contents correspond to lower absorption bands at 2.2 µm. The diagram in column D is therefore highly correlated with the smectite XRD results and anticorrelated with the XFR potassium values. The opposite is the case for the vibration band caused by Mg–OH at 2.4 µm, whose depth is presented in column E. Column E in Figure 6 confirms that during dry climate phases more Mg is incorporated and the 2.3 µm absorption band increases in depth. The comparison of diagrams 4 and 5 clearly demonstrates that the incorporation of Mg takes place by substitution of Al. Consequently, both diagrams are clearly anticorrelated. The last column (diagram F, Figure 6) summarizes the result as a ratio of both band depths at 2.3 µm relatively to 2.2 µm confirming this inverse relationship. The local maxima of this ratio can be clearly assigned to dry climate episodes. Moreover, it shows the degree of Mg substitution, which is mostly higher for samples with high potassium content. Maxima of this ratio occur in younger time periods <45 ka BP (core depths <20 m) and around 270 ka BP (∼140 m). But the hyperspectral measurements are also sensitive to weaker changes in the ratio of these absorption band depths. Local weaker maxima almost always coincide with a higher potassium content and thus with drier climate phases. Examples are spectra of the dry-climate sediment samples 9, 21, 22, 26, 27, 28 (see core depth and age date from Table 1).
These findings are consistent with the model according to Foerster et al. (2018), and with surface sediment samples from the CHB catchment. The results are also a methodologically independent test of the weathering model based on short core results (Foerster et al., 2018). Beyond this confirmation of authigenic processes evident on shorter timescales applying also on longer timescales, the hyperspectral data reveal new capacities for climate-relevant studies. In the spectral range between 1 and 2.5 µm it is possible under controlled laboratory conditions not only to prove Al-substitution by Mg and low-temperature illitization, but also to perform semi-quantitative analyses with the help of these spectral indicators and their relationships to each other. This provides valuable and more detailed information about the degree of weathering processes, their duration and their correlated fine structure; crucial information for the reliable establishment, validation and advanced understanding of paleoclimatic proxies.
Figure 7 compares the shifts in 112 analcime peak intensities, indicative for varying abundances of analcime in discrete samples (XRD results, column A) and the potassium content from XRF data (column B) with further hyperspectral indicators that complete these studies. These spectral indicators are an absorption band at 1.16 µm, which can be attributed to analcime and a band at 3.98 µm caused by calcite. Columns C and D in Figure 7 display the band depth variation at 1.16 and 3.98 µm (right two columns) against the core depth in meters (mcd). The shifts of analcime abundances, indicated in variations of XRD peak intensities of the 112 analcime peak, are consistent with high potassium values (see columns 1 and 2). The analcime absorption band at 1.16 µm (column C) is not observed in most of the CHB14-2 sample spectra or it is characterized by a very low spectral contrast. It is only found in the spectra of CHB14-2 sediment samples with the highest potassium contents corresponding to pronounced dry climate phases. Although one of the maximum values of XRD data for analcime in sediment samples from a core depth of 134.5–139 mcd (samples 11 and 12) corresponds to a weaker band depth at 1.16 µm, the band is clearly identifiable in the spectrum of the 134.5 mcd sample and is also increased in contrast to spectra of samples with low potassium levels. The maximum depth of the 1.16 µm absorption band is observed in the spectrum of sediment samples from depths of ∼224 mcd (samples 21 and 22), which correlates with a high potassium abundances and dry climate conditions. Further consistency between high analcime and potassium values and the band contrast at 1.16 µm is shown for younger sediment samples (1–3) from depths 3 and 20 m and for sample 26 from ∼241 m.
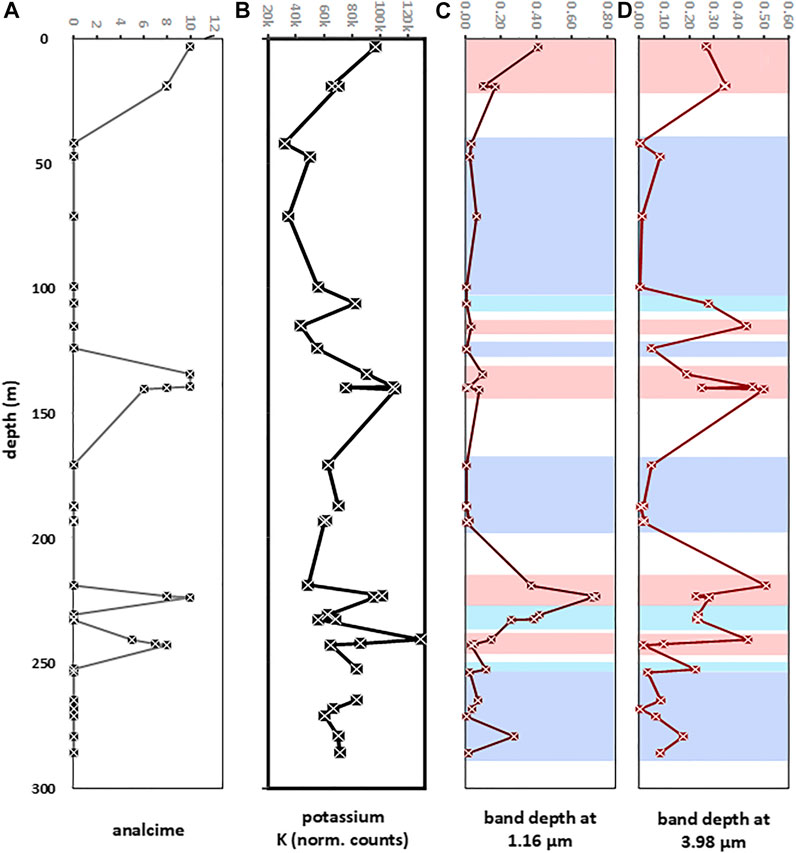
FIGURE 7. Comparison of absorption band depths at 1.16 μm (characteristic for analcime) and at 3.98 μm (calcite) with K values (scanning XRF, normalized counts per second) and analcime intensities (XRD, normalized). (A) Analcime, (B) potassium, (C) band depth at 1.16 µm, and (D) band depth at 3.98 µm. Color shading indicates inferred hydroclimate: red: dry-climate sediment; light blue: wet-to-dry-transition-climate sediment; blue: wet-climate sediment, derived from spectral analysis.
Of particular interest is that even for sediment samples for which the XRD method could not provide analcime detection, 1.16 µm bands could be recorded with the hyperspectral method. The corresponding depths of this absorption band follow, apart from some already discussed deviations, the course of the potassium content determined by XRF methods to a large extent (compare Figure 5, 2nd and 3rd column). This opens up the possibility of refining the sediment investigations for the detection of analcime with hyperspectral methods for future analysis.
Diagram D in Figure 7 shows the corresponding depths of the absorption band at 3.98 µm. As this band is indicative for calcite, it enables a link to be established to the salinity of the samples, which in turn is also an important marker in CHB sediments for the change from humid to dry climate conditions. High band contrasts are an evidence of high calcite concentrations. Their occurrence correlates to dry climate episodes that could be typically connected with increased salinity. The curve of the band depth as a function of the core depth of the samples follows the corresponding curve of the potassium content (column B). Maximum potassium contents are consistent with high band contrasts of the 3.98 µm band. This applies to almost all samples investigated except for sample 9 (∼115-m core depth), which has a relatively high band depth compared to the determined potassium content. The correlations between analcime and calcite band contrasts must also be considered. Here, too, apart from the spectra of samples 9, 11, and 12, we see a high degree of agreement in the tendencies for the corresponding band depths. The synergetic use of both bands therefore also offers the potential to investigate the weathering paths in dry periods more precisely by means of hyperspectral data.
The finding of analcime and high calcite abundances in dry-climate samples is in line with the results of the X-ray analyses and supports the model of Foerster et al. (2018). Since the composition of the authigenic minerals are characteristic of past and present hydrological conditions, all spectral indicators discussed in this chapter are suitable proxies to track the climate of the Chew Bahir region over the past ∼620 ka. This is further supported by UV, VIS and MIR spectral features, which in turn support the presence of smectites, calcite and analcime, and can also enable further and more refined mineralogical analyses.
The UV–VIS absorption bands (see Figure 3D) offer the possibility of detecting the involvement of certain transition metal ions in the mineralogical solid state lattice and thus to draw connections to the origin and nature of the initial products of weathering. Absorption bands close to 3.4 µm (see Figure 3D) are of organic origin and can in future also be used to study the type of organic matter and its variations in the sediment as a function of past environmental factors. Finally, the semi-quantitative evaluation of spectral indicators in the mid-infrared offers additional possibilities, e.g., to narrow down the silicate components of the sediments more distinctly. Thus, in the spectra of the calcite-free or calcite-poor sediment samples, such as, the spectrum of sample 17 (blue spectrum) shown in Figure 3E, spectral signatures like the minimum reflectance at 8 µm or the silicate fundamental vibration bands near 11 µm can be extracted, which can be assigned to the phyllosilicate dominant in the sample and which in the case of sample 17 clearly indicate montmorillonite. This will be the subject of additional future quantitative analysis of these hyperspectral data.
The 0.25–17 µm reflectance spectroscopy is a minimally invasive, fast and inexpensive analytical method for studying the chemical-mineralogical composition of sediments. In the case of the drill core samples from the Chew Bahir Basin, the method is shown to be a valuable tool in establishing correlations between spectral information on the mineralogy of the samples and climatic indicators. Thus, hyperspectral spectroscopy is a suitable and independent method for studying paleoclimatic weathering processes in the Chew Bahir Basin. This is especially valid for the study of the alternating processes of aqueous and dry weathering, processes that commonly influenced sediments of the Chew Bahir region in the past 620 ka. The spectral measurements have shown that the CHB sediment mineralogy is dominated by smectites with variable Al and/or Mg incorporation. In addition, calcite is the major carbonate component present. The calcite content is highest in samples that can be assigned to dry climate phases. Samples that can be attributed to the driest climate phases contain the zeolite analcime.
The hyperspectral studies show a clear positive correlation of absorption band depth ratios 2.3/2.2 µm with the potassium (K) content of the samples. The absorption band ratio corresponds to increases in K values and thus reflects the increased incorporation of Mg into Al montmorillonite during episodes of an arid climate. The analyses support the conclusion that the illitization of the Chew Bahir clay minerals with increasing evaporation is enhanced by octahedral Al-to-Mg substitution in the clay minerals, with the resulting increase in layer charge facilitating potassium fixation. This confirms the model of authigenic illitization of smectites under more arid conditions during episodes of higher alkalinity and salinity in the closed-basin lake of Chew Bahir as proposed by Foerster et al. (2018). In comparison and in addition to the results of the XRF/XRD analyses, however, the hyperspectral investigations also go well beyond these former results. The high sensitivity of the absorption band depths near 2.2, 2.3, and 2.35 µm for the Al-to-Mg substitution and the associated illitization allows a re-tuning of the wet and dry environmental sequences in the course of the alteration.
Furthermore, it is possible to track analcime and calcite in dry periods by using hyperspectral analysis close to 1.16 and 3.98 µm. The salinity of the Chew Bahir sediments is strongly correlated to the 3.98 µm absorption band depth of calcite in the samples. During wet climate periods the carbonate is precipitated from solution. The drier the environmental condition, the more calcite is formed. Variable band contrasts at 3.98 µm indicate this. The highest band depth values occur at the highest potassium abundances and in the driest climatic phases. Only within these highly arid periods can analcime be detected in the sediment spectra as authigenic formation by reverse weathering of clay minerals. Since the formation of analcime requires high alkalinity and salinity of the paleolake water, linked to desiccation in terminal lakes, the synchronous finding of high calcite content and analcime is conclusive.
Based on the spectral investigations presented here, a climatic record can be built, comprising the following phases: ∼600–500 ka wet phase, ∼460–454 ka dry episode, ∼431–428 ka weak humid phase, ∼415–407 ka dry conditions, ∼363–324 wet phase, ∼270–260 ka dry episode, ∼242 ka short humid phase, ∼227 ka short dry phase, ∼211–78 ka wet episode and since ∼44 ka dry conditions. These results are shown as colored shading in Figure 2 and can be directly compared with the geochemical analyses of variations in potassium content as a function of core depth and sample age. This record is largely consistent with the wet-dry variations as suggested by the aridity-proxy K (Trauth et al., 2020). Those wet-dry variations can be discerned into three phases with similarities in the central tendency and dispersion: a long-term drying trend in Phase I (∼620–413 ka BP), a generally wetter but increasingly fluctuating Phase II (∼413–195 ka BP) and finally a long-term drying trend that is marked by rapid climate oscillations from ∼195 ka BP on (Phase III).
The results of the spectral analyses presented here can also further qualify the degree of past aridity/humidity, which has important implications for understanding environmental influence on past human populations. Climatic fluctuations may have had a critical impact in shaping human habitats (Campisano et al., 2017; Owen et al., 2018; Mounier and Lahr, 2019). The oscillating environmental extremes in the final part of Phase I may have been strongly selective in driving evolutionary and cultural change, including the abandonment of Acheulean technology (e.g., Potts et al., 2018). The hyperspectral results support the aridity-proxy record (Figure 2) but suggest that there were also narrower time windows where the climate was neither fully humid nor arid, but moderately humid, which would have had an impact on the connectivity of potential corridors of population dispersal. Favorable humid conditions during Phase II, pulsed by short arid excursions, interpreted as having played a key role in the emergence of Homo sapiens, are confirmed by the results presented here. Similarly, the results confirm the occurrence of short-term oscillations in Phase III, which may have played a role in the timing of migration events out of Africa (Stringer and Galway-Witham, 2017; Stewart et al., 2019).
In summary, the hyperspectral reflectance measurements show that for the continuum-corrected spectra obtained under well-defined laboratory conditions in terms of sample preparation and measurement performance, four spectral indicators can be clearly defined that can be reliably correlated directly with the climatic conditions under which the sediments were formed. These are absorption bands at 1.16, near 2.2, near 2.3 and at 3.98 µm and their band depths. It could be demonstrated in this paper that the synergetic use of these climate-relevant spectral indicators offers a complementary and enhancing contribution to previous climate proxy studies in the Chew Bahir Basin (e.g., Foerster et al., 2018; Trauth et al., 2020). Overall there is very good agreement between the geochemical and hyperspectral mineralogical results.
Further spectral signatures are currently being tested for semi-quantitative climate proxy studies. These include the UV/VIS absorption bands caused by electronic processes on transition metal ions, features due to organic matter near 3.4 µm, the MIR reflectance minima on the short-wave flank of the silicate reststrahlen bands and the fundamental vibration bands themselves. They have the potential to provide further information from the entire wavelength range from 0.25 to 17 µm in order to extract additional climate-relevant information in future studies. To the extent that the number of climate-relevant spectral indicators can be expanded and the method can be extended to a larger number of drill core samples, statistical methods up to machine learning algorithms can be used in the future to further professionalize climate proxy studies with hyperspectral analyses and potentially apply these methodological findings to other coring sites and environmental archives. Finally, the hyperspectral reflectance spectroscopy method allows a direct comparison with spectral remote sensing data and thus a combination of investigations of the current surface composition in the Chew Bahir Basin and its connection to past climate data.
The raw data supporting the conclusions of this article will be made available by the authors, without undue reservation.
Each named author has substantially contributed to conducting the underlying research and drafting this manuscript.
The authors declare that the research was conducted in the absence of any commercial or financial relationships that could be construed as a potential conflict of interest.
Support for HSPDP has been provided by the National Science Foundation (NSF) Grants and the International Continental Drilling Program (ICDP). Support for CBDP has been provided by Germany Research Foundation (DFG) through the Priority Program SPP 1006 ICDP (FS 472/13 and /18, MHT: TR 419/8, /10 and /16, FO 734/2) and the CRC 806 Research Project “Our way to Europe” (Project Number 57444011). Support has also been received from the UK Natural Environment Research Council (NERC, NE/014K560/1, IP/1623/0516). We thank the Ethiopian authorities for permits for drilling in the Chew Bahir Basin, and the Hammar people for local assistance during drilling operations. Logistic support and supervision of drilling was provided by DOSECC Exploration, in co-operation with Ethio Der pvt. Ltd. Co. Initial core processing and sampling were conducted at the US National Lacustrine Core Facility (LacCore) at the University of Minnesota. The authors would like to thank DLR's Institute of Planetary Research, Berlin-Adlershof, for use of the laboratory and for their support in the spectral investigations. This is publication HSPDP#39 of the Hominin Sites and Paleolakes Drilling Project.
1Roberts, H., Bronk Ramsey, C., Chapot, M., Deino, A., Lane, C., Vidal, C., et al. (2021). Using multiple chronometers to establish a long, directly-dated lacustrine record: constraining >600,000 years of environmental change at Chew Bahir, Ethiopia. Quater. Sci. Rev., Submitted.
Arnold, G., Szczech, C., Asrat, A., Cohen, A. S., Foerster, V., Schäbitz, F., et al. (2020). Advanced Hyperspectral Analysis of Sediment Core Samples from the Chew Bahir Basin, Ethiopian Rift in the Spectral Range from 0.25 to 17 Μm: Support for Climate Proxy Information. EGU Gen. Assembly 2020, 5233. doi:10.5194/egusphere-egu2020-5233
Arnold, G. (1991). Measurements of the Spectral Emittance of Particulate Minerals and Some Remote Sensing Implications. Vibrational Spectrosc. 2, 245–249. doi:10.1016/0924-2031(91)85032-i
Bibring, J.-P., Langevin, Y., Mustard, J. F., Poulet, F., Arvidson, R., Gendrin, A., et al. (2006). Global Mineralogical and Aqueous Mars History Derived from OMEGA/Mars Express Data. Science 312, 5772, 400–404. doi:10.1126/science.1122659
Bishop, J. L., Pieters, C. M., and Edwards, J. O. (1994). Infrared Spectroscopic Analyses on the Nature of Water in Montmorillonite. Clay and Clay Minerals 42, 702–716. doi:10.1346/ccmn.1994.0420606
Bishop, J. L., Noe Dobrea, E. Z., McKeown, N. K., Parente, M., Ehlmann, B. L., Michalski, J. R., et al. (2008). Phyllosilicates Diversity and Past Aqueous Activity Revealed at Mawrth Vallis, Mars. Science 321 (5890), 830–833. doi:10.1126/science.1159699
Brown, F. H., and Fuller, C. R. (2008). Stratigraphy and Tephra of the Kibish Formation, Southwestern Ethiopia. J. Hum. Evol. 55, 366–403. doi:10.1016/j.jhevol.2008.05.009
Brown, F. H., McDougall, I., and Fleagle, J. G. (2012). Correlation of the KHS Tuff of the Kibish Formation to Volcanic Ash Layers at Other Sites, and the Age of Early Homo sapiens (Omo I and Omo II). J. Hum. Evol. 63, 577–585. doi:10.1016/jhevol.2015.05.014
Burns, R. G. (1993). “Origin of Electronic Spectra of Minerals in the Visible to Near-Infrared Region,” in Remote Geochemical Analysis: Elemental and Mineralogical Composition 4. Editors C. M. Pieters, and P. A. J. Englert (Cambridge: Cambridge University Press), 3–29.
Butz, C., Grosjean, M., Wunderle, S., Tylmann, W., and Rein, B. (2015). Hyperspectral Imaging Spectroscopy: a Promising Method for the Biochemical Analysis of lake Sediments. J. Appl. Remote Sens. 9, 1–20. doi:10.1117/1.JRS.9.096031
Butz, C., Grosjean, M., Goslar, T., and Tylmann, W. (2017). Hyperspectral Imaging of Sedimentary Bacterial Pigments: a 1700-year History of Meromixis from Varved Lake Jaczno, Northeast Poland. J. Paleolimnology 58, 57–72. doi:10.1007/s10933-017-9955-1
Campisano, C. J., Cohen, A. S., Arrowsmith, J. R., Asrat, A., Behrensmeyer, A. K., Brown, E. T., et al. (2017). The Hominin Sites and Paleolakes Drilling Project: High-Resolution Paleoclimate Records from the East African Rift System and Their Implications for Understanding the Environmental Context of Hominin Evolution. PaleoAnthropology 14, 1–43. doi:10.4207/PA.2017.ART104
Chevalier, M., and Chase, B. M. (2016). Determining the Drivers of Long-Term Aridity Variability: a Southern African Case Study. J. Quat. Sci. 31, 143–151. doi:10.1002/jps.2850
Christensen, P.R., Bandfield, J.L., Bell, J.F., Gorelick, N., Hamilton, V.E., Ivanov, A., et al. (2003). Morphology and composition of the surface of Mars: Mars Odyssey THEMIS results. Science 330(5628), 2056–2061. doi:10.1126/science.1080885
Clark, J., Beyene, Y., WoldeGabriel, G., Hart, W. K., Renne, P. R., Gilbert, H., et al. (2003). Stratigraphic, Chronological and Behavioural Contexts of Pleistocene Homo sapiens from Middle Awash, Ethiopia. Nature 423, 747–752. doi:10.1038/nature01670
Clark, R. N. (1999). “Chapter 1: Spectroscopy of Rocks and Minerals, and Principles of Spectroscopy,” in Manual of Remote Sensing, Volume 3, Remote Sensing for the Earth Sciences. Editor A.N. Rencz (New York: John Wiley & Sons), 3–58.
Cohen, A. S., Campisano, C., Arrowsmith, R., Asrat, A., Behrensmeyer, A. K., Deino, A., et al. (2016). The Hominin Sites and Paleolakes Drilling Project: Inferring the Environmental Context of Human Evolution from Eastern African Rift Lake Deposits. Scientific Drilling 21, 1–16. doi:10.5194/sd-21-1-2016
Davidson, A. (1983). The Omo River Project: Reconnaissance Geology and Geochemistry of Parts of Ilubabor, Kefa, Gemu Gofa and Sidamo. Ethiopian Inst. Geol. Surv. Bull. 2, 1–89.
Davies, S. J., Lamb, H. F., and Roberts, S. J. (2015). “Micro-XRF Core Scanning in Palaeolimnology: Recent Developments,” in MicroXRF Studies of Sediment Cores, in Developments In Paleoenvironmental Research 17. Editors I. W. Croudace, and R. G. Rothwell (New York: John Wiley & Sons). doi:10.1007/978-94-017-9849-5_7
Deocampo, D. M., and Tactikos, J. C. (2010). Geochemical Gradients and Artifact Mass Densities on the Lowermost Bed II Eastern lake Margin (∼1.8 Ma), Olduvai Gorge, Tanzania. Quat. Res. 74, 411–423. doi:10.1016/j.yqres.2010.09.004
Deocampo, D. M., Cuadros, J., Wing-Dudek, T., Olives, J., and Amouric, M. (2009). Saline lake Diagenesis as Revealed by Coupled Mineralogy and Geochemistry of Multiple Ultrafine clay Phases: Pliocene Olduvai Gorge. Am. J. Sci. 309, 834–868. doi:10.2475/09.2009.03
Ehlmann Mc, B. L., Bish, D. L., Ruff, S. W., and Mustard, J. F. (2012). Mineralogy and Chemistry of Altered Icelandic Basalts: Application to clay mineral Detection and Understanding Aqueous Environments on Mars. J. Geophys. Res. 117 (E11), E00J16. doi:10.1029/2012JE004156
Farmer, V., and Russel, J. (1964). The Mid-infrared Spectra of Layer Silicates. Spectrochim. Acta 20, 1149–1173. doi:10.1016/0371-1951(64)80165-x
Fischer, M. L., Markowska, M., Bachofer, F., Foerster, V., Asrat, A., Zielhofer, C., et al. (2020). Determining the Pace and Magnitude of Lake Level Changes in Southern Ethiopia over the Last 20,000 Years Using Lake Balance Modeling and SEBAL. Front. Earth Sci. 8, 197. doi:10.3389/feart.2020.00197
Foerster, V., Junginger, A., Langkamp, O., Gebru, T., Asrat, A., Umer, M., et al. (2012). Climatic Change Recorded in the Sediments of the Chew Bahir Basin, Southern Ethiopia, during the Last 45,000 Years. Quat. Int. 274, 25–37. doi:10.1016/j.quaint.2012.06.028
Foerster, V., Vogelsang, R., Junginger, A., Asrat, A., Lamb, H. F., Schaebitz, F., et al. (2015). Environmental Change and Human Occupation of Southern Ethiopia and Northern Kenya during the Last 20,000 Years. Quat. Sci. Rev. 129, 333–340. doi:10.1016/j.quascirev.2015.10.026
Foerster, V., Deocampo, D. M., Asrat, A., Günter, C., Junginger, A., Kraemer, H., et al. (2018). Towards an Understanding of Climate Proxy Formation in the Chew Bahir Basin, Southern Ethiopian Rift. Palaeogeogr. Palaeoclimatol. Palaeoecol. 501, 111–123. doi:10.1016/j.palaeo.2018.04.009
Gaffey, S. J., McFadden, L. A., Nash, D., and Pieters, C. M. (1993). “Ultraviolet, Visible, and Near-Infrared Reflectance Spectroscopy: Laboratory Spectra of Geologic Materials,” in Remote Geochemical Analysis: Elemental and Mineralogical Composition 4. Editors C. M. Pieters, and P. A. J. Englert (Cambridge University Press), 43–77.
Grim, R. E. (1968). Clay Mineralogy. International Series in the Earth and Planetary Sciences, 2. New York: McGraw-Hill.
Grosjean, M., Amann, B., Butz, C., Rein, B., and Tylmann, W. (2014). Hyperspectral Imaging: a Novel, Nondestructive Method for Investigating Sub-annual Sediment Structures and Composition. Past Glob. Changes Mag. 22 (1), 1–11. doi:10.22498/pages.22.1.10
Hailemeskel, A., and Fekadu, H. (2004). Geological Map of Yabello. Addis Ababa: Geological Survey of Ethiopia.
Hassen, N., Yemane, T., and Genzebu, W. (1997). Geology of the Agere Maryam Area. Addis Ababa: Geological Survey of Ethiopia.
Hay, R. L., and Kyser, T. K. (2001). Chemical Sedimentology and Paleoenvironmental History of Lake Olduvai, a Pliocene lake in Northern Tanzania. GSA Bull. 113, 1505–1521. doi:10.1130/0016-7606(2001)113<1505:csapho>2.0.co;2
Huntley, B. (2012). Reconstructing Palaeoclimates from Biological Proxies: Some Often Overlooked Sources of Uncertainty. Quat. Sci. Rev. 31, 1–16. doi:10.1016/j.quascirev.2011.11.006
Key, R. M. (1987). Geology of the Sabarei Area: Degree Sheets 3 and 4, with Coloured 1:250 000 Geological Map and Results of Geochemical Exploration (Report). Nairobi, Kenya: Ministry of Environment and Natural Resources, Mines and Geology Dept.
Körting, F., Rogass, C., Kaempf, H., Lubitz, C., Harms, U., Schudack, M., et al. (2015). Drill core mineral analysis by means of the hyperspectral imaging spectrometer HySpex, XRD and ASD in proximity of the Mytina MaarR, Czech Republic. The International Archives of the Photogrammetry, Remote Sensing and Spatial Information Sciences 21, 417–424. doi:10.5194/isprsarchives-XL-1-W5-417–2015
Locsey, K. L., Grigorescu, M., and Cox, M. E. (2012). Water-rock Interactions: an Investigation of Relationships between Mineralogy and Groundwater Composition and Flow in a Subtropical basalt Aquifer. Aquat. Geochem. 18, 45–75. doi:10.1007/s10498-011-9148-x
Mann, M. E. (2002). The Value of Multiple Proxies. Science 297, 1481–1482. doi:10.1126/science.10743110.1126/science.1074318
Maturilli, A., Helbert, J., D’Amore, M., Varatharajan, I., and Rosas Ortiz, Y. (2018). “The Planetary Spectroscopy Laboratory (PSL): Wide Spectral Range, Wider Sample Temperature Range, SPIE,” in Infrared Remote Sensing and Instrumentation XXVI, San Diego, USA, 19 – 23 August 2018. doi:10.1117/12.2319944
Moore, D. M., and Reynolds, R. C. (1997). X-Ray Diffraction and the Identification and Analysis of Clay Minerals. 2nd ed, XVII. Oxford, New York: Oxford University Press, 378.
Mounier, A., and Lahr, R. (2019). M.M. Deciphering African Late Middle Pleistocene Hominin Diversity and the Origin of Our Species. Nat. Commun. 10, 34061–34113. doi:10.1038/s41467-019-11213-w
Navarre-Stichler, A., and Brantley, S. (2007). Basalt Weathering across Scales. Earth Planet. Sci. Lett. 261, 321–334. doi:10.1016/j.epsl.2007.07.010
Navarre-Stichler, A., Steefel, C., Yang, L., and Brantley, S. (2009). Evolution of Porosity Diffusivity during Chemical Weathering of basalt Clast. J. Geophys. Res. Earth 114, F02016. doi:10.1029/2008JF001060
Nicholson, S. E. (2017). Climate and Climatic Variability of Rainfall over Eastern Africa. Rev. Geophys. 55 (3), 590–663. doi:10.1002/2016RG000544
Nicholson, S. E. (2018). The ITCZ and the Seasonal Cycle over Equatorial Africa. Bull. Am. Meteorol. Soc. 99, 337–348. doi:10.1175/BAMS-D-16-0287.1
Owen, R. B., Muiruri, V. M., Lowenstein, T. K., Renaut, R. W., Rabideaux, N., Luo, S., et al. (2018). Progressive Aridification in East Africa over the Last Half Million Years and Implications for Human Evolution. Proc. Natl. Acad. Sci. 115, 11174–1117. doi:10.1073/pnas.1801357115
Owen, R. B., Renaut, R. W., Muiruri, V. M., Rabideaux, N. M., Lowenstein, T. K., McNulty, E. P., et al. (2019). Quaternary History of the Lake Magadi Basin, Southern Kenya Rift_ Tectonic and Climatic Controls. Palaeogeogr. Palaeoclimatol. Palaeoecol. 518, 97–118. doi:10.1016/j.palaeo.2019.01.017
Pawar, N. J., Pawar, J. B., Kumar, S., and Supekar, A. (2008). Geochemical Eccentricity of Ground Water Allied to Weathering Basalts from the Deccan Volcanic Province, India: Insinuation on CO2 Consumption. Aquat. Geochem. 14, 41–71. doi:10.1007/s10498-007-9025-9
Pik, R., Marty, B., Carignan, J., Yirgu, G., and Ayalew, T. (2008). Timing of East African Rift Development in Southern Ethiopia: Implication for Mantle Plume Activity and Evolution of Topography. Geology 36, 167–170. doi:10.1130/G24233A.1
Potts, R., Behrensmeyer, A. K., Faith, J. T., and Tryon, C. A. (2018). Environmental Dynamics during the Onset of the Middle Stone Age in Eastern Africa. Science 360 6384, 86–90. doi:10.1126/science.aao2200
Renaut, R. W. (1993). Zeolitic Diagenesis of Late Quaternary Fluviolacustrine Sediments and Associated Calcrete Formation in Lake Bogoria Basin, Kenya Rift Valley. Sedimentology 40, 271–301. doi:10.1111/j.1365-3091.1993.tb01764.x
Roberts, P., and Stewart, B. A. (2018). Defining the “Generalist Specialist” Niche for Pleistocene Homo sapiens. Nat. Hum. Behav. 2, 542–550. doi:10.1038/s41562-018-0394-4
Roberts, H.M., Bronk Ramsey, C., Chapot, M.S., Deino, A., Lane, C.S., Vidal, C., et al. (2021). Using multiple chronometers to establish a long, directly-dated lacustrine record: constraining >600,000 years of environmental change at Chew Bahir, Ethiopia. Quater. Sci. Rev., submitted.
Sak, P. B., Navarre-Stichler, A. K., Miller, C. E., Daniel, C. C., Geillardt, J., Buss, H. L., et al. (2010). Controls on Rind Thickness on Basaltic Andesite Clasts Weathering in Guadeloupe. Chem. Geol. 276, 129–143. doi:10.1016/j.chemgeo.2010.05.002
Salisbury, J. W. (1993). “Mid-infrared Spectroscopy: Laboratory Data,”. Remote Geochemical Analysis: Elemental and Mineralogical Composition 4. Editors C.M. Pieters, and P.A.J. Englert (Cambridge University Press), 79–98.
Schlolaut, G., Staff, R. A., Brauer, A., Lamb, H. F., Marshall, M. H., Bronk Ramsey, C., et al. (2018). An Extended and Revised Lake Suigetsu Varve Chronology from ∼50 to ∼10 Ka BP Based on Detailed Sediment Micro-facies Analyses. Quat. Sci. Rev. 200, 351–366. doi:10.1016/j.quascirev.2018.09.021
Singer, R. B. (1982). Spectral Evidence for the Mineralogy of High-Albedo Soils and Dust on Mars. J. Geophys. Res. 87 (B12)), 10159. doi:10.1029/jb087ib12p10159
Stewart, M., Louys, J., Price, G. J., Drake, N. A., Groucutt, H. S., and Petraglia, M. D. (2019). Middle and Late Pleistocene Mammal Fossils of Arabia and Surrounding Regions: Implications for Biogeography and Hominin Dispersals. Quat. Int. 515, 12–29. doi:10.1016/j.quaint.2017.11.052
Stringer, C., and Galway-Witham, J. (2017). On the Origin of Our Species. Nature 546, 212–214. doi:10.1038/546212a
Stringer, C. (2016). The Origin and Evolution of Homo sapiens. Phil. Trans. R. Soc. B 371, 20150237. doi:10.1098/rstb.2015.0237
Trauth, M. H., Bergner, A. G. N., Foerster, V., Junginger, A., Maslin, M. A., and Schaebitz, F. (2015). Episodes of Environmental Stability and Instability in Late Cenozoic Lake Records of Eastern Africa. J. Hum. Evol. 87, 21–31. doi:10.1016/j.jhevol.2015.03.011
Trauth, M. H., Foerster, V., Junginger, A., Asrat, A., Lamb, H. F., and Schaebitz, F. (2018). Abrupt or Gradual? Change Point Analysis of the Late Pleistocene-Holocene Climate Record from Chew Bahir, Southern Ethiopia. Quat. Res. 90 (2), 321–330. doi:10.1017/qua.2018.30
Trauth, M. H., Asrat, A., Duesing, W., Foerster, V., Kraemer, K. H., Marwan, N., et al. (2019). Classifying Past Climate Change in the Chew Bahir Basin, Southern Ethiopia, Using Recurrence Quantification Analysis. Clim. Dyn. 53 (5-6), 2557–2572. doi:10.1007/s00382-019-04641-3
Trauth, M. H., Asrat, A., Cohen, A. S., Duesing, W., Foerster, V., Kaboth-Bahr, S., et al. (2020). Recurring Types of Variability and Transitions in the ∼620 Kyr Record of Climate Change from the Chew Bahir basin, Southern Ethiopia. Quat. Sci. Rev. 11, 121. doi:10.1016/j.quascirev.2020.106777
Vebel, M. A., and Losiak, A. I. (2008). Influence of Surface-Area Estimation on Rates of Plagioclase Weathering Determined from Naturally Weathered 3400 Y Old Hawaiian basalt. Mineral. Mag. 72, 91–94. doi:10.1180/minmag.2008.072.1.91
Viehberg, F. A., Just, J., Dean, J. R., Wagner, B., Franz, S. O., Klasen, N., et al. (2018). Environmental Change during MIS4 and MIS 3 Opened Corridors in the Horn of Africa for Homo sapiens Expansion. Quat. Sci. Rev. 202, 139–153. doi:10.1016/j.quascirev.2018.09.008
Viste, E., and Sorteberg, A. (2013). The Effect of Moisture Transport Variability on Ethiopian Summer Precipitation. Int. J. climatology 33 (15), 3106–3123. doi:10.1002/joc.3566
Keywords: Ethiopian Rift, Chew Bahir Basin, sediment cores, paloclimate, VIS/IR spectroscopy
Citation: Arnold GE, Foerster V, Trauth MH, Lamb H, Schaebitz F, Asrat A, Szczech C and Günter C (2021) Advanced Hyperspectral Analysis of Sediment Core Samples from the Chew Bahir Basin, Ethiopian Rift, in the Spectral Range from 0.25 to 17 µm: Support for Climate Proxy Interpretation. Front. Earth Sci. 9:606588. doi: 10.3389/feart.2021.606588
Received: 15 September 2020; Accepted: 07 June 2021;
Published: 23 June 2021.
Edited by:
Matthias Prange, University of Bremen, GermanyReviewed by:
Christopher Scholz, Syracuse University, United StatesCopyright © 2021 Arnold, Foerster, Trauth, Lamb, Schaebitz, Asrat, Szczech and Günter. This is an open-access article distributed under the terms of the Creative Commons Attribution License (CC BY). The use, distribution or reproduction in other forums is permitted, provided the original author(s) and the copyright owner(s) are credited and that the original publication in this journal is cited, in accordance with accepted academic practice. No use, distribution or reproduction is permitted which does not comply with these terms.
*Correspondence: Gabriele E. Arnold, Z2FicmllbGUuYXJub2xkQGRsci5kZQ==
Disclaimer: All claims expressed in this article are solely those of the authors and do not necessarily represent those of their affiliated organizations, or those of the publisher, the editors and the reviewers. Any product that may be evaluated in this article or claim that may be made by its manufacturer is not guaranteed or endorsed by the publisher.
Research integrity at Frontiers
Learn more about the work of our research integrity team to safeguard the quality of each article we publish.