
94% of researchers rate our articles as excellent or good
Learn more about the work of our research integrity team to safeguard the quality of each article we publish.
Find out more
ORIGINAL RESEARCH article
Front. Earth Sci., 10 February 2021
Sec. Solid Earth Geophysics
Volume 9 - 2021 | https://doi.org/10.3389/feart.2021.601138
This article is part of the Research TopicFrontiers in Seafloor GeodesyView all 21 articles
 Horng-Yue Chen1
 Ryoya Ikuta2*
 Ya-Ju Hsu1
 Toshiaki Tsujii3
 Masataka Ando2
 Yoko Tu1Takeru Kohmi2Kiyomichi Takemoto2Koto Mizuno2Hsin Tung1
 Chin-Shang Ku1Cheng-Horng Lin1
Long-term seafloor geodetic measurements are important for constraining submarine crustal deformation near plate boundaries. Here we present an integrated analysis of a decade of GNSS/acoustic data collected at a site 60 km to the east of northeast Taiwan near the axis of the Okinawa Trough back-arc basin. We obtained a time-series of horizontal and vertical positions based on 18 measurements from 2009 to 2019. These data reveal a southeastward movement at a rate of 43 ± 5 mm/yr since 2012 with respect to the Yangtze Plate. The horizontal motion can be explained by the clockwise rotation of the Yonaguni Block and northern Central Range. In addition, the vertical displacement of the transponder array shows rapid subsidence of 22 ± 9 mm/yr from 2012 to 2019. The fast subsidence rate and negative free-air gravity anomaly in this region indicate that crustal thinning is compensated mainly by surface deformation rather than upward migration of the Moho. Taking into account the offset in 2012 owing to the replacement of the transponder array, the horizontal position time series of our site are best explained by two linear lines with a slope change in July 2013. The timing of the velocity change coincides broadly with a change in the nearby seismicity rate and dike intrusion 150 km away from the site. Our results highlight the potential of seafloor geodesy in assessing temporal changes in deformation near the spreading center of the Okinawa Trough, which cannot be one using data from onland GNSS stations.
The Okinawa Trough is an active back-arc basin (Sibuet et al., 1987). The axis of the basin has its southwestern end in the Yilan Plain of Taiwan and extends to the Beppu–Shimabara rift zone in Japan. The spreading rate is fastest (60 mm/yr) around the Yaeyama rift in the southwestern Okinawa Trough (Nishimura et al., 2004; Figure 1). Episodic opening of the rift has been reported around the Yaeyama rift. For example, dike intrusion was detected north of Yonaguni Island in 2002 (Nakamura and Kinjo, 2018), beneath the Yilan Plain in 2005 (Lai et al., 2009), and north of Iriomote Island in 2013 (Ando et al., 2015). In contrast to the episodic rifting, onland Global Navigation Satellite System (GNSS) measurements of the Ryukyu Arc (Lallemand and Liu, 1998; Nishimura et al., 2004) have shown an almost constant southward velocity. To investigate episodic opening of the Okinawa Trough, Chen et al. (2018) conducted GNSS/acoustic seafloor geodetic measurements immediately south of the spreading center for four years from 2012 to 2016, and suggested episodic opening of the rift valley occurred between the most active site of rifting and the Yilan Plain.
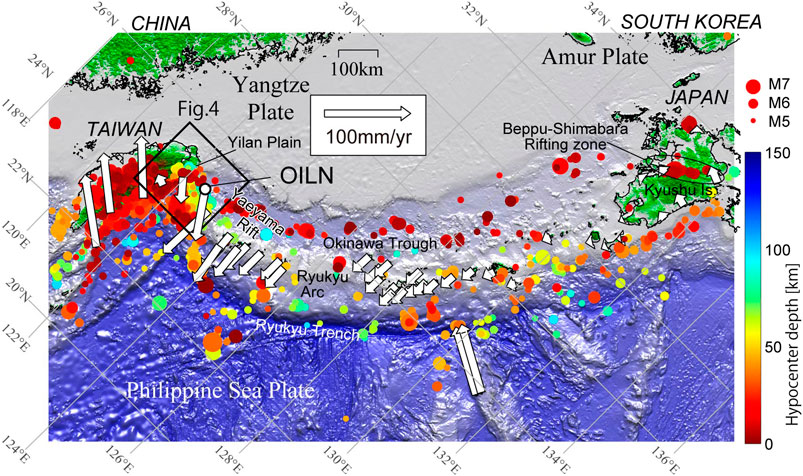
FIGURE 1. Tectonic setting of the Okinawa Trough. GNSS velocity vectors relative to the Yangtze Plate during January 2009 to January 2016 are shown as white arrows. The Euler vector between ITRF2005 and the Yangtze Plate is from DeMets et al. (2010). Hypocenters of earthquakes larger than M5 in the same period are shown as solid circles and are color-coded according to depth. Earthquake source parameters were determined by the Japan Meteorological Agency (JMA) and Central Weather Bureau (CWB). The black box encloses the study area of Figure 4. The location of the OILN site is shown as a white circle. The velocity at the OILN site was estimated from the data acquired over a 4-years period in Chen et al. (2018). The vectors of the on-land GNSS stations were calculated from the daily time series by linear fitting after removing offsets caused by large earthquakes, antenna maintenances, and offsets over 30 mm even if the cause is not clear.
In this study, we analyzed data obtained using the seafloor benchmark unit installed by Chen et al. (2018) for three additional years (i.e., 2016–2019). In addition, we retrieved data from 2012 and earlier years that were discarded previously because of the replacement of transponders due to battery exhaustion, making it impossible to compare these data with later transponder data. Using these data acquired over the past decade, we determined the vertical and horizontal motions at this site and the associated uncertainties.
We carried out 18 series of GNSS/acoustic geodetic measurements using a fishing boat or buoys (Figures 2A–C) from 2009 to 2019 at the seafloor site OILN (Figure 1), which includes the 8 series of measurements reported in Chen et al. (2018). We used the drifting measurement strategy proposed by Ikuta et al. (2008), in which the vessel drifts with the sea current and wind for hours with the boat engine shut down during the transmission and reception of acoustic signals. We repeated the drifting measurement with different initial vessel locations until the coverage was sufficient. The observation period for each campaign varied from 11 to 62 h, depending on the weather and sea conditions.
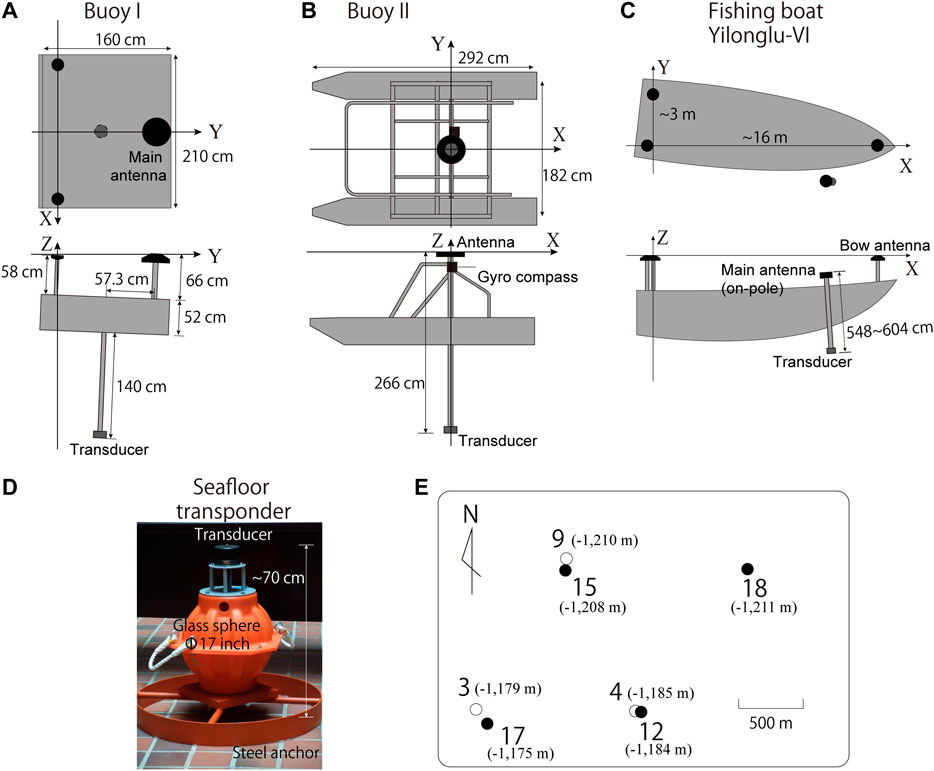
FIGURE 2. Onboard configuration and seafloor transponders. (A) Schematic illustration of the onboard configuration of Buoy I used in the June 2010 measurement. The onboard XYZ coordinates were defined by the GNSS antenna triplet. All antenna phase centers are on the XY plane. (B) Buoy II used in the April and July 2012 measurements. The onboard XYZ coordinates were defined by the gyrocompass. (C) The fishing boat Yilonglu-VI. The onboard coordinates were defined by the GNSS antenna triplet. (D) A seafloor transponder installed at the OILN site. (E) Relative location of the seafloor transponders. The inactive and active transponders are shown as open and solid circles, respectively. The values in parentheses are the ellipsoidal heights of the transponders.
The OILN site comprises a triplet or quartet of mirror-response transponders that were installed at a depth of about 1300 m. The site was first built in October 2008 with a triplet of transponders equipped with short-lived batteries (Units 3, 4, and 9 in Table 1 and Figure 2E). In 2010, we deployed an additional transponder (Unit 12). Three more transponders were installed in 2012 (Units 15, 17, and 18) to replace the transponder triplet installed in 2008, as their batteries were exhausted between 2010 and 2012. Only Unit 12 was in operation before July 2012. The number of available seafloor transponders was three and four prior to and after 2012, respectively. The detailed history of the transponder replacement is listed in Table 1.
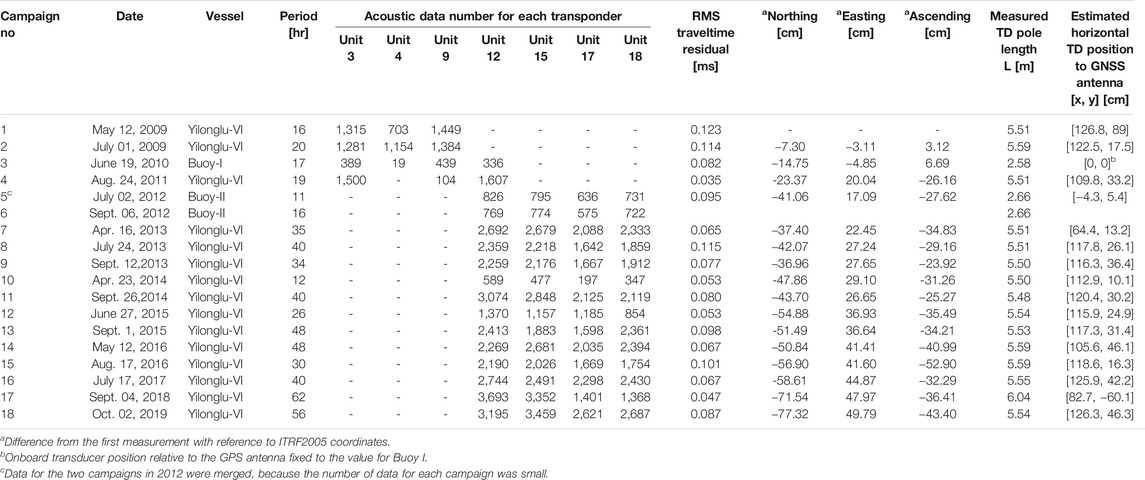
TABLE 1. Details of the transponders used in this study.
For 15 of the 18 field campaigns, measurements were conducted using the fishing boat Yilonglu-VI, whereas the other 3 campaigns were carried out using two towed buoys (Table 1; Figure 2). Each vessel was equipped with a transducer, a GNSS antenna for determining the position of the transducer, and a GNSS antenna triplet (the boat and buoy I) or a gyrocompass (buoy II) for determining the attitude of the vessel (Figure 2). The positions of the seafloor transponders were measured by acoustic ranging from the onboard transducer, whose position was determined by combining the GNSS antenna position and attitude of the vessel. We solved the kinematic 3D position of the GNSS antenna every 0.2 s using GrafNav Ver.8.60. Two onshore GNSS stations, SCHN and S101, located 110 km SW and 90 km W of the OILN site, respectively, were used as fiducial sites to solve the kinematic GNSS antenna position. Given the signal condition of the GNSS antenna on the top of the transducer pole was sometimes not optimal, owing to obstruction by onboard structures above the antenna, on several campaigns Chen et al. (2018) used a GNSS antenna at the bow of the vessel as the main antenna instead of the on-pole antenna (Figure 2C). In this study, we improved the kinematic positioning of the on-pole antenna by using the bow antenna as a nearby moving fiducial site. This very short baseline analysis improved the yield of kinematic solutions significantly and allowed the on-pole antenna to always be used as a reference to calculate the onboard transducer position. The length between the antenna and transducer was determined with an accuracy of 1 cm. As a result, the repeatability of the estimated vertical position was improved relative to the result of Chen et al. (2018).
According to Chen et al. (2018), the error propagation from the unbiased observation error to the benchmark location is approximately
We solved the position of the seafloor transponders using a tomographic technique based on Chen et al. (2018). The position of the seafloor transponders, as well as the sound speed variation and onboard configuration, were solved using the penalized least squares method. We used the following equation:
where Ti is the ith acoustic travel-time (ms) obtained at time ti (s), f (r0,ri, a (ti)) is the travel-time predicted by ray tracing from the position of the seafloor transponders r0j in the jth campaign and the onboard transducer ri, a(t) is the temporal varying coefficient (no units) of the speed of sound in seawater represented by superposition of cubic B-spline functions (Barnhill and Riesenfeld, 1974), and μj is the hyper parameter that balances the smoothness of a(t) with the travel-time residual. We selected the best hyper parameter for each campaign using the Akaike’s Bayesian information criterion (ABIC), based on Chen et al. (2018). The resulting hyper parameters range from 104.00 to 104.16, although the values of Chen et al. (2018) ranged from 103.67 to 104.00. Hyper parameter dependence of the seafloor benchmark position solutions is evaluated in Appendix. The total number of campaigns in this study was 17, because two measurements conducted in 2012 were merged into one campaign because of the limited amount of data.
To solve Eq. 1, we used two realistic assumptions. Firstly, in estimating r0, we assumed that all the transponders were fixed on a rigid body that does not rotate, and moved from campaign to campaign in the same geometric configuration. This rigid body assumption allows us to estimate the motion of the rigid body between campaigns, even if some of the transponders are different, provided there was at least one common transponder in each campaign. Secondly, the temporal variation of the speed of sound was assumed to be controlled by a horizontal layered structure:
where z is the depth and V0(z) is the speed of sound obtained by the CTD measurements.
The configuration between the onboard GNSS antenna and transducer was not measured accurately, but was solved from the acoustic ranging because it was difficult to keep the same instrument configuration on the fiberglass fishing boat between the different campaigns. Although the acoustic ranging has an approximately linear trade-off between the vertical component of the seafloor transponder and the vertical position of the onboard transducer relative to the GNSS antenna, the horizontal onboard configuration of the transducer can be estimated robustly by the acoustic ranging. Given that the onboard GNSS antenna is on top of the transducer pole, we measured the length of the pole L with an accuracy of <1 cm. When the horizontal distance of the transducer from the GNSS antenna is solved as h0, the vertical distance is
Figure 3 shows a time-series of the 3D position of the OILN site relative to the Yangtze Plate from 2009 to 2019. The horizontal components show a southeastward motion, but there is a discontinuity between the initial four and the latter campaigns. The campaigns prior to and post-2012 have only one common transponder (Unit 12). Furthermore, the amount of data from the third and fourth campaigns (June 2010 and August 2011), which were measured using the common transponder (Unit 12) before 2012, is limited (Table 1). For this reason, we first focused on the post-2012 results without considering the pre-2012 data. In addition, we discarded the positions from the two campaigns conducted in 2010 and April 2014, due to the limited acoustic data (<3,000), as compared with the other campaigns (average = 7,597).
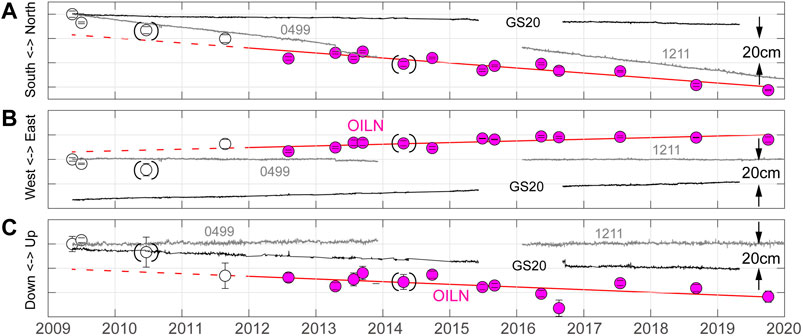
FIGURE 3. Three-dimensional time-series of the position of the OILN site relative to the Yangtze Plate. (A) N–S component. The error bars for individual campaigns were defined by Chen et al. (2018). Thin black and gray lines show the positions of the GNSS sites on Gueishang (GS20) and Yonaguni (0499, 1211) islands, respectively. Station 1211 on Yonaguni Island was built ∼800 m from site 0499 in March 2014, and its absolute position on the diagram is not meaningful. Open and solid purple circles show the campaigns before and after transponder replacement, respectively. Circles with brackets show the positions estimated from acoustic data with <3000 shots. (B) E–W component. (C) Up–down component.
The average rate of movement since 2012 is 41.2 ± 4.8 and 13.5 ± 3.7 mm/yr in the southward and eastward direction, respectively (Figures 3A,B). This result is considerably different from the average velocities of 50.3 ± 11.2 and 34.8 ± 7.2 mm/yr in the southward and eastward directions, respectively, obtained by Chen et al. (2018) from measurements over 4 years (2012–2016). This discrepancy is significant, even taking into account the 1σ error, and may reflect a temporal change in the motion (Temporal Variation in Horizontal Motion). The position of the benchmark for each campaign also differs in the present and previous studies. The vertical positions reveal there has been 22.0 ± 8.9 mm/yr of subsidence over 7 years (Figure 3C). The scatter of data from the individual campaigns from a linear trend is 33 and 59 mm, which is expressed as the root-mean-square (rms) deviation of the horizontal and vertical components, respectively.
The horizontal velocity of the OILN site from 2012 to 2019 has an accuracy of <5 mm/yr, and the positions of the individual campaigns have a scatter of 35.6 and 27.6 mm (rms deviations from the linear trends of the N–S and E–W components, respectively). This error is comparable with the value of 20–30 mm obtained by the Japan Coast Guard (JCG) group (e.g., Yokota et al., 2016). Although the errors result from a combination of numerous factors, our observations appear to have some limitations compared with those of the JCG group. One involves the uncertainty on the position of the acoustic transducer relative to the GNSS antenna, which changed slightly from campaign to campaign. The fishing boat used in this study is made of fiberglass and, as such, rigging is not possible. This caused difficulties in setting the sensor jigs at the same positions with centimeter accuracy. As a result, the configuration between the onboard GNSS antenna and transducer also needed to be solved from the acoustic ranging. This led to an increase in the number of unknown parameters, which resulted in a reduction of the accuracy of the transponder array positioning. A further disadvantage of our data is the uneven ship track coverage over the transponder array. Due to the noise from the engine and crew, we had to cease boat operations and allow the boat to drift during the acoustic measurements. Sato et al. (2013) developed a hull-mounted onboard system, in which the transducer is installed on the bottom of the vessel, and this enables the vessel to sail along predetermined track lines. This improved the positioning repeatability and decreased the observation time for a single site from 2 to 4 days to 16–24 h (Ishikawa et al., 2020). Although our method had some disadvantages compared with that of the JCG group, we compensated for these disadvantages with long observation periods.
Although the transponder array motion appears to have some temporal variations in both the horizontal and vertical components (Figure 3), we first consider the average motion (i.e., linear fitting without offsets) during 2012–2019. As proposed by Chen et al. (2018), if we assume the rigid Yonaguni Block is the western end of the Ryukyu arc, the Euler pole calculated from the 0499 (Yonaguni Island) and OILN sites is located off the eastern coast of Taiwan (Figure 4). The velocity predicted from the rotation of the Yonaguni Block at onland GNSS sites in the northern part of the Central Range is consistent with the observed GNSS velocities within ±15 mm/yr (Figure 4B). This suggests that clockwise rotation of the Ryukyu arc is the main driving mechanism for deformation of the Yilan Plain, which is consistent with evidence from earthquake focal mechanisms (e.g., Huang et al., 2012). Most of the earthquakes shallower than 25 km beneath the Yilan Plain and the Okinawa Trough show normal faulting mechanisms (Figure 4B). In addition, the GNSS velocities in northern Taiwan (Figure 4A), with respect to the stable Yangtze Plate, also exhibit a small eastward velocity of up to 10 mm/yr, associated with the clockwise rotation of the Yonaguni Block (Figure 4C). The velocity generally increases toward the trough axis. This E–W extension suggests that this area is also affected by back arc spreading. Schellart and Moresi (2013) used a 3D lithospheric deformation and mantle flow simulation to show that slab-rollback-induced toroidal and poloidal mantle flows are responsible for back-arc spreading. The overriding plate is extended by the basal shear of the asthenosphere, which flows into the space vacated by the rollback of the sinking slab. The E–W extension off the northern coast of Taiwan behind the spreading center may reflect the mantle flow beneath this region (Figure 4D), which has been predicted from a numerical mantle flow simulation based on the specific slab geometry (Lin and Kuo, 2016).
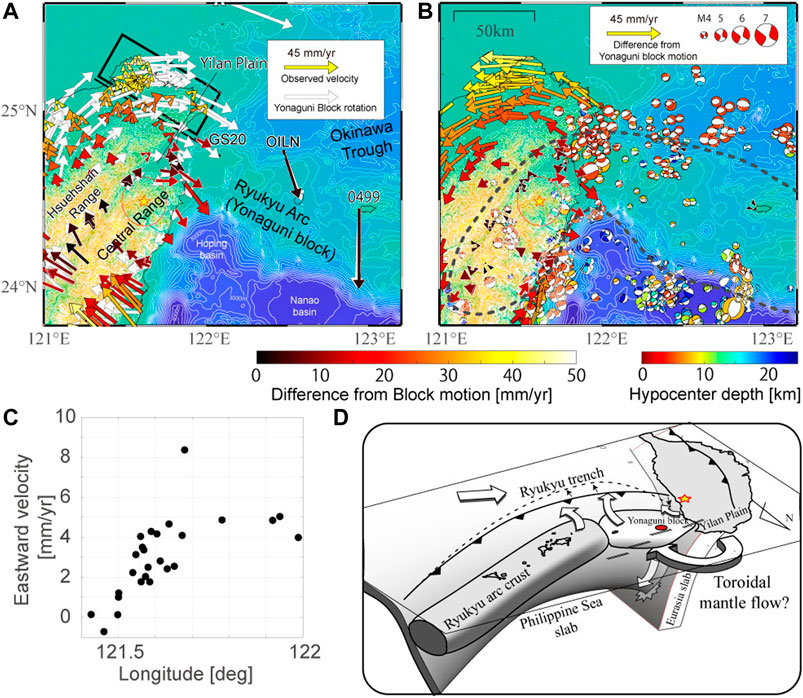
FIGURE 4. (A) Observed horizontal velocities with reference to the stable Yangtze Plate. Colored vectors represent observed velocities and white vectors show the predicted rotation of the Yonaguni Block estimated from the OILN and onland 0499 sites. The vectors on Taiwan were calculated from daily coordinates for variable periods from 1 to 15 years. The 95% confidence interval for the OILN horizontal velocity are shown as the black ellipse, while the errors for the onland sites are not visible at this same scale. The yellow star marks the estimated Euler pole of the Yonaguni Block, with the 95% confidence interval shown as a red ellipse. The black rectangle shows the area of the GNSS stations shown in (C). (B) Residual observed velocity vectors with reference to the motion of the Yonaguni Block. The dashed line is the 15 mm/yr contour. Beach balls show the centroid moment tensor (CMT) solutions for earthquakes between March 1999 and May 2020 with depths of <25 km. The CMT solutions were provided by F-net, National Research Institute for Earth Science and Disaster Prevention (NIED). (C) Eastward velocity of the onland GNSS stations in the rectangular area outlined in (A). (D) Schematic illustration of the tectonics around northeastern Taiwan taken from Chen et al. (2018), but also showing toroidal mantle flow.
Chen et al. (2018) did not discuss the vertical motion of the OILN site because of its large uncertainty. However, we estimated the vertical motion more accurately, with the improved onboard configuration of the main GNSS antenna on top of the transducer pole. The total subsidence during 2012–2019 was ∼150 mm (Figure 3C). The average subsidence rate was 22.0 ± 8.9 mm/yr.
One possible interpretation of the high subsidence rate of the OILN site is sinking of the seafloor transponders into thick sediments. Taking into account that the transponder is ∼70 cm high and comprises a glass sphere that is 43 cm in diameter (Figure 2D), the transponders should have sunk fastest just after installation. However, after the installation of the new transducers in 2012, there was no acceleration in the subsidence. Another possibility for the high subsidence rate is a submarine landslide. The slope of the seafloor around this site is 1.5° to the north. When a landslide occurs, we would expect a large horizontal northward displacement compared with the subsidence. However, no such northward displacement was observed in the study period.
The other possibility is that subsidence is occurring due to crustal thinning at the margin of the back-arc basin, which is supported by the similar subsidence rate observed at the onland site on Gueishang Island (GS20; Figures 3C, 5A). In addition, onland sites in the Yilan Plain also show subsidence with rates of 5–10 mm/yr (Figure 5A). The subsidence rate of the OILN site is much faster than in active rift basins. For example, Steckler et al. (1988) showed from borehole profile data that the fastest tectonic subsidence rate in the central–southern Gulf of Suez was a few mm/yr in the late Burdigalian. This discrepancy may be explained by the unusual geological setting around the OILN site and Yilan Plain. The crust beneath the Okinawa Trough around the Yaeyama rift is continental, and the trough is in a transitional stage from continental rifting to seafloor spreading (Arai et al., 2017). If crustal thinning had a major role in the back-arc rifting around the OILN site, the thinning rate would be controlled by crustal thickness, spreading rate, and width of the trough. Assuming there is no change in the volume of the crust due to extension, the estimated thinning rate for a crustal thickness of 15–25 km (Arai et al., 2017) is 25–42 mm/yr, based on an average spreading rate of 50 mm/yr over a 30-km-wide trough. If isostasy is being attained, then thinning of the continental crust should be compensated by upward migration of the Moho discontinuity and seafloor subsidence. The ratio of the subsidence to thinning rate is governed by the density ratio between seawater, crust, and mantle according to the following equation:
where Δhc is the crustal thinning rate and Δd is the seafloor subsidence rate. ρw, ρc, and ρm are the densities of seawater, continental crust, and mantle, respectively. In this case, when typical density values of 1.0, 2.7, and 3.3 g/cm3 are adopted for ρw, ρc, and ρm, the expected subsidence rate Δd is 6.5–11.0 mm/yr for an estimated thinning rate Δhc of 25–42 mm/yr.

FIGURE 5. Vertical motion of northern Taiwan. (A) Observed vertical velocity at onland GNSS sites and the OILN seafloor site. Solid and open circles show subsidence and uplift, respectively. The rectangle shows the area of (B). The colored depth contour intervals are 200 and 1000 m for the thin and thick lines, respectively. The vertical velocity at on-land GNSS stations were calculated from the daily time series in the same manner with Figures 1, 4, in which offsets by large earthquakes, antenna maintenances, and offsets over 100 mm even if the cause is not clear were removed before fitting. (B) Free-air gravity anomaly around the OILN site. The contour interval is 20 mgal. A large negative anomaly around the Hoping and Nanao forearc basins corresponds to flexure of the subducted Philippine Sea Plate. There is a narrow depression that extends from the Yilan Plain to the OILN site along the trough axis.
The observed subsidence rate of 22 mm/yr at the OILN site is higher than expected from isostasy. In fact, there is a narrow, negative, free-air gravity anomaly region that extends from the Yilan Plain to the OILN site along the trough axis (WGM2012 Earth Gravity Model; Bonvalot et al., 2012), which does not correlate with the bathymetry. This suggests that gravitational mantle flow cannot compensate for the rapid deformation within the narrow region around the western end of the rift axis. Given the small negative free-air gravity anomaly to the east of the OILN site in the Okinawa Trough, this rapid subsidence should be limited to this westernmost area in the initial stages of back-arc rifting.
We estimated an average velocity in Average Rate of Back-Arc Rifting, but Chen et al. (2018) reported that the transponder array position of the OILN site from 2012 to 2016 can be explained by intermittent motion, based on Akaike Information Criteria (AIC). We examined if intermittent rifting of the Okinawa Trough axis as occurred using a longer observation period from 2009 to 2019.
Chen et al. (2018) modeled the horizontal transponder array position from 2012 to 2016 with a linear fit and an offset in 2013. They suggested that the offset was associated with an acceleration of seismic activity around the OILN site in 2013. Figure 6A shows an enlargement of the horizontal transponder array motion from Figure 3, excluding the campaigns with limited acoustic data (<3,000 shots). When including the new campaigns since 2016, no offset is recognized between the sixth (July 2013) and seventh (September 2013) campaigns.
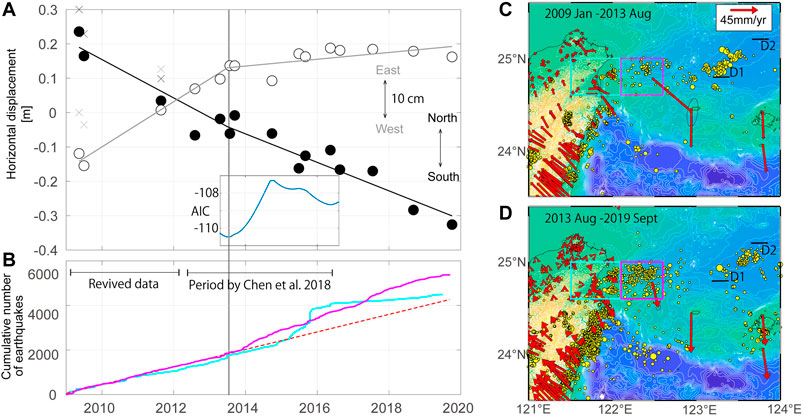
FIGURE 6. Time-series of the OILN site position relative to the stable part of the Yangtze Plate. (A) Same as Figures 3A,B. N–S (solid circles) and E–W (open circles) components. The coordinates for the data prior to 2012 were modified by Eq. 4. The original N–S and E–W coordinates are shown as black and gray crosses, respectively. Each time-series is fitted with linear lines with a break at July 2, 2013 (vertical line), which was determined by AIC. Data for the middle eight campaigns are from Chen et al. (2018), but were treated with our new procedure. (B) Cumulative seismicity (>M2.0) detected within the corresponding colored rectangles shown in (C,D). The red dashed line is a fit to the seismicity from January 2009 to July 2013. (C) Horizontal velocity vectors and seismicity (>M3.0) from Jan 1, 2009 to July 2, 2013. D1 and D2 show the location of dike intrusion modeled by Nakamura and Kinjo (2018), which occurred at the end of 2002 and in April 2013, respectively. (D) Horizontal velocity vectors and seismicity from July 3, 2013 to September 30, 2019.
However, the site appears to have moved at different rates before and after 2013. We estimated the time of the rate change and the offset due to transponder array replacement by least squares regression as the follows:
where x is the horizontal position vector at time t, V1 and V2 are the horizontal velocities before and after the bending time t0, respectively; and x0 and x1 are the intercepts before and after the transponder array replacement, respectively. The appropriate t0 value was determined based on AIC. Note that we did not include the vertical component in this regression because uncertainty of the vertical component is much larger compared to the horizontal components.
The best-fit result is shown in Figure 6A, and yielded a t0 of July 2, 2013. The minimum AIC value is −110.5. The offsets caused by the replacement of the transponder array are estimated as 5.6 and 12.7 cm for the south and west components, respectively. When fitting by a line instead of bending lines, the AIC value is −103.9. The relative likelihood of the linear fitting with respect to the bending-line fitting is calculated as exp{(103.9–110.5)/2} = 0.037. Consequently, it is plausible that the velocity of OILN changed in July 2013. The estimated t0 value based on the horizontal motion of the OILN site is consistent with the timing of the change in seismicity. The seismicity rate around the OILN site increased abruptly at the end of 2013 (Figure 6B), which was at the time of dike intrusion in the Yaeyama rift (D2 in Figure 6C) reported by Nakamura and Kinjo (2018). Nakamura and Kinjo (2018) analyzed onland GNSS coordinate data and seismicity around Iriomote Island and showed that the shear strain rate changed around the time of dike intrusion, which was also associated with a seismicity change in the forearc region of Iriomote Island. Our results show that these changes also coincided with the seismicity and crustal deformation changes 150 km away from the Yaeyama rift. However, the motion of the OILN site does not show an acceleration in rifting, but instead exhibits a deceleration of rotation associated with an increase of seismicity, which appears to be counterintuitive. One possible explanation for this is activation of a normal fault to the south of the OILN site, which separates the Okinawa Trough from the Ryukyu arc. Arai et al. (2017) described a high-angle normal fault that separates the trough from the arc ∼100 km east of the OILN site, which appears to continue to the south of the OILN site, based on the bathymetry. The increased seismicity may reflect not only the opening of the Okinawa Trough, but also normal faulting south of the OILN site.
Chadwell et al. (1999) conducted a 2-years-long acoustic ranging experiment over a distance of 1 km across the Juan de Fuca ridge axis, and found that the ridge axis was not rifting. Chadwell and Spiess (2008) subsequently studied the plate motion using GNSS/acoustic methods at a location 25 km away from the same ridge axis, and found a motion indicative of constant seafloor spreading. They suggested that the crust between 0.5–25 km from the ridge axis accommodates the transient deformation by normal faults on the ridge slope and elastic strain accumulation. Our site is located 10 km away from the trough axis, and also shows a transient velocity change. Although we did not observe intermittent rifting, the velocity changes almost perpendicular to the rifting direction. The timing of the near-axis velocity change coincides with a change in the strain rate (Nakamura and Kinjo, 2018) and the inter-plate slow slip event (SSE) occurrence rate (Tu and Heki, 2017). The unique location of the OILN site close to the rifting center allows changes in the deformation field to be detected over time, which is not possible with land-based stations.
Figure 7 shows the horizontal positions determined by Chen et al. (2018) superimposed on the result of the present study. There are significant differences of up to 10 cm in the N–S positions of campaigns conducted in 2012 and 2014. In 2012, the position accuracy of Chen et al. (2018) is degraded because of the limited acoustic data (<3,000). In this study, we merged the data from the campaigns in April 2012 and July 2012 that were previously discarded by Chen et al. (2018) due to lack of data, in order to increase the available data to 5,828. Despite the absence of such differences in the 2014 acoustic data, there are significant differences in the estimated benchmark position. The difference between the results of Chen et al. (2018) and this study for the 2014 campaign reflect the KGPS analysis. Chen et al. (2018) solved for the GNSS antenna position using Interferometric Translocation software (IT; Colombo, 1998), whereas we solved for the same antenna using the bow antenna as the fiducial site with GrafNav software (NovAtel Inc, 2014). As a result, the positions of the onboard transducer estimated in this study differ from those in Chen et al. (2018). On average, the positions determined in this study differ from Chen et al. (2018) by 0.7 ± 5.0 cm in a westward direction, 3.8 ± 3.3 cm in a northward direction (Figure 8A), and 15.6 ± 15.7 cm in a downward direction (Figure 8B). We compared the elevation with the theoretical sea level in order to evaluate which result is more reliable (Figures 8C,D). The results show that the elevations obtained in this study are more consistent with sea level than those of Chen et al. (2018). This trend is also evident in some other campaigns, but is especially large in April 2014. It is possible that the coordinates of the seafloor position might have been influenced by this unexpected bias in the kinematic GNSS positioning of Chen et al. (2018).
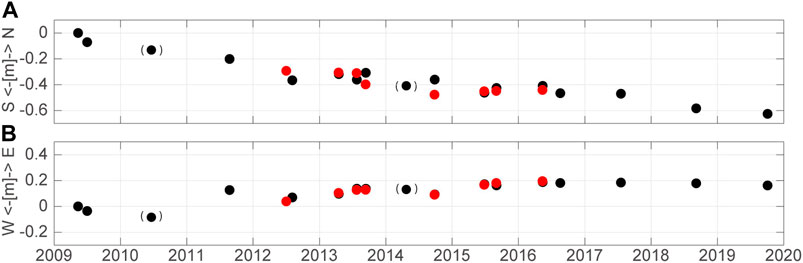
FIGURE 7. Time-series of the OILN site position relative to the stable part of the Yangtze Plate. (A) N–S component. Black circles show the results of this study. Circles with parentheses show the positions estimated from acoustic data with <3000 shots. Red circles are the results of Chen et al. (2018). (B) E–W component.
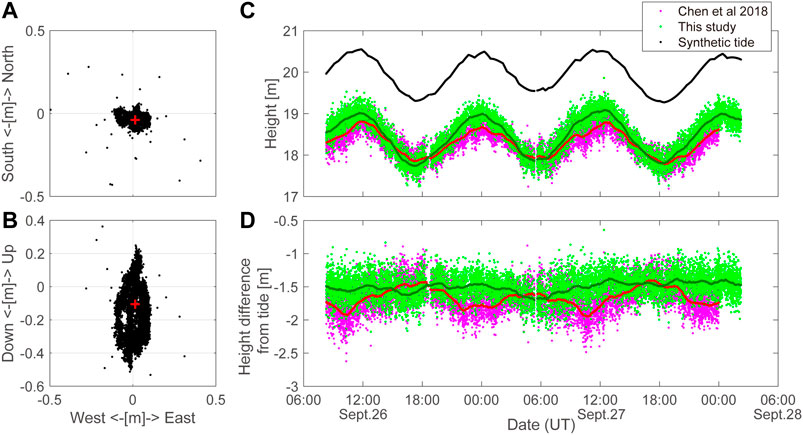
FIGURE 8. Differences in the onboard transducer positions between this study and Chen et al. (2018). (A) Relative horizontal positions from Chen et al. (2018). The red cross shows the average position. (B) E–W cross-section. (C) Time-series of the vertical transducer position. Positions from Chen et al. (2018) and this study are shown as purple and light green dots. One-hour running averages are shown as green and red dots. The predicted astronomical tide is shown as black dots. (D) Height difference between the transducer position and the astronomical tide level.
In the time-series obtained by low-frequency campaigns, the temporal changes are heavily biased by the results of only a few campaigns (e.g., 2012 and 2014 in Chen et al. 2018). This is also the case for our study. It should be noted that the estimated motion before 2012 obtained in this study was determined mainly by the location of the campaign in 2011. However, irrespective of the pre-2011 coordinate values, the eastward velocity appears to have decreased over time, at least when comparing 2012–2016 with 2016–2019 (Figure 6).
We measured seafloor movement near the rift axis of the Okinawa Trough back-arc basin over a 10-years-long period using a GNSS/acoustic technique. We deployed a seafloor site that is 60 km east of northeastern Taiwan in 2009, and conducted 18 measurement campaigns until 2020. Chen et al. (2018) reported the results for campaigns from 2012 to 2016 and found possible temporal variations in the rifting velocity of the Okinawa Trough. In this study, we extended the measurement period to 2019, in order to obtain more reliable estimates of velocity. The seafloor transponder array has undergone southeastward movement at an average velocity of 43 mm/yr from 2012 to 2019, which is 18 mm smaller than the results of Chen et al. (2018) for 2012–2016. This horizontal movement can be explained by clockwise block rotation of the Yonaguni Block and Central Range, which form the Yilan Plain, by back-arc rifting. In addition to the horizontal motion, the transponder array revealed fast subsidence in the 7 years from 2012 to 2019, with an average velocity of 22 mm/yr. The rapid subsidence and negative gravity anomaly suggest that rapid crustal thinning is not being fully compensated for by upward migration of the Moho, but is being accommodated by surface deformation. We also attempted to retrieve the acoustic ranging data obtained from 2009 to 2012, which were initially discarded because of replacement of the seafloor transponders. By fitting the decadal horizontal motion with two linear lines with a break and an offset due to the transponder replacement, the break is estimated to have occurred in July 2013. This timing coincides with a change in the seismicity rate around the site, as well as dike intrusion 150 km away from the site.
The raw data supporting the conclusions of this article will be made available by the authors, without undue reservation.
H-YC designed the on-board system and took responsibility for all the experiments and data. RI designed acoustic data analysis. Y-JH constructed model to explain the result collaborating with RI. TT provided analysis tool to determine attitude of the vessel from GNSS tripret. MA designed the seafloor geodesy system and deployed the transponders in OILN site. YT managed all the measurements and analyzed the acoustic data.before 2014. TK established a model strategy to determine the benchmark position accurately. KT improved the quality of poor GNSS data obtained in 2010. KM developed the analysis strategy to solve data with offset by benchmark replacement. HT developed analysis to solve vertical position of the benchmark accurately. C-SK managed all the measurements since 2014 to keep high data quality. C-HL determined the location of seafloor site and analyzed the hypocenters distribution.
The authors declare that the research was conducted in the absence of any commercial or financial relationships that could be construed as a potential conflict of interest.
3D coordinates of the onland GNSS stations in Japan were downloaded from the Geospatial Information Authority of Japan (https://terras.gsi.go.jp/). GNSS station position in Taiwan and GPS phase data for fiducial stations were provided by the Institute of Earth Science, Academia Sinica (http://gps.earth.sinica.edu.tw/). Hypocenter data around Japan was provided by Japan Meteorological Agency (JMA). We thank R. Watanabe for assistance in revisiting the previously discarded data. We also thank Hsin-I Chen, Suan-Han Su, Yi-lin Jiang, and I-Chuen Tsai for assistance with fieldwork and data analyses. T. Kawamoto improved this manuscript through insightful discussions. The bathymetry was downloaded from the Japan Oceanographic Data Center. This research was funded by Ministry of Science and Technology in Taiwan (MOST109-2116-M-001–009 and MOST108-2116-M-001–022) and Institute of Earth Sciences Academia Sinica. We thank two anonymous reviewers for their critical and constructive comments.
We selected the appropriate hyper parameters μ based on the minimum ABIC. Figure A1 shows how the time-series site position changes with different hyper parameters. When varying the hyper parameters within a range from 103.5 to 104.5, which covers the range of both Chen et al. (2018); (103.67–104) and this study (104–104.16), the horizontal and vertical positions change <1.5 cm and <3.0 cm, excluding the campaign with limited acoustic data (<3000; Figure A1E). The different hyper parameters within this range effect the velocity estimates by < 0.6 mm/yr in a N–S direction, <1.2 mm/yr in an E–W direction, and <2.1 mm/yr in a vertical direction (Figure A1F).
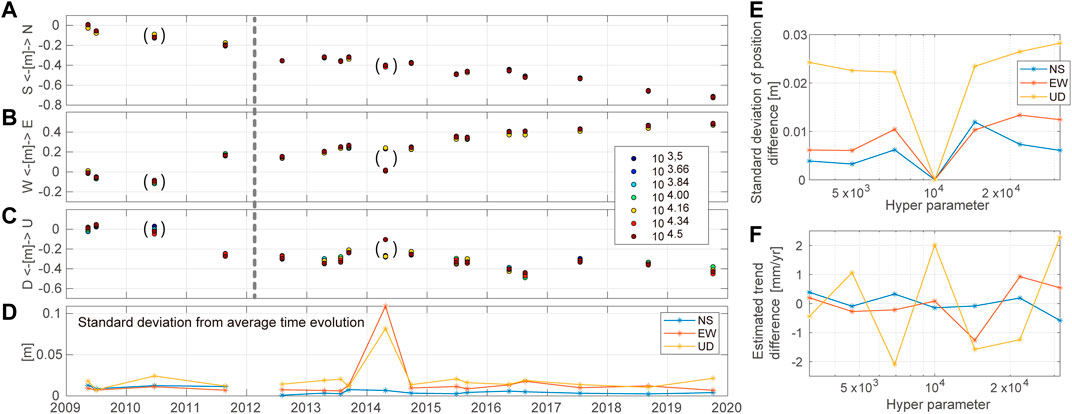
FIGURE A1. Time-series of the OILN site position solved with different hyper parameters ranging from 103.5 to 104.5. (A) N–S component. Circles with parentheses show the positions estimated from limited acoustic data (<3,000 shots). (B) E–W component. (C) Up–down component. (D) Differences in the estimated site positions using different hyper parameters, showing the standard deviation for all hyper parameters between 103.5 to 104.5. The horizontal and vertical motion ranges between ±1.5 and ±3 cm, respectively, excluding the campaigns with limited data. The standard deviation was calculated for the deviation from the temporal variation trend obtained by averaging all hyper parameters. The campaigns before and after 2012 were evaluated separately. (E) Standard deviation of the site position difference from the value estimated with a hyper parameter of 104. The two campaigns with limited data (campaigns with brackets in the left panels) were not included in this evaluation. (F) Differences in the trend estimated using various hyper parameters in this study.
Ando, M., Ikuta, R., Tu, Y., Chen, H. Y., and Lin, C. H. (2015). “The Apr 2013 earthquake swarm and dyke intrusion in the Okinawa trough, abstract for, 2015,” in Japan Geoscience Union Meeting, Makuhari, chiba, May 24–28, 2015, SCG62–SCG07.
Arai, R., Kodaira, S., Kaiho, Y., Takahashi, T., Miura, S., and Kaneda, Y. (2017). Crustal structure of the southern Okinawa Trough: symmetrical rifting, submarine volcano, and potential mantle accretion in the continental back-arc basin. J. Geophys. Res. Solid Earth. 122 (1), 622–641. doi:10.1002/2016jb013448
R. R. Barnhill, and R. F. Riesenfeld (Editors) (1974). Computer aided geometric design. New York: Academic, 326.
Bonvalot, S., Balmino, G., Briais, A., Kuhn, M., Peyrefitte, A., Vales, N., et al. (2012). World gravity map. Commission for the geological map of the world. Paris: BGI-CGMW-CNES-IRD.
Chadwell, C. D., Hildebrand, J. A., Spiess, F. N., Morton, J. L., Normark, W. R., and Reiss, C. A. (1999). No spreading across the southern Juan de Fuca ridge axial cleft during 1994-1996. Geophys. Res. Lett. 26 (16), 2525–2528. doi:10.1029/1999gl900570
Chadwell, C. D., and Spiess, F. N. (2008). Plate motion at the ridge-transform boundary of the south Cleft segment of the Juan de Fuca Ridge from GPS-Acoustic data. J. Geophys. Res. 113 (B4), B04415. doi:10.1029/2007JB004936
Chen, H. Y., Ikuta, R., Lin, C.-H., Hsu, Y.-J., Kohmi, T., Wang, C.-C., et al. (2018). Back-arc opening in the western end of the Okinawa Trough revealed from GNSS/Acoustic Measurements. Geophys. Res. Lett. 45 (1), 137–145. doi:10.1002/2017GL075724
Colombo, O. L. (1998). “Earth Sciences and Geography,” in GPS for geodesy. 2nd Edn, Editors A. Kleusberg, P. Teunissen, and J. G. Peter (Berlin: Springer), 537–567.
DeMets, C., Gordon, R., and Argus, D. (2010). Geologically current plate motions. Geophys. J. Int. 181 (1), 1–80. doi:10.1111/j.1365-246X.2009.04491.x
Huang, H. H., Shyu, J. B. H., Wu, Y. M., Chang, C. H., and Chen, Y. G. (2012). Seismotectonics of northeastern Taiwan: kinematics of the transition from waning collision to subduction and postcollisional extension. J. Geophys. Res. 117 (B1), B01313. doi:10.1029/2011JB008852
Ikuta, R., Tadokoro, K., Ando, M., Okuda, T., Sugimoto, S., Takatani, K., et al. (2008). A new GPS-acoustic method for measuring ocean floor crustal deformation: application to the Nankai Trough. J. Geophys. Res. 113 (B2), B02401. doi:10.1029/2006JB004875
Ishikawa, T., Yokota, Y., Watanabe, S., and Nakamura, Y. (2020). History of on-board equipment improvement for GNSS-A observation with focus on observation frequency. Front. Earth Sci. 8, 150. doi:10.3389/feart.2020.00150
Lai, K. Y., Chen, Y. G., Wu, Y. M., Avouac, J. P., Kuo, Y.-T., Wang, Y., et al. (2009). The 2005 Ilan earthquake doublet and seismic crisis in northeastern Taiwan: evidence for dyke intrusion associated with on-land propagation of the Okinawa Trough. Geophys. J. Int. 179 (2), 678–686. doi:10.1111/j.1365-246X.2009.04307.x
Lallemand, S., and Liu, C. S. (1998). Geodynamic implications of present-day kinematics in the southern Ryukyus. J. Geol. Soc. China. 41 (4), 551–564
Lin, S. C., and Kuo, B. Y. (2016). Dynamics of the opposite-verging subduction zones in the Taiwan region: insights from numerical models. J. Geophys. Res. Solid Earth. 121 (3), 2174–2192. doi:10.1002/2015JB012784
Nakamura, M., and Kinjo, A. (2018). Activated seismicity by strain rate change in the Yaeyama region, south Ryukyu. Earth Planets Space. 70 (1), 154. doi:10.1186/s40623-018-0929-y
Nishimura, S., Hashimoto, M., and Ando, M. (2004). A rigid block rotation model for the GPS derived velocity field along the Ryukyu arc. Phys. Earth Planet. In. 142 (3-4), 185–203. doi:10.1016/j.pepi.2003.12.014
NovAtel Inc (2014). GrafNav 8.60: user guide OM-20000147 rev 3. Available at: https://hexagondownloads.blob.core.windows.net/public/Novatel/assets/Documents/Waypoint/Downloads/NavNet860_Manual/NavNet860_Manual.pdf (Accessed January 26, 2021).
Sato, M., Fujita, M., Matsumoto, Y., Ishikawa, T., Saito, H., Mochizuki, M., et al. (2013). Interplate coupling off northeastern Japan before the 2011 Tohoku-oki earthquake, inferred from seaoor geodetic data. J. Geophys. Res. Solid Earth. 118 (7), 3860–3869. doi:10.1002/jgrb.50275
Schellart, W. P., and Moresi, L. (2013). A new driving mechanism for backarc extension and backarc shortening through slab sinking induced toroidal and poloidal mantle flow: results from dynamic subduction models with an overriding plate. J. Geophys. Res. Solid Earth. 118 (6), 3221–3248. doi:10.1002/jgrb.50173
Sibuet, J. C., Letouzey, J., Barbier, F., Charvet, J., Foucher, J. P., Hilde, T. W. C., et al. (1987). Back arc extension in the Okinawa trough. J. Geophys. Res. 92 (B13), 14041–14063. doi:10.1029/JB092iB13p14041
Steckler, S. M., Berthelot, F., Lyberis, N., and Le Pichon, X. (1988). Subsidence in the gulf of suez: implications for rifting and plate kinematics. Tectonophysics. 153 (1–4), 249–270. doi:10.1016/0040-1951(88)90019-4
Tu, Y., and Heki, K. (2017). Decadal modulation of repeating slow slip event activity in the southwestern Ryukyu Arc possibly driven by rifting episodes at the Okinawa Trough. Geophys. Res. Lett. 44 (18), 9308–9313. doi:10.1002/2017GL074455
Keywords: GNSS/acoustic, okinawa trough opening, ryukyu arc, yilan basin, ryukyu trench-arc system, crustal thinning, yonaguni block
Citation: Chen H-Y, Ikuta R, Hsu Y-J, Tsujii T, Ando M, Tu Y, Kohmi T, Takemoto K, Mizuno K, Tung H, Ku C-S and Lin C-H (2021) A Decade of Global Navigation Satellite System/Acoustic Measurements of Back-Arc Spreading in the Southwestern Okinawa Trough. Front. Earth Sci. 9:601138. doi: 10.3389/feart.2021.601138
Received: 31 August 2020; Accepted: 07 January 2021;
Published: 10 February 2021.
Edited by:
Ryota Hino, Tohoku University, JapanReviewed by:
Tadashi Ishikawa, Japan Coast Guard, JapanCopyright © 2021 Chen, Ikuta, Hsu, Tsujii, Ando, Tu, Kohmi, Takemoto, Mizuno, Tung, Ku and Lin. This is an open-access article distributed under the terms of the Creative Commons Attribution License (CC BY). The use, distribution or reproduction in other forums is permitted, provided the original author(s) and the copyright owner(s) are credited and that the original publication in this journal is cited, in accordance with accepted academic practice. No use, distribution or reproduction is permitted which does not comply with these terms.
*Correspondence: Ryoya Ikuta, aWt1dGEucnlveWFAc2hpenVva2EuYWMuanA=
Disclaimer: All claims expressed in this article are solely those of the authors and do not necessarily represent those of their affiliated organizations, or those of the publisher, the editors and the reviewers. Any product that may be evaluated in this article or claim that may be made by its manufacturer is not guaranteed or endorsed by the publisher.
Research integrity at Frontiers
Learn more about the work of our research integrity team to safeguard the quality of each article we publish.