 Carol L. Beaver1
 Estella A. Atekwana2
 Barbara A. Bekins3
 Dimitrios Ntarlagiannis4
 Lee D. Slater4
 Silvia Rossbach1*
- 1Department of Biological Sciences, Western Michigan University, Kalamazoo, MI, United States
- 2Department of Earth Sciences, University of Delaware, Newark, DE, United States
- 3U. S. Geological Survey, Menlo Park, CA, United States
- 4Earth and Environmental Sciences, Rutgers University–Newark, Newark, NJ, United States
Geophysical investigations documenting enhanced magnetic susceptibility (MS) within the water table fluctuation zone at hydrocarbon contaminated sites suggest that MS can be used as a proxy for investigating microbial mediated iron reduction during intrinsic bioremediation. Here, we investigated the microbial community composition over a 5-year period at a hydrocarbon-contaminated site that exhibited transient elevated MS responses. Our objective was to determine the key microbial populations in zones of elevated MS. We retrieved sediment cores from the petroleum-contaminated site near Bemidji, MN, United States, and performed MS measurements on these cores. We also characterized the microbial community composition by high-throughput 16S rRNA gene amplicon sequencing from samples collected along the complete core length. Our spatial and temporal analysis revealed that the microbial community composition was generally stable throughout the period of investigation. In addition, we observed distinct vertical redox zonations extending from the upper vadose zone into the saturated zone. These distinct redox zonations were concomitant with the dominant microbial metabolic processes as follows: (1) the upper vadose zone was dominated by aerobic microbial populations; (2) the lower vadose zone was dominated by methanotrophic populations, iron reducers and iron oxidizers; (3) the smear zone was dominated by iron reducers; and (4) the free product zone was dominated by syntrophic and methanogenic populations. Although the common notion is that high MS values are caused by high magnetite concentrations that can be biotically formed through the activities of iron-reducing bacteria, here we show that the highest magnetic susceptibilities were measured in the free-phase petroleum zone, where a methanogenic community was predominant. This field study may contribute to the emerging knowledge that methanogens can switch their metabolism from methanogenesis to iron reduction with associated magnetite precipitation in hydrocarbon contaminated sediments. Thus, geophysical methods such as MS may help to identify zones where iron cycling/reduction by methanogens is occurring.
Introduction
Magnetic susceptibility (MS) is a measure of the ability of a material to become magnetized when placed in a magnetic field and is dependent on the concentration and type of the magnetic minerals present. It generally reflects the presence and volume of the iron oxide magnetite. Because of the abundance of iron in terrestrial environments, MS is commonly used to investigate different geological processes. Example applications of MS include: (1) determining the magnetic stratigraphy in loess deposits, lake sediments and marine sediments to reconstruct the paleoenvironmental evolution and erosional history (e.g., Zhang et al., 2012), (2) examining variations in the detrital input of magnetic minerals related to climate change (e.g., Da Silva et al., 2013), (3) aiding archeological investigations (Walach et al., 2011), (4) serving as a proxy for extreme hydrologic events and rainfall (Li et al., 2019), (5) monitoring soil pollution (Hoffmann et al., 1999; D’Emilio et al., 2007; Zhang et al., 2012), and (6) investigating the movement of tectonic plates. Further, the MS technique has also been used for oil exploration (e.g., Guzmán et al., 2011), for evaluation of oil bearing units (Perez-Perez et al., 2011; Emmerton et al., 2013) and reservoir properties (Potter, 2007; Potter and Ivakhnenko, 2008).
There is also a growing interest in relating environmental magnetic studies to microbial mediated iron cycling (Porsch et al., 2010; Mewafy et al., 2011; Byrne et al., 2015), and oil biodegradation after spills (Rijal et al., 2010, 2012; Atekwana et al., 2014; Beaver et al., 2016; Lund et al., 2017). In particular, Rijal et al. (2010, 2012) and Atekwana et al. (2014) observed large MS anomalies within the water table fluctuation zone (WTFZ) associated with the presence of hydrocarbons relative to background measurements and related these changes to the precipitation of magnetite resulting from microbial degradation of the hydrocarbons by iron-reducing bacteria.
Biodegradation is a natural process performed by microbes that is dependent on the terminal electron acceptors (TEAs) available in the environment (Meckenstock et al., 2015). Oil degradation using aerobic respiration provides microbes with the most energy, but oxygen is eventually exhausted and sediments turn anoxic. After oxygen is depleted, microbial communities switch to different TEAs. Nitrate reduction is the next most energetically favorable process. When nitrate is used up, iron reduction occurs. After Fe(III) is depleted, sulfate reduction and finally fermentation and methanogenesis will take over as predominant microbial processes. To produce methane, methanogens can use methylated compounds such as acetate or methanol as substrates or just carbon dioxide (CO2) and hydrogen gas (H2). In fact, the methanogens’ use of H2 leads to a locally very low hydrogen partial pressure, making hydrocarbon fermentation energetically favorable. This interspecies hydrogen transfer represents a syntrophic relationship between fermenters and methanogens. In other syntrophic associations between respiratory bacteria and methanogens, electrons are transferred via certain bacterial appendages such as nanowires (direct interspecies electron transfer – DIET) (Cruz Viggi et al., 2014; Rotaru et al., 2014; Zhuang et al., 2015).
Magnetite is often found in sediments where iron reduction has occurred. When the activity of iron-reducing bacteria increases the local concentration of Fe(II), Fe(II) will sorb to ferrihydrite, causing the precipitation of the mixed valent magnetite (Hansel et al., 2005).
Therefore an increase in MS can indicate if iron-reducing microorganisms are active while degrading hydrocarbons (Porsch et al., 2010).
Nonetheless the relationship between MS and the activity of iron-reducing bacteria is not completely understood and the use of MS as a proxy for biodegradation is tenuous at best. This is underscored by the observation that the MS signature can be transient due to the creation and destruction of magnetic minerals by biotic and abiotic processes (e.g., Ameen et al., 2014; Lund et al., 2017). Some of these magnetic minerals may be used by microbes to transfer electrons, causing changes in mineral structure. Redox cycling using magnetite by Rhodopseudomonas, an iron oxidizer, and Geobacter, an iron reducer, has been demonstrated under laboratory conditions, and MS was shown to decrease during the oxidation phase from Fe dissolution and increase during the reduction phase from magnetite precipitation (Byrne et al., 2015). In the field, Rijal et al. (2012) and Ameen et al. (2014) documented temporal decreases in MS at a contaminated former military air force base in Hradčany, Czech Republic, and speculated this to be due to the dissolution of magnetite. Lund et al. (2017) also documented a >90% loss in MS at the National Crude Oil Spill Fate and Natural Attenuation Research Site administered by the United States Geological Survey (USGS) near Bemidji, MN, United States, between 2011 and 2015 when compared to initial MS observations from this aquifer (Mewafy et al., 2011; Atekwana et al., 2014). It was hypothesized that the reduction of MS was due to the transformation of magnetite to siderite coupled with the exhaustion of ferrihydrite.
Currently, we only have a poor understanding of the microbial communities driving the changes in MS and this uncertainty limits the effective application of MS as a proxy for biodegradation and iron cycling studies. The relationship between oil biodegradation and MS is complex as bacterial oil biodegradation coupled to iron reduction could result in the precipitation of magnetite and cause an increase in MS response. Once the bioavailable iron is depleted, the microbes may switch to other metabolic processes that use magnetite. This, in turn, can cause a decrease in the MS response through the oxidation of magnetite to maghemite and then hematite. Interestingly, initial characterization of the microbial community composition at the Bemidji site revealed that not iron-reducing bacteria were prevalent in zones where high MS was measured, but a microbial community dominated by the syntrophic bacterium Smithella and methanogenic Archaea (Beaver et al., 2016).
In this publication, we extend the Beaver et al. (2016) study, which was limited in scope because it showed data based on 1 year only, from just four samples along a 10 m long core, and it used clone libraries with the 16S rRNA gene, which is a limited molecular approach for the characterization of microbial communities. Here, we present a multi-year analyses of the microbial community structure with closely spaced samples along complete cores using high-throughput DNA sequencing at the same hydrocarbon contaminated site exhibiting transient MS signatures. Our objective was to determine the key microbial populations in zones of elevated magnetic susceptibility and to provide insights into possible microbial-driven MS changes.
Materials and Methods
Site Description
This study was conducted at the National Crude Oil Spill Fate and Natural Attenuation Research Site administered by the USGS. Here, a pipeline transporting crude oil broke in 1979 spilling about 1,700,000 L of crude oil. After cleanup efforts were completed in 1980, about 400,000 liters of oil remained in the unsaturated zone on the water table. This oil continues to be a source of groundwater contamination.
The spill resulted in two plumes in two low topographic areas designated as the north and south pools. The north oil pool is the location of the rupture site whereas the south oil pool resulted from the sprayed oil within a small wetland region (Figure 1A). The hydrocarbon contamination at the site is characterized by different hydrocarbon phases including a free-fluid phase approximately 0.75 m thick floating on the water table, a dissolved phase in the ground water, and a vapor phase in the unsaturated zone. Seasonal fluctuations of the water table have resulted in a smear zone characterized by residual phase smearing aquifer sediments (Essaid et al., 2011). Our study focuses on cores obtained from contaminated sediments in the free-phase petroleum in the north oil pool (Figure 1A).
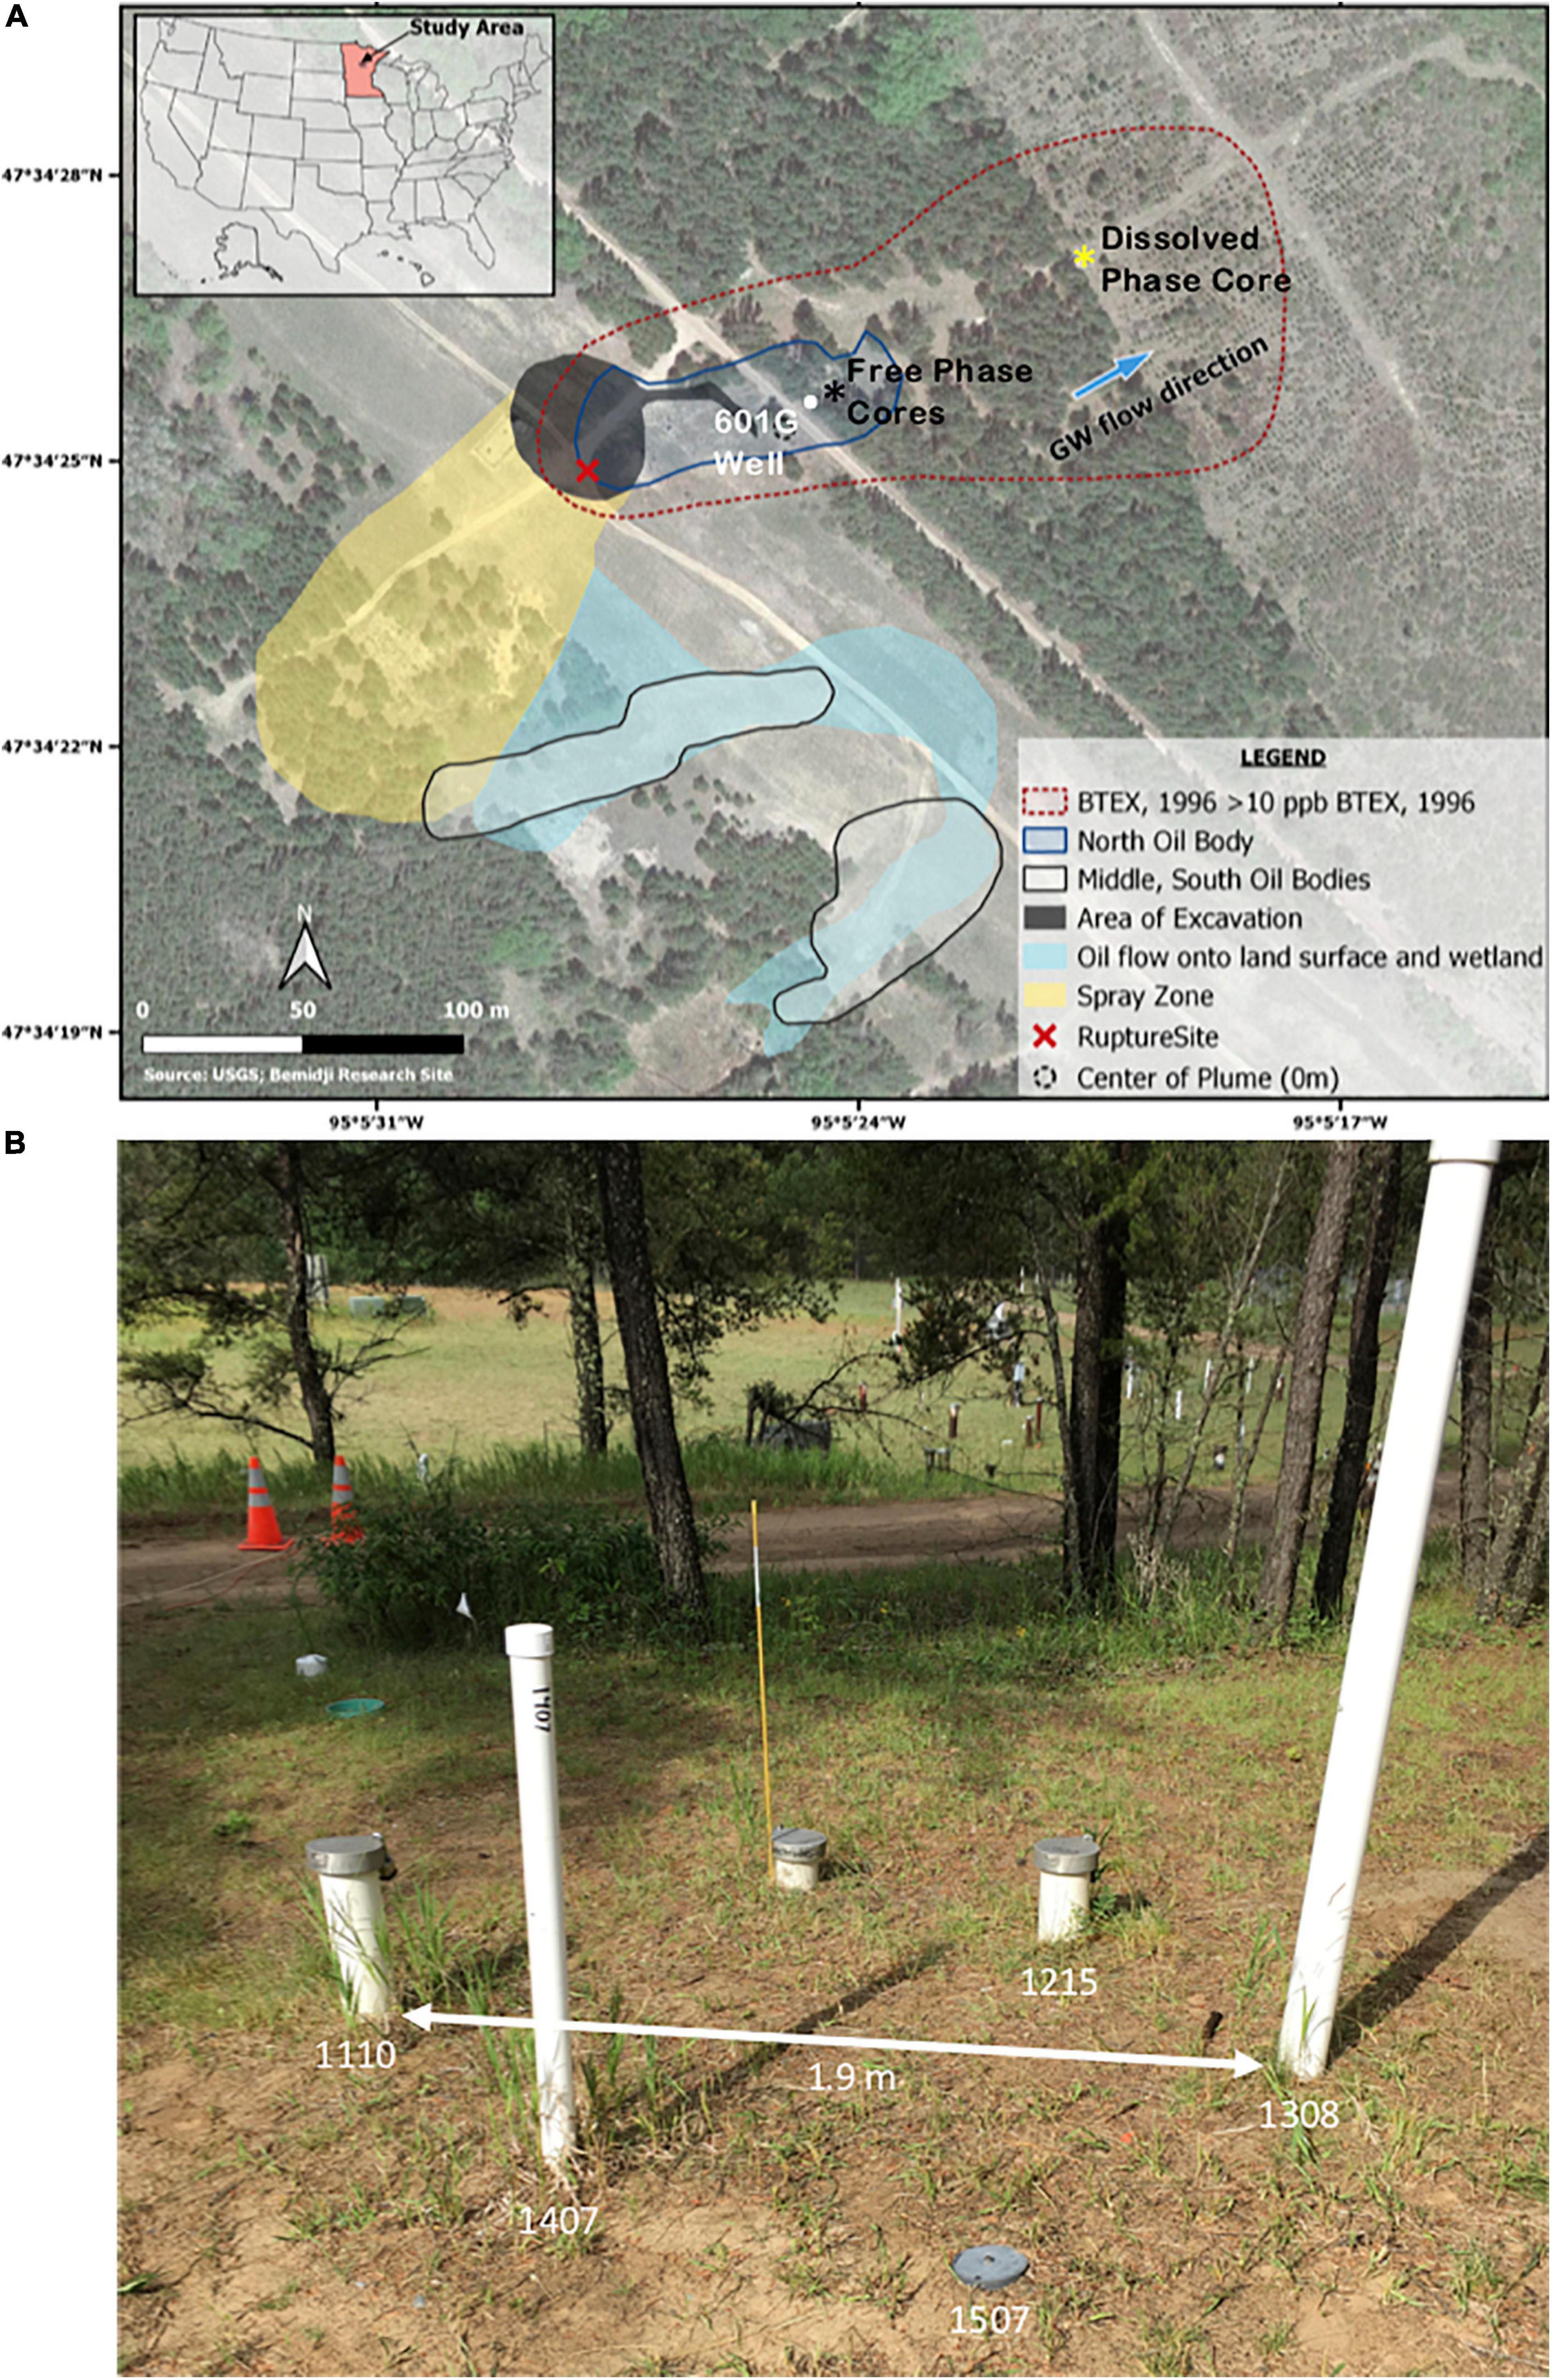
Figure 1. (A) Satellite image from the National Crude Oil Spill Fate and Natural Attenuation Research Site at Bemidji, MN, overlaid with the extent of the free-phase oil and the dissolved plume as well as the location of the well and cores used in this study. The black star indicates the location of the five cores that were collected from the free-phase petroleum zone. The yellow star represents the location of the core that was collected in the dissolved-phase plume. The white dot represents the location of well 601G, which is ∼5 m away from the location of the cores. The blue arrow indicates the direction of the ground water (GW) flow. BTEX, benzene, toluene, ethylbenzene, xylene. The image was retrieved from the USGS Bemidji Research Site (https://mn.water.usgs.gov/projects/bemidji/spatial/index.html) and modified. (B) Photographic image of the location of the five wells from which the free-phase cores were drilled in five consecutive years. The five wells are not more than 1.9 m apart.
The geology has been described as ∼20–25 m of moderately calcareous silty sand and outwash glacial deposits, overlying an unknown thickness of clayey till (Bennett et al., 1993). The upper 3 to 6 m are characterized by mostly poorly sorted, interbedded coarse sand, gravel, and silt. Beneath the upper layer, a 15–20 m laminated silt, very fine sand, and clay make up the majority of the lithology and this is underlain by the lower till layer.
Core Retrieval
All five cores from the free-phase oil zone were drilled within 1.9 m of each other and, according to their retrieval year, named C1110, C1215, C1308, C1407, and C1507 (Figure 1B). According to the fluctuating water table, these five cores were 8–10 m long and their sections are described in Supplementary Table 1. Core 1411 was retrieved from a location in the dissolved phase zone as indicated in Figure 1A. Cores were retrieved via percussion drilling using a core barrel containing either a 1″ or 2″ polycarbonate liner pushed through the sediment in a hollow stem auger. For the lowest core section crossing the water table, a sample-freezing drive shoe was used to retain the water from the aquifer by pumping liquid CO2 to the bottom of the core which allowed the retention of the final section (Trost et al., 2018). A detailed description of the core sections can be found in Supplementary Table 1. Core C1110 was shipped on ice to Oklahoma State University (OSU, Stillwater, OK, United States), and stored frozen until MS analysis and sediment sample extraction for microbial analysis. Cores collected in years 2012, 2013, 2014, and 2015 were transported on ice to Western Michigan University, where they were stored at 4°C while the sampling of sediments for DNA isolation occurred in less than 10 days after arrival at the laboratory. Sediment samples were stored at −20°C until DNA isolation. The cores were subsequently shipped on ice to OSU, where they were frozen until MS analysis.
Magnetic Susceptibility (χ) Measurements
Magnetic susceptibility is the degree to which a sediment or mineral can be magnetized when a magnetic field is applied. MS is the ratio between M and H, where M is the magnetization of the material in the magnetic field and H is the field intensity (Blakely, 1995).
M and H have the same units (A/m), so χ[vol] is a dimensionless volume magnetic susceptibility. Magnetization is a certain measure of magnetism (dipole moment) per unit volume. The volume MS of the cores retrieved in 2011 and 2012 was measured with a Bartington MS2 magnetic susceptibility meter (Bartington Instruments, Witney, United Kingdom; operating frequency 4.65 kHz ± 1%; maximum resolution of 2 × 10⁻⁶ SI) coupled to a MS2B dual frequency sensor. For cores retrieved in 2014 and 2015, the volume MS values were acquired using the same meter, but it was coupled to a MS2C core scanning sensor, allowing the measurements to be taken from the complete cores that were slid through the sensor.
Gas Concentrations
Concentrations of O2 + Ar, CO2, and CH4 were obtained from vapor well 601G (Figure 1A) as described by Mewafy et al. (2011) from the USGS National Water Information System database accessed on 11/7/2020 (U. S. Geological Survey, 2020). Based on limitations of the gas-chromatographic method used, oxygen and argon could not be separated and are plotted together.
Sampling and DNA Extraction
Sediment samples were obtained from holes cut through the side of the polycarbonate core liner. The sampling occurred in an anaerobic chamber (Shel Lab Model BactronEZ, Sheldon Manufacturing, Cornelius, OR, United States) for all years except for 2011. The anaerobic chamber was continuously fed with 90% nitrogen, 5% CO2 and 5% H2. Sediment samples were taken along the complete cores from top to bottom in ∼15 cm distances. Sterile spatulas were used to extract the sediments, which were placed aseptically into plastic centrifuge tubes. The sediment samples were then stored at −20°C in order to preserve the DNA until it was extracted. The PowerSoil DNA isolation kit (MO BIO, now Qiagen, Germantown, MD, United States) was used to isolate total DNA as directed in the protocol, but 0.5 g of sediment was substituted for 0.25 g in order to increase the DNA yield for cores obtained in 2011, 2012, and 2014. This method still did not produce enough DNA for analysis in some of the samples for those years, so a different method that can extract more DNA from the sediments was used for 2013 and 2015. The method used for the samples obtained in 2013 and 2015 was the DNA extraction method described by Zhou et al. (1996), except that 4 g of sediment was used instead of 5 g due to the size of the centrifuge tubes. Although the use of different extraction methods has been shown to cause some variation in microbial community structure analysis (Guo and Zhang, 2013), we have used both methods with the same samples and show the resulting comparison in section “Comparison of Two Different Extraction Methods.” DNA was further purified by the Promega Wizard SV Gel and PCR Cleanup System (Madison, Wisconsin) and then by Princeton Separations Centri-Sep Spin Columns (Freehold, NJ, United States). DNA was eluted in deionized H2O in a final volume of 25 μl. After isolation, DNA was quantified with a Nanodrop (Thermo Fisher Scientific, Carlsbad, CA, United States) in 2011 and 2012 and with the Qubit Fluorometer 2.0 (Thermo Fisher Scientific, Carlsbad, CA, United States) in 2013–2015. To determine if any contaminating DNA was present in the DNA extraction kits or other reagents, control samples were obtained by following the extraction procedures using all the components without the addition of any sediment.
Sequencing and Statistical Analyses
Total DNA of the samples was sent to the RTSF Genomics Core at Michigan State University (East Lansing, MI, United States) for the construction of 16S rRNA gene libraries and high-throughput DNA sequencing. The libraries were constructed with the primers F515 and R806, targeting the V3/V4 variable regions of the 16S rRNA gene. The Illumina MiSeq platform (Illumina, San Diego, CA, United States) was used for sequencing the libraries by 250 base paired-end sequencing. Sequences were binned and annotated with QIIME. Forward and reverse reads were merged and quality controls were performed with Pandaseq (Masella et al., 2012). If the merged reads consisted of sequences shorter than 247 or longer than 275 base pairs, less than 45 base pairs as the minimum overlap of the forward and reverse read, or had an alignment score of less than 0.9, the read was discarded. Chimeras were identified with identify chimeric_seqs.py and eliminated, then operational taxonomic units (OTUs) were picked with the pick_open_reference_otus.py command using VSEARCH (Rognes et al., 2016) in QIIME (Caporaso et al., 2010). Only OTUs with 2 or more sequences were kept as part of the analysis. The reference set used with QIIME was the “Silva_119_rep_set97.fna” set which used a 97% similarity cutoff and taxonomic identification was completed with the “majority_taxonomy_7_levels.txt” file found in SILVA QIIME release 128. Contaminant OTUs found in the control samples without soil were removed from the core sample data manually in the Excel program (Microsoft Office Suite, Version 15.32).
Accession Numbers
The sequences generated in this study can be found in the Sequence Read Archive (SRA) of the National Center for Biotechnology Information (NCBI) under accession numbers SRR12074793–SRR12074794, SRR12075362–SRR12075368, SRR12076730–SRR12076740, SRR12077129–SRR12077144, SRR12082454–SRR12082467, SRR12082942–SRR12082962, SRR12091569–SRR12091584, and SRR12091932–SRR12091956.
Generation of Graphs and Statistical Analysis
Phyla and UniFrac graphs were generated and statistical analyses were performed with R (R Core Team, 2016), specifically the following R packages: Phyloseq v. 1.32.0 (McMurdie and Holmes, 2013), ggplot2 v. 3.3.2 (Wickham, 2009), grid v. 4.4.0 (Murrell, 2005), cowplot v. 1.1.0 (Wilkie, 2019), vegan v. 2.5.7 (Oksanen et al., 2013), plyr v. 1.8.6 (Wickham, 2011), tidyverse v. 1.3.0 (Wickham et al., 2019), and gridExtra v. 2.3 (Auguie, 2017). The nmds graph was generated with vegan and ggplot2. Predicted functional genes were determined by PICRUSt (Langille et al., 2013). The LEfSe analysis was generated with dada2 v. 1.0.3 (Callahan et al., 2016), microbial (Guo and Gao, 2020) and phyloseq.
Results
Description of Cores
Sediment cores C1110, C1215, C1308, C1407, and C1507 were retrieved from the center of the free-phase oil at the north pool (Figure 1). Complete cores were retrieved from the surface at the elevation of ∼433 m down to below the water table, which was at ∼424 m. The units for the elevations are meters above sea level (m.a.s.l.) and pertain to all elevations mentioned in here, but are omitted for readability. The cores in the free-phase oil zone were taken no more than 1.9 m apart from each other to minimize spatial variability (Figure 1B). The cores were characterized by five distinct zones based on sediment characteristics from visual inspection and gas data (Figures 2A,E,I,M and Supplementary Table 1). The first zone was the upper vadose (UV) zone, which was not contaminated by any free-phase or residual oil and consisted of layers of sand or clay. This zone extended down to ∼ 428.5 m, approximately where the carbon dioxide and oxygen concentration graphs cross over in Figures 2C,G,K. The second zone, the lower vadose (LV) zone, was characterized by decreasing oxygen and increasing CO2 and methane concentrations and was part of the unsaturated zone between the upper vadose zone and the smear zone, ending at ∼425.5 m. In the smear zone (SZ), residual phase hydrocarbons adhered to the sand particles above the free-phase oil. The length of the smear zone was dependent on the depth of the water table. The fourth zone, the free-phase oil (FP), consisted of a ∼0.75 m thick layer of free-phase petroleum on top of the water table, which was at approximately 424 m. The saturated (S) zone, with dissolved phase hydrocarbons, was below the free-phase oil zone. The geological description reveals mostly fine-grained sand with clay and silt across the water table.
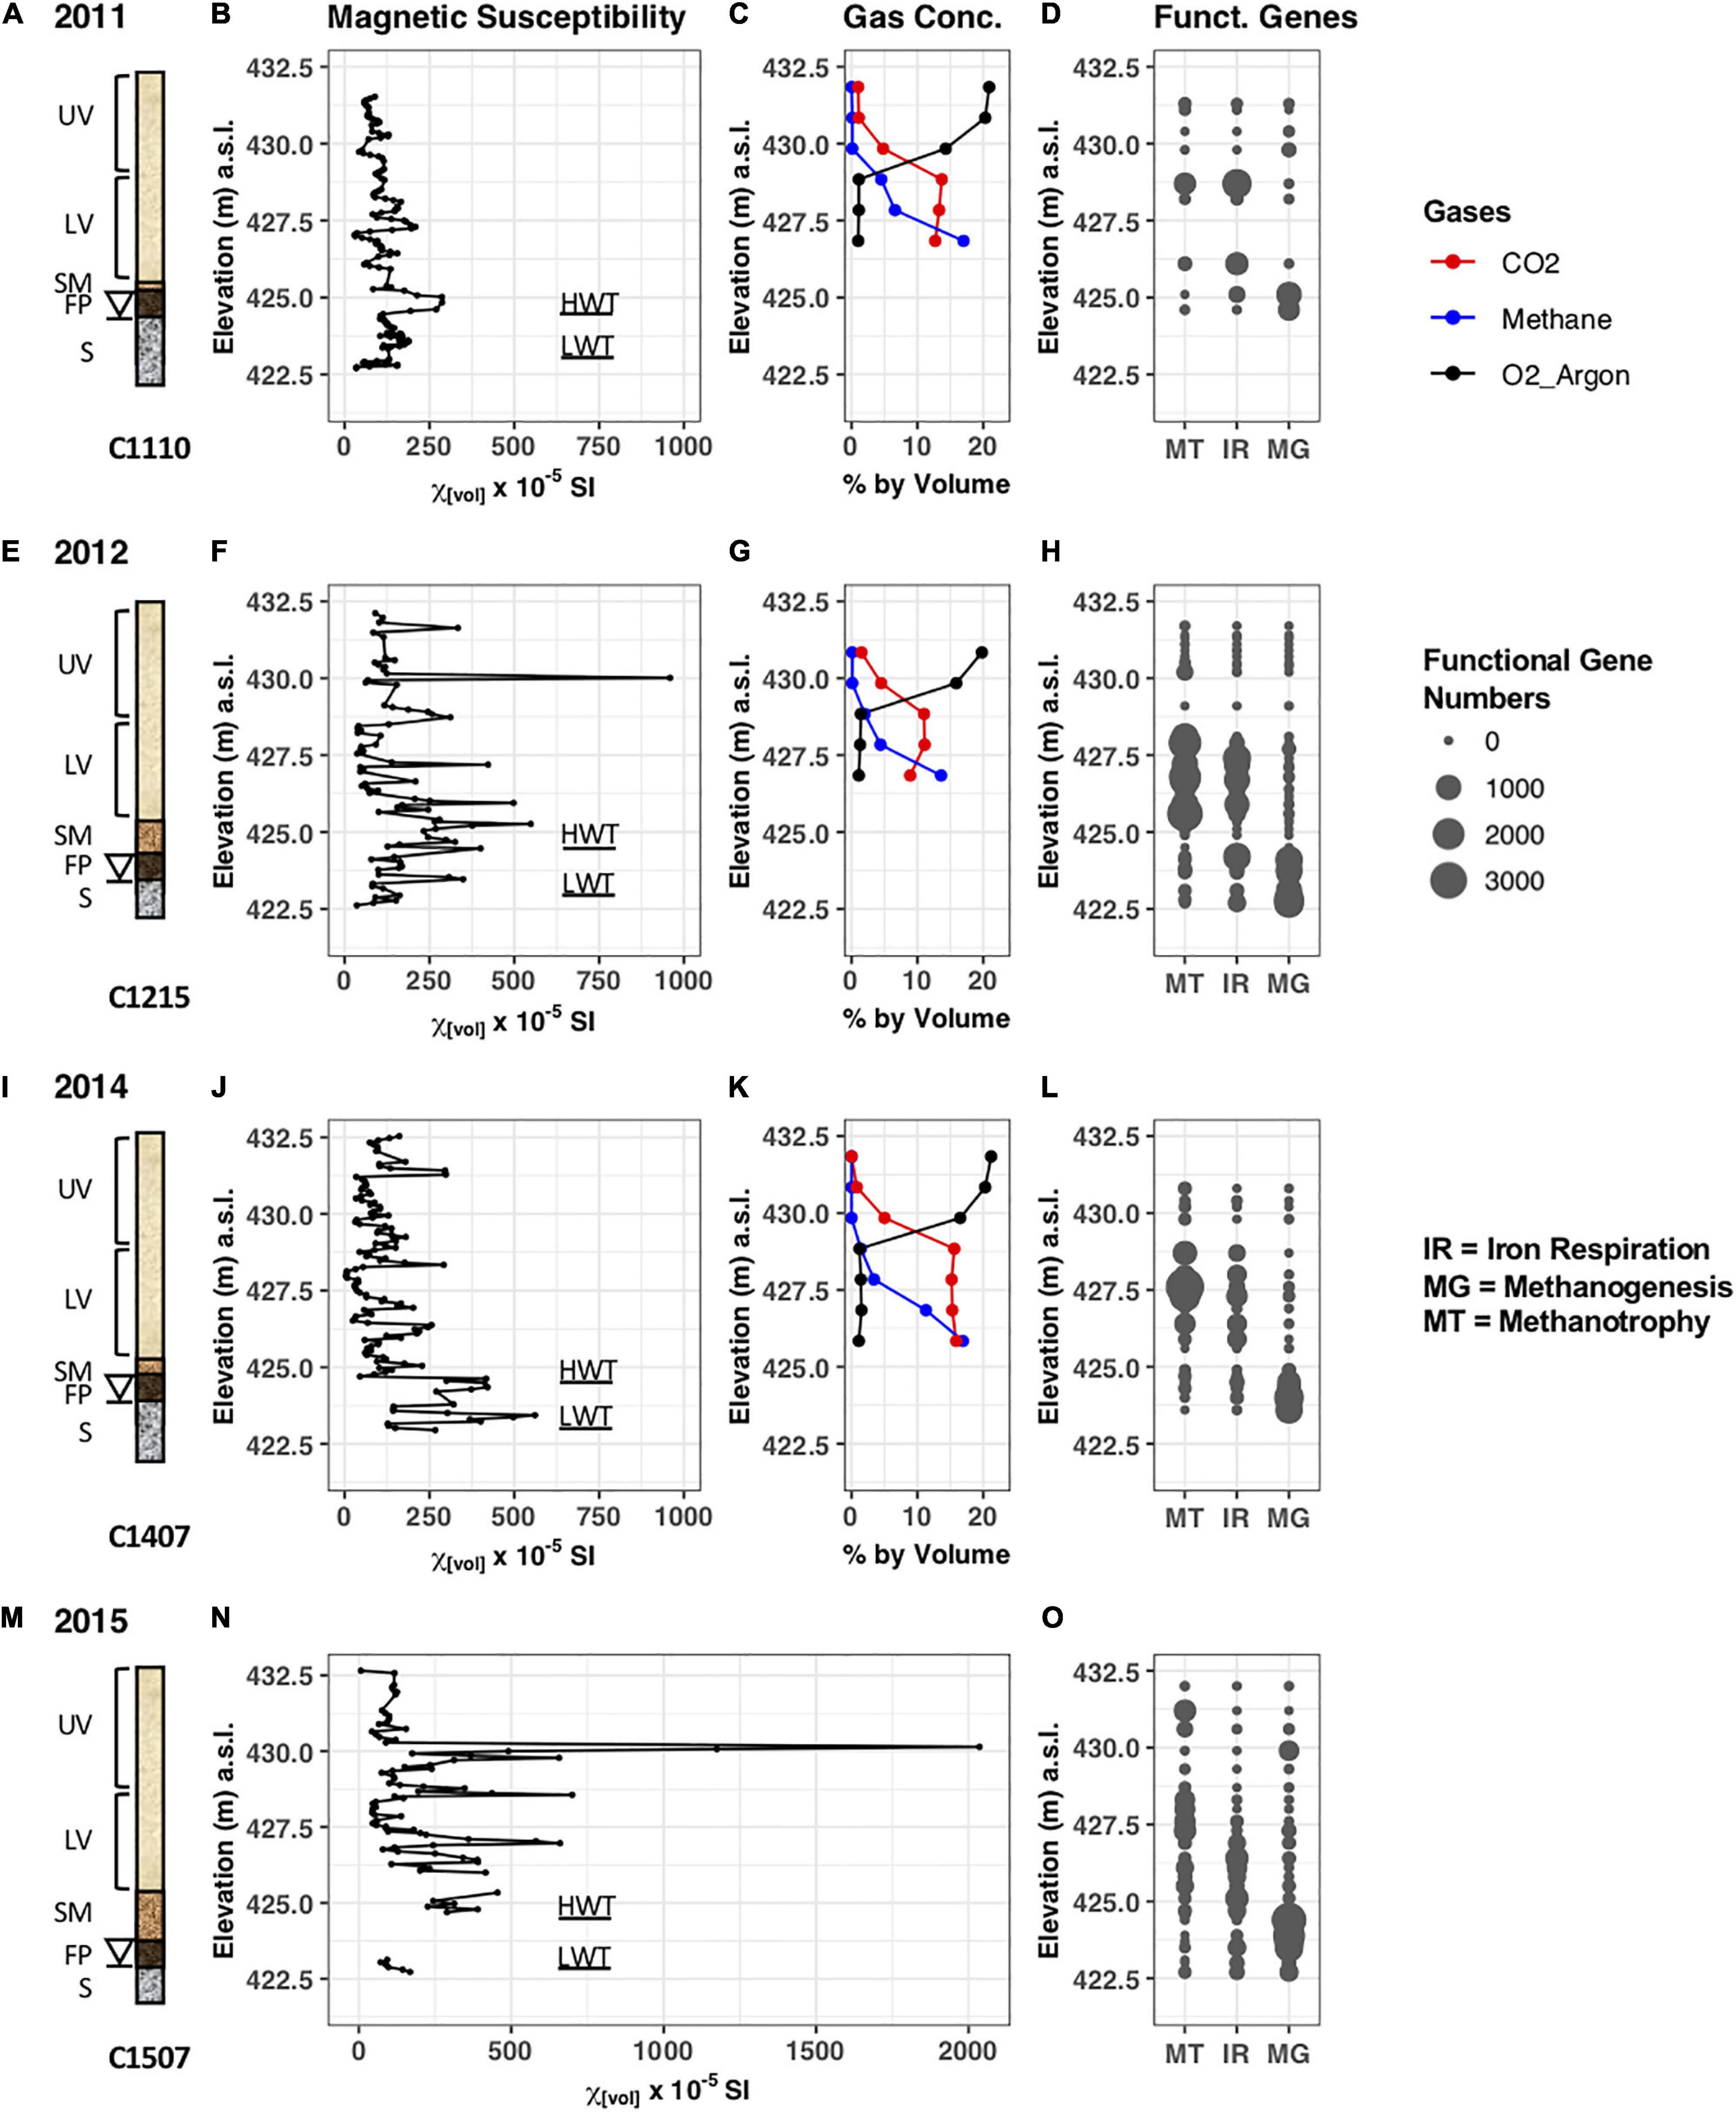
Figure 2. Data collected pertaining to the cores retrieved in years 2011, 2012, 2014, and 2015. (A,E,I,M) Schematic drawing of the cores C1110, C1215, C1407, and C1507 retrieved from the north oil pool. The elevations of the smear zone, free-phase product, and saturated zone vary year to year due to the fluctuating water table (denoted by a triangle). UV, upper vadose zone; LV, lower vadose zone; SM, smear zone; FP, free-phase oil zone; S, saturated zone; HWT, high water table; LWT, low water table. (B,F,J,N) Magnetic susceptibility of sediments acquired in the years 2011, 2012, 2014, and 2015. (C,G,K) Gas concentrations (in % by volume) in well 601G measured in 2011, 2012, and 2014. (D,H,L,O) Predicted number of functional genes in the samples identified by PICRUSt. MT, Methanotrophy; IR, Iron respiration; MG, Methanogenesis.
Magnetic Susceptibility (MS)
Sediments were sampled from the cores, and subjected to MS measurements in the laboratory, augmenting our previous in situ measurements that were taken at the Bemidji site (Atekwana et al., 2014; Lund et al., 2017). For core 1110, volume MS measurements ranged from a low of 29 × 10–5 SI at 427.0 m to a peak of 287 × 10–5 SI at 424.8 m at the water table (Figure 2B). In addition, there were several intermediate peaks found with one more pronounced peak in the vadose zone at 427.3 with 209 × 10–5 SI and another one in the saturated zone at 423.6 with a MS value of 188 × 10–5 SI. The MS measurements for core C1215 collected in 2012 varied from a low of 36 × 10–5 SI at 422.6 m to a peak of 959 × 10–5 SI at 430.1 m in the vadose zone (Figure 2F). The second largest MS peak occurred in the smear zone at 425.2 m, with a measurement of 549 × 10–5 SI. Several other peaks were found around the water table and in the lower vadose zone with values between 350 and 500 × 10–5 SI. No MS measurements were taken in 2013.
Core C1407 displayed several higher peaks around the water table with values above 350 × 10–5 SI, including the highest peak of 561 × 10–5 SI at 423.4 m (Figure 2J). Interestingly, core 1507 collected in 2015 showed an extremely high peak with MS values up to 2,000 × 10–5 SI in the upper vadose zone (Figure 2N), at a similar depth compared to highest MS peak found in the core retrieved in 2012. Several other peaks with MS values above 500 × 10–5 SI occurred in the lower vadose zone. Unfortunately, a core section from around the water table was destroyed during transport and MS could not be measured. The elevated MS values found around the water table and in the free-phase petroleum in the cores from 4 different years are at similar depths that exhibited elevated MS values during the in situ measurements at the Bemidji site (Atekwana et al., 2014).
Gas Concentrations
Gas concentrations were measured in years 2011, 2012, and 2014 in well 601G, which is closest (∼5 m) to the core locations in the free-phase petroleum. Based on the limitations of the gas-chromatographic method used, oxygen and argon could not be separated and are therefore plotted together (Earth’s atmosphere consists of 20.95% and 0.934% argon). Figures 2C,G,K show that oxygen concentrations decreased with increasing depths, while methane concentrations increased in the lower depths in all 3 years. Maximum methane concentrations were measured in 2011 and 2014 with 17% at the lowest depths. The CO2 concentrations varied between 9 and 16% below 428.8 m. The O2-CO2 transition zone was at ∼429.4 m, whereas the O2-CH4 transition zone was at ∼428.8 m. The changes in concentration of these gasses indicate that sediments were anoxic below 428.8 m. No gas data were available from well 601G for 2015.
Characterization of Microbial Community Structure
Analysis of Replicates
Sediment samples were collected from the center of the retrieved cores with the spacing of 15 cm along the complete core length and DNA was isolated from these samples. First, we wanted to determine the reliability of our DNA isolation method and performed the DNA isolation and subsequent high-throughput DNA sequencing for core C1407 in duplicates. A UniFrac analysis was performed, which is a phylogenetic method for comparing microbial communities. It shows the relatedness of the microbial communities from each sample in a 2-dimensional space (Figure 3). This figure illustrates that (i) the replicate samples clustered very close together, and (ii) that there are three larger groupings which represent the free-phase oil zone (bottom left), the lower (bottom right) and the upper vadose zone (top). The two replicate smear zone samples were spaced somewhat away from the free-phase samples in the direction toward the lower vadose samples (Figure 3).
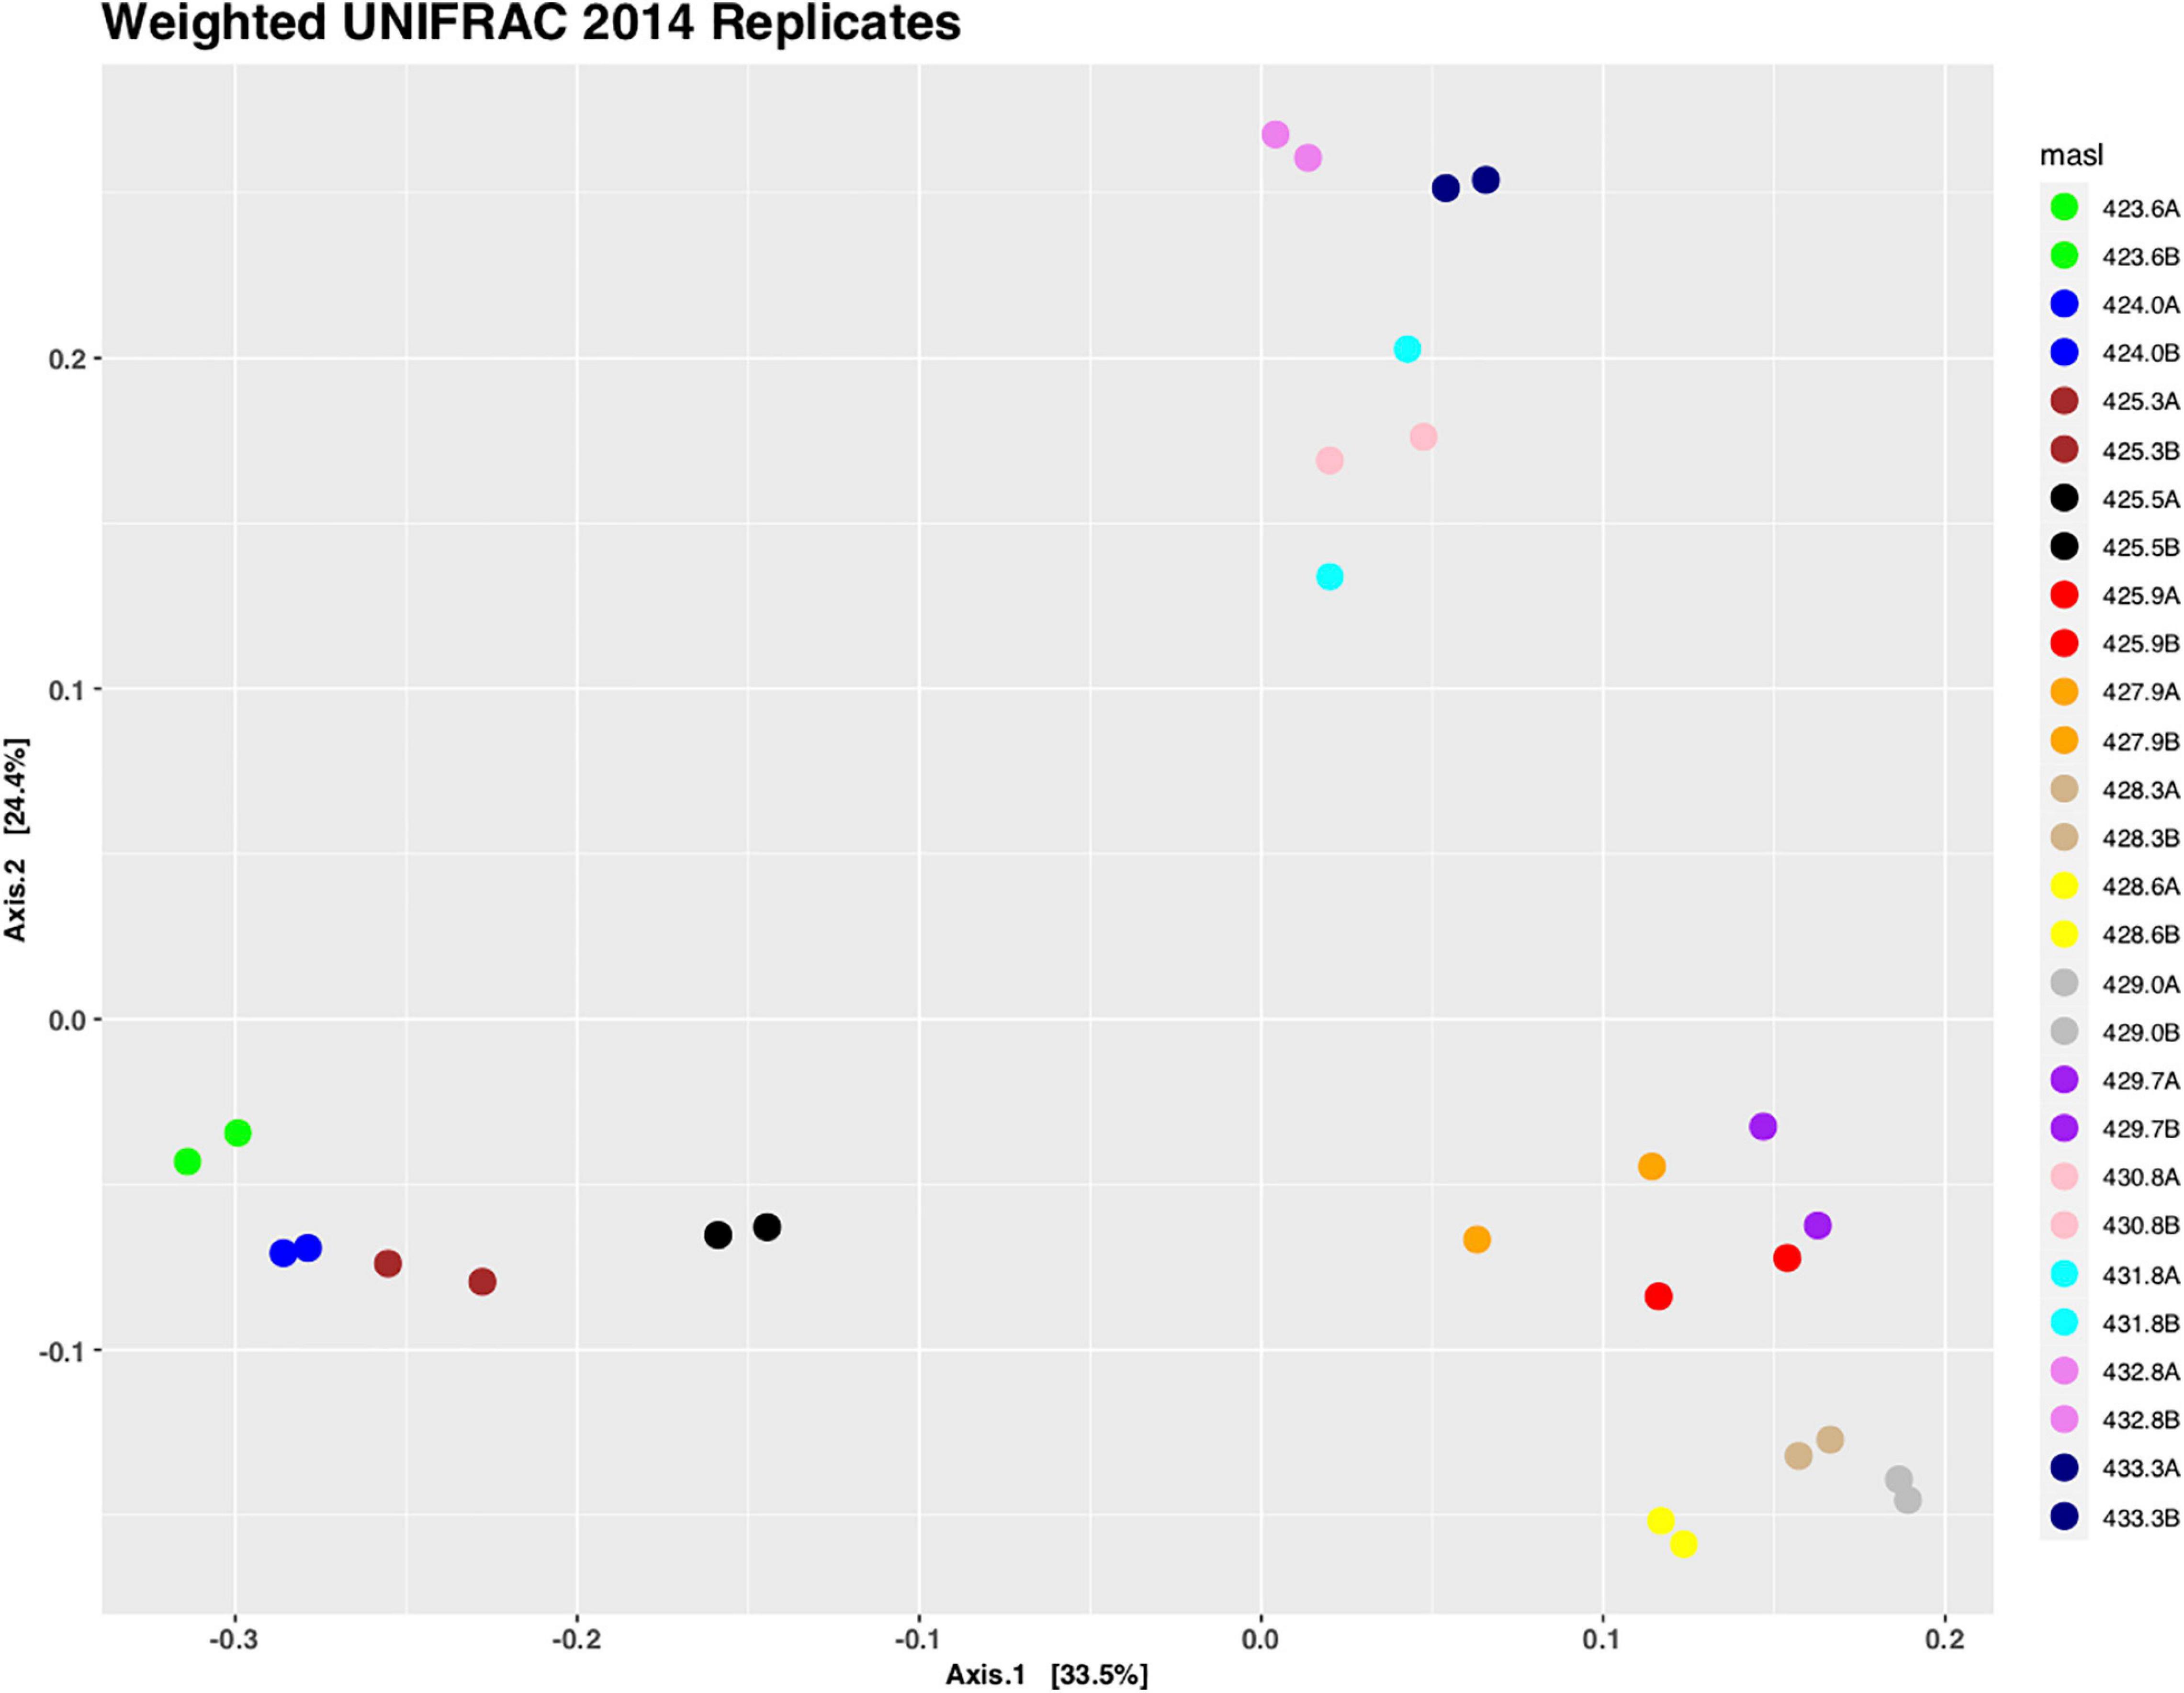
Figure 3. Principal coordinate analysis (PCoA) of weighted UniFrac distances of replicate samples taken from core 1407. Replicate samples are shown in identical colors and sample names are based on the depth they were taken from. Replicates group closely together using PERMANOVA (R2 = 1, p = 1).
Comparison of Two Different Extraction Methods
During the 5 years of this study, we optimized the DNA extraction techniques. For samples collected in 2011–2013, we used a commercially available kit, while for the soil samples collected in 2014 and 2015, we used a more laborious method, not involving a kit, which was published by Zhou et al. (1996). Some variations are expected through the use of different extraction methods (Guo and Zhang, 2013). Nevertheless, Supplementary Figure 1 shows that the two different methods applied to the same sediment sample collected from the free-phase oil zone displayed a similar microbial community composition. Deltaproteobacteria were found in similar high abundance with both methods (∼40%), while there seems to be a slight bias toward Actinobacteria in the DNA extracted with the commercial kit (25.1% vs. 14.2%) and a bias toward Euryarchaeota (3.9% vs. 8.5%) and Betaproteobacteria (5.5 % vs. 10.9 %) in the DNA extracted with the more laborious DNA extraction method. Overall, despite these biases, both methods revealed a quite similar microbial community composition (Supplementary Figure 1).
Analysis of Microbial Phyla
The abundance of microbial phyla according to depth is shown in Figure 4 for the samples collected during the five different years. Each zone has a characteristic phyla distribution with little year-to-year variations. In the free-phase oil zone, shown at the bottom of the graphs, Deltaproteobacteria were found in high relative abundance. They were accompanied by methanogenic Euryarchaeota. The smear and lower vadose zone were dominated by Alpha- and Beta-Proteobacteria, representing methanotrophs and iron-reducers, respectively. Highly abundant phyla in the upper vadose zone were common soil bacteria from the Actinobacteria and Acidobacteria phyla (Figure 4).
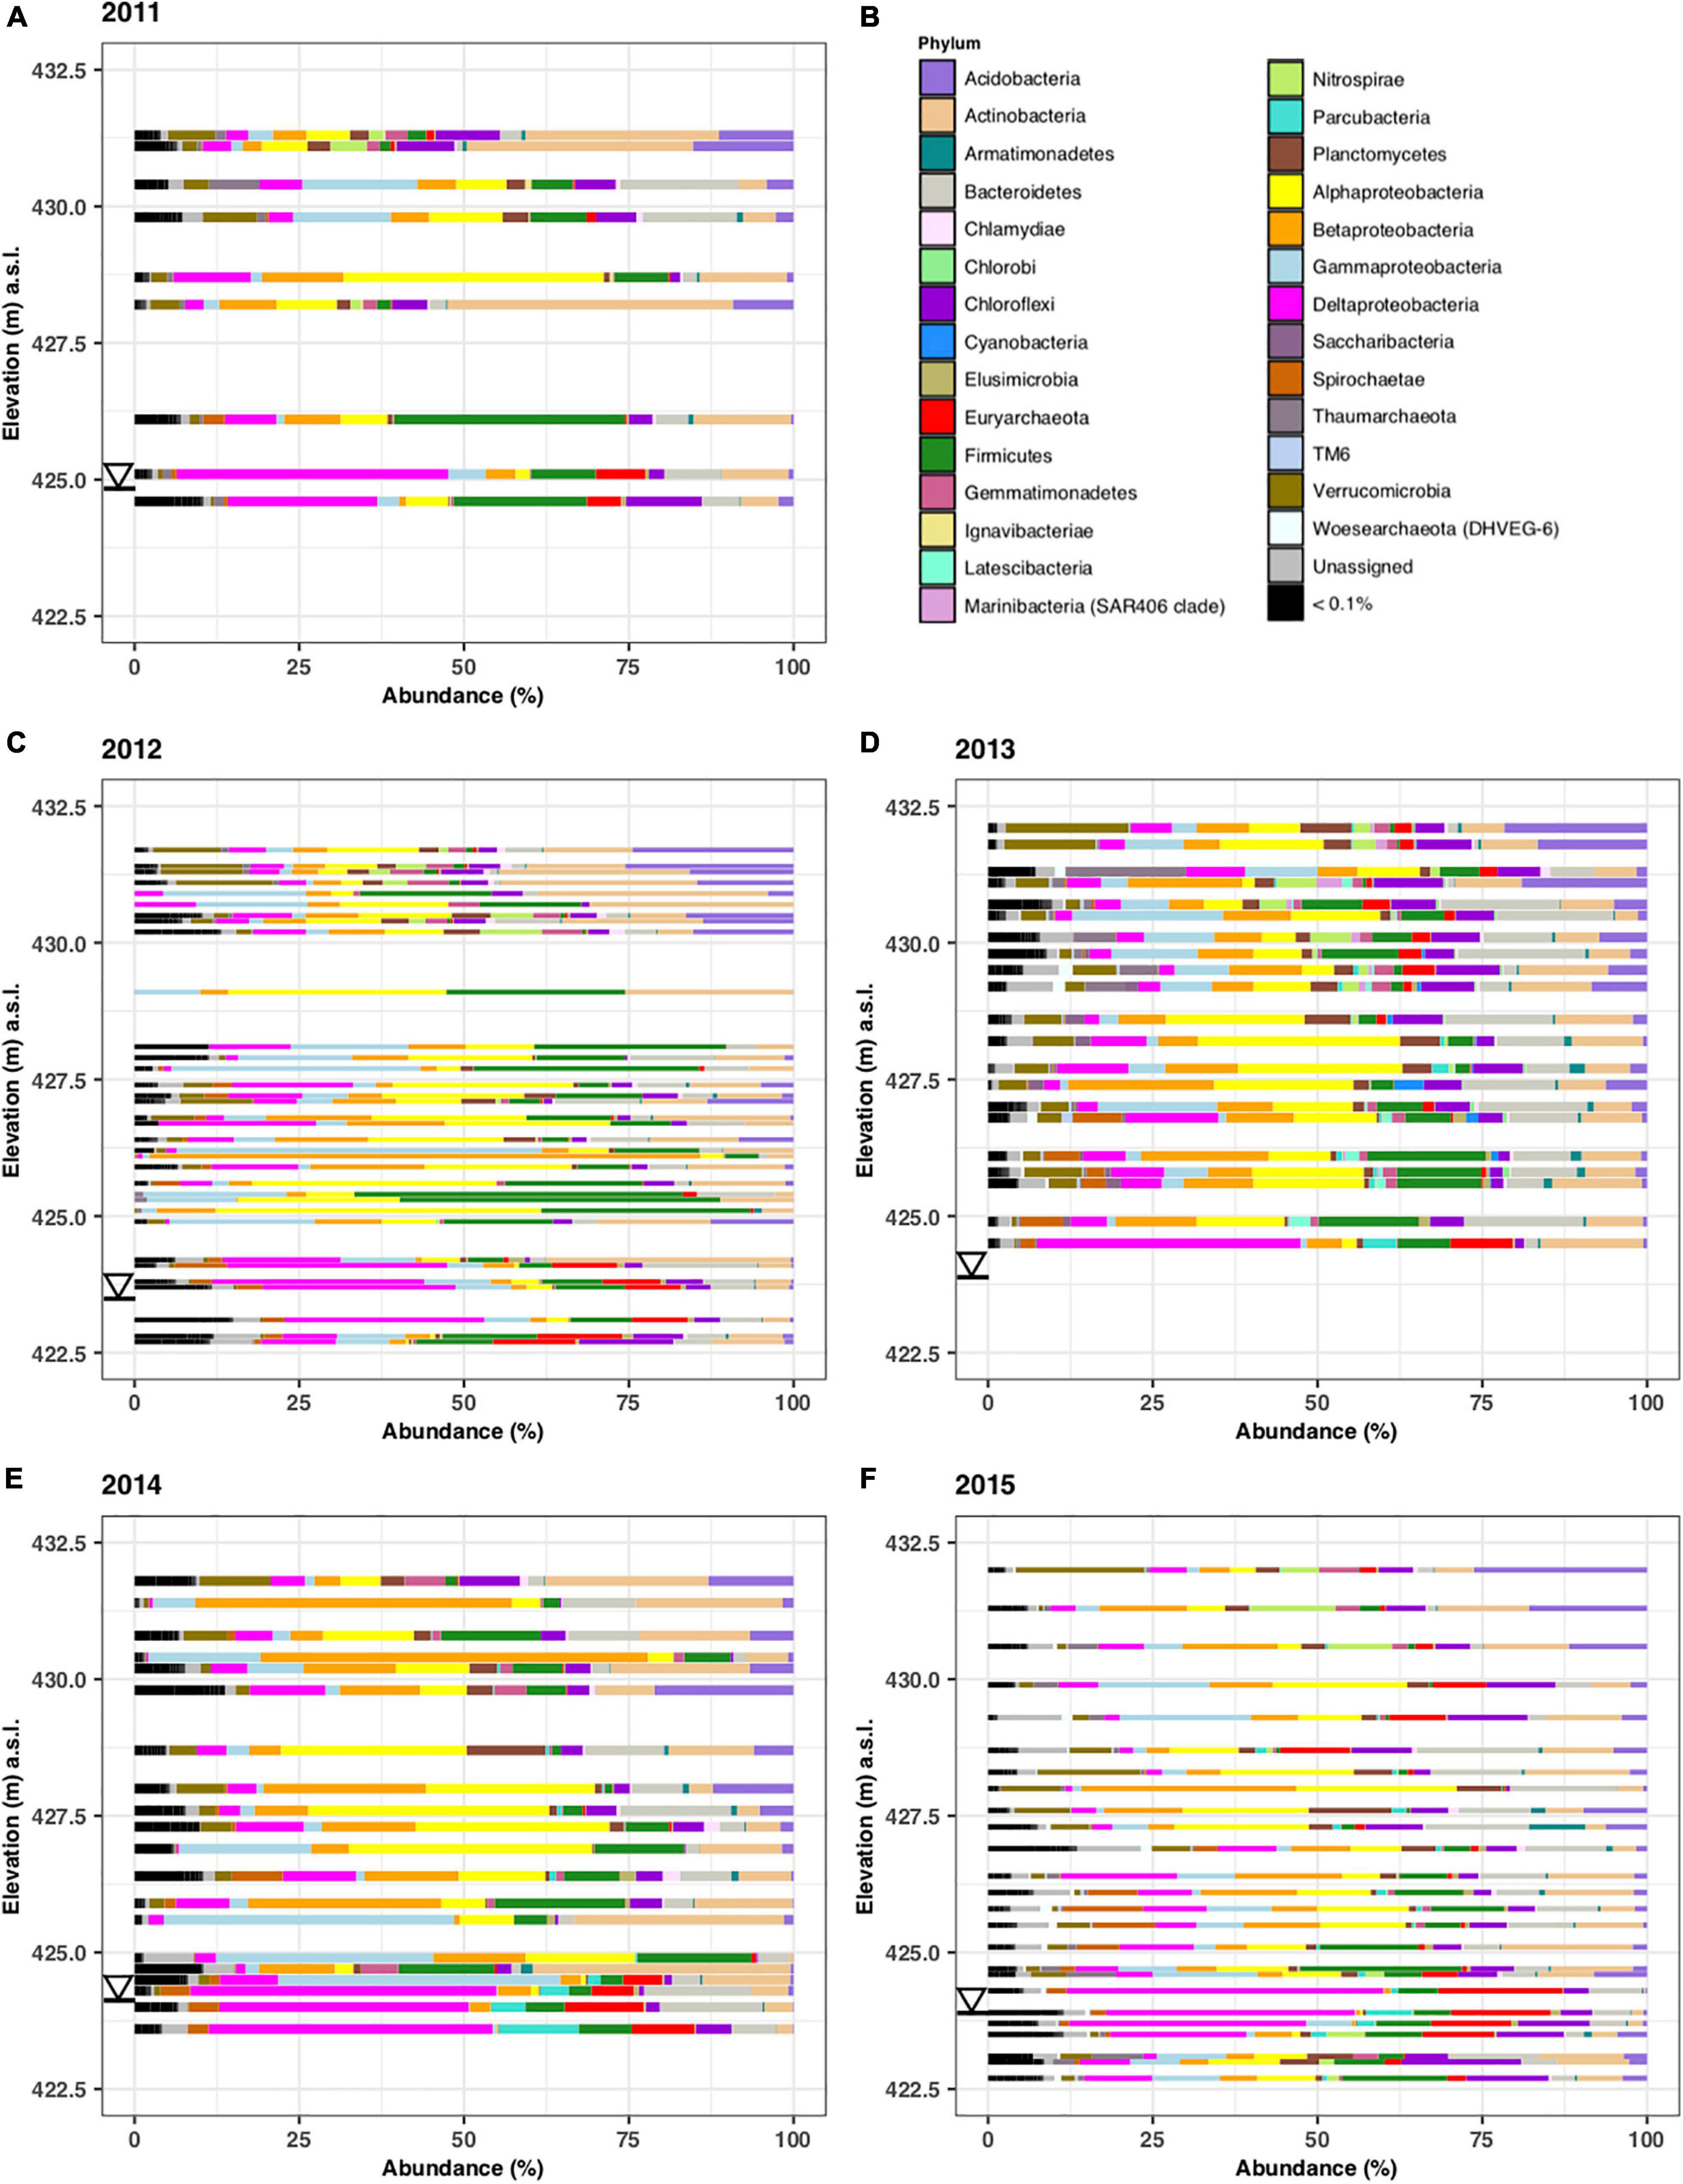
Figure 4. Microbial phyla identified in samples collected along the complete length of sediment cores collected in years 2011–2015. The microbial abundance in % is plotted on the x-axis while the elevation from which the core was taken is plotted in meters above surface level (m.a.s.l.) on the y-axis. Samples were from core C1110 (A), C1215 (C), C1308 (D), C1407 (E), and C1507 (F). Only phyla that constituted >0.1% are shown by name (B). The triangle denotes the water level in the different years.
Comparison of Free-Phase Samples With Samples From the Dissolved Phase
A comparison between the microbial communities present in the free-phase oil zone versus those present in a location in the dissolved-phase plume was warranted. Lower MS values were found around the water table in the dissolved-phase plume than in the free-phase oil (Atekwana et al., 2014). It was no problem isolating sufficient microbial DNA quantities for downstream applications from the cores retrieved in the free-phase petroleum zone. It seems that the overabundance of hydrocarbons at the water table resulted in active microbial communities producing sufficient biomass for making our DNA isolations successful throughout the length of the core. Unfortunately, and probably because of the much lower hydrocarbon concentration ∼100 m away from the free-phase oil (Figure 1A), there seems to be much less biomass present in the dissolved plume. We were only able to isolate sufficient DNA quantities for reliable DNA sequencing from samples around the water table from the core retrieved in the dissolved phase. A UniFrac analysis shows that the samples from around the water table of the dissolved phase core clustered together on the one side of the diagram, whereas the samples taken from around the water table from free-phase cores clustered on the other side, far away from each other (Figure 5). This is an indication that the microbial community composition differs greatly between these two groups of samples. Also, the microbial phyla composition and the top 10 most abundant genera at this site were completely different from the ones found in the free-phase oil zone (Supplementary Figure 2 and Supplementary Table 2).
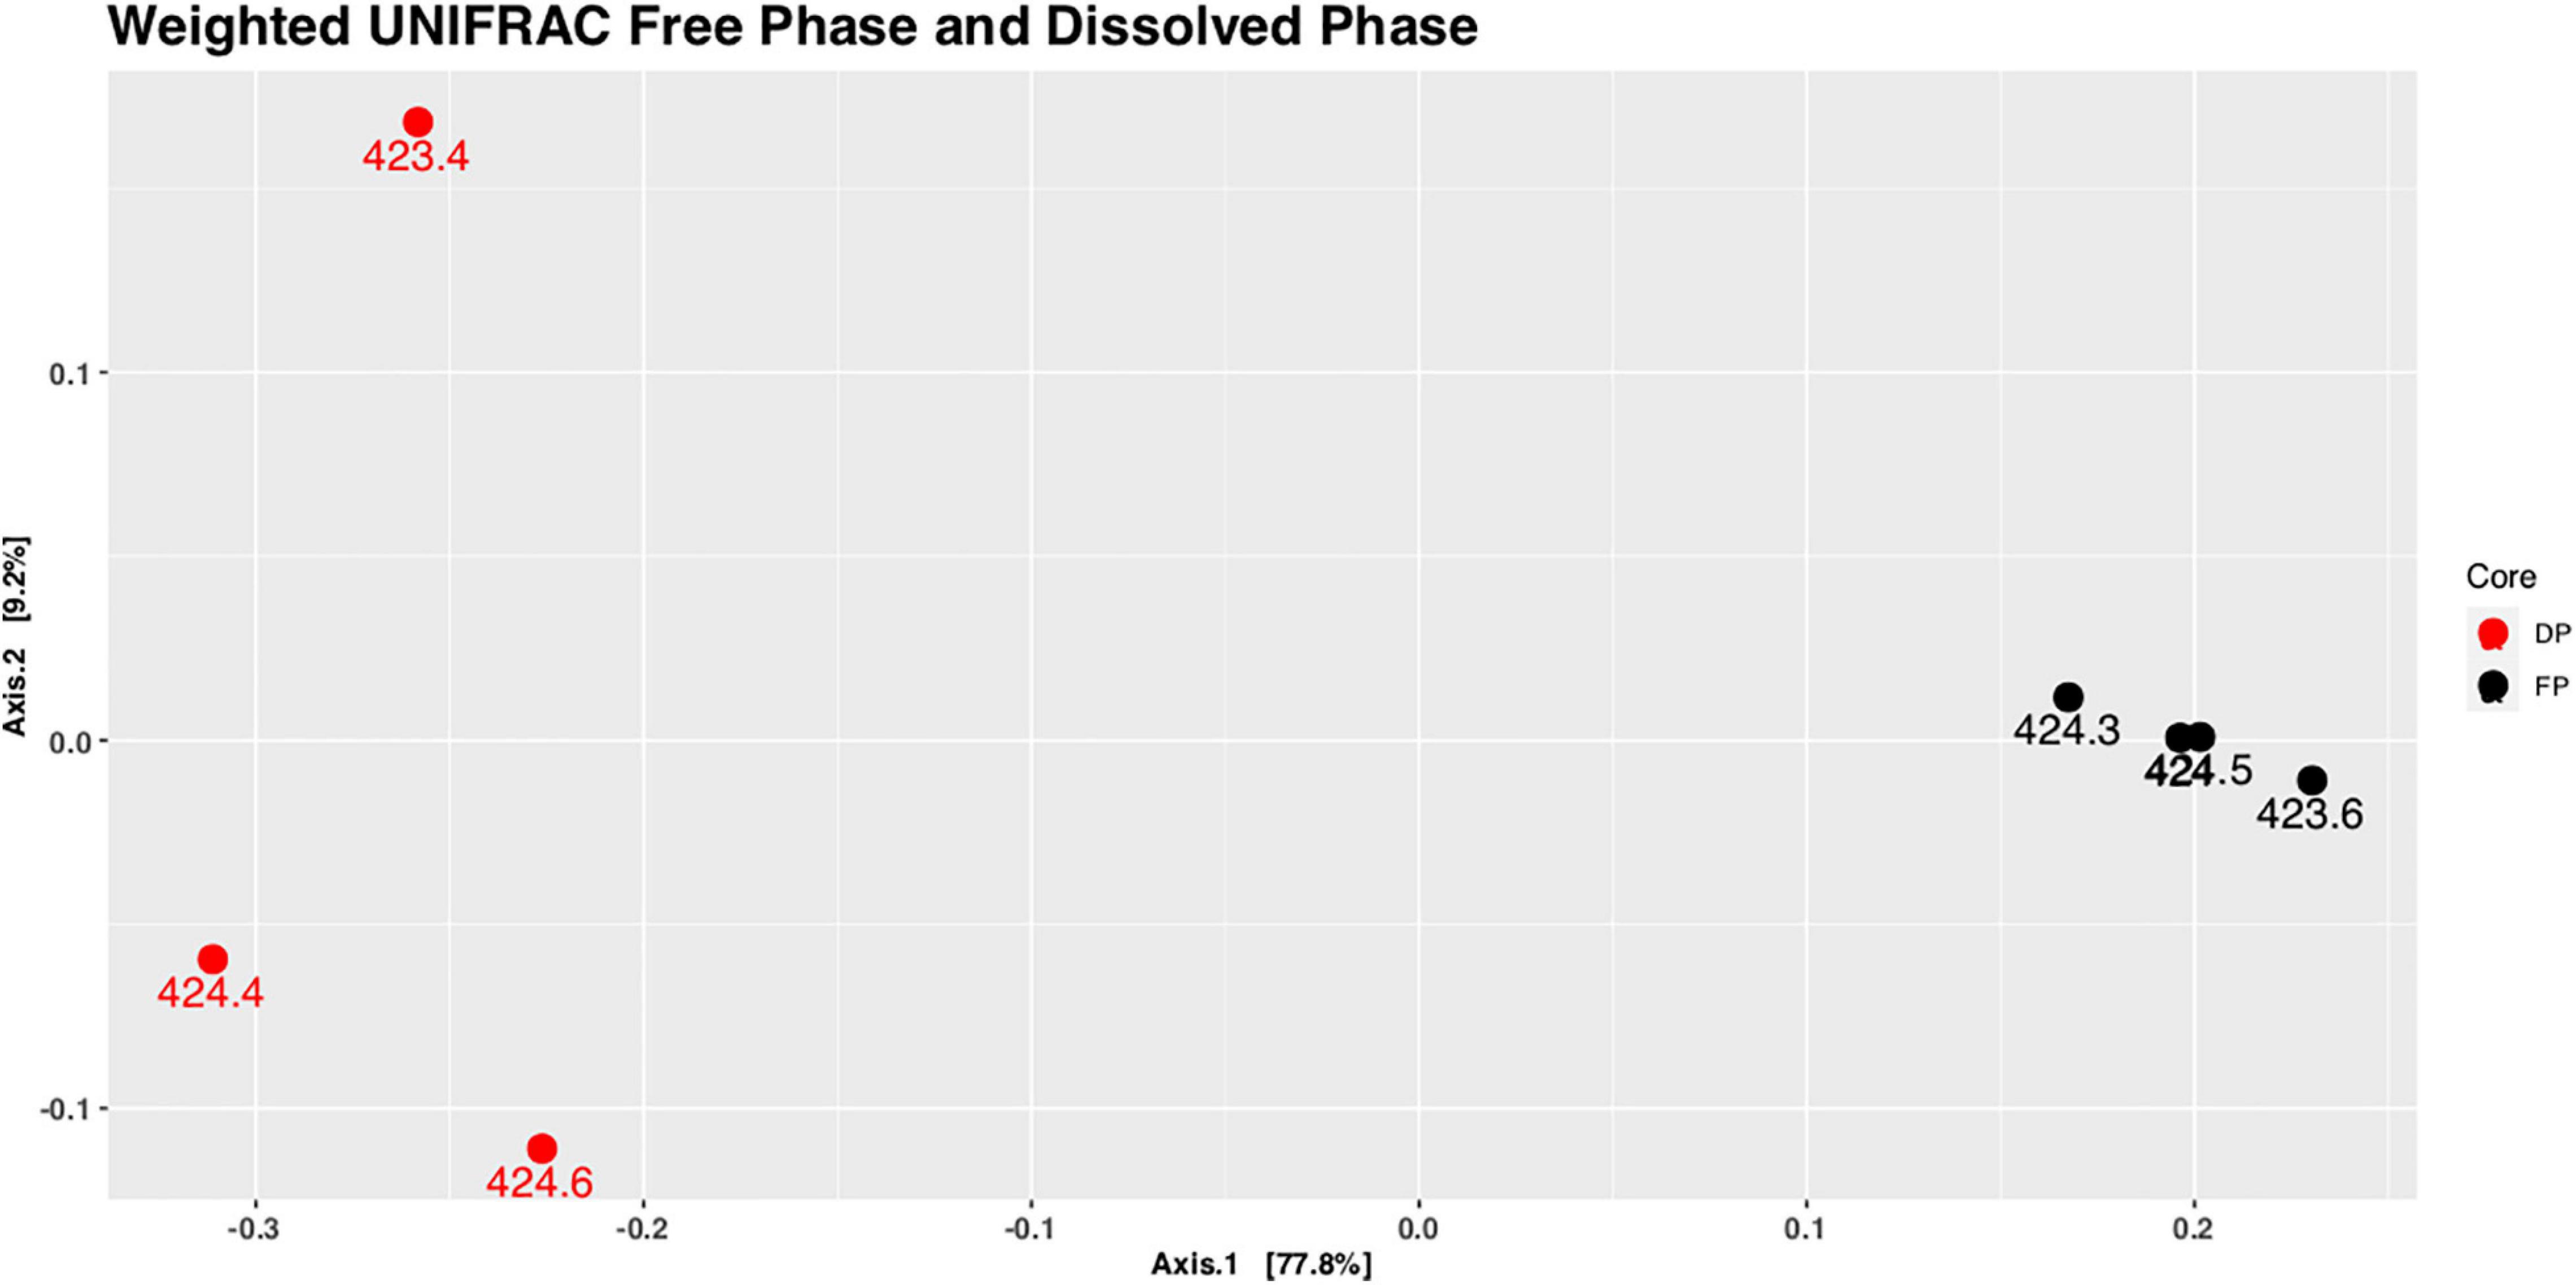
Figure 5. Principal coordinate analysis (PCoA) plot of weighted UniFrac distances of samples taken from the water table in the free-phase oil zone (core 1407; FP, black) and from the water table in the dissolved-phase plume (core 1411; DP, red). The dissolved phase samples group separately from the free-phase oil samples using PERMANOVA (R2 = 0.767, p = 0.035). The labels for the points denoting the samples from 424.0 to 424.5 m (a.s.l.) of core 1407 overlap.
Analysis of Most Abundant Microbial Genera in the Free-Phase Location
Table 1 shows the results using the linear discriminant analysis (LDA) effect size (LEfSe) method, which identifies the most abundant and characteristic bacterial taxa in different sample groups (Segata et al., 2011). The most abundant and characteristic bacterial genera for a specific sample group receive a high LDA score and are considered to be a “biomarker” for that specific group of samples and are discussed below according to the zonation in the free-phase oil cores.
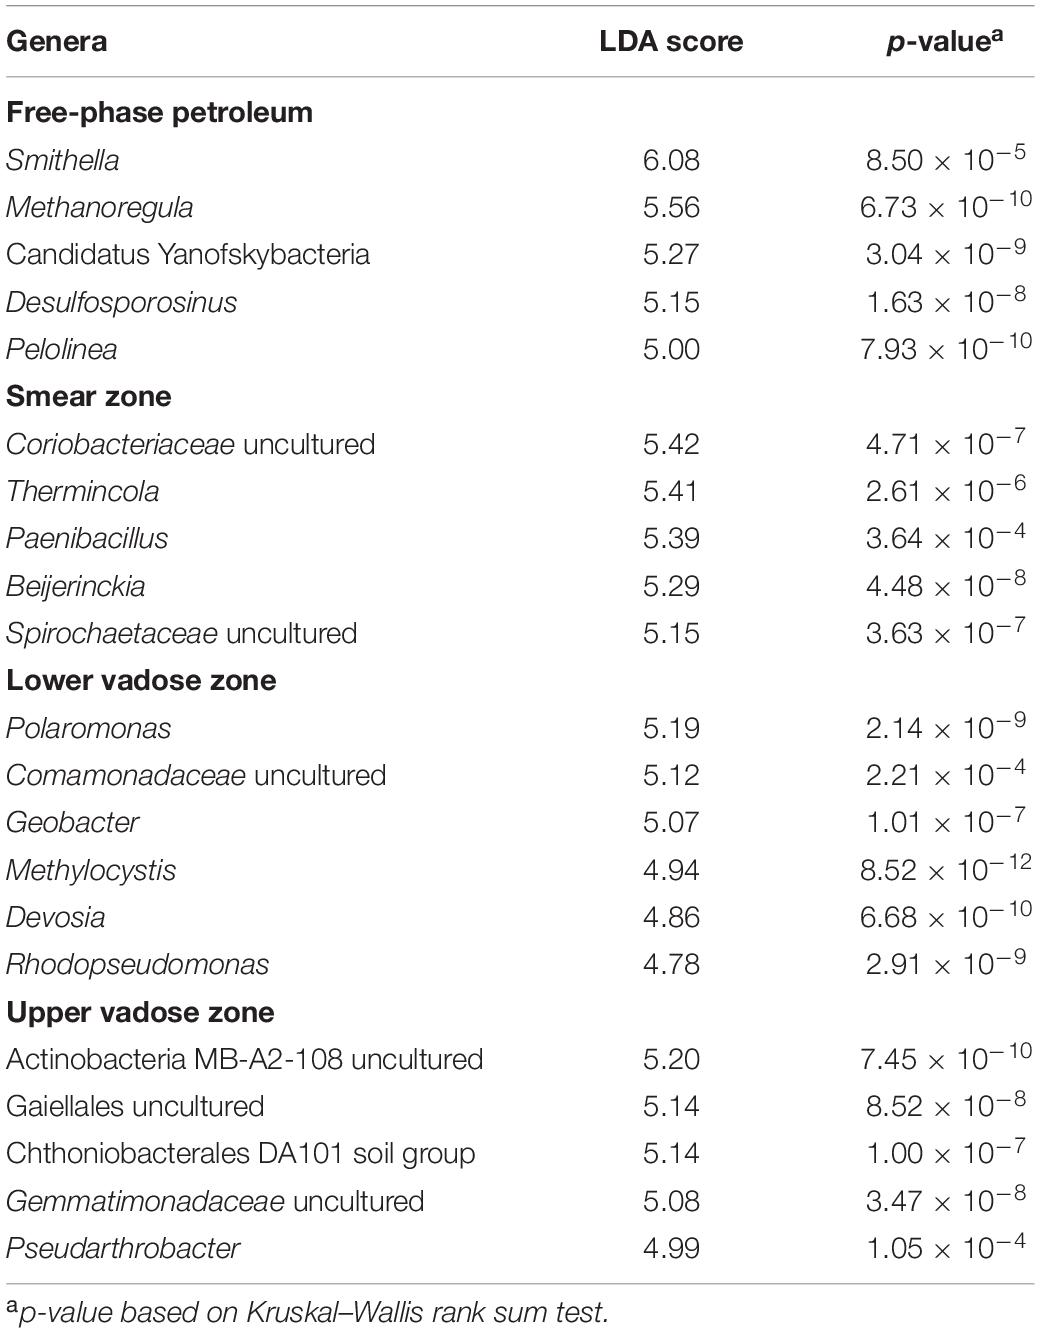
Table 1. Top genera identified as biomarkers for the four different zones based on Linear Discriminant Analysis (LDA) scores.
Free-phase oil zone
The genus found in the free-phase oil zone with the highest LDA score was Smithella. Laboratory-grown Smithella is capable of propionate oxidation, and it was found to be the most abundant long-chain alkane degrader in methanogenic enrichment cultures (Liu et al., 1999; de Bok et al., 2001; Gray et al., 2011; Cheng et al., 2013; Tan et al., 2014; Wawrik et al., 2016; Qin et al., 2017; Xia et al., 2019; Ji et al., 2020). To metabolize the long-chain alkanes, Smithella activates them by fumarate addition and then excretes CO2 and H2, which, in turn, are being used by methanogens. The genus with the second highest score found in all samples of the free-phase oil zone was a hydrogenotrophic methanogen, Methanoregula (Brauer et al., 2011). Hydrogenotrophic methanogens use CO2 and H2 to synthesize methane. Methanoregula species have been isolated from acidic peat bogs and from methanogenic sludge used for the treatment of brewery effluents (Brauer et al., 2011; Yashiro et al., 2011). In addition, an unclassified genus of the Candidatus Yanofskybacteria was found to be a biomarker in the free-phase oil samples. This candidate genus belongs to the newly described superphylum Patescibacteria and is a member of the Parcubacteria (formerly OD1), which are prevalent in anoxic groundwater, sediments and aquifers. Parcubacteria are of very small size, have reduced genomes, and seem to depend on other members of the microbial community for obtaining essential metabolites (Brown et al., 2015; Tian et al., 2020). Candidatus Yanofskybacteria have frequently been found to be associated with anoxic carbon transformation and hydrogen generation (Castelle et al., 2015; Solden et al., 2016; Jaffe et al., 2020). Another biomarker in the free-phase oil zone was Desulfosporosinus. This spore-forming bacterium has been isolated from gasoline-contaminated aquifers (Robertson et al., 2000) and has been identified as a syntrophic toluene degrader in a methanogenic microbial community (Abu Laban et al., 2015). Another high-scoring microorganism in the free-phase oil zone was Pelolinea from the Chloroflexi phylum, which has been shown to be involved in the degradation of phenolic compounds (Chen et al., 2020). All the above-mentioned genera are known to be strict anaerobes.
Smear zone
Uncultured Coriobacteriaceae, which belong to the Actinobacteria phylum, had the highest LDA score in the smear zone. These obligate anaerobes are capable of both, fermentation and anaerobic respiration. Lentini et al. (2012) found representatives of uncultured Coriobacteriaceae in enrichment cultures with ferrihydrite, goethite and hematite as electron acceptor. Coriobacteriaceae have also recently been identified in methanic environments such as terrestrial serpentinizing fluid seeps (Woycheese et al., 2015), deep groundwater (Hernsdorf and Amano, 2017), marine enrichment cultures undergoing benzoate degradation with concurrent iron reduction and methanogenesis (Aromokeye et al., 2020) and at a thermophilic electromethanogenic biocathode (Kobayashi et al., 2017). Thermincola, a Gram-positive bacterium of the Peptococcaceae family, also exhibited a high score for the smear zone. In an enrichment culture, Thermincola ferriacetica was found to be dominant under ferrihydrite-reducing conditions (Kato et al., 2019), and the formation of magnetite was observed when amorphous Fe(III) hydroxide was used as electron acceptor for T. ferriacetica (Zavarzina et al., 2007). Magnetite could serve as an alternative electron acceptor for T. ferriacetica in these sediments (Zavarzina et al., 2007). Also having a high score in the smear zone was Paenibacillus, a facultative anaerobic endospore-former of the Firmicutes phylum. Paenibacillus strains have been frequently isolated from soil and they can degrade a variety of aliphatic and aromatic hydrocarbons (Grady et al., 2016). Despite considered being aerobic, the Alphaproteobacterium Beijerinckia was also a biomarker of the smear zone, and in addition to its ability to fix atmospheric nitrogen, it is able to oxidize a wide variety of organic compounds, including methane and methanol (Wegner et al., 2020).
Lower vadose zone
The highest LDA scores for the lower vadose zone were assigned to two members of the Betaproteobacteria, Polaromonas and an uncultured genus of the Comamonadaceae. Strains of Polaromonas were initially isolated in Antarctica, but have now been found in many environments. Polaromonas has been reported to be instrumental in the degradation of pollutants, including aliphatic, aromatic, polycyclic and chlorinated hydrocarbons (Mattes et al., 2008). The uncultured member of the Comamonadaceae seems to be related to Rhodoferax, an anaerobic bacterium that respires short chain fatty acids by iron reduction (Finneran et al., 2003). A well-studied iron-reducing and hydrocarbon-degrading bacterium, Geobacter, was also a marker for the lower vadose zone (Lovley et al., 1989). Geobacter is known for synthesizing magnetite during the reduction of Fe(III)-oxyhydroxide (Byrne et al., 2015) and magnetite has been shown to stimulate direct electron transfer (DIET) during syntrophic methanogenesis (Kato et al., 2012; Lovley, 2017). Another biomarker for the lower vadose zone was Methylocystis. The aerobic, methane-oxidizer Methylocystis has been found to be widely distributed in wetlands, peatlands and aquifers. This wide distribution is explained by Methylocystis’ extended metabolic capability to use acetate or ethanol in the absence of methane and to fix dinitrogen (Han et al., 2018). Methylocystis has also been detected in groundwater contaminated with heavy metals including arsenic, displaying genes for As(III) oxidation and As(V) reduction (Shi et al., 2018; Danczak et al., 2019). High LDA scores for the lower vadose zone were also assigned to the Alphaproteobacteria Devosia and Rhodopseudomonas. Devosia species have been isolated from diesel-contaminated soil (Ryu et al., 2008), while Rhodopseudomonas is known to be an iron-oxidizer that is able to take up electrons from solid iron and cathodes (Bose et al., 2014).
Upper vadose zone
The two most important biomarkers in the upper vadose zone were members of the Actinobacteria phylum. The first, carrying the designation MB-A2-108, was identified in methane hydrate-bearing, deep marine sediments off the Japanese coast (Reed et al., 2002; Zhang et al., 2016; Curd et al., 2018). The second was an uncultured member of the order Gaiellales. Not much is known about this deep-branching phylogenetic lineage, although one Gaiella species has been isolated from a deep mineral water aquifer in Portugal (Albuquerque et al., 2011). Also having a high LDA score in the upper vadose zone was the Chthoniobacterales DA101 soil group of the Verrucomicrobia phylum, which has been found to be extremely common in many soil samples analyzed with molecular methods (Brewer et al., 2016), as well as uncultured members of the Gemmatimonadaceae of the Gemmatimonadetes phylum that are widespread in nature and make up around 2% of soil microbial communities (Zhang et al., 2003). The genus Pseudarthrobacter was also indicative of the upper vadose zone. Pseudarthrobacter species have been isolated from sewage and were found to be able to degrade chlorophenol (Kim et al., 2008).
Analysis of Microbial Metabolism With PICRUSt
The high-throughput DNA sequencing of the 16S rRNA gene resulted in an overview of the microbial community structure at the different depths of the free-phase cores. From this phylogenetic information, we can estimate the metabolic capabilities of the indigenous microorganisms present with a program called PICRUSt (Phylogenetic Investigation of Communities by Reconstruction of Unobserved States; Langille et al., 2013). This program predicts the predominant metabolic pathways based on marker gene survey data (such as the 16S rRNA gene). Although this program was developed for the analysis of the intestinal microbiome, we extracted three pertinent metabolic pathways: methanogenesis, iron reduction and methanotrophy, which are plotted according to depth in Figures 2D,H,L,O. Confirming earlier reports (Bekins et al., 1999; Amos et al., 2005), it is obvious that the free-phase zone is methanic with a majority of methanogenesis genes found below 424.5 m. The majority of the iron reduction genes are present above the methanic zone, from ∼424.5 to 428 m. The majority of the genes that enable microorganisms to oxidize methane were found to overlap with the upper iron reduction zone at ∼426–429 m.
Iron Mineral Analysis
The iron mineral phases were determined for samples from selected depths of core C1407 and compared to the MS (Supplementary Figure 3). The highest MS was measured at 423.2 m, which is inside the free-phase oil zone. Coinciding, the highest concentrations of Fe(II) and magnetite were measured at the same depth. In addition, the FeII/FeIII ratio was the highest at this depth. Reactive and reducible Fe(III) in the form of ferrihydrite and hematite/goethite, respectively, was depleted in the lower depths, but showed higher concentrations between 424.4 and 424.8 m and close to the surface.
Linking Microbial Taxa With Magnetic Susceptibility
Figure 6 displays a diagram of non-metric multidimensional scaling (NMDS) for all samples from years 2011, 2012, 2014, and 2015 together with the 25 most abundant microbial taxa and the MS data as variable (shown as vector). Samples from the free-phase zone from 422.8 to 424.8 m grouped together with the genera Smithella, Methanoregula and Candidatus Yanofskybacteria and with the MS vector pointing into the direction of that grouping. The arrow length is proportional to the degree of correlation between the ordination and the MS as environmental variable, although the fitting of the vector was not highly significant (p-value of 0.48).
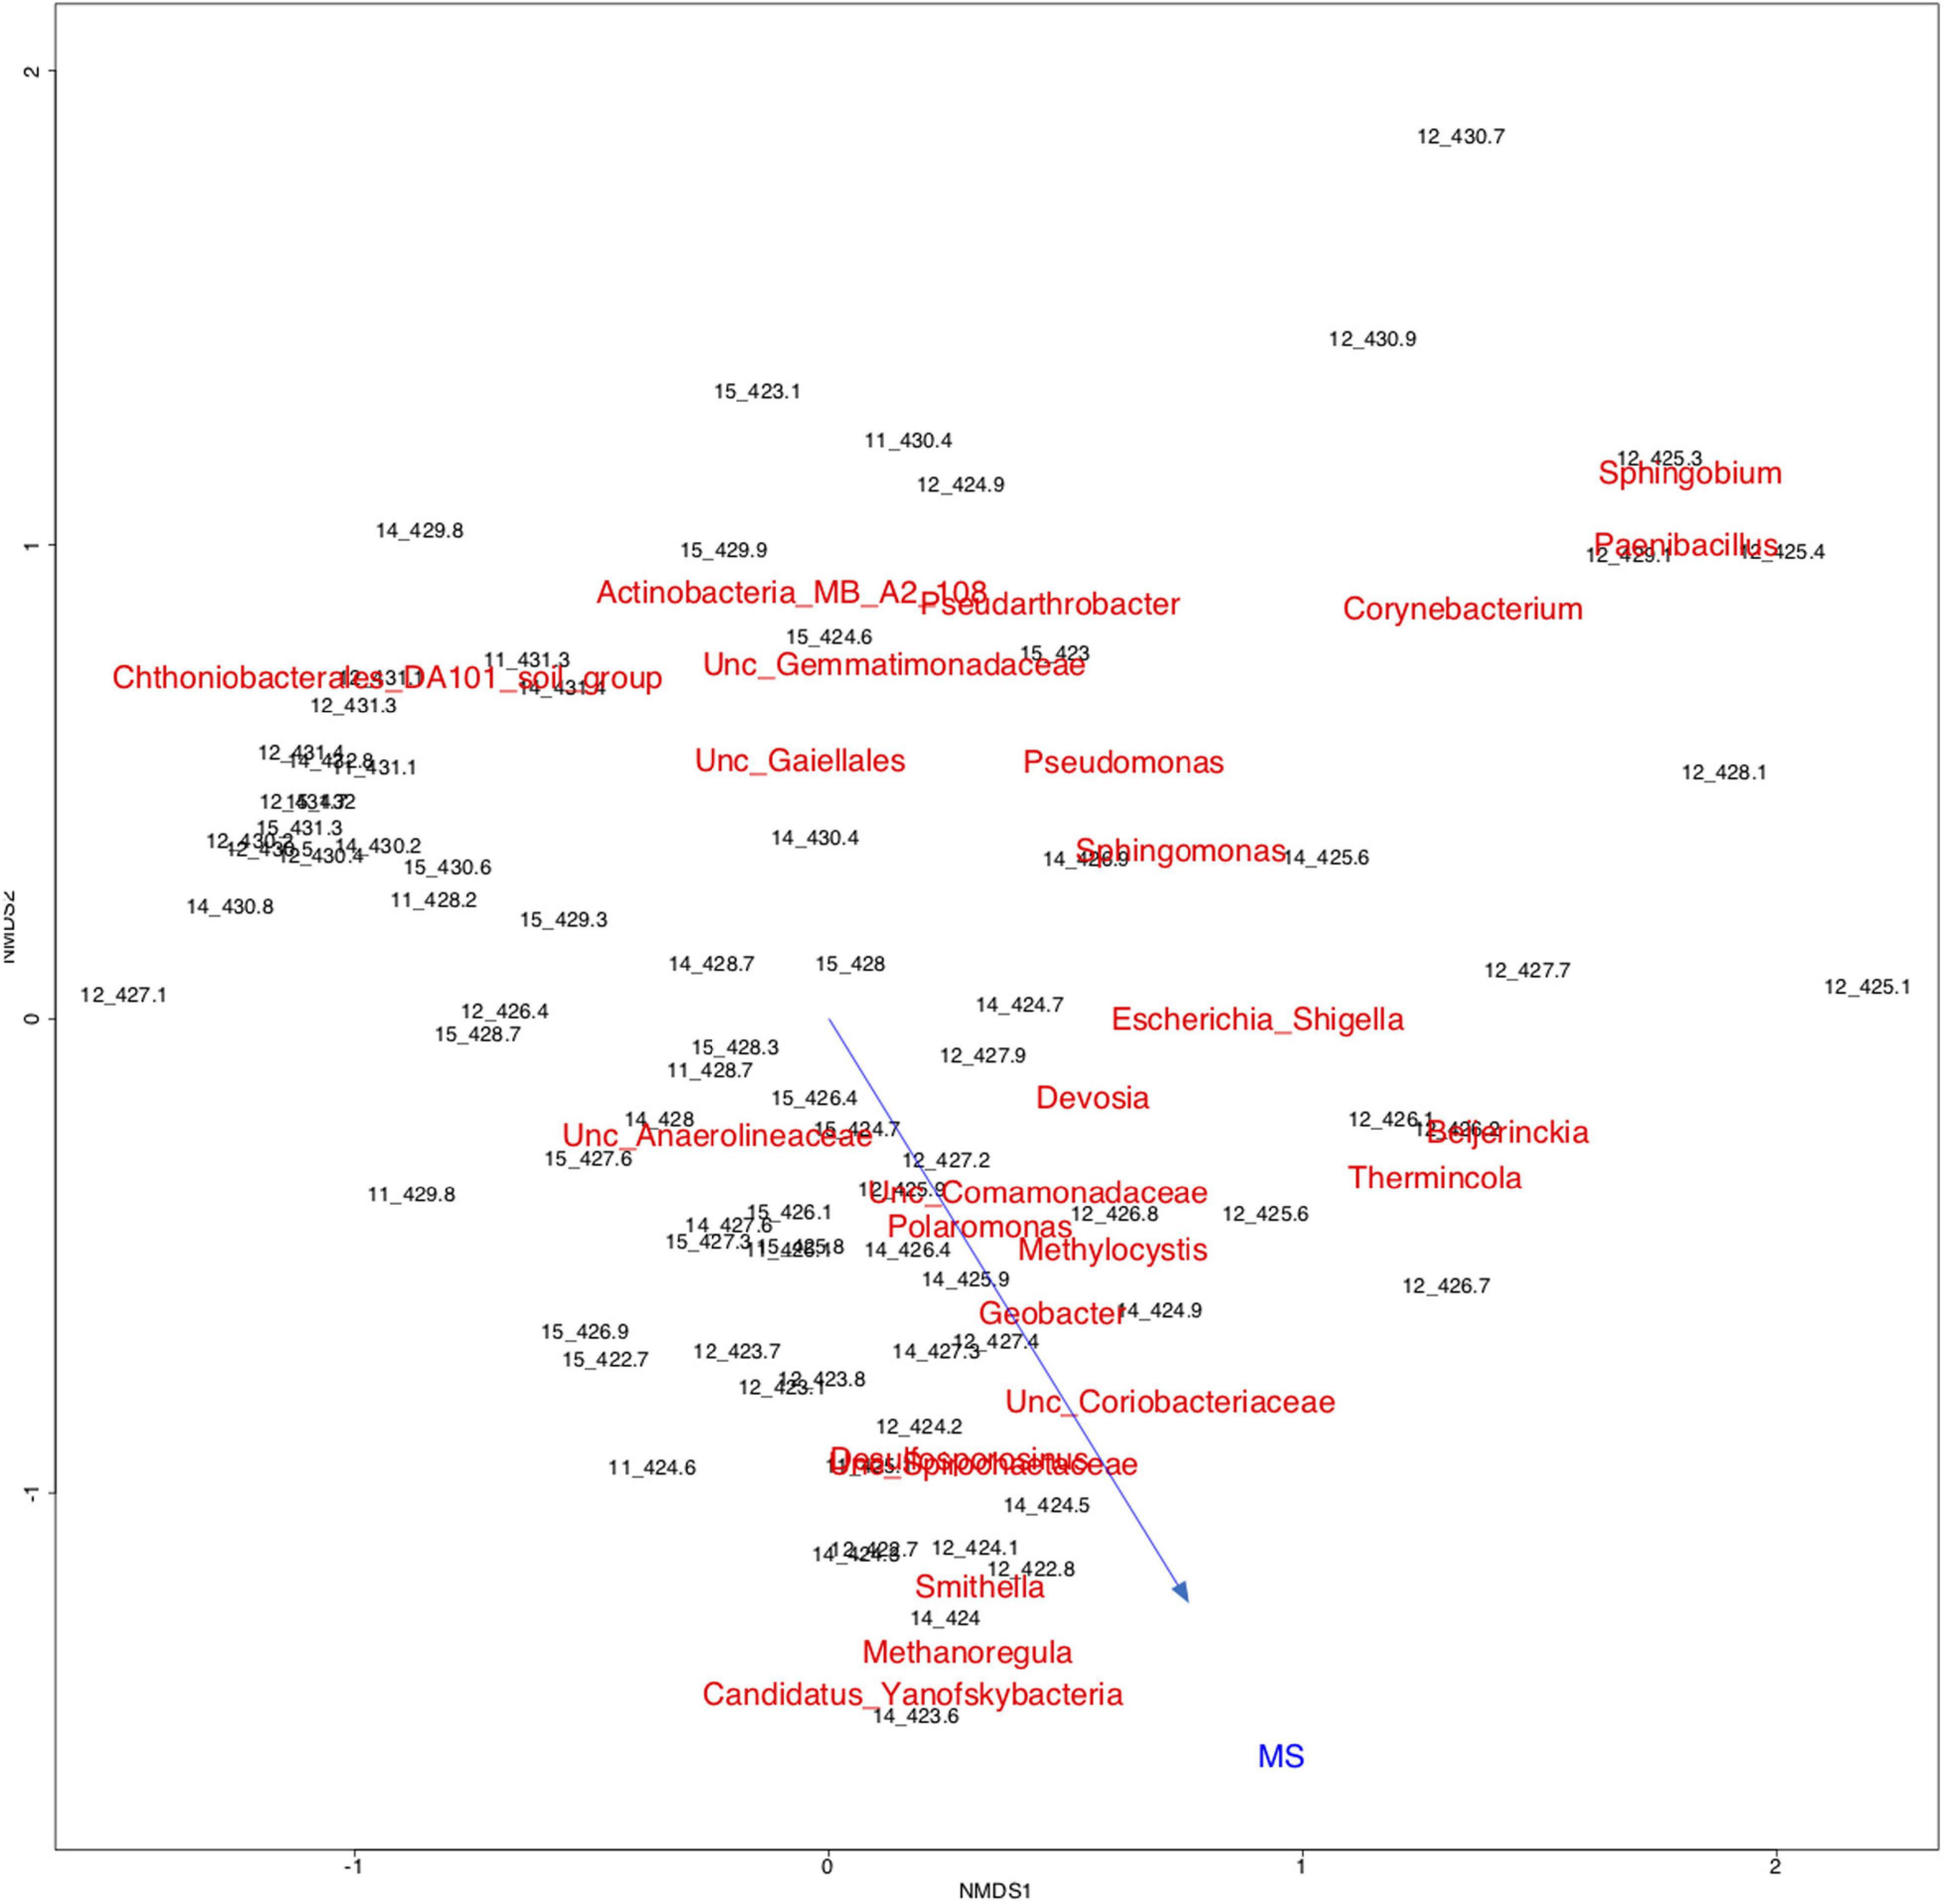
Figure 6. Two-dimensional non-metric multidimensional scaling (NMDS) based on Bray-Curtis dissimilarities showing all samples from the complete lengths of cores collected in 2011, 2012, 2014, and 2015 from the free-phase oil zone, in addition to the top 25 microbial taxa and the magnetic susceptibility (MS) as variable (vector). Samples labeled according to the depths they were collected from are shown in black, while the microbial taxa are shown in red. The names for the two taxa “Desulfosporosinus” and “Unc. (= uncultured) Spirochaetaceae” overlap. The MS arrow (blue) points into the direction of the samples and taxa from the free-phase oil, showing a correlation between theses samples, microbial taxa and the MS as environmental variable, although with low statistical significance (p = 0.48). Plot Stress = 0.18.
Discussion
Relationship Between Microbial Populations and Magnetic Susceptibility
Our multi-year analysis of the microbial community structure at the aged subsurface hydrocarbon spill site at Bemidji, MN, United States, revealed that a methanogenic microbial community is present in the free-phase petroleum zone. This confirms earlier studies that reported methane emissions at this site (Amos et al., 2005) and a preliminary microbial community analysis based on clone libraries, which showed the presence of methanogenic Archaea (Beaver et al., 2016). The main methane-generating microorganisms belonged to the genus Methanoregula. These are hydrogenotrophic methanogens, using hydrogen and carbon dioxide to produce methane. The prominent hydrogen provider at this site seems to be the syntrophic Deltaproteobacterium Smithella that was found in all years with an abundance of up to 46% in the free-phase samples. A comprehensive analysis revealed that Smithella is widespread at different hydrocarbon spill sites all over the world (Gray et al., 2011) and it has recently been shown that Smithella is able to attack long-chain hydrocarbons by fumarate addition and subsequent beta-oxidation (Ji et al., 2020). At the Bemidji site, the free-phase petroleum floats on the water table 9 m below the surface. Above the methanic zone, we found microorganisms that are able to oxidize methane aerobically, mainly belonging to the alphaproteobacterial genus Methylocystis. The same zone was also characterized by the presence of iron-reducing bacteria, specifically Geobacter. A conceptual model is shown in Figure 7.
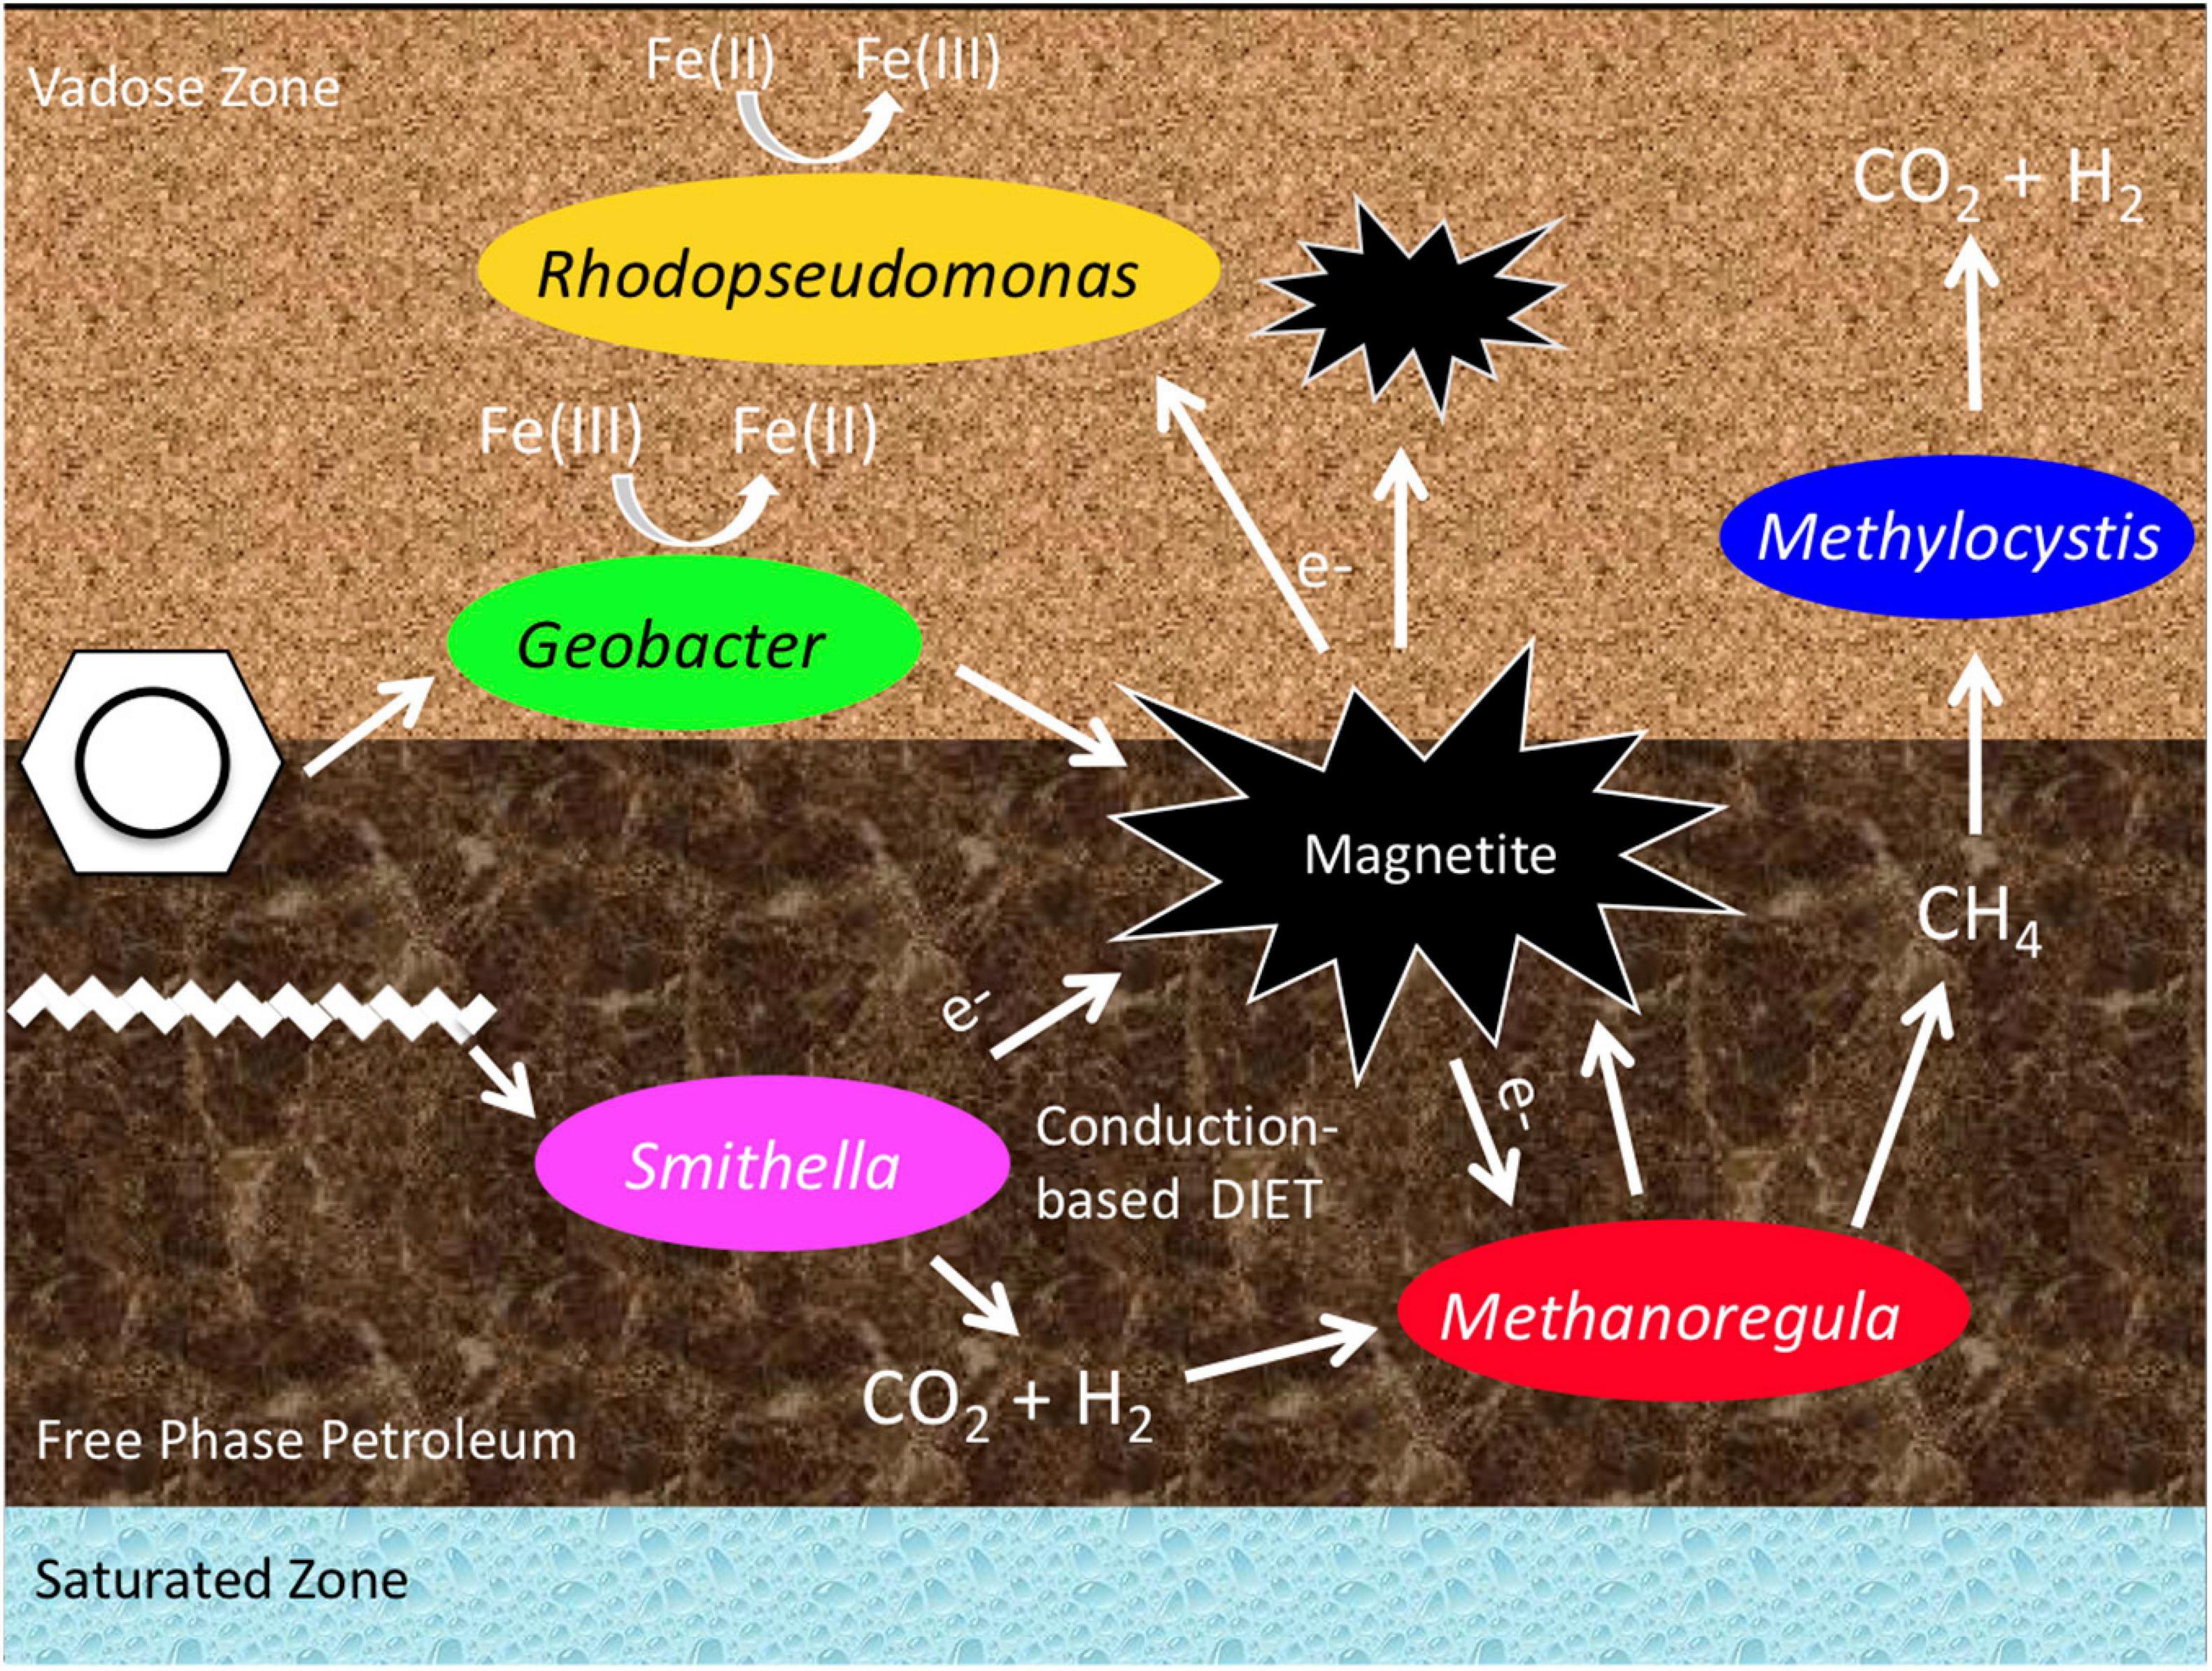
Figure 7. Conceptual model of the predominant bacteria and the metabolic processes in and above the free-phase oil zone.
How can we relate these results with the MS values that were measured at Bemidji? First, we have to mention that the high MS values that were measured in year 2011 around the water table in the free-phase petroleum decreased substantially (∼90%) in the following years when measured down the borehole (Lund et al., 2017). On the other hand, here we report that the elevated MS values measured around the water table in the retrieved cores did not substantially decrease over 5 years when measured in the laboratory (Figure 2). The MS values of sediments usually depend on their magnetite content. Magnetite can form biotically, in particular through the action of iron-reducing bacteria. Hansel et al. (2005) proposed a model for magnetite formation under iron reducing conditions when there is >2 mM aqueous Fe(II) in the presence of ferrihydrite. Piepenbrock et al. (2011) reported magnetite formation when the ferrihydrite concentration exceeded 5 mM. These values are comparable to the values that we measured in core 1407 (Supplementary Figure 3). It remains enigmatic, however, why the highest MS values were found in the methanic zone around 423/424 m and not in the iron-reducing zone one to two meters above (Figure 2). Possible explanations entail (1) a washing out of magnetic minerals during recharge events from the iron-reducing zone above to the methanic zone below or (2) the ability of the methanogens themselves to switch their metabolism from methanogenesis to iron reduction, resulting in the formation of magnetite. This idea is supported by growing evidence in the literature suggesting that iron utilization by methanogens mediates the formation of different iron mineral phases (Sivan et al., 2016; Amiel et al., 2020; Shang et al., 2020). Nevertheless, to support our data further, whole metagenome DNA sequencing or RNA-based methods, such as a transcriptome analysis, are necessary.
The presence of magnetite can even be beneficial for methanogenesis. Magnetite was shown to increase the rate of methane production in laboratory experiments with syntrophic bacteria and methanogenic Archaea, because they are capable of direct interspecies electron transfer (DIET) using conductive minerals like magnetite (Kato et al., 2012; Cruz Viggi et al., 2014; Yamada et al., 2015; Yang et al., 2015). Contributing evidence that electron transfer may be occurring between Smithella and Methanoregula is that a self-potential anomaly resulting from a biogeobattery was observed at this site (Heenan et al., 2017). In the Heenan et al. (2017) study, self-potential measurements using a vertical array of electrodes showed a dipolar pattern across the water table fluctuation zone associated with a current source. Such biogeobatteries are postulated to occur in the capillary fringe of contaminant plumes. The large gradient in redox potential at the capillary fringe might allow microbes to transfer electrons from one to another through conductive minerals like magnetite or through biological structures such as nanowires or biofilms, operating in a similar manner to fuel cells (Revil et al., 2010). Interestingly, Methanoregula has been enriched on the cathode in microbial fuel cells when current was applied (Chen et al., 2016; Zhang and Lu, 2016; Xia et al., 2019), which indicates that it can accept electrons from conductive materials.
Factors contributing to the dissolution of magnetite and therefore the decreasing MS response can be the activities of iron-oxidizing bacteria such as Rhodopseudomonas, which was found with a high LDA score in the lower vadose zone. In laboratory experiments, Rhodopseudomonas was shown to oxidize magnetite with and without photosynthesis and it was concluded that magnetite can serve as an electron sink or source (Bose et al., 2014; Byrne et al., 2015). To evaluate the fate of magnetite at hydrocarbon contaminated sites, experiments are currently being carried out at the Bemidji site that study the long-term fate of submerged magnetite minerals at the free-phase petroleum location (L. Slater, pers. communication).
An enigma remains concerning the occurrence of large single MS peaks in the upper vadose zone which were measured at 430 m in two of the 4 years (Figure 2). These outliers could be due to technical errors; nevertheless, this is unlikely because i) at least in 2015, the high MS was represented by more than one measuring point and ii) it was found at the same depth in two different years.
MS as a Tool
Magnetic susceptibility can be used as a tool to identify hotspots of biodegradation at a single point of time as described by Beaver et al. (2016) or to track changes in microbial activity over the long term as reported by Lund et al. (2017). Peaks in MS found in cores retrieved from contaminated sediments can be used for pinpointing the most important biochemical or microbial samples to take. After core retrieval, the wells left behind can be monitored for MS changes to determine the predominant metabolic processes occurring during natural attenuation or bioremediation of hydrocarbon spills.
Conclusion
The microbiological data presented here are the first that allow a spatial and temporal analysis of this spill site because the sediment cores were retrieved in five consecutive years and the samples were collected along the complete length of the cores. The data for the years 2011–2015 confirm previous research findings that the free-phase oil is being degraded by a consortium consisting of the syntrophic Smithella and the methanogenic Methanoregula. The smear zone is a transition zone from methanogenesis to iron reduction, with Thermincola being the most common iron reducer in this zone. Iron cycling and methanotrophy seem to be the dominant processes in the lower vadose zone where iron reducers such as Geobacter, iron oxidizers such as Rhodopseudomonas, and the methanotroph Methylocystis are present (Figure 7). The upper vadose is inhabited by aerobic organisms, mainly belonging to the Actinobacteria and Acidobacteria phyla (Figure 2).
Interestingly, despite the notion that elevated MS values are indicative of higher magnetite concentrations precipitated by the actions of iron-reducing bacterial populations, higher MS values were measured in the methanic free-phase oil zone around the water table and not in the iron-reducing zone above. This finding could be one of the first field evidences that show the metabolic potential of methanogens to switch their metabolism from methanogenesis to iron reduction with concomitant magnetite precipitation. The results presented here provide additional evidence for the role of microbes in environmental magnetism and the magnetic record of terrestrial and marine environments. Further studies are needed in order to determine if changes in MS can be linked to different stages of the bioremediation process.
Data Availability Statement
The datasets presented in this study can be found in online repositories. The names of the repository/repositories and accession number(s) can be found below: https://www.ncbi.nlm.nih.gov/sra, SRR12074793–SRR12074794, https://www.ncbi.nlm.nih.gov/sra, SRR12075362–SRR12075368, https://www.ncbi.nlm.nih.gov/sra, SRR12076730–SRR12076740, https://www.ncbi.nlm.nih.gov/sra, SRR12077129–SRR12077144, https://www.ncbi.nlm.nih.gov/sra, SRR12082454–SRR12082467, https://www.ncbi.nlm.nih.gov/sra, SRR12082942–SRR12082962, https://www.ncbi.nlm.nih.gov/sra, SRR12091569–SRR12091584, and https://www.ncbi.nlm.nih.gov/sra, SRR12091932–SRR12091956.
Author Contributions
CB, SR, EA, BB, DN, and LS conceived the study. CB performed the microbiological experiments and analyses. EA, DN, and LS performed the geophysical analysis. CB, SR, and EA wrote the manuscript. All authors contributed to the article and approved the submitted version.
Funding
The authors acknowledge funding from the Chevron Energy Technology (Grant #CW852844) and the National Crude Oil Spill Fate and Natural Attenuation Research Site, a collaborative venture of the United States Geological Survey (USGS), Enbridge Energy, Limited Partnership, the Minnesota Pollution Control Agency and Beltrami County. Any use of trade, product, or firm names in this publication is for descriptive purposes only and does not imply endorsement by the US Government.
Conflict of Interest
The authors declare that this study received funding from Chevron Energy Technology (Grant No. CW852844) and the National Crude Oil Spill Fate and Natural Attenuation Research Site, a collaborative venture of the United States Geological Survey (USGS), Enbridge Energy, Limited Partnership, the Minnesota Pollution Control Agency, and Beltrami County. The funders were not involved in the study design, collection, analysis, interpretation of data, the writing of this article, or the decision to submit it for publication.
Acknowledgments
We thank Jared Trost and Andrew Berg (USGS) for field support, and Farag Mewafy, Brittany Ford, Sundeep Sharma, and Drs. Allison Enright and Carl Rosier (Oklahoma State University) for their assistance with geophysical data collection. We also acknowledge Dr. Denise Akob and three reviewers for their helpful suggestions which have improved this manuscript.
Supplementary Material
The Supplementary Material for this article can be found online at: https://www.frontiersin.org/articles/10.3389/feart.2021.598172/full#supplementary-material
References
Abu Laban, N., Tan, B., Dao, A., and Foght, J. (2015). Draft genome sequence of uncultivated Desulfosporosinus sp. strain Tol-M, obtained by stable isotope probing using [13C6]toluene. Genome Announc. 3:e01422-14. doi: 10.1128/genomeA.01422-14
Albuquerque, L., Franca, L., Rainey, F. A., Schumann, P., Nobre, M. F., and da Costa, M. S. (2011). Gaiella occulta gen. nov., sp. nov., a novel representative of a deep branching phylogenetic lineage within the class Actinobacteria and proposal of Gaiellaceae fam. nov. and Gaiellales ord. nov. Syst. Appl. Microbiol. 34, 595–599. doi: 10.1016/j.syapm.2011.07.001
Ameen, N. N., Klueglein, N., Appel, E., Petrovsky, E., Kappler, A., and Leven, C. (2014). Effect of hydrocarbon-contaminated fluctuating groundwater on magnetic properties of shallow sediments. Stud. Geophys. Geodaet. 58, 442–460. doi: 10.1007/S11200-014-0407-3
Amiel, N., Shaar, R., and Sivan, O. (2020). The effect of early diagenesis in methanic sediments on sedimentary magnetic properties: case study from the SE mediterranean continental shelf. Front. Earth Sci. 8:283. doi: 10.3389/feart.2020.00283
Amos, R. T., Mayer, K. U., Bekins, B. A., Delin, G. N., and Williams, R. L. (2005). Use of dissolved and vapor-phase gases to investigate methanogenic degradation of petroleum hydrocarbon contamination in the subsurface. Water Resour. Res. 41:W02001. doi: 10.1029/2004wr003433
Aromokeye, D. A., Oni, O. E., Tebben, J., Yin, X., Richter-Heitmann, T., Wendt, J., et al. (2020). Crystalline iron oxides stimulate methanogenic benzoate degradation in marine sediment-derived enrichment cultures. ISME J. doi: 10.1038/s41396-020-00824-7 [Epub ahead of print].
Atekwana, E. A., Mewafy, F. M., Abdel Aal, G., Werkema, D. D., Revil, A., and Slater, L. D. (2014). High-resolution magnetic susceptibility measurements for investigating magnetic mineral formation during microbial mediated iron reduction. J. Geophys. Res. Biogeo. 119, 80–94. doi: 10.1002/2013jg002414
Beaver, C. L., Williams, A. E., Atekwana, E. A., Mewafy, F. M., Abdel Aal, G., Slater, L. D., et al. (2016). Microbial communities associated with zones of elevated magnetic susceptibility in hydrocarbon-contaminated sediments. Geomicrobiol. J. 33, 441–452. doi: 10.1080/01490451.2015.1049676
Bekins, B. A., Godsy, E. M., and Warren, E. (1999). Distribution of microbial physiologic types in an aquifer contaminated by crude oil. Microb. Ecol. 37, 263–275. doi: 10.1007/S002489900149
Bennett, P. C., Siegel, D. E., Baedecker, M. J., and Hult, M. F. (1993). Crude-oil in a shallow sand and gravel aquifer .1. Hydrogeology and inorganic geochemistry. Appl. Geochem. 8, 529–549. doi: 10.1016/0883-2927(93)90012-6
Blakely, R. J. (1995). Potential Theory in Gravity and Magnetic Applications. New York, NY: Cambridge University Press.
Bose, A., Gardel, E. J., Vidoudez, C., Parra, E. A., and Girguis, P. R. (2014). Electron uptake by iron-oxidizing phototrophic bacteria. Nat. Commun. 5:3391. doi: 10.1038/ncomms4391
Brauer, S. L., Cadillo-Quiroz, H., Ward, R. J., Yavitt, J. B., and Zinder, S. H. (2011). Methanoregula boonei gen. nov., sp. nov., an acidiphilic methanogen isolated from an acidic peat bog. Int. J. Syst. Evol. Micr. 61, 45–52. doi: 10.1099/Ijs.0.021782-0
Brewer, T. E., Handley, K. M., Carini, P., Gilbert, J. A., and Fierer, N. (2016). Genome reduction in an abundant and ubiquitous soil bacterium ‘Candidatus Udaeobacter copiosus’. Nat. Microbiol. 2:16198. doi: 10.1038/nmicrobiol.2016.198
Brown, C. T., Hug, L. A., Thomas, B. C., Sharon, I., Castelle, C. J., Singh, A., et al. (2015). Unusual biology across a group comprising more than 15% of domain Bacteria. Nature 523, 208–211. doi: 10.1038/nature14486
Byrne, J. M., Klueglein, N., Pearce, C., Rosso, K. M., Appel, E., and Kappler, A. (2015). Redox cycling of Fe(II) and Fe(III) in magnetite by Fe-metabolizing bacteria. Science 347, 1473–1476. doi: 10.1126/science.aaa4834
Callahan, B. J., McMurdie, P. J., Rosen, M. J., Han, A. W., Johnson, A. J., and Holmes, S. P. (2016). DADA2: High-resolution sample inference from Illumina amplicon data. Nat. Methods 13, 581–583. doi: 10.1038/nmeth.3869
Caporaso, J. G., Kuczynski, J., Stombaugh, J., Bittinger, K., Bushman, F. D., Costello, E. K., et al. (2010). QIIME allows analysis of high-throughput community sequencing data. Nat. Methods 7, 335–336. doi: 10.1038/nmeth.f.303
Castelle, C. J., Wrighton, K. C., Thomas, B. C., Hug, L. A., Brown, C. T., Wilkins, M. J., et al. (2015). Genomic expansion of domain archaea highlights roles for organisms from new phyla in anaerobic carbon cycling. Curr. Biol. 25, 690–701. doi: 10.1016/j.cub.2015.01.014
Chen, H., Hao, S., Chen, Z., Sompong, O. T., Fan, J., Clark, J., et al. (2020). Mesophilic and thermophilic anaerobic digestion of aqueous phase generated from hydrothermal liquefaction of cornstalk: molecular and metabolic insights. Water Res. 168:115199. doi: 10.1016/j.watres.2019.115199
Chen, Y., Yu, B., Yin, C., Zhang, C., Dai, X., Yuan, H., et al. (2016). Biostimulation by direct voltage to enhance anaerobic digestion of waste activated sludge. RSC Adv. 6, 1581–1588. doi: 10.1039/c5ra24134k
Cheng, L., Ding, C., Li, Q., He, Q., Dai, L. R., and Zhang, H. (2013). DNA-SIP reveals that Syntrophaceae play an important role in methanogenic hexadecane degradation. PLoS One 8:e66784. doi: 10.1371/journal.pone.0066784
Cruz Viggi, C., Rossetti, S., Fazi, S., Paiano, P., Majone, M., and Aulenta, F. (2014). Magnetite particles triggering a faster and more robust syntrophic pathway of methanogenic propionate degradation. Environ. Sci. Technol. 48, 7536–7543. doi: 10.1021/es5016789
Curd, E. E., Martiny, J. B. H., Li, H. Y., and Smith, T. B. (2018). Bacterial diversity is positively correlated with soil heterogeneity. Ecosphere 9:e02079. doi: 10.1002/ecs2.2079
Da Silva, A. C., De Vleeschouwer, D., Boulvain, F., Claeys, P., Fagel, N., Humblet, M., et al. (2013). Magnetic susceptibility as a high-resolution correlation tool and as a climatic proxy in Paleozoic rocks – Merits and pitfalls: examples from the Devonian in Belgium. Mar. Petrol. Geol. 46, 173–189. doi: 10.1016/j.marpetgeo.2013.06.012
Danczak, R. E., Johnston, M. D., Kenah, C., Slattery, M., and Wilkins, M. J. (2019). Capability for arsenic mobilization in groundwater is distributed across broad phylogenetic lineages. PLoS One 14:e0221694. doi: 10.1371/journal.pone.0221694
de Bok, F. A., Stams, A. J., Dijkema, C., and Boone, D. R. (2001). Pathway of propionate oxidation by a syntrophic culture of Smithella propionica and Methanospirillum hungatei. Appl. Environ. Microbiol. 67, 1800–1804. doi: 10.1128/AEM.67.4.1800-1804.2001
D’Emilio, M., Chianese, D., Coppola, R., Macchiato, M., and Ragosta, M. (2007). Magnetic susceptibility measurements as proxy method to monitor soil pollution: development of experimental protocols for field surveys. Environ. Monitor. Assess. 125, 137–146. doi: 10.1007/s10661-006-9246-1
Emmerton, S., Muxworthy, A. R., Sephton, M. A., Aldana, M., Costanzo-Alvarez, V., Bayona, G., et al. (2013). Correlating biodegradation to magnetization in oil bearing sedimentary rocks. Geochim. Cosmochim. Acta 112, 146–165. doi: 10.1016/j.gca.2013.03.008
Essaid, H. I., Bekins, B. A., Herkelrath, W. N., and Delin, G. N. (2011). Crude oil at the Bemidji site: 25 years of monitoring, modeling, and understanding. Ground Water 49, 706–726. doi: 10.1111/J.1745-6584.2009.00654.X
Finneran, K. T., Johnsen, C. V., and Lovley, D. R. (2003). Rhodoferax ferrireducens sp nov., a psychrotolerant, facultatively anaerobic bacterium that oxidizes acetate with the reduction of Fe(III). Int. J. Syst. Evol. Micr. 53, 669–673. doi: 10.1099/Ijs.0.02298-0
Grady, E. N., MacDonald, J., Liu, L., Richman, A., and Yuan, Z. C. (2016). Current knowledge and perspectives of Paenibacillus: a review. Microb. Cell Fact. 15:203. doi: 10.1186/s12934-016-0603-7
Gray, N. D., Sherry, A., Grant, R. J., Rowan, A. K., Hubert, C. R. J., Callbeck, C. M., et al. (2011). The quantitative significance of Syntrophaceae and syntrophic partnerships in methanogenic degradation of crude oil alkanes. Environ. Microbiol. 13, 2957–2975. doi: 10.1111/J.1462-2920.2011.02570.X
Guo, F., and Zhang, T. (2013). Biases during DNA extraction of activated sludge samples revealed by high throughput sequencing. Appl. Microbiol. Biotechnol. 97, 4607–4616. doi: 10.1007/s00253-012-4244-4
Guo, K., and Gao, P. (2020). Do 16s Data Analysis and Generate Figures. Microbial. R Package Version 0.0.17.
Guzmán, O., Costanzo-Álvarez, V., Aldana, M., and Díaz, M. (2011). Study of magnetic contrasts applied to hydrocarbon exploration in the Maturín Sub-Basin (eastern Venezuela). Stud. Geophys. Geodaet. 55, 359–376. doi: 10.1007/s11200-011-0020-7
Han, D., Dedysh, S. N., and Liesack, W. (2018). Unusual genomic traits suggest Methylocystis bryophila S285 to be well adapted for life in peatlands. Genome Biol. Evol. 10, 623–628. doi: 10.1093/gbe/evy025
Hansel, C. M., Benner, S. G., and Fendorf, S. (2005). Competing Fe(II)-induced mineralization pathways of ferrihydrite. Environ. Sci. Technol. 39, 7147–7153. doi: 10.1021/Es050666z
Heenan, J. W., Ntarlagiannis, D., Slater, L. D., Beaver, C. L., Rossbach, S., Revil, A., et al. (2017). Field-scale observations of a transient geobattery resulting from natural attenuation of a crude oil spill. J. Geophys. Res. Biogeosci. 122, 918–929. doi: 10.1002/2016jg003596
Hernsdorf, A. W., and Amano, Y. (2017). Potential for microbial H2 and metal transformations associated with novel bacteria and archaea in deep terrestrial subsurface sediments. ISME J. 11, 1915–1929. doi: 10.1038/ismej.2017.39
Hoffmann, V., Knab, M., and Appel, E. (1999). Magnetic susceptibility mapping of roadside pollution. J. Geochem. Explor. 66, 313–326. doi: 10.1016/S0375-6742(99)00014-X
Jaffe, A. L., Castelle, C. J., Matheus Carnevali, P. B., Gribaldo, S., and Banfield, J. F. (2020). The rise of diversity in metabolic platforms across the Candidate Phyla Radiation. BMC Biol. 18:69. doi: 10.1186/s12915-020-00804-5
Ji, J. H., Zhou, L., Mbadinga, S. M., Irfan, M., Liu, Y. F., Pan, P., et al. (2020). Methanogenic biodegradation of C9 to C12n-alkanes initiated by Smithella via fumarate addition mechanism. AMB Exp. 10:23. doi: 10.1186/s13568-020-0956-5
Kato, S., Hashimoto, K., and Watanabe, K. (2012). Methanogenesis facilitated by electric syntrophy via (semi)conductive iron-oxide minerals. Environ. Microbiol. 14, 1646–1654. doi: 10.1111/j.1462-2920.2011.02611.x
Kato, S., Wada, K., Kitagawa, W., Mayumi, D., Ikarashi, M., Sone, T., et al. (2019). Conductive iron oxides promote methanogenic acetate degradation by microbial communities in a high-temperature petroleum reservoir. Microb. Environ. 34, 95–98. doi: 10.1264/jsme2.ME18140
Kim, K. K., Lee, K. C., Oh, H. M., Kim, M. J., Eom, M. K., and Lee, J. S. (2008). Arthrobacter defluvii sp. nov., 4-chlorophenol-degrading bacteria isolated from sewage. Int. J. Syst. Evol. Microbiol. 58, 1916–1921. doi: 10.1099/ijs.0.65550-0
Kobayashi, H., Fu, Q., Maeda, H., and Sato, K. (2017). Draft genome sequence of a novel Coriobacteriaceae sp. Strain, EMTCatB1, reconstructed from the metagenome of a thermophilic electromethanogenic biocathode. Genome Announc. 5:e00022-17. doi: 10.1128/genomeA.00022-17
Langille, M. G., Zaneveld, J., Caporaso, J. G., McDonald, D., Knights, D., Reyes, J. A., et al. (2013). Predictive functional profiling of microbial communities using 16S rRNA marker gene sequences. Nat. Biotechnol. 31, 814–821. doi: 10.1038/nbt.2676
Lentini, C. J., Wankel, S. D., and Hansel, C. M. (2012). Enriched iron(III)-reducing bacterial communities are shaped by carbon substrate and iron oxide mineralogy. Front. Microbiol. 3:404. doi: 10.3389/Fmicb.2012.00404
Li, Y., Huang, C., Ngo, H. H., Pang, J., Zha, X., Liu, T., et al. (2019). In situ reconstruction of long-term extreme flooding magnitudes and frequencies based on geological archives. Sci. Total Environ. 670, 8–17. doi: 10.1016/j.scitotenv.2019.03.066
Liu, Y. T., Balkwill, D. L., Aldrich, H. C., Drake, G. R., and Boone, D. R. (1999). Characterization of the anaerobic propioate-degrading syntrophs Smithella propionica gen. nov., sp. nov. and Syntrophobacter wolinii. Int. J. Syst. Bacteriol. 49, 545–556. doi: 10.1099/00207713-49-2-545
Lovley, D. R. (2017). Syntrophy goes electric: direct interspecies electron transfer. Annu. Rev. Microbiol. 71, 643–664. doi: 10.1146/annurev-micro-030117-020420
Lovley, D. R., Baedecker, M. J., Lonergan, D. J., Cozzarelli, I. M., Phillips, E. J. P., and Siegel, D. I. (1989). Oxidation of aromatic contaminants coupled to microbial iron reduction. Nature 339, 297–300. doi: 10.1038/339297a0
Lund, A. L., Slater, L. D., Atekwana, E. A., Ntarlagiannis, D., Cozzarelli, I., and Bekins, B. A. (2017). Evidence of coupled carbon and iron cycling at a hydrocarbon-contaminated site from time lapse magnetic susceptibility. Environ. Sci. Technol. 51, 11244–11249. doi: 10.1021/acs.est.7b02155
Masella, A. P., Bartram, A. K., Truszkowski, J. M., Brown, D. G., and Neufeld, J. D. (2012). PANDAseq: paired-end assembler for illumina sequences. BMC Bioinform. 13:31. doi: 10.1186/1471-2105-13-31
Mattes, T. E., Alexander, A. K., Richardson, P. M., Munk, A. C., Han, C. S., Stothard, P., et al. (2008). The genome of Polaromonas sp. strain JS666: insights into the evolution of a hydrocarbon- and xenobiotic-degrading bacterium, and features of relevance to biotechnology. Appl. Environ. Microbiol. 74, 6405–6416. doi: 10.1128/AEM.00197-08
McMurdie, P. J., and Holmes, S. (2013). phyloseq: an R package for reproducible interactive analysis and graphics of microbiome census data. PLoS One 8:e61217. doi: 10.1371/journal.pone.0061217
Meckenstock, R. U., Elsner, M., Griebler, C., Lueders, T., Stumpp, C., Aamand, J., et al. (2015). Biodegradation: updating the concepts of control for microbial cleanup in contaminated aquifers. Environ. Sci. Technol. 49, 7073–7081. doi: 10.1021/acs.est.5b00715
Mewafy, F. M., Atekwana, E. A., Werkema, D. D., Slater, L. D., Ntarlagiannis, D., Revil, A., et al. (2011). Magnetic susceptibility as a proxy for investigating microbially mediated iron reduction. Geophys. Res. Lett. 38:L21402. doi: 10.1029/2011gl049271
Oksanen, J., Blanchet, F. G., Kindt, R., Legendre, P., Minchin, P. R., O’Hara, R. B., et al. (2013). “Vegan: Community Ecology Package”. R Package Version 2.0-10.
Perez-Perez, A., D’Onofrio, L., Bosch, M., and Zapata, E. (2011). Association between magnetic susceptibilities and hydrocarbon deposits in the Barinas-Apure Basin, Venezuela. Geophysics 76:L35. doi: 10.1190/geo2010-0274.1
Piepenbrock, A., Dippon, U., Porsch, K., Appel, E., and Kappler, A. (2011). Dependence of microbial magnetite formation on humic substance and ferrihydrite concentrations. Geochim. Cosmochim. Acta 75, 6844–6858. doi: 10.1016/j.gca.2011.09.007
Porsch, K., Dippon, U., Rijal, M. L., Appel, E., and Kappler, A. (2010). In-situ magnetic susceptibility measurements as a tool to follow geomicrobiological transformation of Fe minerals. Environ. Sci. Technol. 44, 3846–3852. doi: 10.1021/es903954u
Potter, D. K. (2007). Magnetic susceptibility as a rapid, nondestructive technique for improved petrophysical parameter prediction. Petrophysics 48, 191–201.
Potter, D. K., and Ivakhnenko, O. P. (2008). Clay typing – Sensitive quantification and anisotropy in synthetic and natural reservoir samples using low- and high-field magnetic susceptibility for improved petrophysical appraisals. Petrophysics 49, 57–66.
Qin, Q. S., Feng, D. S., Liu, P. F., He, Q., Li, X., Liu, A. M., et al. (2017). Metagenomic characterization of Candidatus Smithella cisternae Strain M82_1, a syntrophic alkane-degrading bacteria, enriched from the Shengli Oil Field. Microb. Environ. 32, 234–243. doi: 10.1264/jsme2.ME17022
R Core Team (2016). “R: A Language and Environment for Statistical Computing”. R Version 3.3.2. Vienna: R Foundation for Statistical Computing.
Reed, D. W., Fujita, Y., Delwiche, M. E., Blackwelder, D. B., Sheridan, P. P., Uchida, T., et al. (2002). Microbial communities from methane hydrate-bearing deep marine sediments in a forearc basin. Appl. Environ. Microbiol. 68, 3759–3770. doi: 10.1128/aem.68.8.3759-3770.2002
Revil, A., Mendonca, C. A., Atekwana, E. A., Kulessa, B., Hubbard, S. S., and Bohlen, K. J. (2010). Understanding biogeobatteries: where geophysics meets microbiology. J. Geophys. Res. Biogeosci. 115:G00G02. doi: 10.1029/2009jg001065
Rijal, M. L., Appel, E., Petrovsky, E., and Blaha, U. (2010). Change of magnetic properties due to fluctuations of hydrocarbon contaminated groundwater in unconsolidated sediments. Environ. Pollut. 158, 1756–1762. doi: 10.1016/j.envpol.2009.11.012
Rijal, M. L., Porsch, K., Appel, E., and Kappler, A. (2012). Magnetic signature of hydrocarbon-contaminated soils and sediments at the former oil field Hanigsen, Germany. Stud. Geophys. Geod. 56, 889–908. doi: 10.1007/S11200-010-0040-8
Robertson, W. J., Franzmann, P. D., and Mee, B. J. (2000). Spore-forming, Desulfosporosinus-like sulphate-reducing bacteria from a shallow aquifer contaminated with gasolene. J. Appl. Microbiol. 88, 248–259. doi: 10.1046/j.1365-2672.2000.00957.x
Rognes, T., Flouri, T., Nichols, B., Quince, C., and Mahe, F. (2016). VSEARCH: a versatile open source tool for metagenomics. PeerJ 4:e2584. doi: 10.7717/peerj.2584
Rotaru, A. E., Shrestha, P. M., Liu, F., Markovaite, B., Chen, S., Nevin, K. P., et al. (2014). Direct interspecies electron transfer between Geobacter metallireducens and Methanosarcina barkeri. Appl. Environ. Microbiol. 80, 4599–4605. doi: 10.1128/Aem.00895-14
Ryu, S. H., Chung, B. S., Le, N. T., Jang, H. H., Yun, P. Y., Park, W., et al. (2008). Devosia geojensis sp. nov., isolated from diesel-contaminated soil in Korea. Int. J. Syst. Evol. Microbiol. 58, 633–636. doi: 10.1099/ijs.0.65481-0
Segata, N., Izard, J., Waldron, L., Gevers, D., Miropolsky, L., Garrett, W. S., et al. (2011). Metagenomic biomarker discovery and explanation. Genome Biol. 12:R60. doi: 10.1186/gb-2011-12-6-r60
Shang, H., Daye, M., Sivan, O., Borlina, C. S., Tamura, N., Weiss, B. P., et al. (2020). Formation of zerovalent iron in iron-reducing cultures of Methanosarcina barkeri. Environ. Sci. Technol. 54, 7354–7365. doi: 10.1021/acs.est.0c01595
Shi, L. D., Chen, Y. S., Du, J. J., Hu, Y. Q., Shapleigh, J. P., and Zhao, H. P. (2018). Metagenomic evidence for a Methylocystis species capable of bioremediation of diverse heavy metals. Front. Microbiol. 9:3297. doi: 10.3389/fmicb.2018.03297
Sivan, O., Shusta, S. S., and Valentine, D. L. (2016). Methanogens rapidly transition from methane production to iron reduction. Geobiology 14, 190–203. doi: 10.1111/gbi.12172
Solden, L., Lloyd, K., and Wrighton, K. (2016). The bright side of microbial dark matter: lessons learned from the uncultivated majority. Curr. Opin. Microbiol. 31, 217–226. doi: 10.1016/j.mib.2016.04.020
Tan, B., Nesbo, C., and Foght, J. (2014). Re-analysis of omics data indicates Smithella may degrade alkanes by addition to fumarate under methanogenic conditions. ISME J. 8, 2353–2356. doi: 10.1038/ismej.2014.87
Tian, R., Ning, D., He, Z., Zhang, P., Spencer, S. J., Gao, S., et al. (2020). Small and mighty: adaptation of superphylum Patescibacteria to groundwater environment drives their genome simplicity. Microbiome 8:51. doi: 10.1186/s40168-020-00825-w
Trost, J. J., Christy, T. M., and Bekins, B. A. (2018). A direct-push freezing core barrel for sampling unconsolidated subsurface sediments and adjacent pore fluids. Vadose Zone J. 17:180037. doi: 10.2136/vzj2018.02.0037
U. S. Geological Survey (2020). National Water Information System Data Available on the World Wide Web (USGS Water Data for the Nation). Available online at: https://mn.water.usgs.gov/projects/bemidji/data/WaterQuality/BemidjiQW.zip (accessed June 10, 2012).
Walach, G., Scholger, R., and Cech, B. (2011). Geomagnetic and geoelectric prospection on a roman iron production facility in Huttenberg, Austria (Ferrum Noricum). Archaeol. Prospect. 18, 149–158. doi: 10.1002/arp.412
Wawrik, B., Marks, C. R., Davidova, I. A., McInerney, M. J., Pruitt, S., Duncan, K. E., et al. (2016). Methanogenic paraffin degradation proceeds via alkane addition to fumarate by ‘Smithel’ spp. mediated by a syntrophic coupling with hydrogenotrophic methanogens. Environ. Microbiol. 18, 2604–2619. doi: 10.1111/1462-2920.13374
Wegner, C.-E., Gorniak, L., Riedel, S., Westermann, M., and Küsel, K. (2020). Lanthanide-dependent methylotrophs of the family Beijerinckiaceae: physiological and genomic insights. Appl. Environ. Microbiol. 86, e1830–e1819. doi: 10.1128/aem.01830-19
Wickham, H. (2011). The split-apply-combine strategy for data analysis. J. Statist. Softw. 40, 1–29.
Wickham, H., Averick, M., Bryan, J., Chang, W., D’Agostino McGowan, L., François, R., et al. (2019). Welcome to the tidyverse. J. Open Sour. Softw. 4:1686. doi: 10.21105/joss.01686
Wilkie, C. (2019). cowplot: Streamlined Plot Theme and Plot Annotations for “ggplot2” R Package Version 1.0.0. Available online at: https://CRAN.R-project.org/package=cowplot (accessed November 1, 2020).
Woycheese, K. M., Meyer-Dombard, D. R., Cardace, D., Argayosa, A. M., and Arcilla, C. A. (2015). Out of the dark: transitional subsurface-to-surface microbial diversity in a terrestrial serpentinizing seep (Manleluag, Pangasinan, the Philippines). Front. Microbiol. 6:44. doi: 10.3389/fmicb.2015.00044
Xia, X., Zhang, J., Song, T., and Lu, Y. (2019). Stimulation of Smithella-dominating propionate oxidation in a sediment enrichment by magnetite and carbon nanotubes. Environ. Microbiol. Rep. 11, 236–248. doi: 10.1111/1758-2229.12737
Yamada, C., Kato, S., Ueno, Y., Ishii, M., and Igarashi, Y. (2015). Conductive iron oxides accelerate thermophilic methanogenesis from acetate and propionate. J. Biosci. Bioeng. 119, 678–682. doi: 10.1016/j.jbiosc.2014.11.001
Yang, Z. M., Shi, X. S., Wang, C. S., Wang, L., and Guo, R. B. (2015). Magnetite nanoparticles facilitate methane production from ethanol via acting as electron acceptors. Sci. Rep. 5:16118. doi: 10.1038/srep16118
Yashiro, Y., Sakai, S., Ehara, M., Miyazaki, M., Yamaguchi, T., and Imachi, H. (2011). Methanoregula formicica sp. nov., a methane-producing archaeon isolated from methanogenic sludge. Int. J. Syst. Evol. Microbiol. 61(Pt 1), 53–59. doi: 10.1099/ijs.0.014811-0
Zavarzina, D. G., Sokolova, T. G., Tourova, T. P., Chernyh, N. A., Kostrikina, N. A., and Bonch-Osmolovskaya, E. A. (2007). Thermincola ferriacetica sp nov., a new anaerobic, thermophilic, facultatively chemolithoautotrophic bacterium capable of dissimilatory Fe(III) reduction. Extremophiles 11, 1–7. doi: 10.1007/S00792-006-0004-7
Zhang, B. L., Wu, X. K., Zhang, G. S., Li, S. Y., Zhang, W., Chen, X. M., et al. (2016). The diversity and biogeography of the communities of Actinobacteria in the forelands of glaciers at a continental scale. Environ. Res. Lett. 11:054012. doi: 10.1088/1748-9326/11/5/054012
Zhang, H., Sekiguchi, Y., Hanada, S., Hugenholtz, P., Kim, H., Kamagata, Y., et al. (2003). Gemmatimonas aurantiaca gen. nov., sp. nov., a gram-negative, aerobic, polyphosphate-accumulating micro-organism, the first cultured representative of the new bacterial phylum Gemmatimonadetes phyl. nov. Int. J. Syst. Evol. Microbiol. 53(Pt 4), 1155–1163. doi: 10.1099/ijs.0.02520-0
Zhang, J., and Lu, Y. (2016). Conductive Fe3O4 nanoparticles accelerate syntrophic methane production from butyrate oxidation in two different lake sediments. Front. Microbiol. 7:1316. doi: 10.3389/fmicb.2016.01316
Zhang, W., Appel, E., Fang, X., Yan, M., Song, C., and Cao, L. (2012). Paleoclimatic implications of magnetic susceptibility in Late Pliocene–Quaternary sediments from deep drilling core SG-1 in the western Qaidam Basin. J. Geophys. Res. 117:B06101. doi: 10.1029/2011JB008949
Zhou, J., Bruns, M. A., and Tiedje, J. M. (1996). DNA recovery from soils of diverse composition. Appl. Environ. Microbiol. 62, 316–322. doi: 10.1128/AEM.62.2.316-322.1996
Keywords: hydrocarbon degradation, magnetic susceptibility, methanogenesis, iron reduction, petroleum contamination, Smithella
Citation: Beaver CL, Atekwana EA, Bekins BA, Ntarlagiannis D, Slater LD and Rossbach S (2021) Methanogens and Their Syntrophic Partners Dominate Zones of Enhanced Magnetic Susceptibility at a Petroleum Contaminated Site. Front. Earth Sci. 9:598172. doi: 10.3389/feart.2021.598172
Received: 24 August 2020; Accepted: 22 February 2021;
Published: 15 March 2021.
Edited by:
Alexandra Abrajevitch, Institute of Tectonics and Geophysics Named After Y. A. Kosygin (RAS), RussiaReviewed by:
Nicole Dopffel, Norwegian Research Institute (NORCE), NorwayOscar Pueyo Anchuela, University of Zaragoza, Spain
Yuki Morono, Japan Agency for Marine-Earth Science and Technology (JAMSTEC), Japan
Copyright © 2021 Beaver, Atekwana, Bekins, Ntarlagiannis, Slater and Rossbach. This is an open-access article distributed under the terms of the Creative Commons Attribution License (CC BY). The use, distribution or reproduction in other forums is permitted, provided the original author(s) and the copyright owner(s) are credited and that the original publication in this journal is cited, in accordance with accepted academic practice. No use, distribution or reproduction is permitted which does not comply with these terms.
*Correspondence: Silvia Rossbach, c2lsdmlhLnJvc3NiYWNoQHdtaWNoLmVkdQ==