- Istituto Nazionale di Geofisica e Vulcanologia, Rome, Italy
Traditional tsunami catalogues are conceived as a collection of tsunamis classified by the generating cause, providing a general description of the effects observed for each tsunami. Those catalogues, even if they provide fundamental information, are not suitable for producing an exhaustive picture of the geographical distribution of the tsunami effects. In this paper we introduce the new Italian Tsunami Effects Database (ITED), a collection of evidence documenting the effects along the Italian coasts from historical times to present. The database comes forth the Euro-Mediterranean Tsunami Catalogue (EMTC) and focusses on the effects of tsunamis observed along the Italian coasts providing descriptive and quantitative information for each OP. The information reported in ITED does not only concern the effects produced by Italian tsunamis, but also those effects produced by tsunamis originated outside the Italian territory. ITED contains 318 OPs, related to 73 Italian tsunamis and to four tsunamis which occurred outside Italy. The database can be accessed through a WebApp that displays for each OP the description of effects, quantitative data (run-up, inundation, withdrawal, etc.) and tsunami intensity with the corresponding bibliographic references. The database also provides the tsunami intensity distribution along time (tsunami-history) for each site, allowing the end user to know how a place has been affected by tsunamis over the time. The information contained in ITED makes this database a useful tool to understand how tsunamis have affected the Italian territory and emphasizes the importance of studying the tsunami hazard along the Italian coasts.
Introduction
Tsunami catalogues can contribute to identify the geographical areas that have experienced these kind of events, which can be a starting point for hazard and risk assessments. In addition, the data contained in such catalogues is also essential to validate those assessments. These catalogues can also help to increase public awareness contributing, in some ways, to reduce the impact of tsunamis. In the last decades, the growing interest in focusing on tsunami studies in the European region led to the compilation of the Euro-Mediterranean Tsunamis Catalogue (EMTC, Maramai et al., 2014), a collection of 290 tsunamis generated in the European and Mediterranean seas from 6150 B.C. to 2014, classified by the generating cause (earthquakes, volcanic activity, landslides) and providing parameters and information on the tsunamis as a whole.
According to EMTC, the Italian coast was struck by 71 tsunamis from 79 A.D. to 2002, placing Italy as one of the Euro-Mediterranean countries most prone to tsunami threat, as confirmed also by the probabilistic tsunami hazard assessment (PTHA) recently performed for the Euro-Mediterranean region (Basili et al., 2021). Regarding the triggering cause, the Italian tsunamis contained in EMTC are mostly generated by moderate magnitude earthquakes that occurred offshore or inland close to the coastline, nevertheless volcanic activity plays a significant role in tsunami generation, particularly Stromboli (Aeolian Islands) and Vesuvius volcanoes have triggered around ten tsunamis, mostly with local effects. The majority of the EMTC Italian tsunamis are ranked as high quality, being well documented. The quality of each event is given by the reliability, an index ranging from 0 (very improbable tsunami) to 4 (definite tsunami) (Tinti et al., 2004). According to the Sieberg-Ambraseys scale (Ambraseys, 1962), based on the effects observed along the coasts, most of the Italian tsunamis (about 75%) can be classified from low to rather strong intensity events, the rest caused severe damage and victims being assessed as high intensity events.
The existing tsunami catalogues currently available are based on the generating source (i.e., De Lange and Healy, 1986; Papadopoulos et al., 2000; Soloviev et al., 2000; Baptista and Miranda, 2009), listing its parameters and providing a general description of the effects observed. Even if they contain fundamental information, presenting this information only in a descriptive manner, do not allow an effective use of the data, as they do not provide a complete picture of the geographical distribution of the tsunami effects. In fact, the user can get a general overview of the effects produced by the tsunami but cannot easily get an idea of how the tsunami affected the different stretches of coast. Accurate information on the effects of tsunamis in terms of run-up and flooding values, could be a valuable resource for validating and tuning the inundation models used to assess tsunami risk (Kaiser et al., 2011). Considering the aforementioned gaps, based on the EMTC, a new database was compiled (ITED-Italian Tsunami Effects Database), starting from the general descriptions of the tsunamis that impacted Italy available in EMTC and focussing the attention on the sites interested by those tsunamis. ITED is an ancillary database and provides georeferred and detailed documented information on the effects (such as run-up, flooding, sea withdrawal, evidence of inundation, transport of sediment or objects on the coast, number of observed waves, tidal records, damage, casualties). The two databases, ITED and EMTC, are entirely interconnected and their information, available either as pop up display or tables, can be consulted and downloaded through a GIS WebApp (https://tsunamiarchive.ingv.it/ited.1.0/) that allows the user to switch from one database to another.
As described in Maramai et al. (2014), most of the data contained in EMTC has been assigned with high reliability value that was then transmitted to ITED. This characteristic makes ITED a tool that can provide a fundamental contribution to understand how tsunamis have affected the Italian territory and the importance of studying the tsunami hazard along the Italian coasts. Great effort has been made to extrapolate as much quantitative data as possible, arranging them in tabular form and allowing the user to easily download them.
Materials
Italian Tsunami Effects Database (ITED) Characteristics and EMTC2.0
The Italian Tsunami Effect Database (ITED) has been compiled by selecting and analyzing the information already available in the portion of the EMTC dataset related to the Italian tsunamis, aiming to enhance the usability of the data.
Pointing to include on ITED new information on the effects observed at different locations an accurate research and analysis of the recent studies available in literature regarding Italian events was performed. Cross-checking with the recently published Catalogue of Strong Earthquakes in Italy (CFTI5Med, Guidoboni et al., 2018) was also carried out to produce a database as complete as possible.
The Italian tsunamis of seismic origin currently on ITED have been linked to the Parametric Catalogue of Italian Earthquakes (CPTI15, Rovida et al., 2016), adopted as the reference earthquake catalogue. This choice led to reappraise some Italian events that in EMTC had been classified with an unreliable seismic cause and to achieve the interoperability with CPTI15.
This process enabled to update also the Italian tsunamis in the EMTC, giving rise to the release of a new version, EMTC2.0. Compared to the old version, EMTC2.0 has undergone several changes. Additional information has enriched the knowledge on the tsunamis in the catalogue requiring leading to the revaluation of some parameters, such as reliability, intensity, generating cause, etc. Due to these relevant amendments, 63 Italian events were updated with respect to EMTC. The number of records has been increased since two events, not analysed in the first version, have been appended, namely the December 10, 1542 (Eastern Sicily) and the December 23, 1690 (Central Adriatic). The first one was triggered by a destructive earthquake (M = 6.7, Rovida et al., 2016) occurred during a seismic sequence in Southeastern Sicily, causing the destruction of some villages. Coeval sources referred that “… after the shock the city of Augusta was almost submerged by the sea and many people were drowned” (Guidoboni et al., 2018). As far as the 1690 event is concerned, a severe earthquake (M = 5.6, Rovida et al., 2016) hit the Central Adriatic region causing victims and severe damage at Ancona and in some neighboring villages. According to the coeval source Bonito (1691), “in the beach of Ancona the boats touched the sea bottom and then they lifted up being shaken due to the sea water agitation.”
ITED provides details on the effects of tsunamis observed/measured at several Observation Points (OP) that are geographically identifiable. When OPs cannot be exactly geo-localized, they are associated to toponymal coordinates of the nearest known locality, hereafter called Place Names (PNs), contained in the INGV internal Gazetteer, which is the unified geographical reference system for macroseismic observations of the Italian Macroseismic Database (DBMI, Locati et al., 2016). When the descriptions of effects were very detailed, it was possible to identify more observation points (OPs) related to the same PN. Currently, ITED contains 318 OPs at 189 PNs, providing quantitative and descriptive information.
For each OP the description of the tsunami effects found in literature, accompanied by the corresponding bibliographic references, can be accessed through a pop-up window, where quantitative data (run-up, inundation, withdrawal, etc. as shown in Figure 1) are also displayed. On the basis of the description, the estimated intensity of the phenomenon (local intensity) has been assigned to each point, assessed according to both the Sieberg-Ambraseys and the Papadopoulos-Imamura (Papadopoulos and Imamura, 2001) scales. These data populate an attribute table that can be retrieved by querying the database.
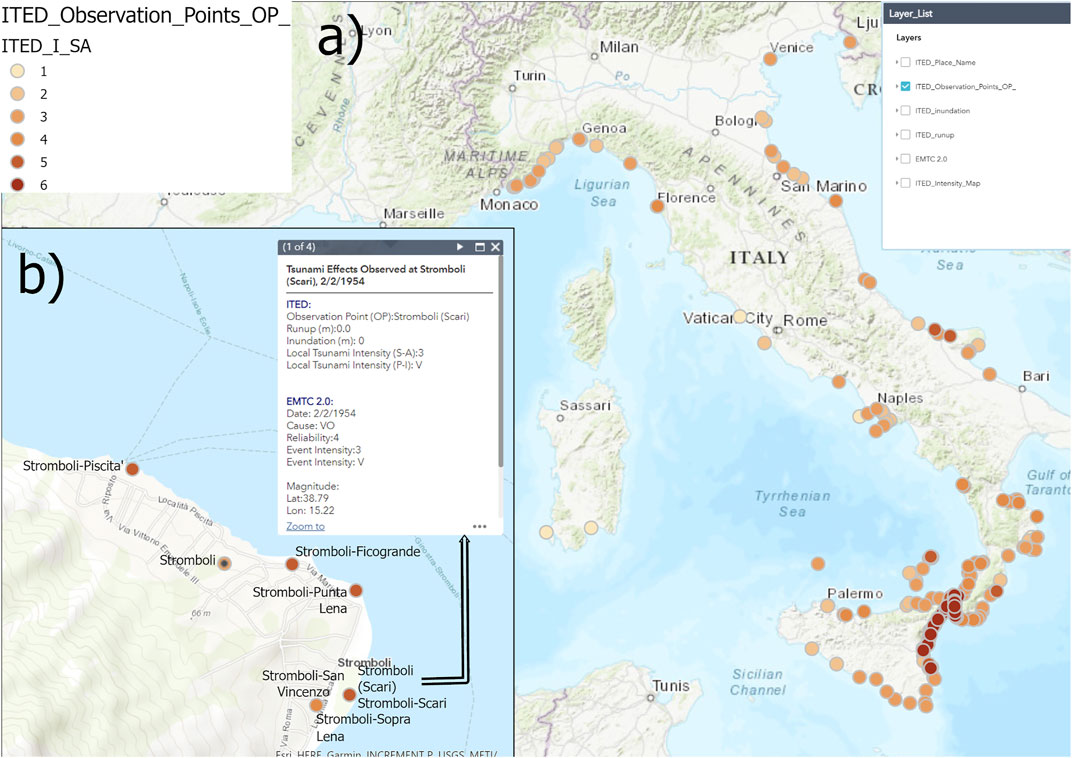
FIGURE 1. (A) Screenshot of the WebApp layer ITED_Obervation_Point. The complete Layer list is also shown. (B) Stromboli Island: the black dot indicates the PN (Stromboli-San Vincenzo), whereas the brown dots indicate all the nearby OPs, colored according to local tsunami intensity. By clicking on the OP a pop-up allow the user to get details about the tsunami effects at that point (Service Layer Credits: sources: ©Esri, HERE, Garmin, Intermap, increment P Corp., GEBCO, USGS, FAO, NPS, NOAA, NRCAN, GeoBase, IGN, Kadaster NL, Ordnance Survey, Esri Japan, METI, NASA, Esri China (Hong Kong), ©swisstopo, ©OpenStreetMap contributors 2019. Distributed under a Creative Commons BY-SA License).
Figure 1A shows the main screen of the ITED WebApp, displaying the geographical distribution of the 318 OPs, coloured according to their local intensity value. In Figure 1B the example of Stromboli Island (Aeolian Islands) OPs are coloured according to the local intensity value while PN are represented by black dots.
ITED allows the user to view the intensity map for each tsunami, i.e., to view all the OPs related to a single tsunami event, with their local intensity. The December 28, 1908 Messina tsunami is by far the most documented event in Italy having 119 OPs along the Italian coasts. The information mostly comes from the reports of Platania (1909) and Baratta (1910) that soon after the event performed, independently, detailed surveys along Sicily and Calabria coasts. The 1908 tsunami spread over a few hundred kilometers reaching the island of Malta to the South (about 250 km away) with a sea level rise of more than 1 m causing slight damage. Northernmost, the event was recorded at the tide gauge of Civitavecchia, located about 450 km away. In Figure 2A the snapshot of ITED WebApp showing the intensity map for the 1908 Messina tsunami is visible.
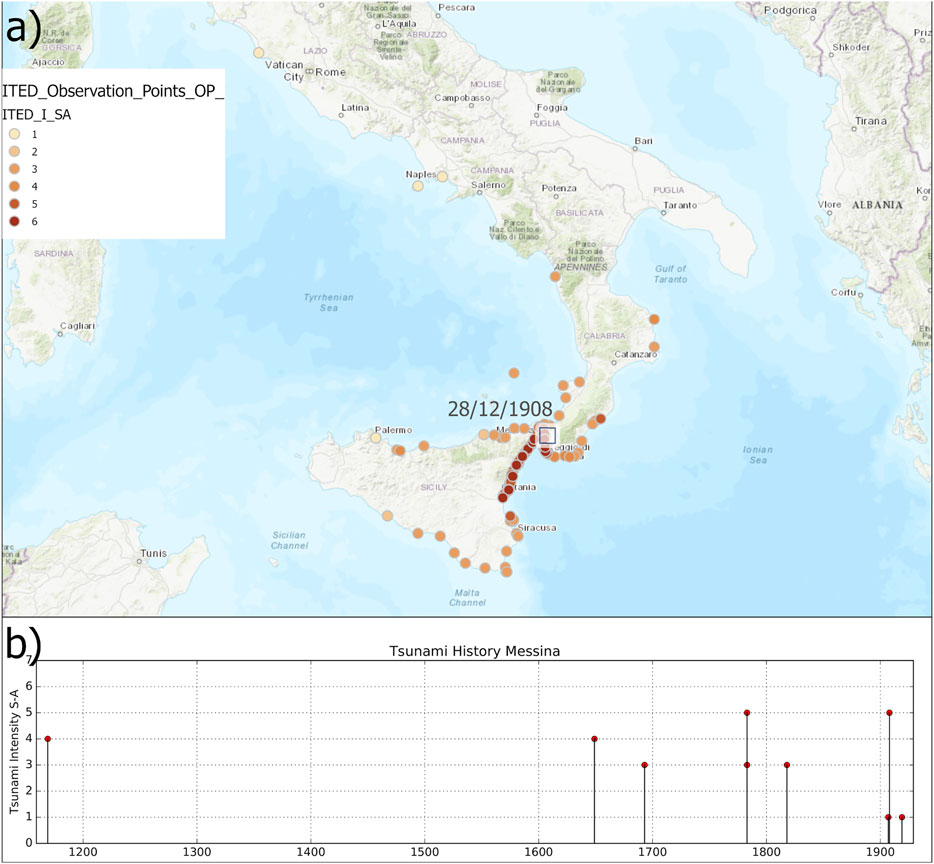
FIGURE 2. (A) Snapshot of the OPs where the 1908 tsunami was observed, OPs symbols are colored according to the local tsunami intensity (Service Layer Credits: sources: ©Esri, HERE, Garmin, Intermap, increment P Corp., GEBCO, USGS, FAO, NOAA, NPS, NRCAN, GeoBase, IGN, Kadaster NL, Ordnance Survey, Esri Japan, METI, NASA, Esri China (Hong Kong), ©swisstopo, ©OpenStreetMap contributors 2019. Distributed under a Creative Commons BY-SA License). (B) Example of tsunami history contained in ITED: Messina.
As far as run-up values are concerned, in ITED there are 91 OPs for which a run-up value is specified: 7 OPs show values higher than 10 m, all generated by the 1908 Messina and by the 2002 Stromboli (Aeolian Island) events. The 91 OPs for which run-up value is available count for four tsunamis of seismic origin, one event associated with a large landslide triggered by an earthquake (February 6, 1783) and of two events associated with the Stromboli volcano activity (1930 and 2002). The February 6, 1783 tsunami was generated by a 6 × 10⁶ m3 landslide (Zaniboni et al., 2016; 2019) and caused more than 1,500 fatalities at Scilla (Tyrrhenian Calabria) where most of the people, frightened by the ongoing sequence of earthquakes, sought shelter on the beach close to the town and were surprised by the unexpected waves that reached the roofs of the buildings with a run-up of 9 m (Graziani et al., 2006). ITED also contains 70 OPs where inundation distances are specified, some of them are the same as those for which the run-up values are also available. For 32 OPs the inundation extent is greater or equal to 100 m. According to coeval sources, the maximum value was observed during the January 11, 1693 tsunami in Eastern Sicily where: “At Mascali the sea flooded the shore for about one mile inland” (Boccone, 1697).
The ITED WebApp allows the user to explore the tsunami intensity distribution along time (tsunami history) of all the PNs reported, and to know how many times a site has been hit by a tsunami in the past and how severe was the impact (Figure 2B). Among the 189 PNs included in the database, 51 experienced tsunami effects more than once. Details of each observation are supplied for every PN: the tsunami-history of the place is composed by a bar chart indicating the tsunami intensity vs the year of occurrence and by a table containing the detailed description of the observations. In Figure 2B the Messina tsunami history diagram is shown: as historical sources testify, Messina was hit by nine tsunamis, starting from the February 4, 1169 event that caused the flooding of the town. The February 5, 1783 and the December 28, 1908 were the strongest, reaching in Messina local tsunami intensity 5 according to Sieberg-Ambraseys scale.
Concerning the impact of the Italian tsunamis in terms of the geographical area involved, 14 tsunamis were observed at regional scale that indicates tsunami propagation for a distance greater than 100 km from the source. Besides the 1908 Messina tsunami, it is worth mentioning the January 11, 1693 Eastern Sicily event that was observed along the whole Ionian coasts of Sicily from Siracusa to Messina. Likewise, the February 23, 1887 Ligurian tsunami involved more than 200 km of coast, with run-up locally exceeding 1 m, and with remarkable sea withdrawals leaving boats stranded in many sites. All the regional events were generated by earthquakes, with the exception of the 2002 Stromboli Island tsunami, which was observed up to the coasts of Campania (about 140 km North). This event was triggered by a huge submarine (20 × 106 m3) and sub-aerial (4–9 × 10⁶ m3) slides (Tinti et al., 2005) occurred during a relevant volcanic eruption on the Sciara del Fuoco, the steep flank of the Stromboli volcano. In the northern part of the island a maximum run-up of 10.90 m was measured (Tinti et al., 2006).
In order to have an exhaustive and complete collection of the tsunami effects observed along the Italian coasts, tsunamis generated outside the Italian territory have also been taken into account. As a result, two recent Greek events occurred in the Ionian Sea, respectively in November 2015 and October 2018 were appended to EMTC 2.0. The former was generated by a Mw = 6.4 earthquake near Lefkas Island and studied by (Ganas et al., 2015) and the latter occurred close to the island of Zakynthos, both were recorded at some Italian tide gauges (Papadopoulos et al., 2019). Other two events, already present in the EMTC, have produced effects on the Italian coast: the July 21, 365 tsunami, the most well-known and catastrophic event that has ever occurred in the Mediterranean, and the May 21, 2003 Boumerdès (Algeria) tsunami. In relation to the 365 event, the destructive tsunami was caused by a great catastrophic earthquake occurred in Crete, involving most of the Eastern and Central Mediterranean, reaching also the Southern Italy coasts and the Levantine coasts. Unfortunately, the information on the tsunami impact in Sicily is very little and too vague to consent the identification of the precise location where effects might have been observed. According to Putortì (1912), effects of the 365 tsunami in Reggio Calabria would have been documented by an inscription found during archaeological excavations. Finally, the tsunami generated by the May 2003 Algerian earthquake, causing damage in the Baleares, was recorded at some Italian tide gauges in the Tyrrhenian and Ligurian Seas.
ITED WebApp
The information contained in ITED has been made available to the public through the display of a web application that allows the users to visualize the georeferenced information on a map. The dedicated WebApp has been developed using the Esri ArcGIS online environment and can be freely accessed without the need of an Esri user account. The ITED WebApp (Maramai et al., 2019a), accessible through https://tsunamiarchive.ingv.it/ited.1.0/, hosts six layers containing the information available regarding all the tsunami effects observed at the Italian coasts. The layers loaded in the WebApp are listed in Figure 1A:
(1) ITED_Observation_Points_OP_, where the 318 OPs are visible and coloured according to the local tsunami intensity on the Sieberg Ambraseys scale;
(2) ITED_Place Name with the 189 PNs hit by tsunamis and their tsunami histories;
(3) ITED_inundation where the 70 OPs with reported inundation values are visible with symbols proportional to the extent of the metric;
(4) ITED_runup, where the 91 OPs with reported run-up values are visible with symbols proportional to the extent of the metric;
(5) EMTC 2.0 layer that hosts the new release of database of the tsunami events, including the two recently added events (November 2015 and October 2018);
(6) ITED_Intensity_Map layer, where it is possible to select an event of interest and show all the OPs related to it, with their local tsunami intensity (see Figure 2A).
Figure 3 shows the runup (ITED_runup, black bars) and inundation (ITED_inundation, blue halos) layers. Symbols refer to all values available in the database.

FIGURE 3. Screenshot of the WebApp showing ITED_runup (black bars) and ITED_inundation (blue halos) layers; symbols are proportional to the measured values (Service Layer Credits: sources: ©Esri, HERE, Garmin, Intermap, increment P Corp., GEBCO, USGS, FAO, NPS, NRCAN, NOAA, GeoBase, IGN, Kadaster NL, Ordnance Survey, Esri Japan, METI, Esri China (Hong Kong), ©swisstopo, ©OpenStreetMap contributors 2019. Distributed under a Creative Commons BY-SA License).
As said earlier, the ITED database is linked to the EMTC 2.0 catalogue, which is also displayed in ITEDWebApp as a point layer called EMTC 2.0 (seeFigure 1A). Similarly to the previous version EMTC still available at (http://www.arcgis.com/apps/StorytellingTextLegend/index.html?appid=8329c2ad9b7f43c18562bdddc6c1ad26), EMTC 2.0 contains information such as date, time, reliability, cause, intensity, magnitude (if seismic), coordinates, macroseismic intensity and a detailed tsunami description including a list of the related bibliographical references that is reachable from the pop-up generated when clicking on each point of the layer.
The ITED WebApp allows the user to customize which kind of information to retrieve; through five widgets the user can choose the layers to be displayed (Layer_List), filter information (Group Filter), select the intensity map by entering the event data (Tsunami Intensity Map), query each of the available layers (query) and print a selected extent of the map. The tabular information contained in each layer of the WebApp can be exported in csv format by using several group filters (i.e., selecting data from the extent viewed, or by date, reliability, cause, site etc.; or by a combination of several of these parameters). The print widget allows the user to export and print maps with the results of their specific queries or a general view of the database. Data contained in ITED WebApp are freely accessible at the link https://tsunamiarchive.ingv.it/ited.1.0/
Data Analysis
ITED contains tsunami observations related to 77 tsunamis, 73 being originated within the Italian territory and four triggered by sources located in neighboring Mediterranean countries causing slight effects on the Italian coasts. Following the pattern of the rest of the world, the majority of tsunamis observed or registered in Italy were caused by earthquakes (68%), see Figure 4. An important remark should be made regarding the activity of the Vesuvius and the Aeolian Islands volcanoes which has caused over the centuries a not negligible number of events (16%); in particular, the Stromboli volcano (Aeolian Islands) whose activity has generated the majority of the events of volcanic origin. On the basis of historical evidence and looking at the tsunami history, all these events have occurred since the 20th century, leaving open the possibility that the number could be even higher (Figure 5). Only two tsunamis were caused by mass failures due to mere gravity load events. Finally, for nine Italian events the reported description is typical of a tsunami but the generating mechanism has not been yet found, so that they are classified with an unknown cause, needing further investigation.
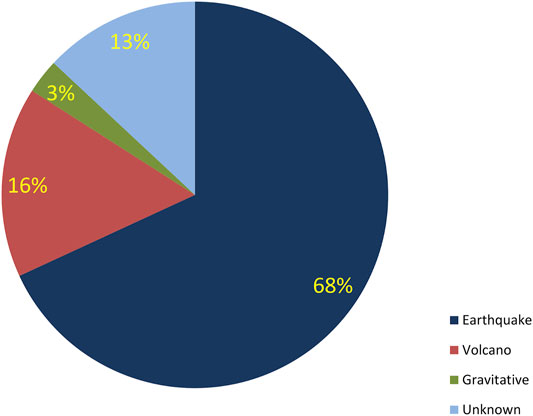
FIGURE 4. Distribution of the tsunamis in ITED by generating cause, with the number of tsunamis indicated for each cause.
Following the same criteria established for EMTC, in the new version EMTC2.0 tsunamis are classified according to their quality by means of their reliability index, the value can be considered by the end user as an indicator of the trustworthiness of the data retrieved. Including low reliability index events, allows inserting in the database historical tsunamis for which scarce information is available. This on one hand, enables the possibility to report the information available for the event and on the other hand warns the end user that the information related to that event is not as solid to be considered reliable. The number of unreliable tsunamis decreases over the years until the most recent time intervals in which almost exclusively reliable tsunamis are present, as shown in Figure 6. This is clearly an indication that data tends to be more abundant and more reliable in recent centuries and with the increasing use of sea-level instrumentation. The time period intervals in Figure 6 are variable, being fixed to 50 years from 1700 a.D. to today. According to Figure 6, about half of the entries in the catalogue are classified as definite tsunamis, having been attributed reliability value of 4. There are only three entries prior to 1300 a.D. and five prior to 1600 a.D. while in later times the total number of entries per century is rather stable (on average 16 events). This provides information for estimating the possible completeness of the database from the 17th century onwards, even if it must be stressed that the number of events do not allow to perform a robust statistical analysis.
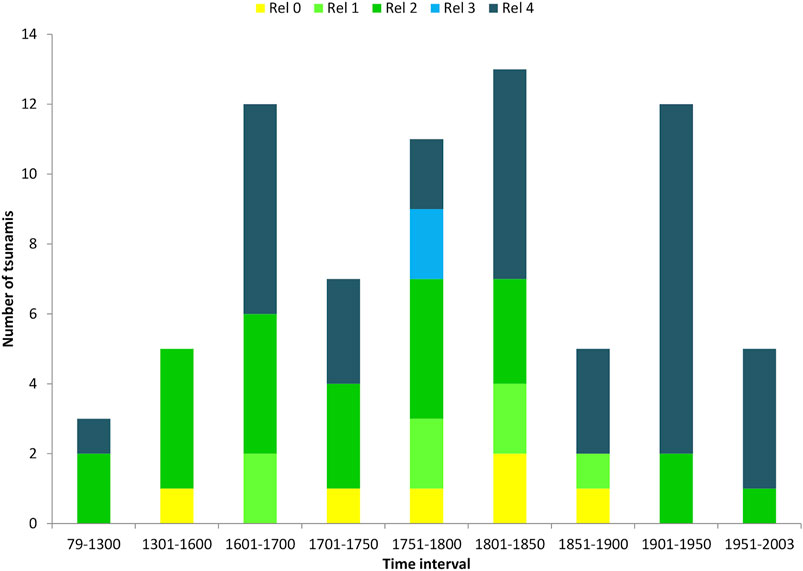
FIGURE 6. Time distribution of the Italian tsunamis in EMTC2.0 per reliability classes, Rel 4: definite tsunami, Rel 3: probable tsunami, Rel 2: questionable tsunami, Rel 1: improbable tsunami, Rel 0: very improbable tsunami.
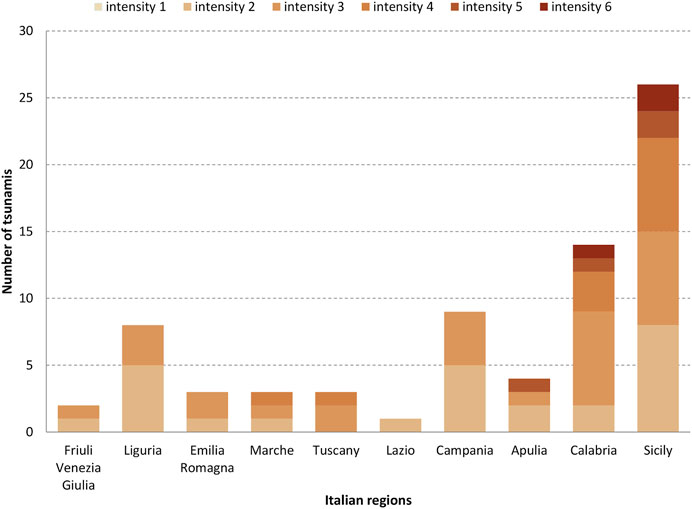
To have a picture of the severity of the Italian tsunamis and their impact along the coast, in Figure 7 a bar chart of intensities per Italian region is shown. More than 50% of the tsunamis with origin within the Italian territory have been generated in the Calabria and Sicily regions: excluding the 1627 tsunami that occurred in Apulia, the most destructive tsunamis, with intensities 5 and 6, originated in these two regions.
Considering the local intensities assigned at the different OPs, the bar diagram in Figure 8 shows the distribution of local intensity per Italian provinces. For the sake of reducing the information to the essentials, only provinces with at least three intensity values assigned were represented. Blue bars enclose the provinces of the Italian regions that have the highest number of OPs. On the left side of the graph provinces of the Liguria region are shown: local intensities in this region do not exceed intensity value 3 and most of the OPs are related to the 1887 tsunami. Calabria and Sicily are definitely the Italian regions most affected by tsunamis, not only in terms of numbers of observations but also in terms of severity of effects. Messina (ME) and Reggio Calabria (RC) are the provinces with the highest number of OPs with the most severe effects.

FIGURE 8. Distribution of local intensities per Italian provinces with at least three Observation Points (OPs).
Finally, a further consideration on the impact of tsunamis generated by distant sources arises by looking at Figure 9 that shows the OPs related to the 4 external tsunamis. It can be seen that the coasts of Sicily and Apulia are exposed to the tsunamis generated by the subduction zone of the Hellenic Arc, while the coasts of Sardinia and Liguria may be affected by the tsunamis generated by the Algerian thrust zone.
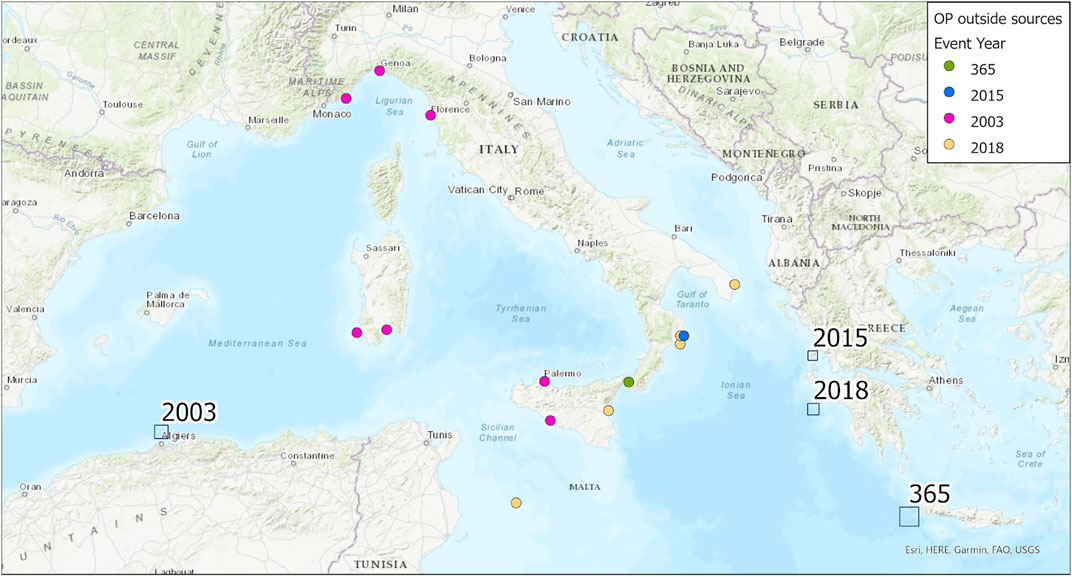
FIGURE 9. Observation Points (OPs) related to the four tsunamis generated in the neighboring countries. Blue squares indicate the generating sources.
Discussion
The ITED database comes forth from the information contained in Euro-Mediterranean Tsunami Catalogue (Maramai et al., 2014) related to effects of tsunamis observed or registered along the Italian coasts. ITED subdivides the general tsunami information contained on EMTC, geographically locating the specific information for each affected site and classifying the effects observed into intensity classes. The database is displayed through a WebApp, developed using the Esri ArcGIS online environment letting the user to retrieve information, to switch from ITED to EMTC 2.0 and vice versa, or consult them at the same time.
The ITED WebApp allows the user to query the database, export the data of interest, explore the tsunami history of all the main sites and print the information. The implementation of ITED also led to a new release of EMTC, called EMTC 2.0, that includes the updating of new information regarding some tsunami parameters, such as the reliability, intensity, generating cause, etc., as well as the appending of other two tsunamis, recently occurred within the Greek territory and whose effects were recorded along the Italian coasts. ITED was specifically built to meet the needs of the tsunami hazard community, thus providing useful information that can improve the knowledge of how much the Italian coasts are exposed to tsunamis. The database contains a great number of reliable data that can contribute to validate the models used for hazard assessment along the Italian coasts and can give useful indications for the realization of inundation maps and emergency plans. ITED can also be used as a tool for increasing public awareness and, therefore, for reducing the risk of tsunamis.
Data Availability Statement
The datasets presented in this study can be found in online repositories. The names of the repository/repositories and accession number(s) can be found below: https://tsunamiarchive.ingv.it/ited.1.0/.
Author Contributions
AM, LG, and BB equally contributed to the conception and design of the study. AM and LG have prepared, revised and organised in the suitable format the data included in the database. BB realized the dedicated WebApp in ArcGis. AM, LG, and BB wrote the manuscript. All authors contributed to manuscript revision, read, and approved the submitted version.
Conflict of Interest
The authors declare that the research was conducted in the absence of any commercial or financial relationships that could be construed as a potential conflict of interest.
Acknowledgments
Authors thank Dr. Mario Locati, (INGV, Milan) for the technical support during the realization of the ITED database and for contributing to link the ITED database to the INGV Gazetteer and to DBMI database. Authors wish to thank also Dr. Andrea Rovida and Dr. Andrea Antonucci (INGV, Milan) for their contribution. This manuscript has been released as a pre-print at [https://nhess.copernicus.org/preprints/nhess-2019-241/], (Maramai et al., 2019b). We also would like to thank the two anonymous referees for their comments and suggestions that helped to improve this paper.
References
Ambraseys, N. (1962). Data for the investigation of the seismic sea-waves in the Eastern Mediterranean. Bull. Seismol. Soc. Am. 52, 895–913.
Baptista, M. A., and Miranda, J. M. (2009). Revision of the Portuguese catalog of tsunamis. Nat. Hazards Earth Syst. Sci. 9, 25–42. doi:10.5194/nhess-9-25-2009
Baratta, M. (1910). La catastrofe sismica calabro messinese (28 dicembre 1908). Roma: Relazione alla Società Geografica Italiana, Vol 2.[in Italian].
Basili, R., Brizuela, B., Herrero, A., Iqbal, S., Lorito, S., Maesano, F. E., et al. (2021). The making of the NEAM Tsunami Hazard Model 2018 (NEAMTHM18). Front. Earth Sci. 8, 616594. doi:10.3389/feart.2020.616594
Boccone, P. (1697). “Osservazione prima all'Illustrissimo et Eccellentissimo Sig. Francesco Uldarico intorno il terremoto della Sicilia seguito l'anno 1693,” in Museo di Fisica e di esperienze variato, e decorato di oservazioni naturali, e ragionamenti secondo i principiy de' moderni. Editor G. B. Zuccato (Venezia), 4, 1–16. [in Italian].
Bonito, M. (1691). Terra tremante, o vero continuatione de' terremoti dalla Creatione del Mondo fino al tempo presente. Naples, Italy: Napoli, 822.[in Italian].
De Lange, W. P., and Healy, T. R. (1986). New Zealand tsunamis 1840-1982. N. Z. J. Geol. Geophys. 29 (1), 115–134. doi:10.1080/00288306.1986.10427527
Ganas, A., Briole, P., Papathanassiou, G., Bozionelos, G., Avallone, A., Melgar, D., et al. (2015). A preliminary report on the Nov 17, 2015 M=6.4 South lefkada earthquake, Ionian Sea, Greece. Available at: https://www.emsc-csem.org/Doc/Additional_Earthquake_Report/470390/Lefkada%2017%20Nov%202015%20earthquake%20report.pdf (Accessed December 4, 2015).
Graziani, L., Maramai, A., and Tinti, S. (2006). A revision of the 1783-1784 Calabrian (southern Italy) tsunamis. Nat. Hazards Earth Syst. Sci. 6, 1053–1060. doi:10.5194/nhess-6-1053-2006
Guidoboni, E., Ferrari, G., Mariotti, D., Comastri, A., Tarabusi, G., Sgattoni, G., et al. (2018). CFTI5Med, Catalogo dei Forti Terremoti in Italia (461 a.C.-1997) e nell’area Mediterranea (760 a.C.-1500). Istituto Nazionale di Geofisica e Vulcanologia (INGV). doi:10.6092/ingv.it-cfti5
Kaiser, G., Scheele, L., Kortenhaus, A., Løvholt, F., Römer, H., and Leschka, S. (2011). The influence of land cover roughness on the results of high resolution tsunami inundation modeling. Nat. Hazards Earth Syst. Sci. 11, 2521–2540. doi:10.5194/nhess-11-2521-2011
Locati, M., Camassi, R., Rovida, A., Ercolani, E., Bernardini, F., Castelli, V., et al. (2016). DBMI15, the 2015 version of the Italian macroseismic database. Ist. Naz. Geofis. Vulcanol. doi:10.6092/INGV.IT-DBMI15
Maramai, A., Brizuela, B., and Graziani, L. (2014). The euro-mediterranean tsunami catalogue. Ann. Geophys. 57 (4), S0435. doi:10.4401/ag-6437
Maramai, A., Graziani, L., and Brizuela, B. (2019a). Italian tsunami effects database (ITED). Ist. Naz. Geofis. Vulcanol. (INGV). doi:10.13127/tsunami/ited.1.0
Maramai, A., Graziani, L., and Brizuela, B. (2019b). Italian Tsunami Effects Database (ITED): the first database of tsunami effects observed along the Italian coasts. Nat. Hazards Earth Syst. Sci. Discuss. [preprint]. doi:10.5194/nhess-2019-241
Papadopoulos, G. A., Agalos, A., Annunziato, A., Bocchini, G. M., Charalampakis, M., Novikova, T., et al. (2019). “The South Ionian Sea earthquake (Mw6.8) of 25 october 2018 and its associated tsunami,” in 21st EGU General Assembly, EGU2019, Proceedings from the conference, April7–12, 2019, Vienna, Austria. 21, 13705.
Papadopoulos, G. A., and Imamura, F. (2001). A proposal for a new tsunami intensity scale. Tsunami symposium 2001 Proc., Aug. 7-10, 2001, Seattle, Washington, 559–577.
Papadopoulos, G. A., Vassilopoulou, A., and Plessa, A. (2000). A new catalogue of historical earthquakes in the Corinth Rift, Central Greece: 480 B.C. - A.D. 1910. Natl. Obs. Athens Inst. Geodyn. Publ. n 12 Athens.
Platania, G. (1909). Il maremoto dello Stretto di Messina del 28 Dicembre 1908. Boll. Soc. Sismol. Ital. 13, 369–458.[in Italian].
Putortì, N. (1912). Di un titolo termale scoperto in Reggio Calabria. Atti Accad. Naz. Lincei, RSM 5 (21), 791–802.
A. Rovida, M. Locati, R. Camassi, B. Lolli, and P. Gasperini (Editors) (2016). Catalogo Parametrico dei Terremoti Italiani (CPTI15). Istituto Nazionale di Geofisica e Vulcanologia (INGV). doi:10.6092/INGV.IT-CPTI15
Soloviev, S. L., Solovieva, O. N., Go, C. N., Kim, K. S., and Schetnikov, N. A. (2000). Tsunamis in the Mediterranean sea 2000 B.C. - 2000 A.D. New York: Kluwer Academic Publishers.
Tinti, S., Maramai, A., and Graziani, L. (2004). The new catalogue of Italian tsunamis. Nat. Hazards 33 (3), 439–465. doi:10.1023/B:NHAZ.0000048469.51059.65
Tinti, S., Armigliato, A., Manucci, A., Pagnoni, G., and Zaniboni, F. (2005). Landslides and tsunamis of December 30, 2002 at Stromboli, Italy: numerical simulations. Boll. Geofis. Teorica Ed. Appl. 46 (2-3), 153–168.
Tinti, S., Maramai, A., Armigliato, A., Graziani, L., Manucci, A., Pagnoni, G., et al. (2006). Observations of physical effects from tsunamis of December 30, 2002 at Stromboli volcano, southern Italy. Bull. Volcanology 68 (5), 450–461. doi:10.1007/s00445-005-0021-x
Zaniboni, F., Armigliato, A., and Tinti, S. (2016). A numerical investigation of the 1783 landslide-induced catastrophic tsunami in Scilla, Italy. Nat. Hazards 84, 455–470. doi:10.1007/s11069-016-2461-3
Keywords: tsunami, tsunami effects, historical tsunami, Italian coasts, tsunami intensity, tsunami history, tsunami hazard
Citation: Maramai A, Graziani L and Brizuela B (2021) Italian Tsunami Effects Database (ITED): The First Database of Tsunami Effects Observed Along the Italian Coasts. Front. Earth Sci. 9:596044. doi: 10.3389/feart.2021.596044
Received: 18 August 2020; Accepted: 16 February 2021;
Published: 18 March 2021.
Edited by:
Tiziana Rossetto, University College London, United KingdomReviewed by:
Raffaele De Risi, University of Bristol, United KingdomAlison Raby, University of Plymouth, United Kingdom
Copyright © 2021 Maramai, Graziani and Brizuela. This is an open-access article distributed under the terms of the Creative Commons Attribution License (CC BY). The use, distribution or reproduction in other forums is permitted, provided the original author(s) and the copyright owner(s) are credited and that the original publication in this journal is cited, in accordance with accepted academic practice. No use, distribution or reproduction is permitted which does not comply with these terms.
*Correspondence: Alessandra Maramai, YWxlc3NhbmRyYS5tYXJhbWFpQGluZ3YuaXQ=
 Alessandra Maramai
 Laura Graziani
 Beatriz Brizuela
