 Achmad F. N. Sarjan1*
 Zulfakriza Zulfakriza2,3*
 Andri D. Nugraha2,3
 Shindy Rosalia2,3
 Shengji Wei4
 Sri Widiyantoro2,3,5
 Phil R. Cummins2,6
 Muzli Muzli4,7
 David P. Sahara2
 Nanang T. Puspito2,3Awali Priyono2
 Haunan Afif8
- 1Graduate Program of Geophysical Engineering, Faculty of Mining and Petroleum Engineering, Bandung Institute of Technology, Bandung, Indonesia
- 2Global Geophysics Research Group, Faculty of Mining and Petroleum Engineering, Bandung Institute of Technology, Bandung, Indonesia
- 3Center for Earthquake Science and Technology, Bandung Institute of Technology, Bandung, Indonesia
- 4Earth Observatory of Singapore, Nanyang Technological University, Singapore, Singapore
- 5Faculty of Engineering, Maranatha Christian University, Bandung, Indonesia
- 6Research School of Earth Sciences, The Australian National University, Canberra, ACT, Australia
- 7Indonesian Meteorological, Climatological, and Geophysical Agency, Jakarta, Indonesia
- 8Geological Agency, Center for Volcanology and Geological Hazards Mitigation, Ministry of Energy and Mineral Resources, Bandung, Indonesia
We have successfully conducted the first ambient noise tomography on the island of Lombok, Indonesia using local waveform data observed at 20 temporary stations. Ambient noise tomography was used to delineate the seismic velocity structure in the upper crust. The waveform data were recorded from August 3rd to September 9th, 2018, using short-period and broadband sensors. There are 185 Rayleigh waves retrieved from cross-correlating the vertical components of the seismograms. We used frequency-time analysis (FTAN) to acquire the interstation group velocity from the dispersion curves. Group velocity was obtained for the period range of 1 s to 6 s. The group velocity maps were generated using the subspace inversion method and Fast Marching Method (FMM) to trace ray-paths of the surface waves through a heterogeneous medium. To extract the shear wave velocity (Vs) from the Rayleigh wave group velocity maps, we utilize the Neighborhood Algorithm (NA) method. The 2-D tomographic maps provide good resolution in the center and eastern parts of Lombok. The tomograms show prominent features with a low shear velocity that appears up to 4 km depth beneath Rinjani Volcano, Northern Lombok, and Eastern Lombok. We suggest these low velocity anomalies are associated with Quaternary volcanic products, including the Holocene pyroclastic deposits of Samalas Volcano (the ancient Rinjani Volcano) which erupted in 1257. The northeast of Rinjani Volcano is characterized by higher Vs, and we suggest this may be due to the presence of igneous intrusive rock at depth.
Introduction
Lombok is part of the eastern Sunda Arc, a region of complex and active tectonics, including the Flores Back Arc Thrust which extends east-west from north of Flores to north of Bali Island, transform faults to the east and west of Lombok, and the margin of the Australian Plate to the south of Lombok (Figure 1). This tectonic activity results in a sequence of destructive earthquakes that occurred on July 29th to August 19th, 2018 (Afif et al., under review; Harsuko et al., 2020; Sasmi et al., 2020).
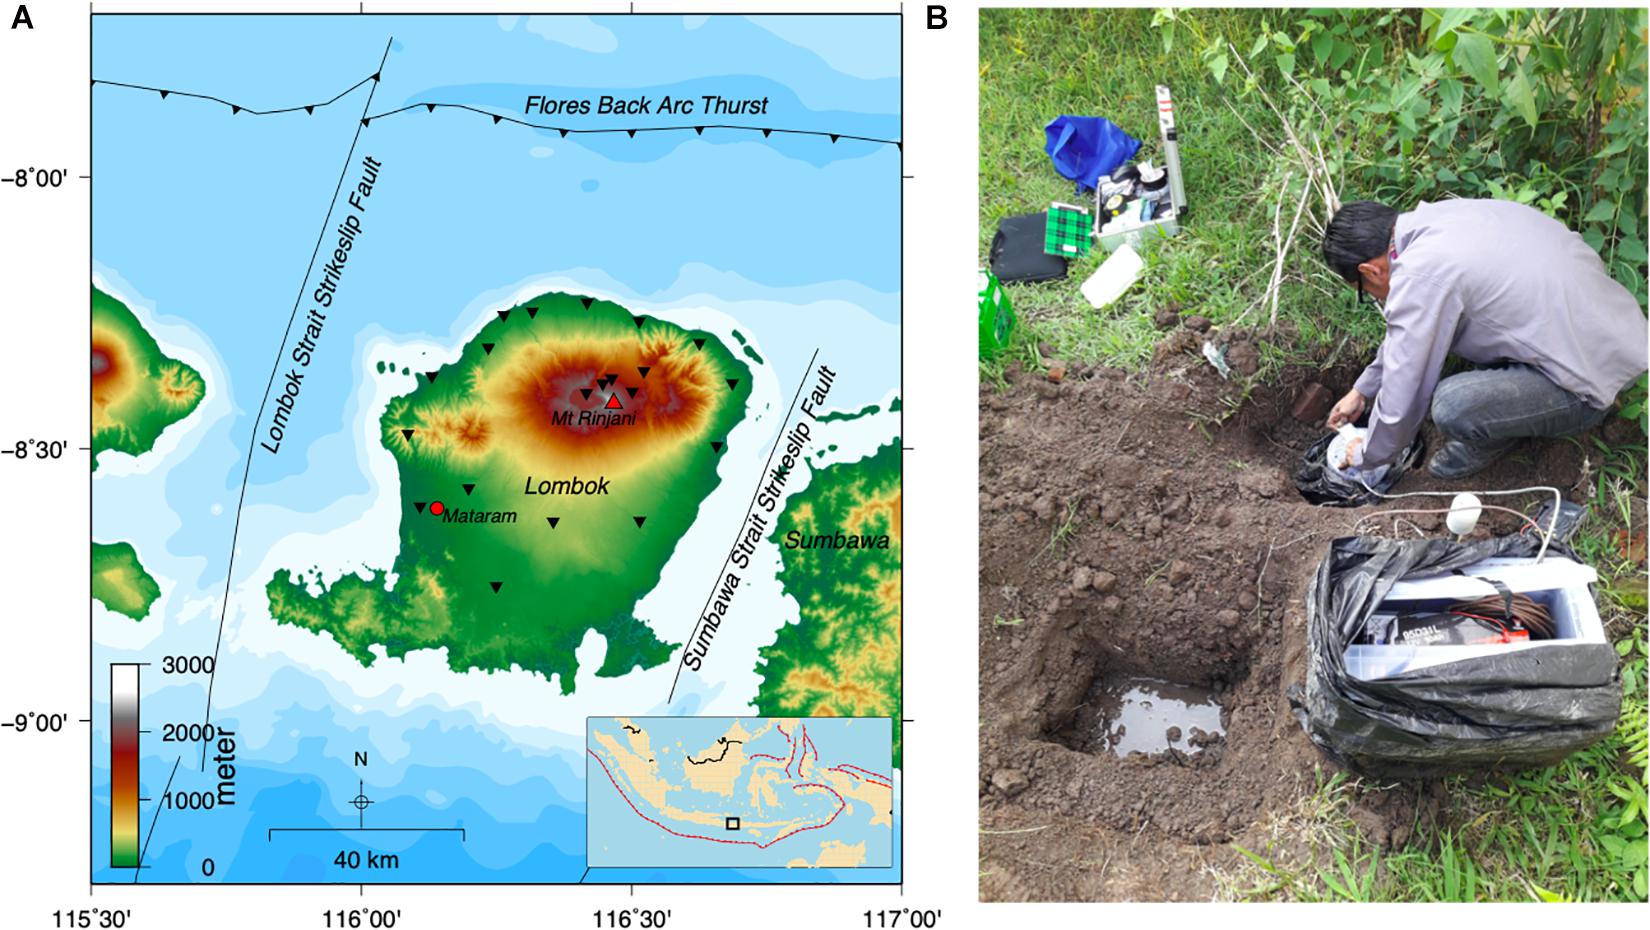
Figure 1. (A) Map of Lombok, Indonesia showing 20 seismic stations used in this study. The black inverted triangle represents the station location while the red triangle represents the Rinjani Volcano. Black lines stand for active fault from Irsyam et al. (2017). (B) Temporary seismic station installation in the field.
The Indonesian Meteorological, Climatological, and Geophysical Agency (BMKG) reported that five significant events with magnitude greater than 6 occurred on Lombok during this period. The sequence began on July 29th with a magnitude 6.4 event, followed by magnitude 7.0 and 5.9 events that occurred on 5th and 9th August, respectively. On August 19th, two strong earthquakes with magnitudes 6.3 and 6.9 struck Lombok again. Historically, only a few significant earthquakes have affected Lombok, the largest being three earthquakes in the magnitude range 6.2–6.5 occurring in the strait west of Lombok in 1979. However, Lombok was strongly impacted by at least one historical event in 1815 that also affected Bali and Sumbawa (Wichmann, 1918) as translated by Harris and Major (2016). The study described here was undertaken in order to constrain shallow crustal structure that may influence the propagation of seismic waves, so that better forecasts can be made of ground motion in future earthquakes.
Limited geophysical surveys have been conducted for Lombok to constrain crustal structure using geomagnetic field observation (Zubaidah et al., 2009) and integrated modeling of gravity and magnetic anomalies (Zubaidah et al., 2014). Because the physical origin associated with tectonic activities which causes the observed potential field anomalies is not as obvious and direct as seismic waves induced by tectonic events such as earthquakes, studies using seismological methods are often better suited to obtaining hazard-relevant information. For example, Afif et al. (under review) used seismic tomography to reveal low P- and S-wave velocity anomalies beneath Lombok interpreted as indicating high fluid content in active fault zones. However, their study had limited resolution in the upper crust, which is important for better understanding how the geological conditions of Lombok’s shallow subsurface influence seismic waves. Figure 2 depicts the tomograms for depth 0 km and 10 km from the previous body wave study that shows the low velocity anomalies of Vs associated with the presence of fluid content in the fault zone (Afif et al., under review).
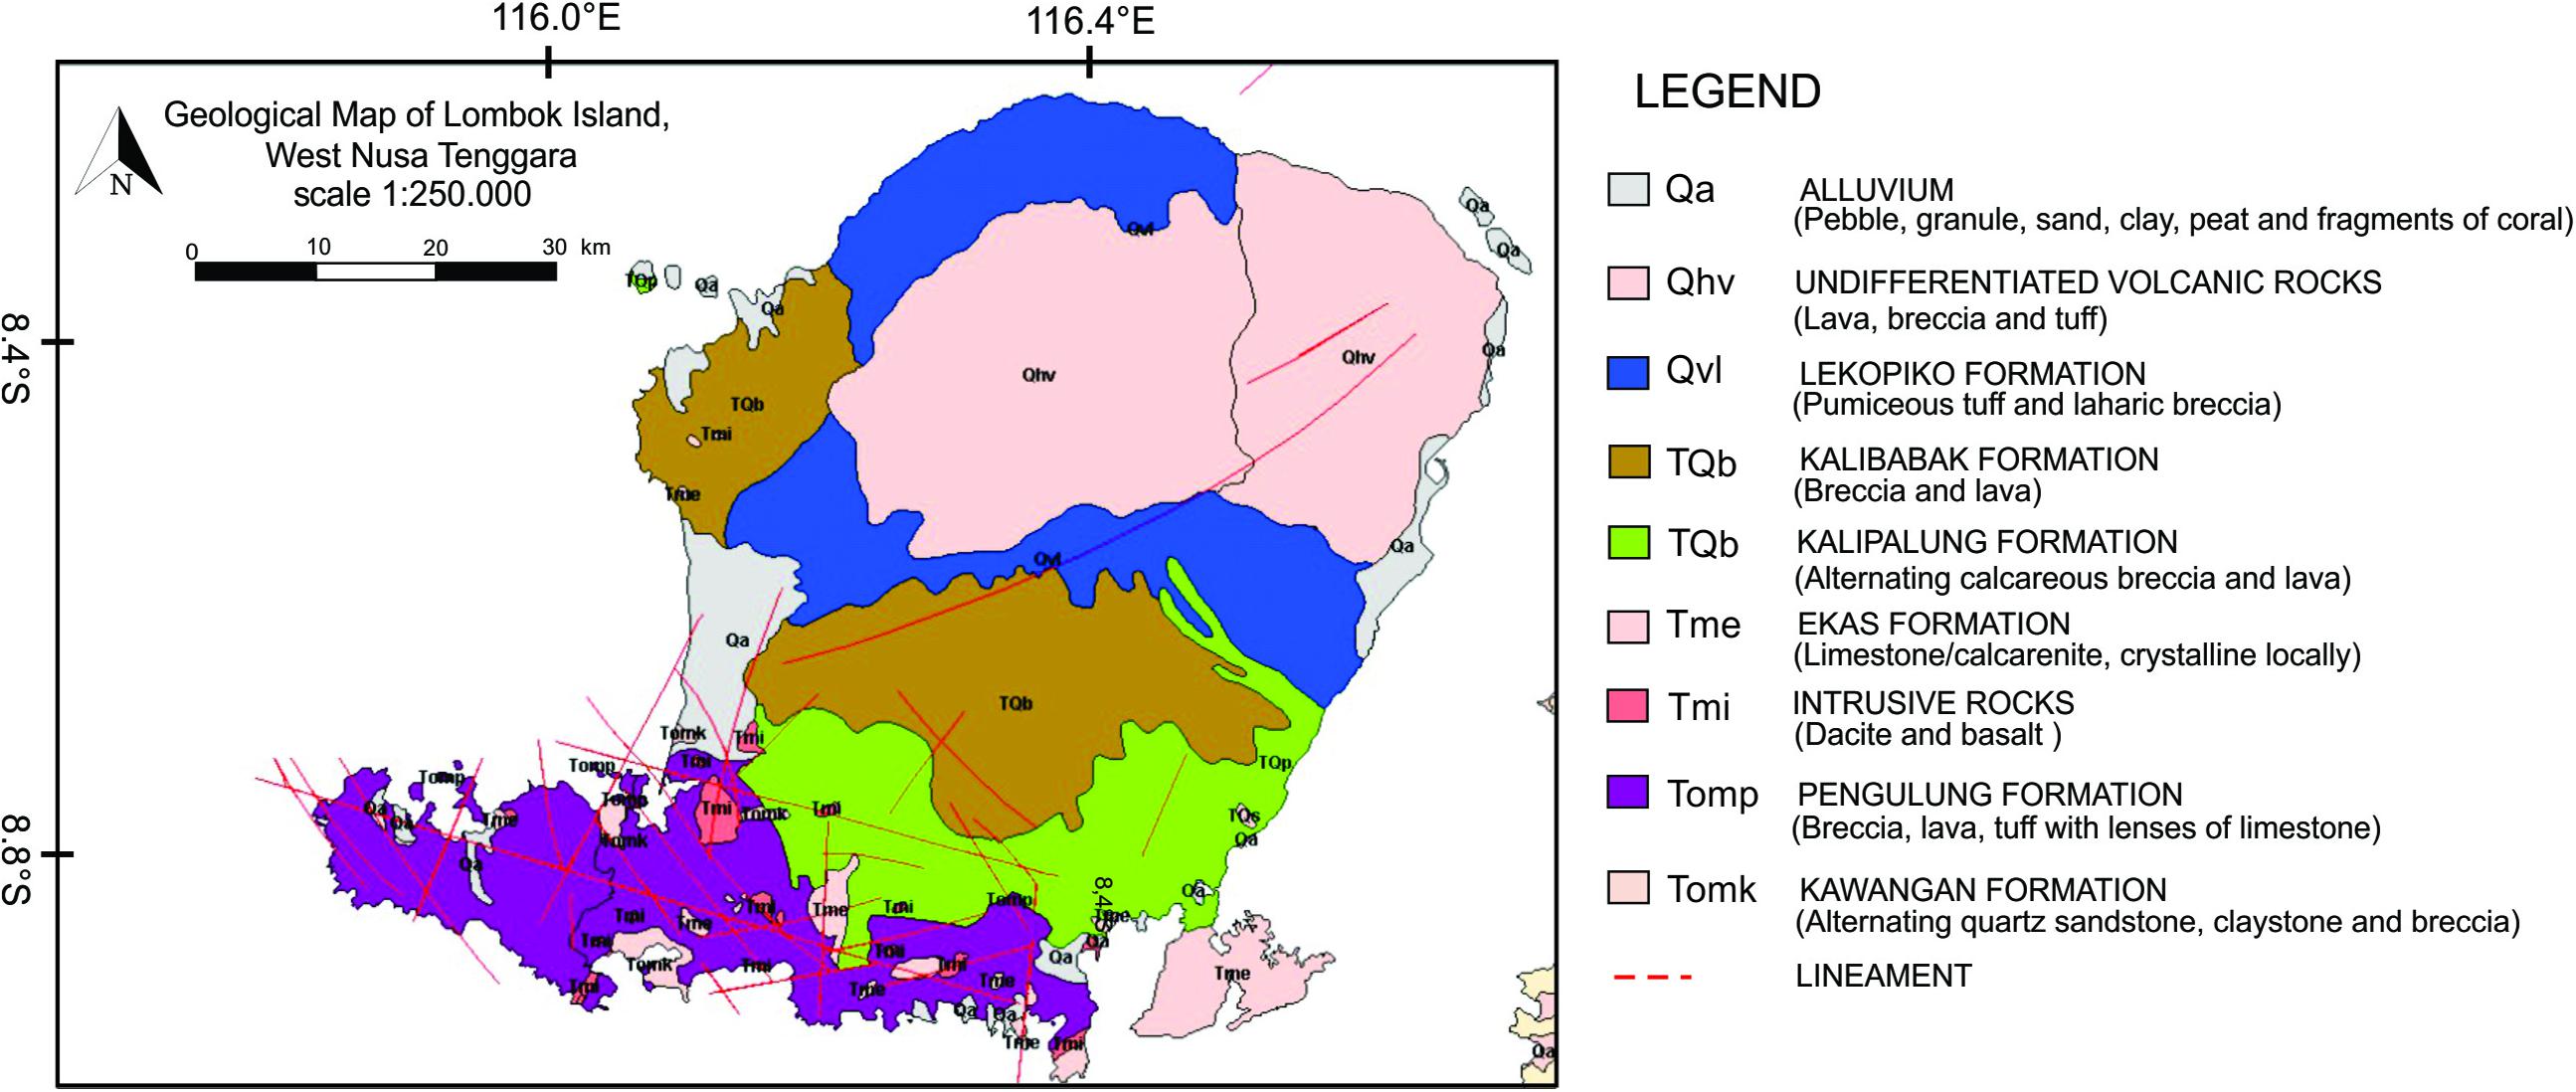
Figure 2. Geological map of Lombok, West Nusa Tenggara modified from Mangga et al. (1994).
Ambient noise tomography (ANT), on the other hand, is widely used to image upper crustal structure. This method utilizes surface wave Empirical Green’s Functions (EGF) extracted from cross-correlated waveforms of ambient seismic noise recorded by pairs of seismic stations (Shapiro and Campillo, 2004; Sabra et al., 2005). ANT uses surface waves, and one particularly useful characteristic of surface waves is that they are dispersive, so that different frequencies are sensitive to properties at different depths, which allows us to obtain information about how seismic velocity varies with depth in the earth (Dziewonski et al., 1969; Snieder, 2004). ANT has been applied in Indonesia to learn about the shallow subsurface image of Lake Toba in North Sumatra (Stankiewicz et al., 2010), Central Java (Zulfakriza et al., 2014), Jakarta basin (Saygin et al., 2016), Bandung basin (Pranata et al., 2019), the upper crustal structure beneath East Java-Bali (Martha et al., 2017), West Java (Rosalia et al., 2020), and the Agung-Batur Volcano complex (Zulfakriza et al., 2020).
In this study, we applied ANT to delineate the seismic velocity structure in the shallow crust on Lombok. Despite the restrictions on spatial scale imposed by the limited land area, surface wave tomographic surveys have been carried out in volcanic island settings elsewhere of similar scale. In addition to Zulfakriza et al.’s (2020) survey of the nearby Agung-Batur volcanic complex mentioned above, other studies include the ANT surveys of La Réunion and Madeira islands by Mordret et al. (2014) and Matos et al. (2015), respectively, the microtremor survey of Jeju Island, Korea by Kim and Hong (2012), and tomographic imaging using earthquake-generated surface waves by Nunziata et al. (1999) to study the Campi Flegrei and Somma–Vesuvio volcanic complexes on the island of Sicily, Italy. All of these studies were focussed on resolving shear-wave structure in the upper crust, although Nunziata (2010) also resolved structure as deep as 60 km.
Better constraints on seismic velocities in the upper crust will help us understand how well (or poorly) seismic arrival time tomography resolves upper crustal structure (Afif et al., under review). It also will contribute to a better understanding of variations in earthquake ground motion caused by the 2018 earthquake sequence as well as provide improved forecasts of ground motion in future earthquakes.
Geological Setting
Lombok is located between the islands of Bali and Sumbawa. Together these are the three westernmost of the Lesser Sunda Islands in the eastern Sunda Arc, where the Australian Plate subducts beneath the Sunda Block. The convergence rate between the Australian and Sunda Plates in this part of the Sunda Arc is about 80 mm/yr, with about 70 mm/yr of this convergence accommodated at the Java Trench south of Lombok, while the remaining 10 mm/yr of convergence is accommodated by the Flores Back arc Thrust (FBT, see Figure 1) north of Lombok (Koulali et al., 2016).
The FBT was first recognized on marine seismic surveys north of Alor in the east and Sumbawa-Flores in the west (Hamilton, 1979), but convergence associated with the FBT has since been recognized as extending across the Bali Basin and into Java (Silver et al., 1983; Koulali et al., 2016), where it may take the form of a blind thrust (Yang et al., 2020). The FBT had been interpreted as having formed due to incipient subduction polarity reversal by Hamilton (1979), and alternatively as involving detachment of subducted oceanic lithosphere (Price and Audley-Charles, 1983). Accommodation of convergence by the FBT appears to have been an important factor in the occurrence of the 2018 earthquakes, although Yang et al. (2020) suggest that these involved rupture of a system of splay faults, rather than the FBT itself.
From the geological map of Mangga et al. (1994), Lombok’s oldest lithological units are in the southern part of the island, which is composed of volcanic rocks, igneous intrusive rocks, and sedimentary rocks (Figure 2). The younger units appear on the northern part of Lombok and consist of Tertiary and Quaternary lavas. Alluvium as the youngest unit appears as deposits along Lombok’s eastern and western coasts. Overall, the lithology on Lombok is mostly controlled by the activity of Rinjani volcano located in the north-east of Lombok.
Lavigne et al. (2013) revealed a colossal volcanic eruption from Samalas volcano, adjacent to Rinjani, that occurred in 1257 and caused the largest volcanic sulfur release to the stratosphere in the past 7,000 years. The eruption deposited at least 40 km3 of tephra and ranks among the world’s largest Holocene explosive eruptions (Lavigne et al., 2013). Samalas pyroclastic flow deposits spread north, west, and southeast (Rachmat, 2016). The paroxysmal eruption of Samalas produced the Rinjani Caldera which can be seen today.
Seismic Data Acquisition
We successfully deployed a local-scale seismic network on Lombok, which consisted of 20 temporary seismographic stations from 3rd August to 9th September 2018 (Figure 1). The data were collected across Lombok using a combination of broadband and short-period seismometers with different types of sensors (Guralp, Geobit, Lennartz, Far Field Nodal, and L4C). Each station consists of a sensor, a GPS clock, a data logger, and a power supply. The recorded data were stored on the data loggers, which could store up to 1 month of continuous waveform data. Every 3 weeks we visited each station to check its status, download the data, and replace the batteries. The Guralp and Geobit seismometers used in this study are broadband sensors which have a flat velocity response in the period range 0.1 – 33 s and 0.1 – 5 s, respectively. On the other hand, the Far Field Nodal, Lennartz, and L4C are short-period seismometers with a nearly flat velocity response in the period range of 0.01 – 0.1 s, 0.01 – 1 s and 0.05 – 0.5 s, respectively. The stations were located in places with firm ground and low levels of human activity. Other considerations such as permissions, safety, and station coverage were also used to choose station locations. Some seismometers were deployed in governmental and residential buildings, and others were buried in a bunker. The waveform data were recorded with a sampling rate of 100 Hz. The Seismometer network that was installed has a minimum and maximum interstation distance of 2 km and 68 km, respectively.
In this study, we ignored the effect of topography, as has been done in ANT studies of island volcanoes of similar scale (Mordret et al., 2014; Matos et al., 2015 for La Réunion and Madeira islands, respectively). While Rinjani’s maximum height of 3,726 m may seem significant compared to the scale of our study, heights greater than 2000 m are confined to the high relief along the edges of the Salamas caldera, including Rinjani itself. The vast majority of the volcanic edifice occupying the central part of northern Lombok has gentler relief, with heights less than 2000 m, and this tapers to the much flatter topography that characterizes the rest of Lombok (see Figure 1A). A study of the effect of similar topography on surface wave phase velocities in the 3-10 s period range has shown that estimated velocities are reduced by at most 0.7% (K’́ohler et al., 2012). While the shorter periods and wavelengths considered in our study may lead to larger errors, we surmise that they are unlikely to influence our conclusions, which are based mainly on variations in Rayleigh wave velocity outside the caldera that are much stronger than can be explained by topographic bias.
Green’s Function Retrieval
The data processing steps used in this study followed Yao et al. (2006) and Bensen et al. (2007). Due to the different instrument types used in this study, the first processing step was removal of the instrument response using the pole-and-zero representation of the frequency response of each sensor, to obtain filtered displacement records.
The same data processing steps are then applied to all records to enhance the ambient noise signal in the waveform data prior to cross-correlation. The data were first decimated from 100 Hz to 20 Hz for computational efficiency. We then applied a bandpass filter in the period range 2 – 40 s, demeaned, applied one-bit time-domain normalization and spectral whitening in the frequency domain to reduce any records that contain earthquake signals. This step is important because thousands of events occur regularly during the period of deployment. After this data preparation was done, the daily cross-correlations were computed between all possible station pairs, producing daily time series which were then stacked to produce inter-station EGFs. The EGF that estimates the medium response can be written as (Saygin and Kennett, 2010):
Where G(XA,XB,t) represents the EGF between two locations X_A and X_B (t donates time), V(XA,t) and V(XB,t) represent the continuous, vertical-component waveforms recorded at stations X_A and X_B, respectively, and τ denotes the lag time used in the correlation.
The information contained in the EGF includes the Rayleigh wave travel-time and the dispersion along the path between each station. In this study, 185 Rayleigh waves EGFs were extracted from all of the possible station pairs.
The EGFs we obtained generally have clear signals only for positive lags, as seen in Figure 3A. This asymmetry of the EGFs we obtained indicates that the ambient noise sources are not distributed evenly, and the geometry of the stations displayed in Figure 3B suggests that the dominant source is the coupling of the ocean waves to the solid earth in the Java Sea to the north of Lombok. ANT assumes an isotropic distribution of noise sources, so the lack of isotropy in our study is a potential source of bias in the EGF dispersion curves (e.g., Yao and van der Hilst, 2009). However, other studies have shown that in practice it is often possible to extract meaningful information from the EGFs even when the distribution of sources is not isotropic (Tsai, 2009; Colombi et al., 2014).
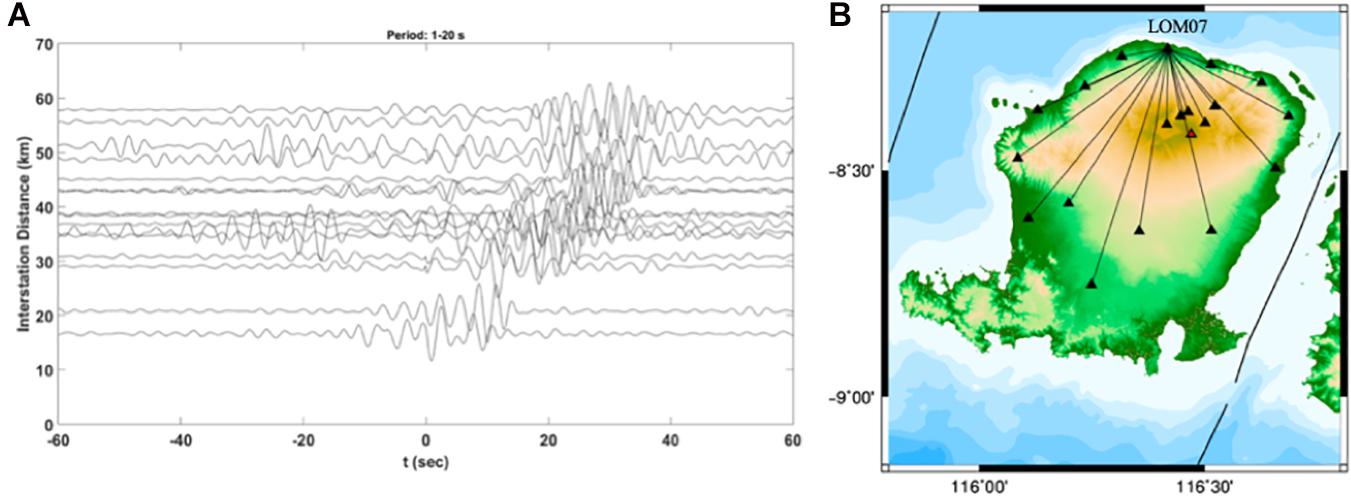
Figure 3. (A) Examples of 1-month cross-correlations between station LOM07 with other stations. The cross-correlation result was filtered between 1 and 20 s. (B) The ray-path distribution between LOM07 with other stations.
The dispersion of the EGF surface waves was analyzed using the frequency-time analysis (FTAN) implementation of Yao et al. (2006). Parameters that we consider optimizing the results obtained from the dispersion curve are: the group velocity window is 0.1 to 4 km/s, the minimum signal to noise ratio (SNR) of EGFs is 5, the minimum inter-station path length is 1.5 wavelengths, and a period-dependent group velocity time window that was used to eliminate the presence of higher-order modes (Yao et al., 2006). Although Bensen et al. (2007) empirically established a minimum interstation distance of 3 wavelengths for reliably estimating surface wave EGFs, a study of data from the US Array by Luo et al. (2015) showed that EGFs for paths as short as 1 wavelength are consistent with and as reliable as those for longer paths. Our lower interstation path limit of 1.5 wavelengths is similar to that of Porritt et al. (2016), who also used FTAN to measure EGF group velocities in the Banda Arc. Based on this wavelength limit, the longest period that can be used in our study is 15 s (Figure 4). Using these criteria, we used FTAN to obtain dispersion curves from 120 of the 185 station pairs for which EGFs were estimated.
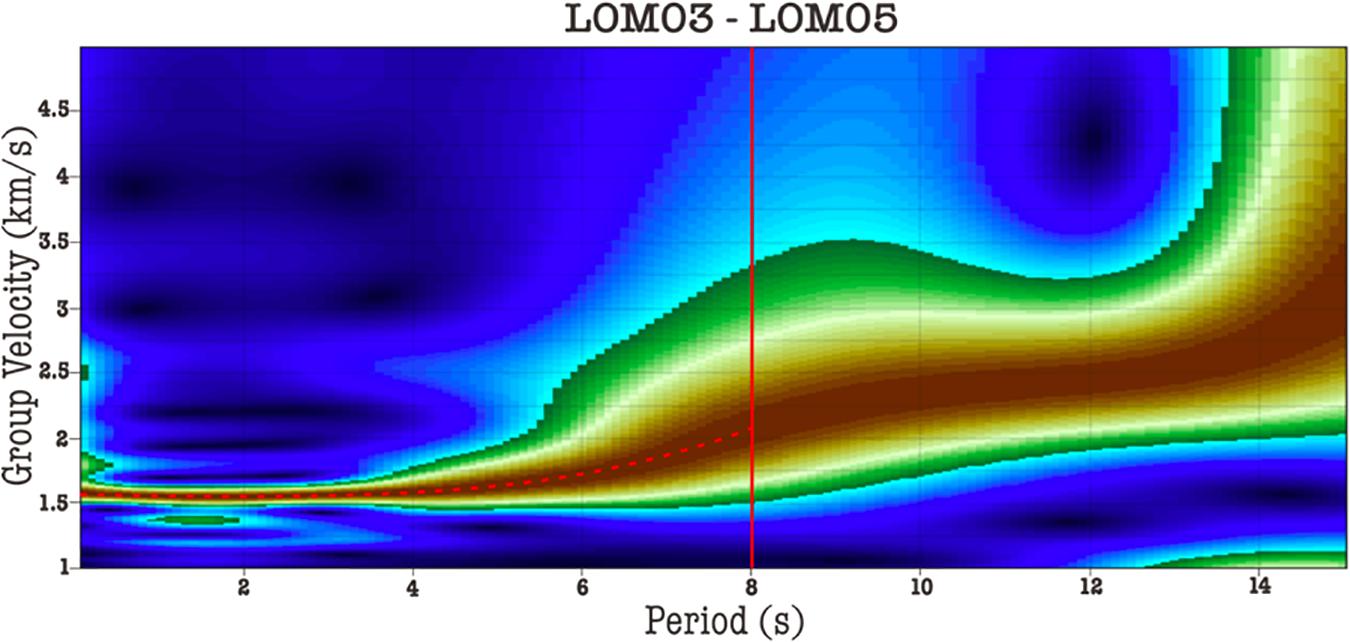
Figure 4. Example of Time-Frequency Plot and Dispersion Analysis. The red line shows the SNR threshold. The Red dashed line shows the selected data. The brown area shows the maximum energy.
Tomographic Inversion
We use fast marching surface tomography (FMST), which was developed by Rawlinson and Sambridge (2005) to obtain the tomographic image of group velocity. FMST implements a subspace technique for inversion, which is an iterative method in which an objective functional is minimized by using successive quadratic approximations of the function in an n-dimensional subspace (Kennett et al., 1988). At each step, the rays are retraced using the Fast Marching Method (Sethian and Popovici, 1999), so the non-linear relationship between velocity and travel time is accounted for. Regularization using damping and smoothing is needed to stabilize the inversion using a fixed grid size, and the result may depend on the initial model and the number of iterations. The FMST technique has been shown to be efficient, stable and robust even for strongly heterogeneous media (Rawlinson et al., 2010). The inversion uses damping and smoothing regularization to stabilize the inversion. The objective function (ϕ(m)) for the inversion problem is given by:
Where m is a vector of the model parameters, m0 is the reference model, g(m) are the predicted group travel times, dobs are the observed group travel times, Ce is the data error covariance matrix, Cm is the covariance matrix of the model parameter, ϵ is the damping parameter, η is the smoothing parameter, and D is a smoothing matrix. The Rayleigh wave group velocity of the reference model m0 is the mean group velocity at each period. We use diagonal matrices for Ce and Cm, with diagonal entries of (0.1s)2 and (0.3 km/s)2, reflecting a priori variances for the data and the model, respectively.
We used the checkerboard (CKB) test to assess what part of our study area should be sufficiently well resolved by our data to justify the inversion of group velocity dispersion curves for shear wave velocity (Vs) depth profiles. The CKB test uses synthetic data generated on a “checkerboard” velocity structure (see Figure 5, upper panels), using exactly the same station pairs as the observed data, to which FMST is applied. Areas where the inversion is similar to the original CKB pattern are considered well resolved. We tried various CKB cell sizes of 20 ×20 km, 15 ×15 km, and 10 ×10 km at 3 s period to determine which sizes are well resolved in the study area (Figure 5, lower panels). From the result in Figure 5, it is shown that the CKB test can recover the initial velocity model at 15 ×15 km CKB cell size (Figure 5B). The CKB test at this size shows some “smearing” only at the western part of Lombok, which is due to the limited raypath coverage, whereas the 10 ×10 km cells size have much more smearing.
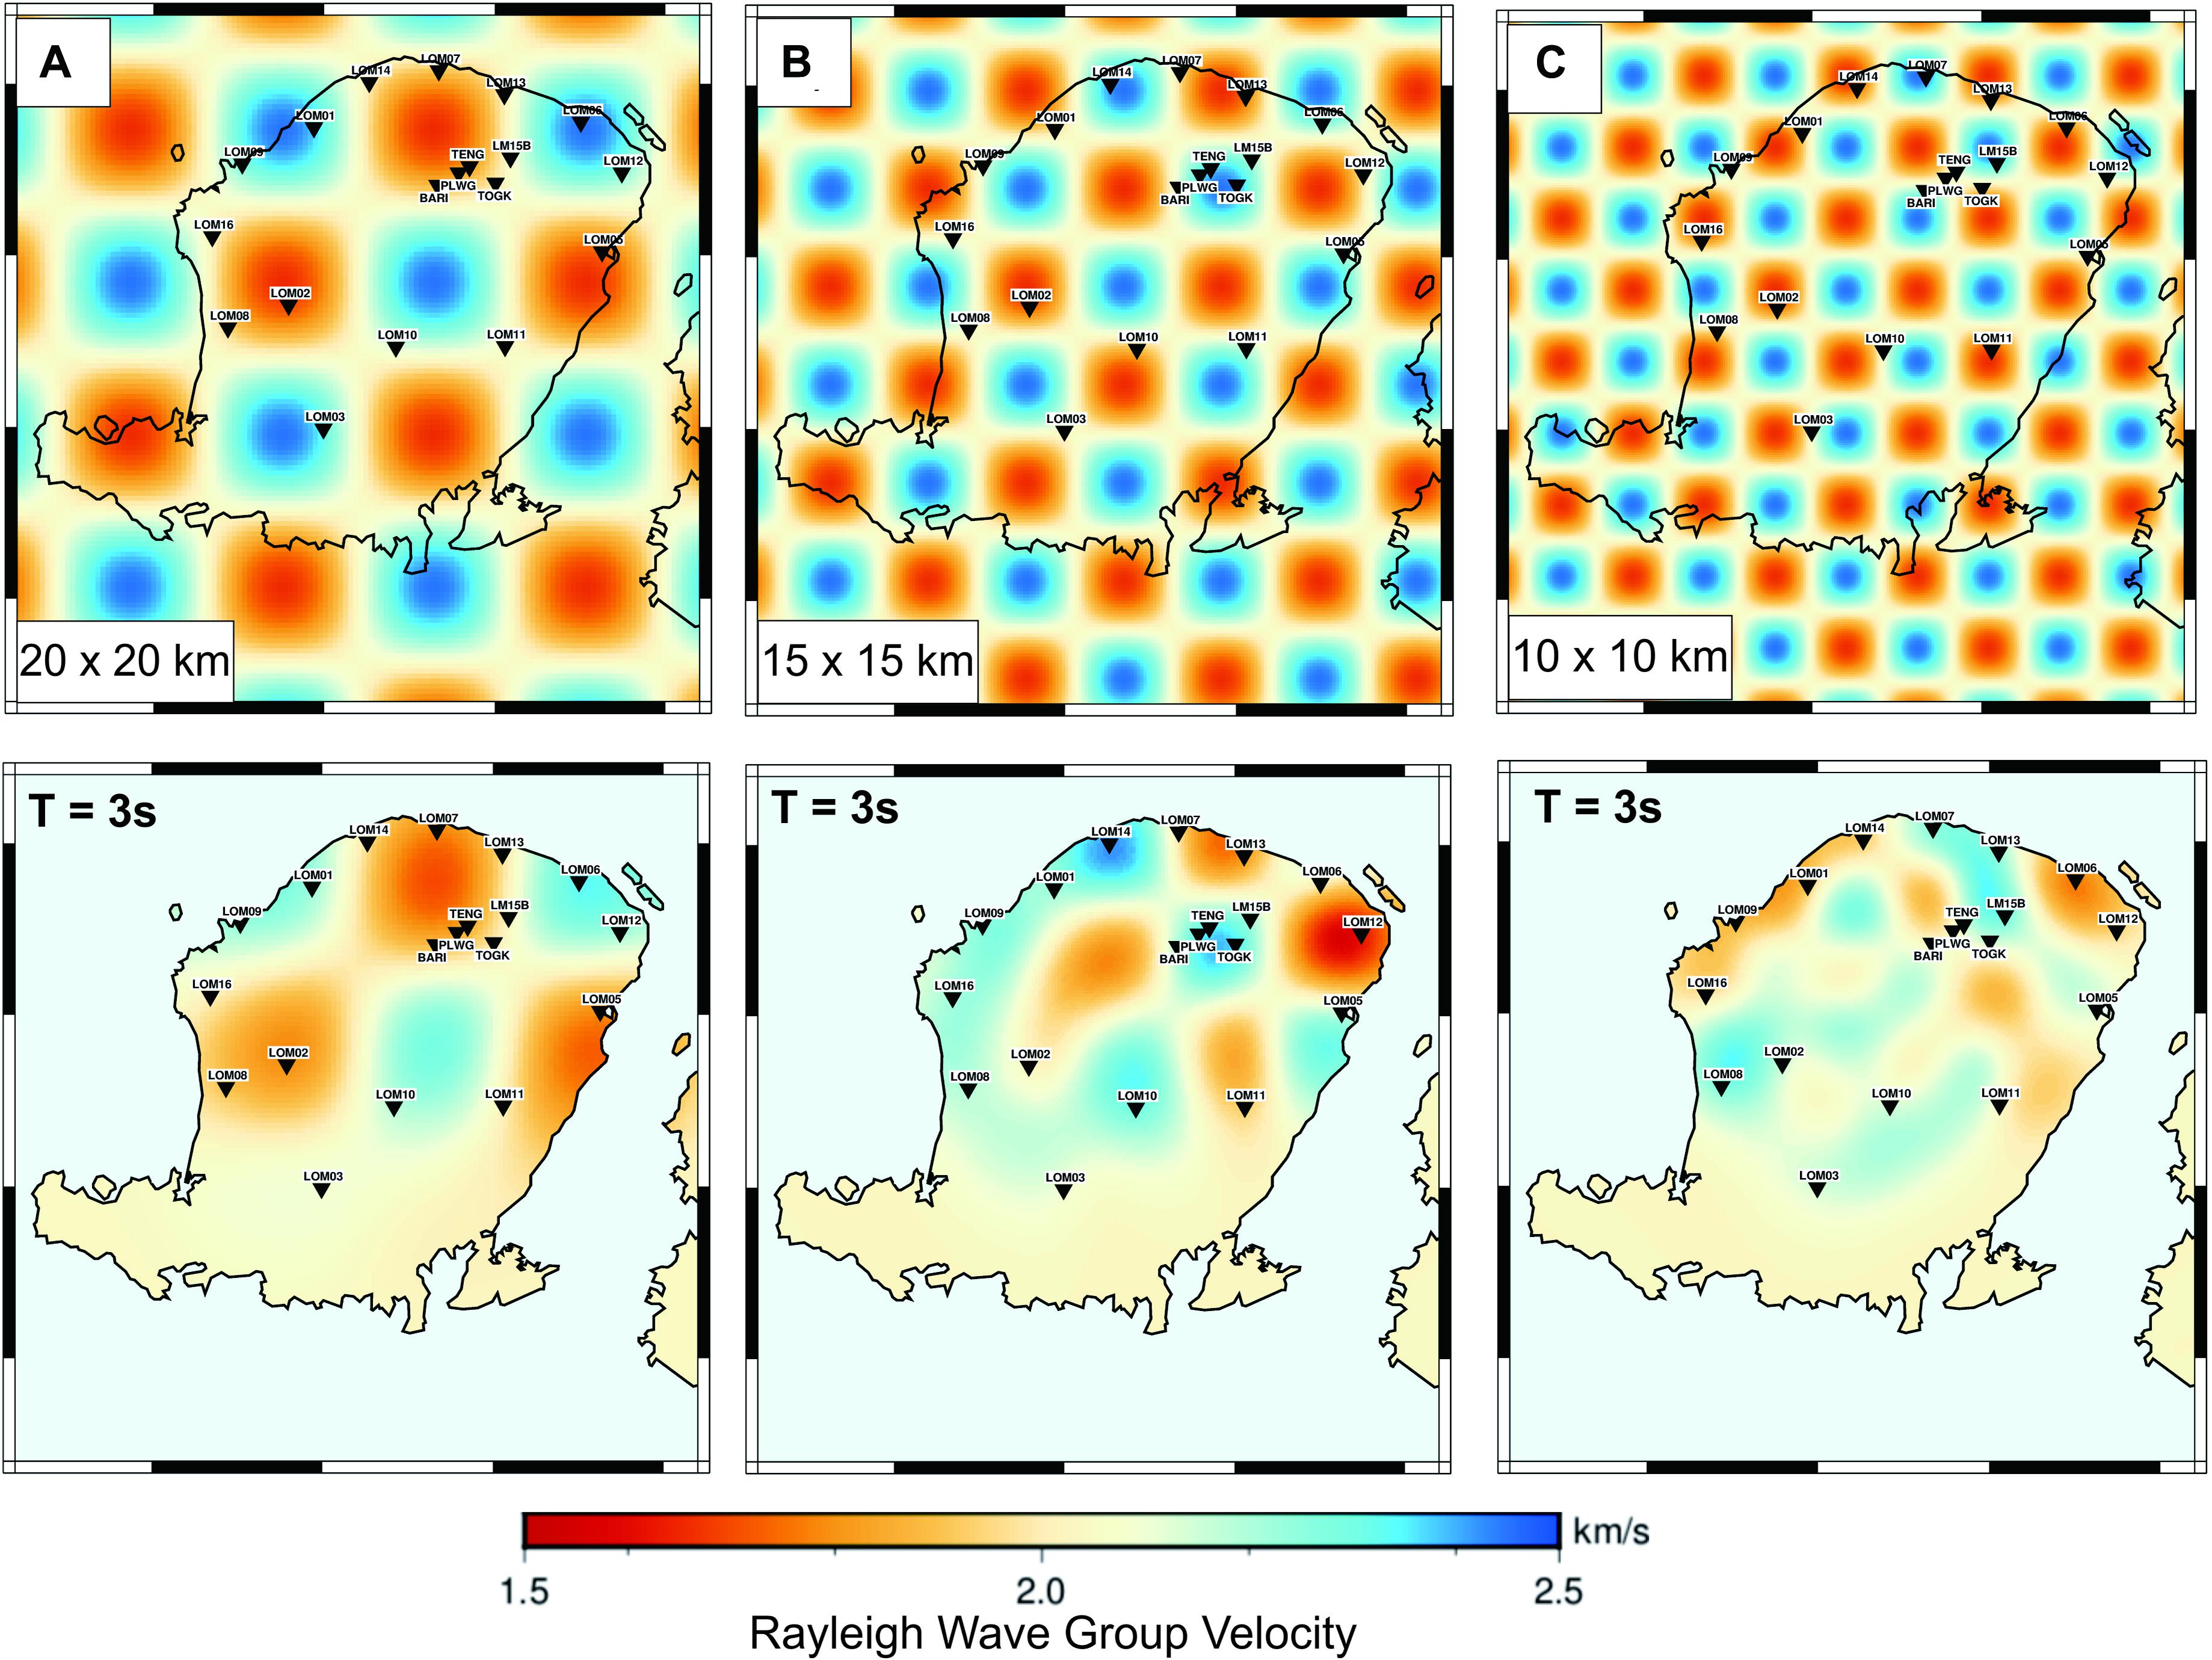
Figure 5. The checkerboard test by using grid 20 ×20 km (A) 15 ×15 km, (B) 10 ×10 km, and (C) for period 3 s. Upper figures show the initial velocity model and the bottom figures show the recovery model.
The CKB test result with a 15 ×15 km cell size is shown in Figure 6 for periods of 1–6 s. In order to simulate the actual observations, normally distributed random noise with a standard deviation of 0.5 s was added to the synthetic data. The results for all periods 1–6 s show that the recovered model matches the initial model well in the northern part of Lombok, indicating good resolution. On the other hand, the CKB model recovery is poor at periods greater than 6 s, and in southern Lombok where raypath coverage is sparse.
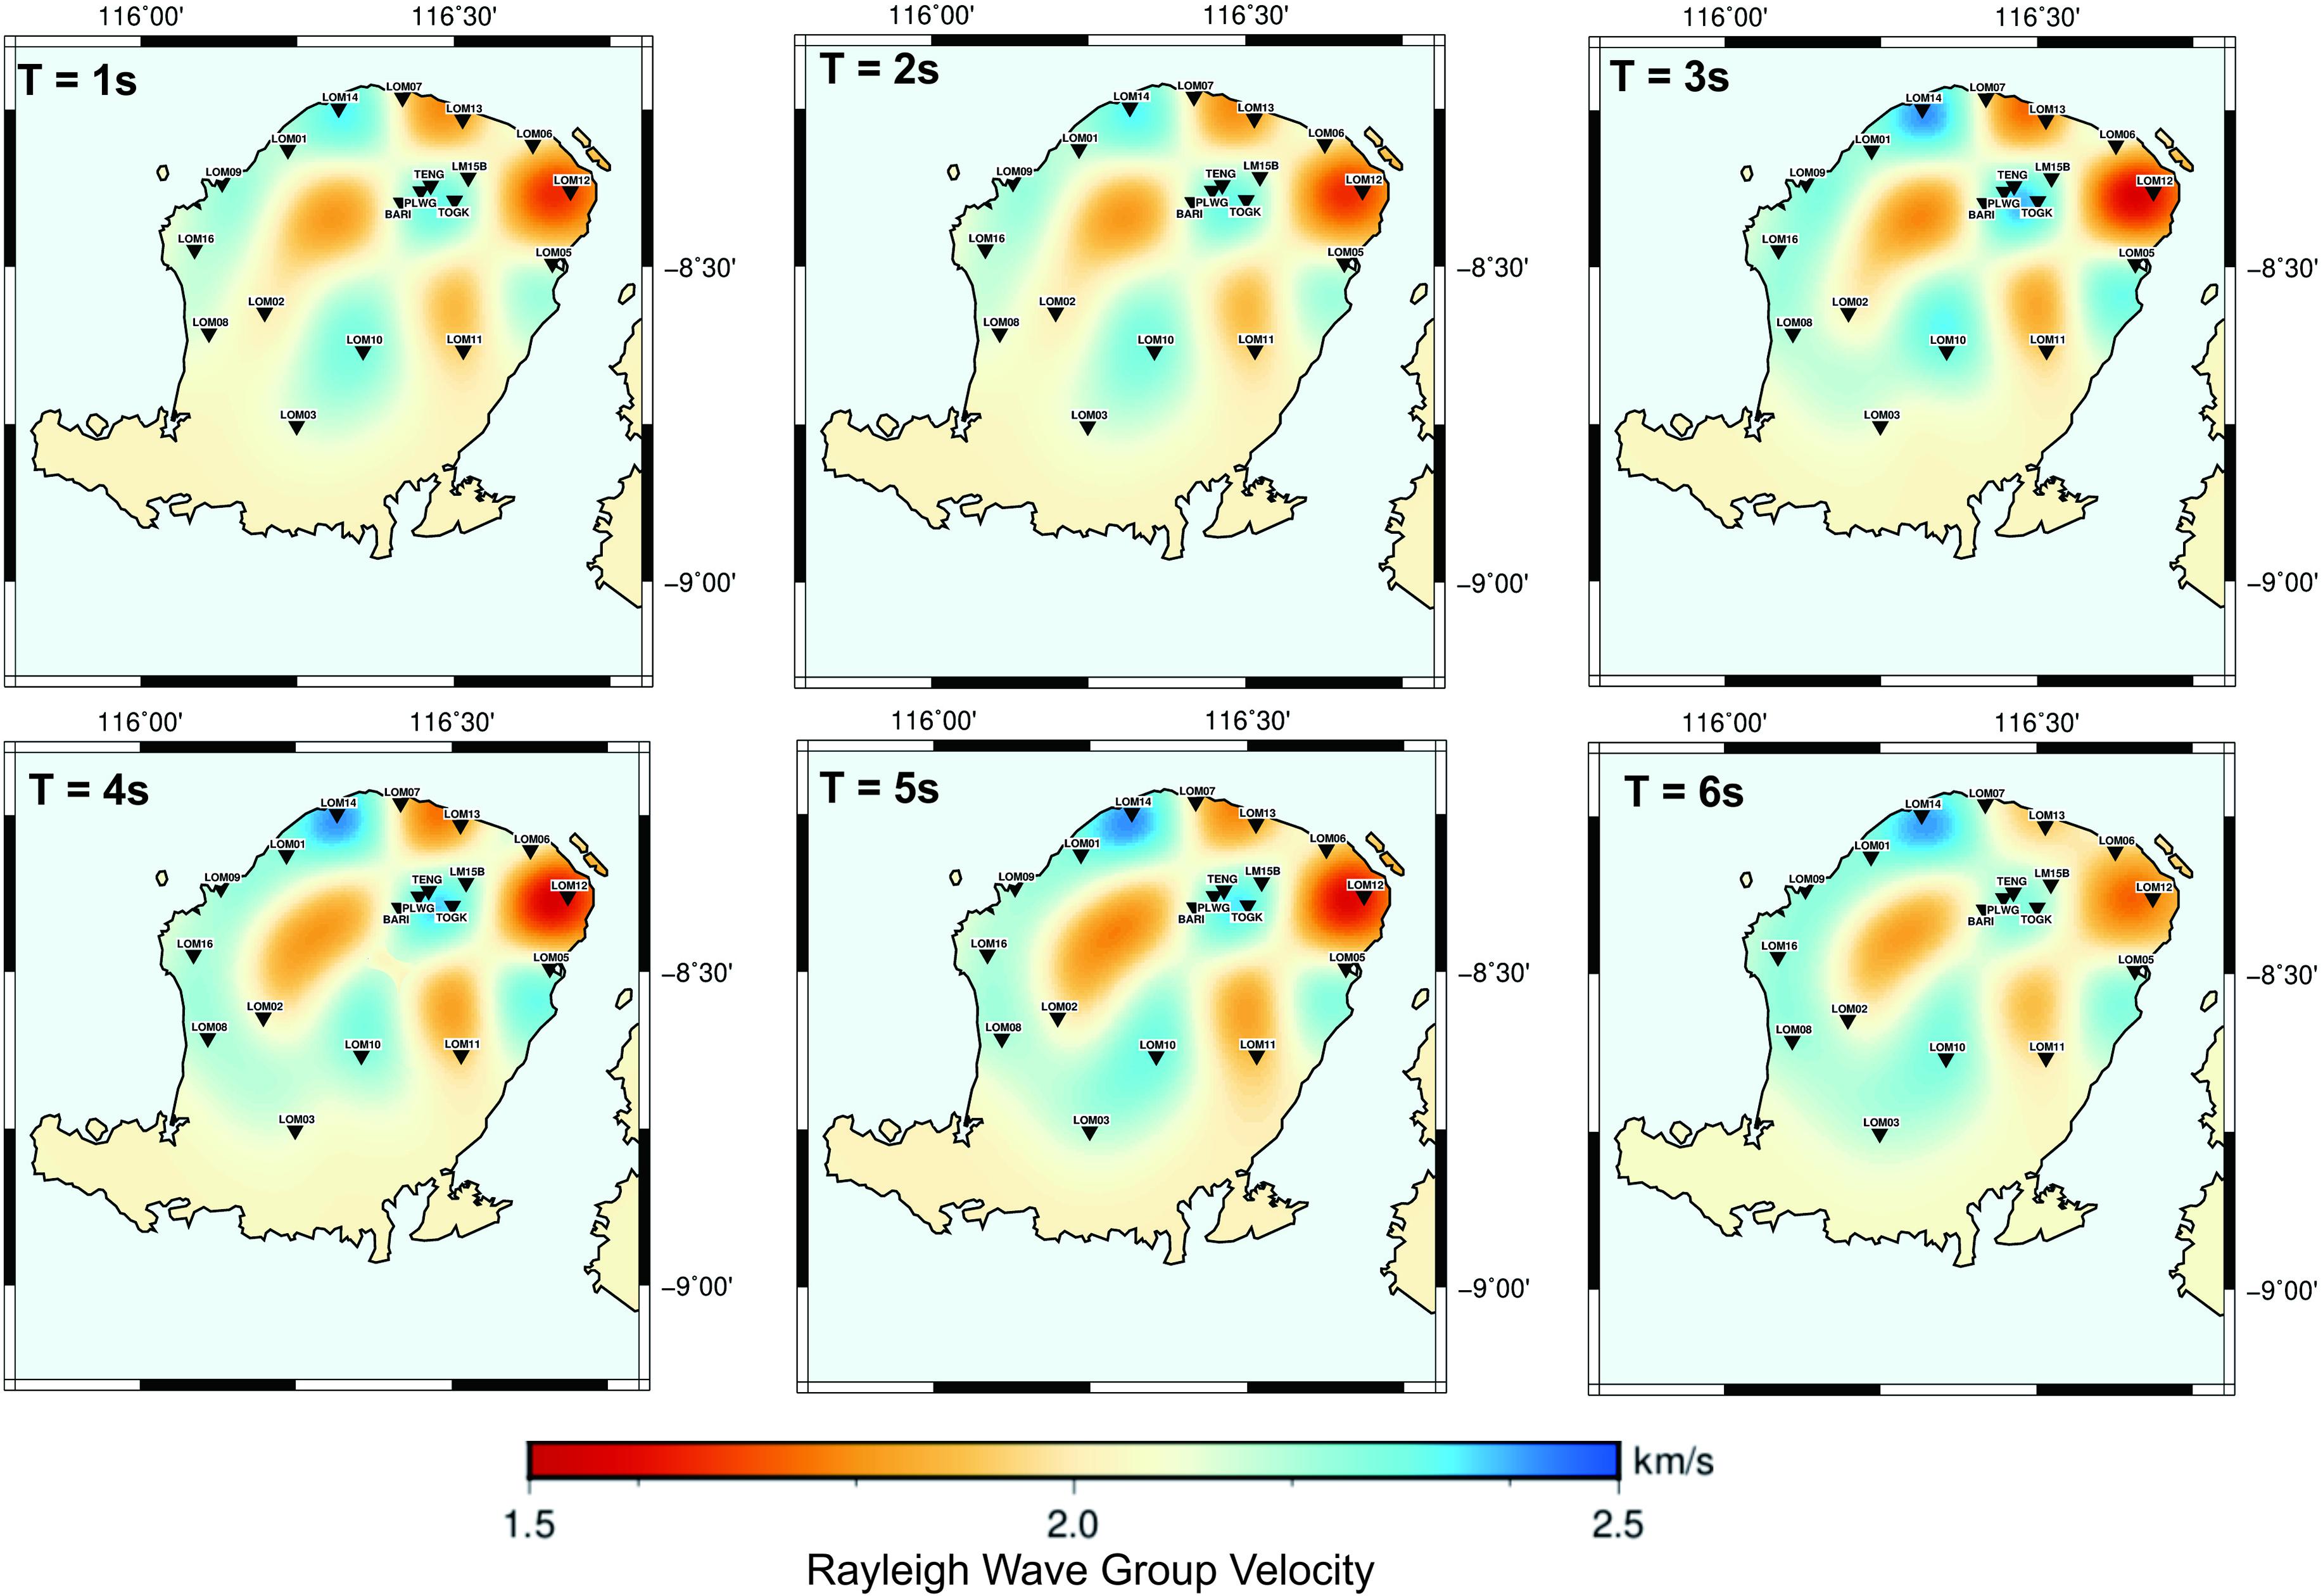
Figure 6. The recovery checkerboard test using a grid size of 15×15 km shown in period 1, 2, 3, 4, 5, and 6 s. The black triangles represent the station location.
The damping factor used in FMST to stabilize the inversion is determined from the trade-off curve between model variance and travel time misfit. We have varied the damping factor ϵ from 0 to 300 and determined that 30 is the best value located in the pivot position of the L-Curve. The same procedure was applied to determine the smoothing factor, i.e., analysis of the trade-off curve between model roughness and travel time misfit. The optimal value located in the pivot position of the L-Curve for the smoothing factor η is 35.
Shear Wave Velocity Inversion
The group velocity maps are inverted for shear wave velocity (Vs) by considering a regular grid of points spaced at 0.1° intervals over the study area. At each point the group velocity values as a function of period from 1 to 6 s define a dispersion curve that is inverted for a 1D Vs profile as a function of depth using the Neighborhood Algorithm (NA) of Sambridge (1999a; b). NA is a probabilistic sampling method that falls into the same class of inverse methods as genetic algorithms and simulated annealing, which use direct search methods to explore the model parameter space and find a range of models that provide an acceptable fit to the data (Sambridge, 1999a). We used the implementation of NA provided by the program “dinver” in the Geopsy software package (Wathelet et al., 2008), which inverts for a layered model and requires as a priori information the number of layers and a prescribed range of possible thicknesses and Vs for each layer. After trial and error we found that our data were best fit using a 5-layer model, in each of which Vs ranges from 1000–2000, 1250–2500, 1750–3000, 1750–3300, and 2000–3600 m/s, with thickness ranges of 500–1750 m, 1400–3500 m, 2000–5000 m, 4000–6500 m, and half-space, respectively. The Vs depth profiles obtained as the minimum misfit models in the inversion of dispersion curves at each grid point were interpolated to obtain a pseudo-3D Vs model for the upper crust of Lombok.
Rayleigh Wave Group Velocity Maps
Due to the limited raypath coverage in the study area, we restricted our interpretation to the area inside the dashed line shown in Figure 7. Figure 7 shows the Rayleigh wave group velocity obtained from tomographic inversion for periods 1 to 6 s, with the inset maps showing the raypath distribution in the study area. In this research, we did not consider periods greater than 6 s due to the poor resolution for longer periods.
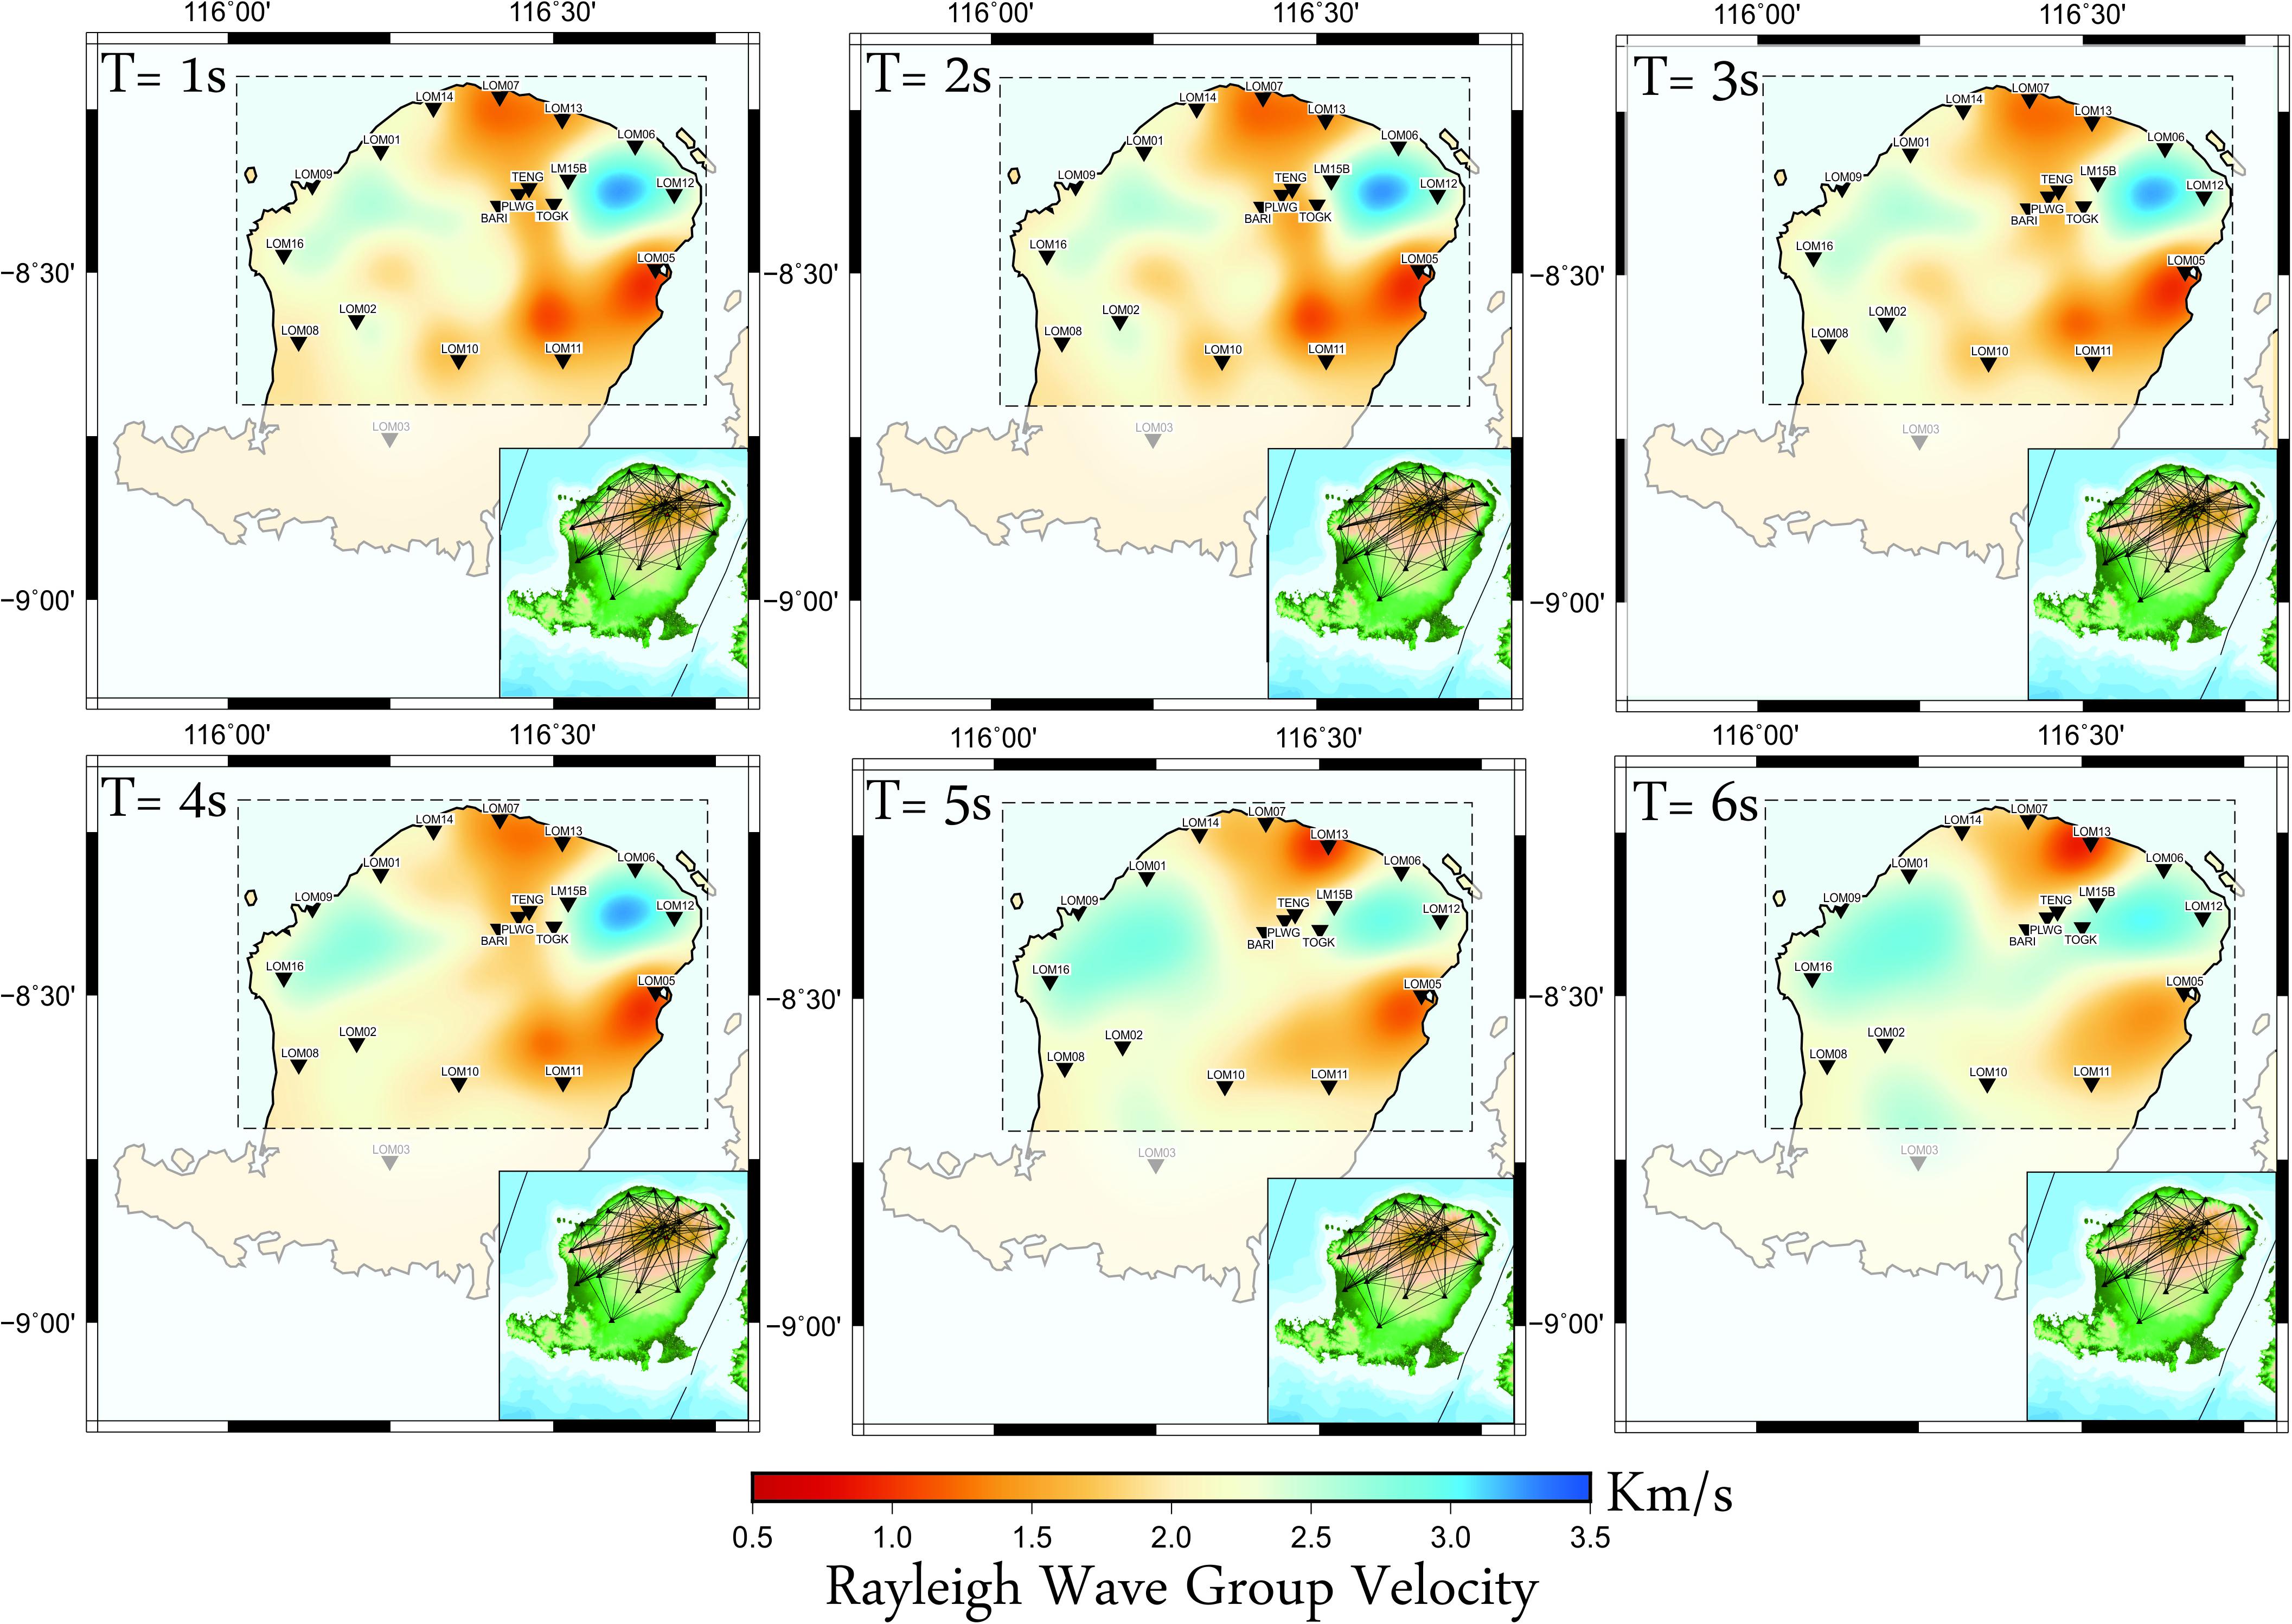
Figure 7. Result of Rayleigh wave velocity group tomograms for periods 1 and 6 s in Lombok. Insets show the ray path distribution in each period. Blue and red colors indicate high and low Rayleigh wave group velocity values, respectively.
The results shown in Figure 7 depict the spatial variation in Rayleigh wave group velocity for 1–6 s period, which are sensitive to Vs in the upper crust beneath Lombok, where body wave tomography typically yields poor resolution. From the tomographic group velocity maps in Figure 7, there are two prominent features shown in the west and east of northern Lombok that are relatively fast, whereas there is a low velocity anomaly that appears below Rinjani Volcano which continues northward and persists until a period of 4 s. We suggest that this low velocity anomaly reflects deposits of volcano eruption products.
Rayleigh Wave Group Velocity Sensitivity Kernels
The group velocity at different period is sensitive to the shear wave velocity structure at depth ranges as shown in Figure 8. The sensitivity profile provides the information of lateral variation that corresponds to the velocity structure in different depth ranges. We calculated the sensitivity kernels using the Program that was developed by Herrmann (2013) with a linear step. Then we obtained the shear wave velocity model from the dispersion curve of group velocity. We used AK135 velocity model (Kennett et al., 1995) as an initial model to determine shear wave velocity at different depths. We found that the Rayleigh wave group velocity at longer periods is more sensitive to deeper structures.
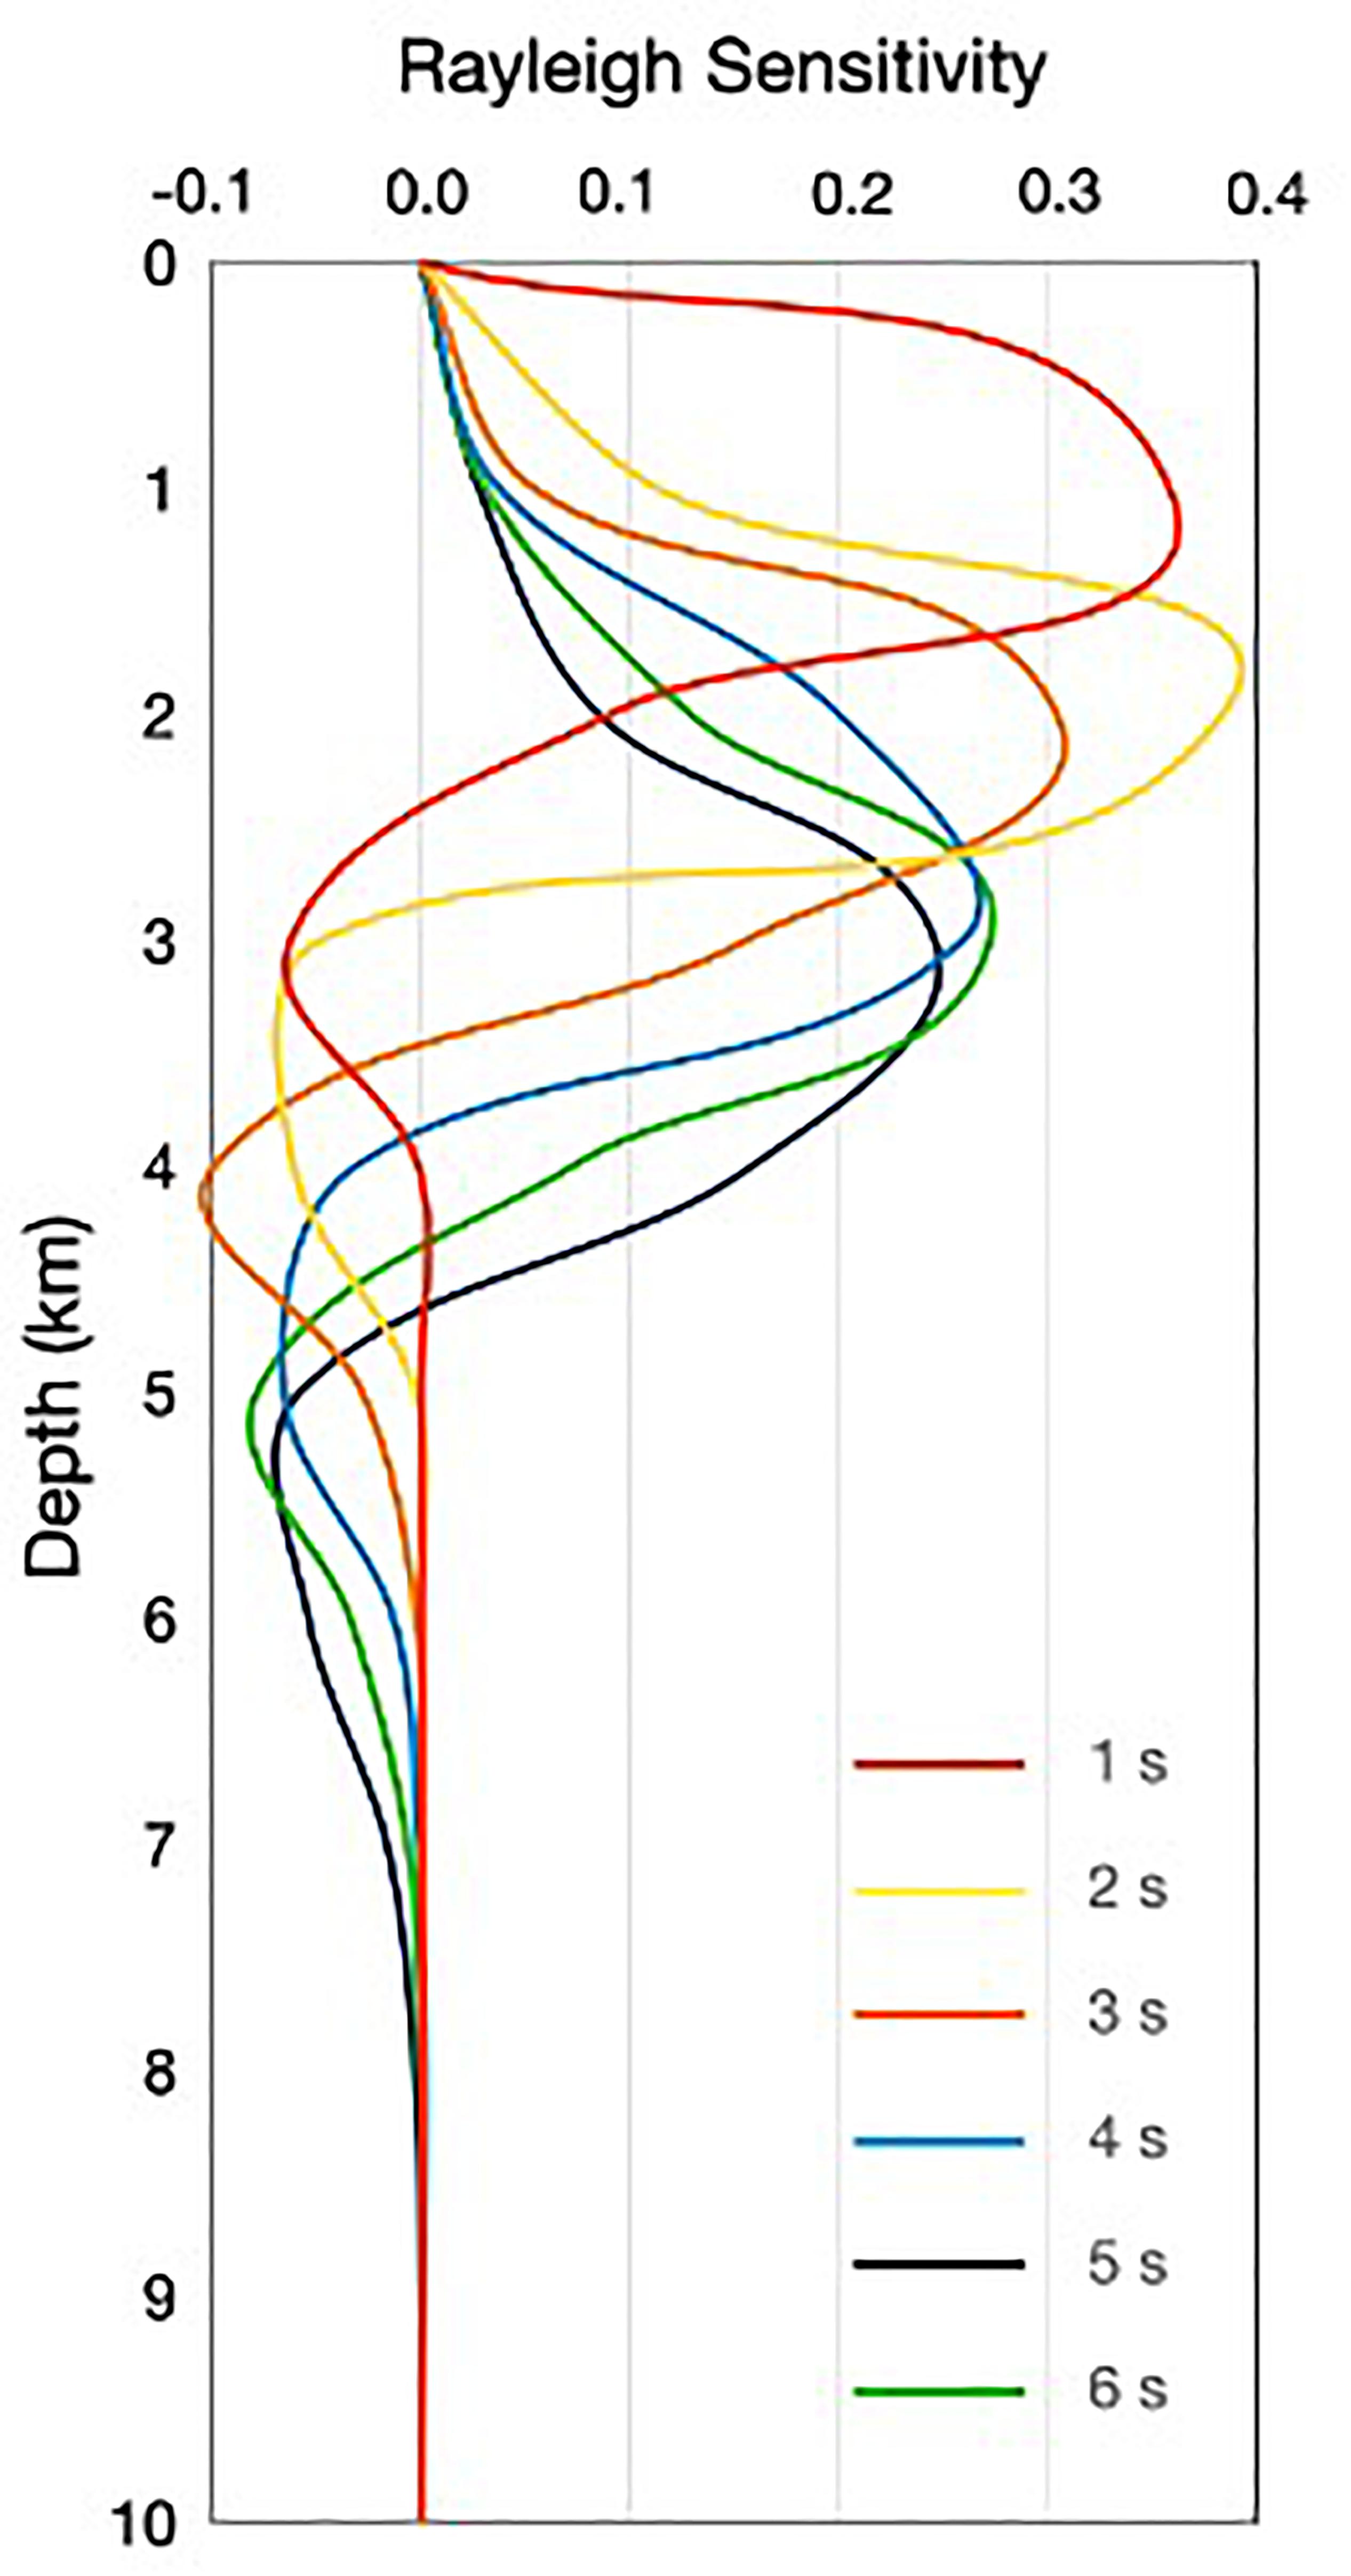
Figure 8. Sensitivity kernels for group velocity of Rayleigh wave corresponding to the shear wave velocity model, computed using the code from Herrmann (2013) at periods of 1–6 s each indicated by different color.
Shear Wave (Vs) Velocity Maps
Figure 9 shows selected 1D Vs profiles inverted from group velocity dispersion curves obtained by sampling the images in Figure 7 on a regular grid of 56 points that covers Lombok Island in the study area as indicated in Figure 9A. The examples of inverted 1D profiles are shown for a grid point at (116.41°, −8.44°) (longitude, latitude, see Figure 9B) having a misfit value of 0.119 and for a point at (116.51°, −8.54°) having a misfit value of 0.067 (Figure 9C).
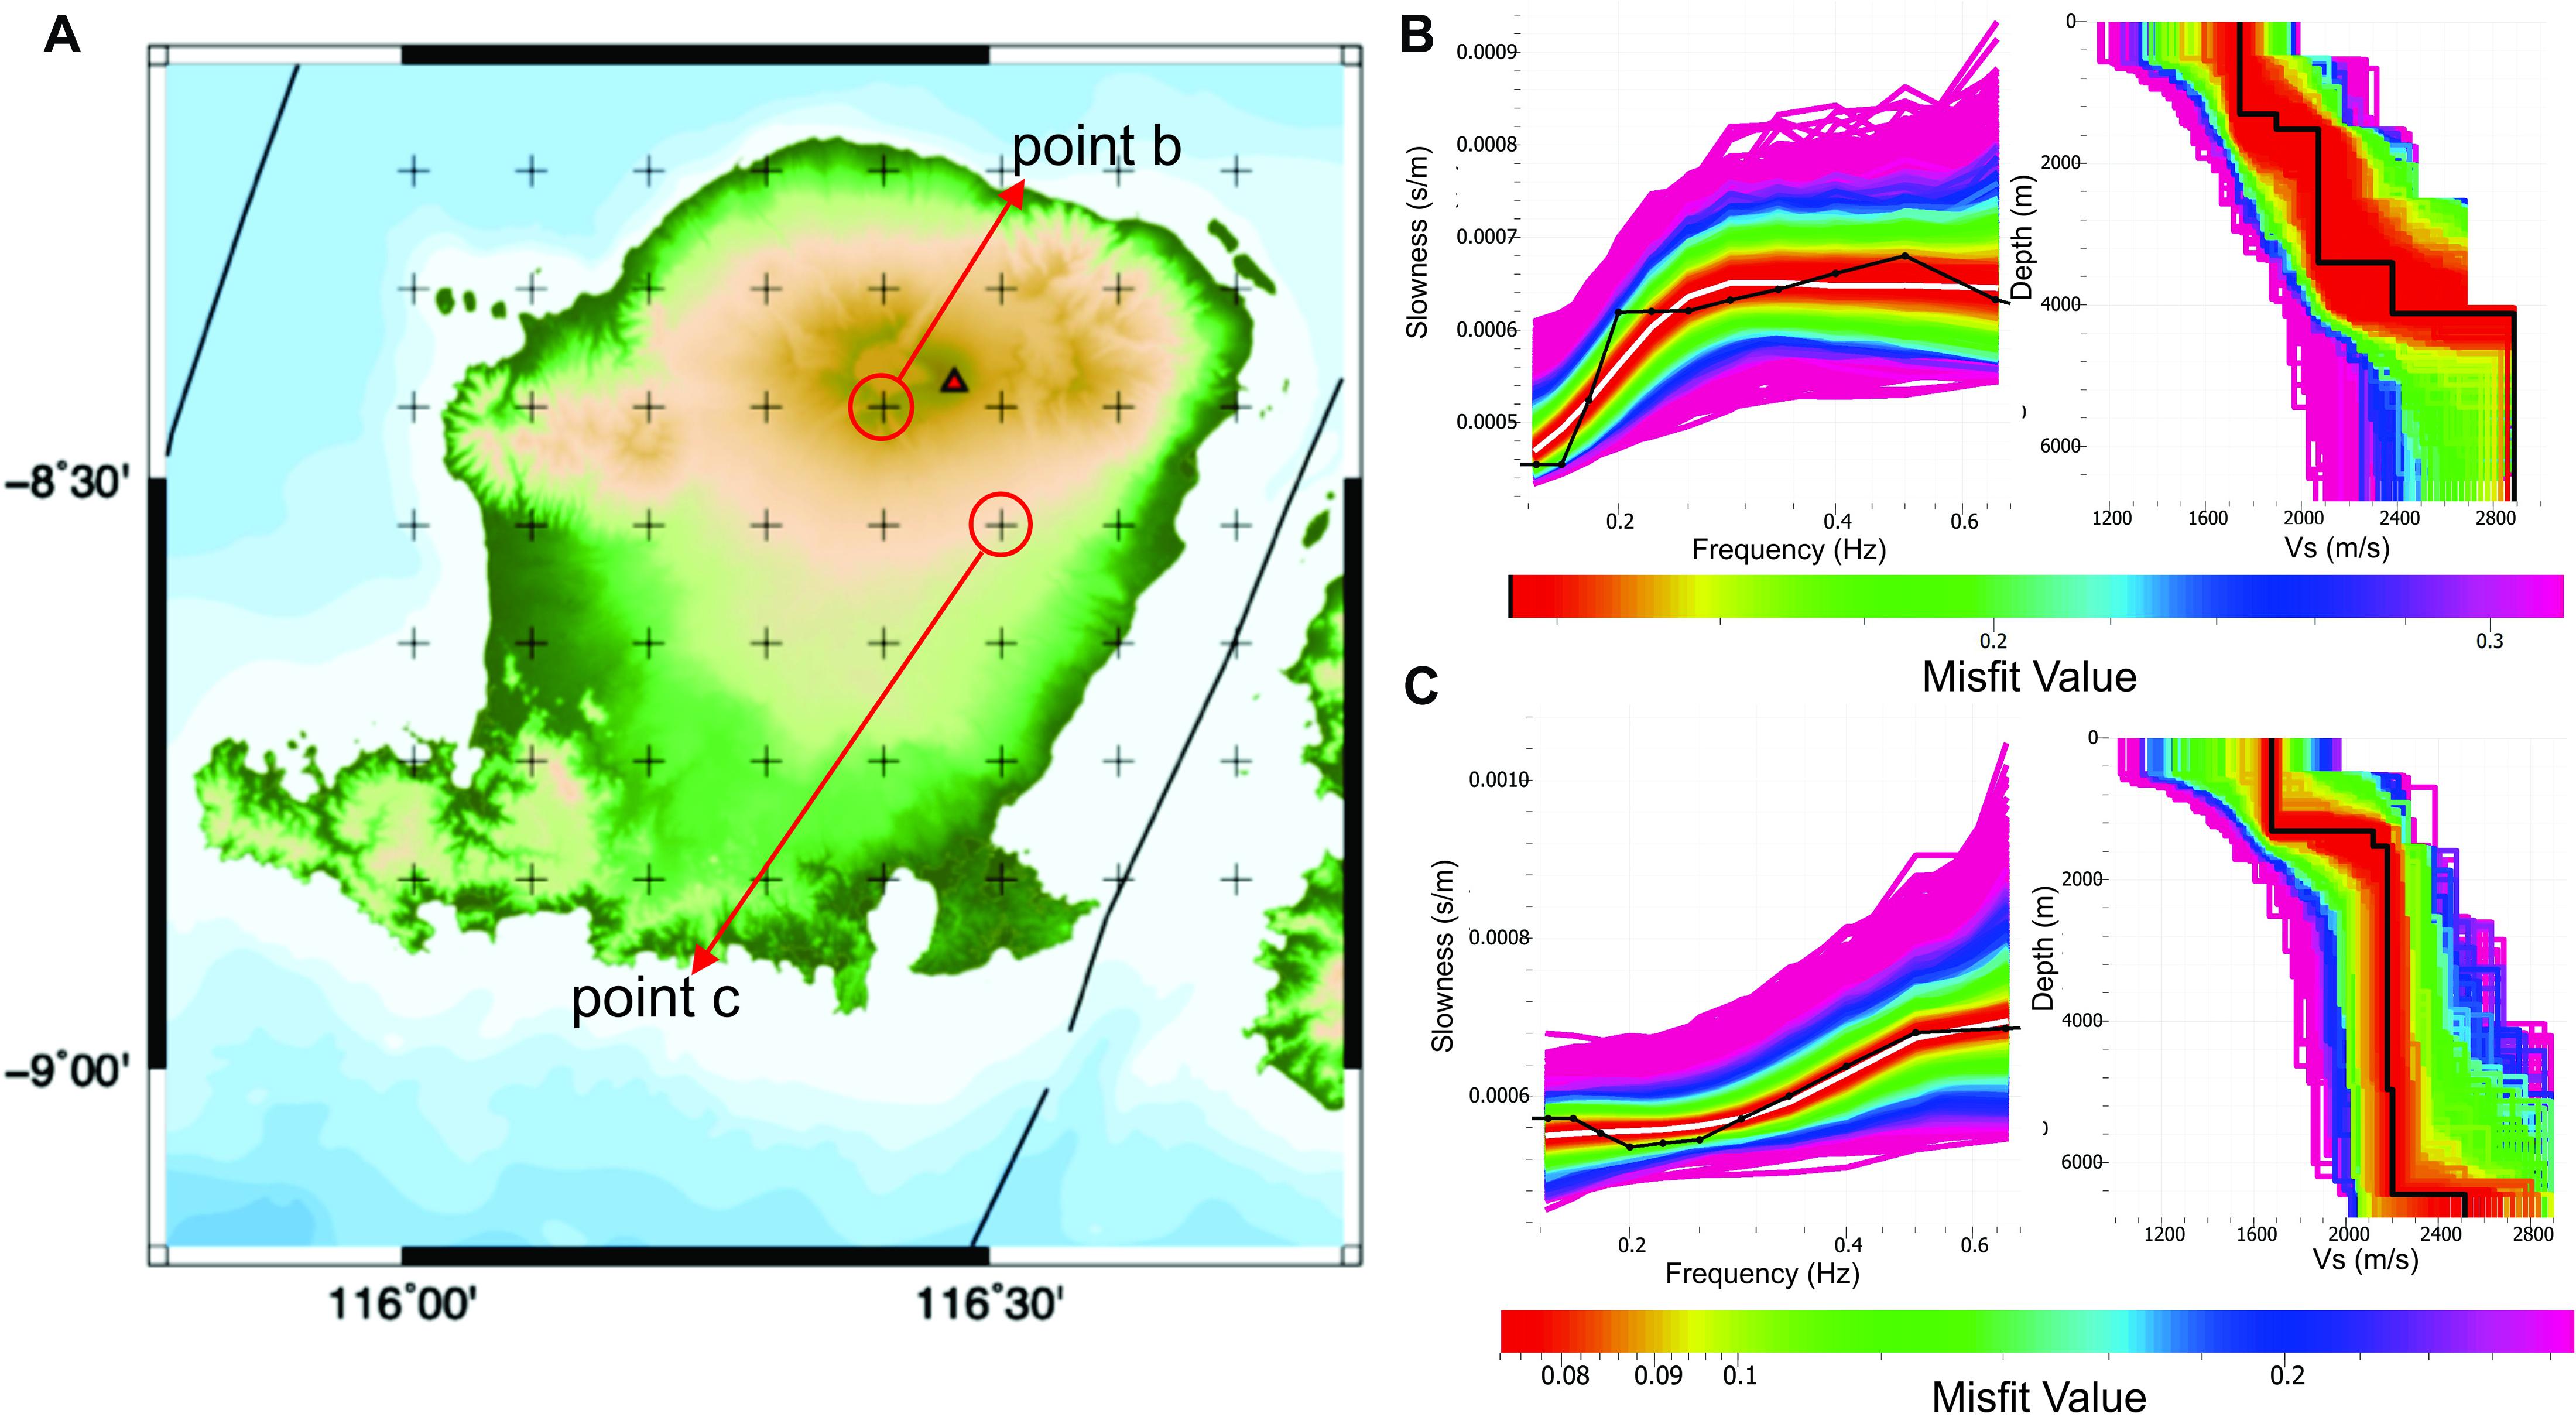
Figure 9. Depth profile of Vs gained using Neighborhood Algorithm by dinver package of Geopsy. (A) Grid points of 1D Vs on this study area are shown in B,C. (B) 1D Vs profile at point 116.41° and 8.44°. (C) 1D profile at point 116.51° and 8.54°.
We interpolated the 1D Vs profiles obtained at all 56 grid points to create a pseudo-3D Vs model of Lombok (Figure 10). The result is depicted as map views of Vs structure from a depth of 0.5 km to 6 km beneath Lombok, showing only the Vs structure within that part of Lombok where the result is well constrained. There is a prominent low velocity anomaly located to the north of Rinjani Volcano that emerges from depth 0.5 to 3 km and disappears at greater depths. Besides the low-velocity anomaly, there is a high-velocity anomaly emerging in the northeast corner of Lombok which can also be seen in the Rayleigh wave group velocity maps.
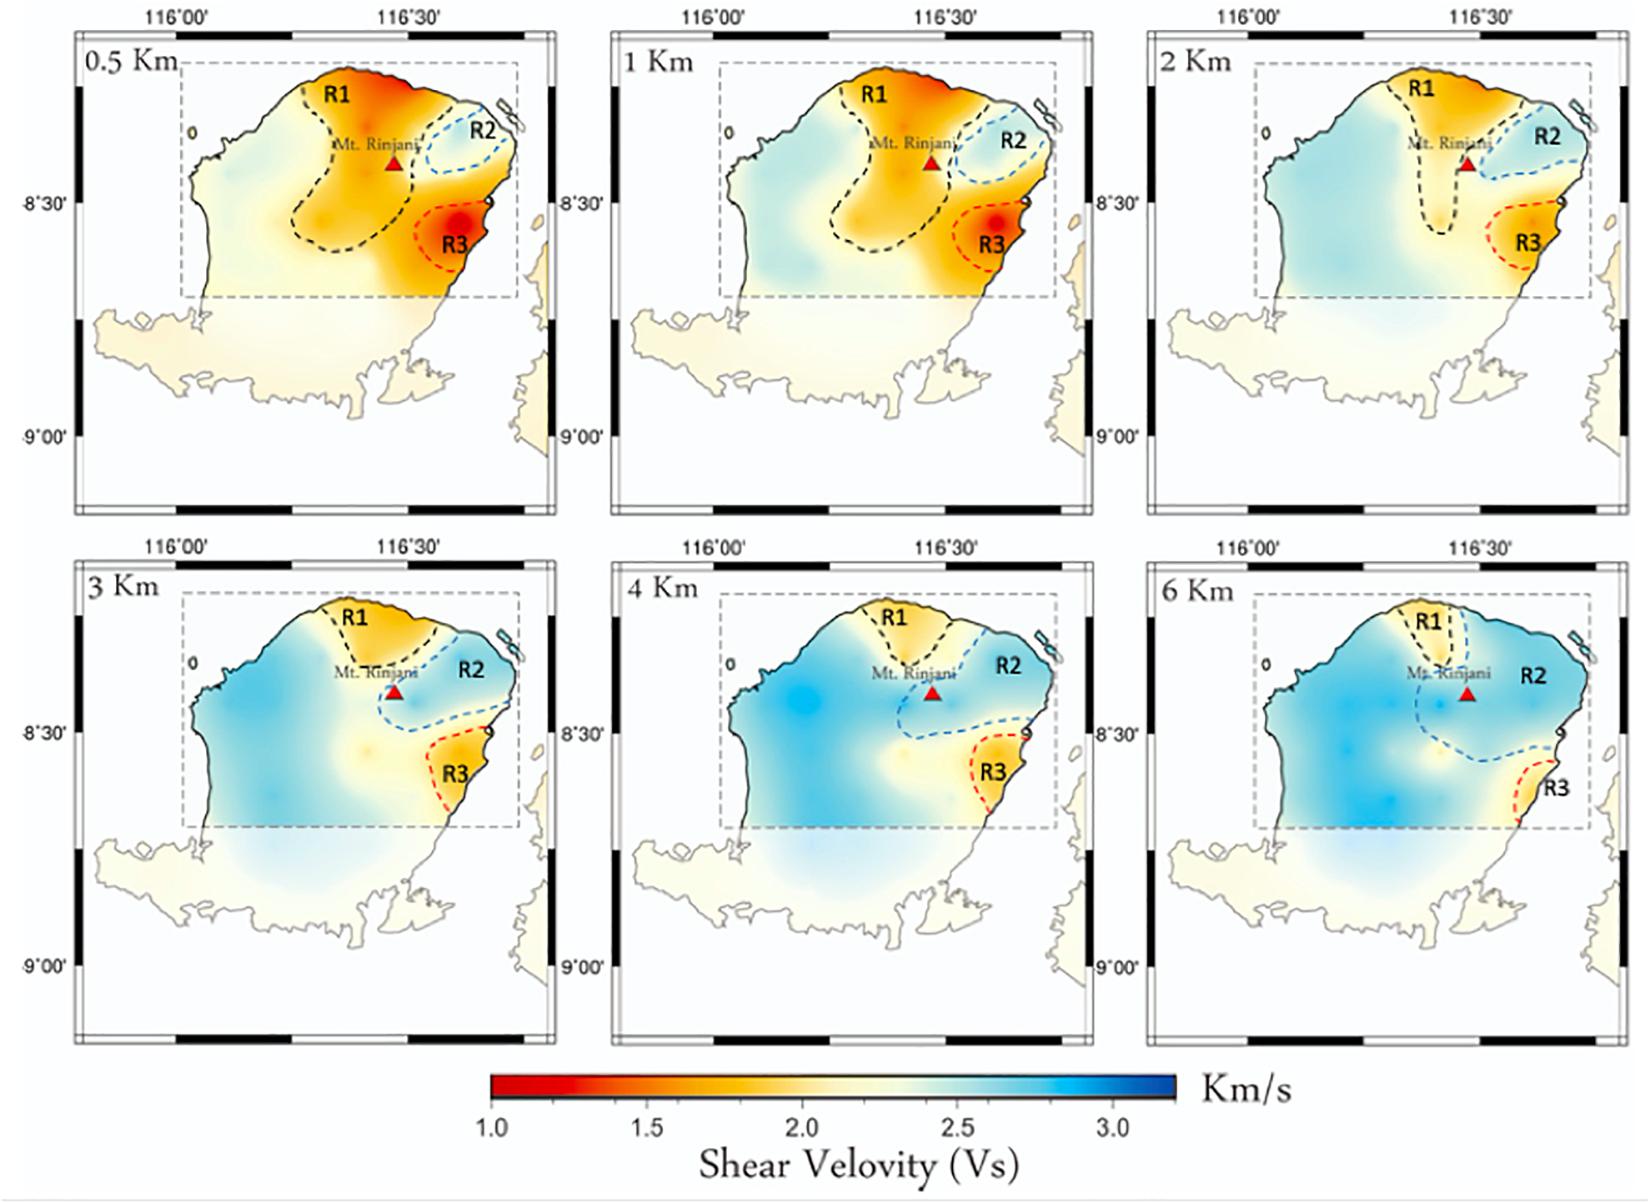
Figure 10. The shear wave velocity (Vs) maps of Lombok for different depth ranges of 0.5, 1.0, 2.0, 3.0, 4.0, and 6.0 km. The red triangle represents the Rinjani Volcano. R1, R2, and R3 zone marked by the black, blue, and red lines, respectively.
Discussion
Figure 10 shows the result of Vs variation beneath Lombok. The red and blue colors represent low and high Vs, respectively. Based on the map of Mangga et al. (1994) the surface geology of Lombok consists of relatively young sedimentary rocks formed during the Quaternary period (Figure 2). The northern side of Lombok consists of volcanic deposits from the activity of Samalas Volcano and Rinjani Volcano, which are loose and unconsolidated. There are also alluvial deposits in the form of alluvium or loose rock in the east of Lombok and the west of Mataram City. In general, the Vs and group wave velocity in Lombok has a similar pattern as the lithology distribution based on the geological maps on the surface. The pattern is also generally consistent with the Bouguer gravity anomaly (Sukardi, 1979). The body wave tomogram (Afif et al., under review) shown in Figure 2 at depth 0 km has roughly similar velocity pattern as in Figure 10 at depth 0.5, 1, and 2 km with a low velocity anomaly extending from north to east Lombok, whereas on the North-East side of Lombok there is a high velocity anomaly. From our results it can be concluded that this research provides resolution in shallow depth that body wave tomography could not provide clearly due to the limitation of method. Basically, this research explains the lithology and the volcanic deposits of eruption distribution on the upper crust of Lombok Island, whereas the body wave tomogram depicts the tectonic condition that triggered earthquake sequence in Lombok Island in 2018. Hence, the tomogram from ambient noise fails to explain the tectonic features of the body wave tomogram.
Based on the tomographic inversion results in Figure 10, we divide the result into 3 regions (R1, R2, and R3) to simplify the interpretation, with R1 and R3 corresponding to low Vs (1.0-1.5 km/s) and R2 to relatively high Vs (2.5-3.0 km/s). At 0.5 km depth, R1 extends from SW of the Salamas caldera to the northern coast of Lombok, R3 extends from the SE flank of Rinjani to the eastern coast of Lombok, and R2 lies between R1 and R3, extending from Rinjani Volcano to the NE coast of Lombok. At this depth R1 and R2 together form a pattern of low Vs that correlates remarkably well with the deposits of the pyroclastic density current (PDC) associated with the 1257 eruption of Samalas mapped by Lavigne et al. (2013).
The 1257 caldera-forming eruption of Salamas is thought to be the largest volcanic eruption of the past 7,000 years and left massive PDC deposits that still reach 35 m thickness 25 km from the caldera (Lavigne et al., 2013). These deposits are likely to have Vs lower than 500 m/s (Lazcano, 2010), but their thickness is not sufficient to account for the depth extent of the low-Vs anomalies R1 and R3, which reach as deep as several kilometers. We note, however, that Salamas has experienced explosive activity throughout the Holocene, with Métrich et al. (2017) having identified seven explosive Holocene events including two scoria fallouts overlain by massive pumice deposits. Although the pre-Holocene building stage of the Rinjani-Samalas volcanic complex was mainly characterized by effusive eruptions, the presence of andesitic lava flows suggests that explosive eruptions may also have occurred. Such activity could potentially generate the same type of interbedded tuff and lava deposits that are thought to be responsible for low Vs anomalies persisting to 1.6 km depth on the flank of the Somma-Vesuvio volcanic complex (Nunziata, 2010).
Region 2 (R2), located to the North-East of Mt. Rinjani, is characterized by relatively high Vs ranged from 2.5 to 3.0 km/s and extends to a depth of 6 km. This area coincides with a high Bouguer gravity anomaly (Sukardi, 1979). The relatively high Vs and positive Bouger anomaly is consistent with the presence of igneous intrusive rock at depth.
Figure 11 depicts vertical cross sections of our pseudo-3D Vs model for the upper crust of Lombok overlayed with the relocated hypocentres during the August – September 2018 period from Sasmi et al. (2020). As indicated in cross-sections C-C’ and B-B’, the low Vs associated with R3 and the northern part of R1 extend to greater than 4 km depth. In contrast, cross-section A-A’ shows that the southwest extension of R1 reaches less than 2 km depth. This suggests that Quaternary eruption products are filling a shallow basin, and we hypothesize that they overlay a basement of Tertiary volcanic rock that connects the two Tertiary volcanic units mapped in the surface geology along the northwest coast and in the center of Lombok (TQb in Figure 2).
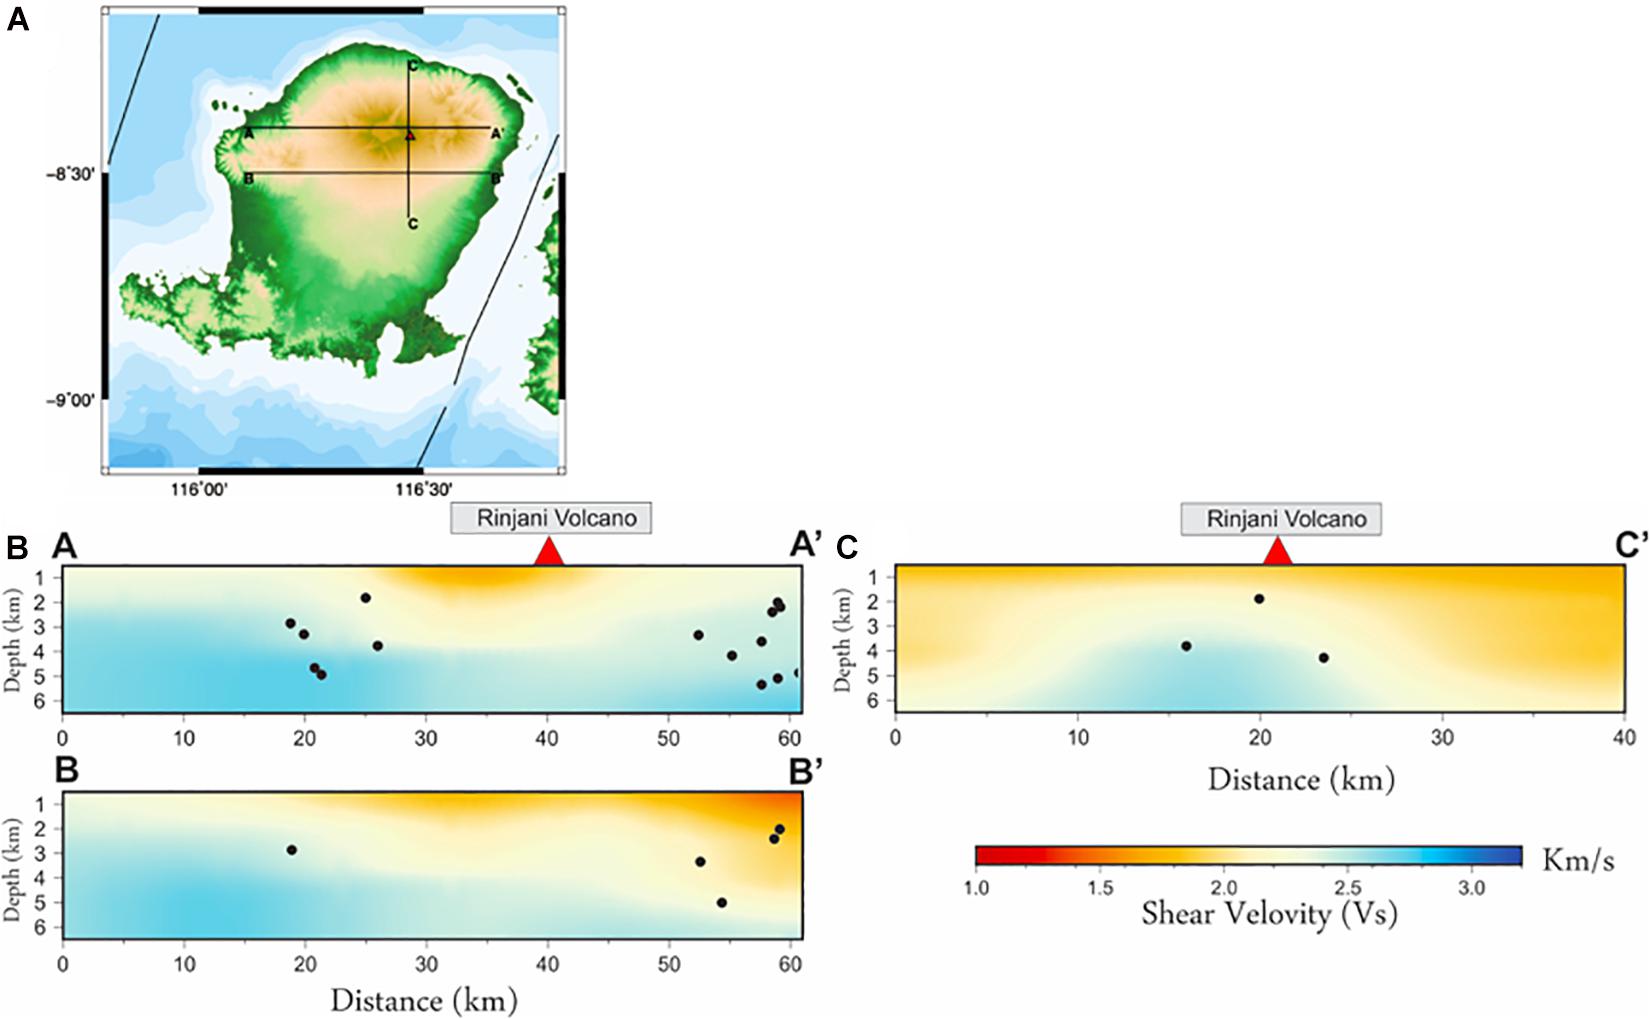
Figure 11. (A) Map of Lombok Island with three back lines show the tracks of the vertical cross-section at line A-A’, B-B’, and C-C’. (B) the vertical cross-section in Lombok Island passing through line A-A’, B-B’, C-C’, where line A-A’ and C-C’ passing through Rinjani Volcano with relocated hypocentres from Sasmi et al. (2020) marked by filled black circles. Blue and red colors indicate high and low shear wave velocity values, respectively.
Conclusion
We have conducted an ANT study to determine Vs in and around the source region of the 2018 earthquake sequences using a temporary local seismograph network. The ANT results image the upper crust of Lombok from depth 0.5 to 6 km which is poorly resolved by body wave tomography (Afif et al., under review). As the first local-scale ANT study of Lombok, we believe this study adds new insight into the shallow crustal structure of Lombok.
We used 20 stations in this study and successfully obtained 185 EGFs from cross correlation of inter-station ambient noise waveforms. The EGFs contained Rayleigh-wave energy in the period range 1 to 6 s and were used to generate Rayleigh wave group velocity maps for that period range using the FMST method. The Rayleigh wave dispersion curves obtained at each of 56 points distributed at 10 km intervals throughout Lombok were inverted to obtain depth profiles of Vs, which were then interpolated to obtain a pseudo-3D velocity model for the shallow crust.
From the Vs tomograms at fixed depth, we observe that the spatial pattern of Vs variations at shallow depth correlates well with the surface geology and Bouguer gravity anomaly maps (Sukardi, 1979 and Mangga et al., 1994). The low Vs anomalies appear to match well the pyroclastic density current deposits of the 1257 eruption of Salamas, but their much greater depth extent (4 km) indicates they may be associated with interbedded tuffs and lava flows from many previous Quaternary eruptions (Lavigne et al., 2013 and Métrich et al., 2017). An extension of the low Vs anomaly to the southwest of Mt. Rinjani, however, appears to fill a shallow basin whose basement may correspond to the Tertiary volcanics that outcrop along the northwest coast and in the center of Lombok. Taken together, this morphology of the Quaternary volcanic products supports the idea that, while Tertiary volcanic rocks crop out in the southern part of Lombok, subareal growth of the island is taking place to the north and east via the emplacement of younger, more andesitic volcanic products (Foden, 1983).
The mapping of upper crustal seismic velocity structure produced here could prove useful for understanding both earthquake and volcanic activity on Lombok, by making possible the high-precision determination of earthquake hypocentres and focal mechanisms. A limitation of this study, however, is the small number of stations used, providing only limited path coverage and resolution. Thus, other studies are needed to have a better understanding of the subsurface structure of Lombok.
Data Availability Statement
The raw data supporting the conclusions of this article will be made available by the authors, without undue reservation.
Author Contributions
AS, ZZ, AN, PC, and SR contributed to the writing of the manuscript. ZZ (ITB) and MM (EOS) led the field work. All authors contributed to giving constructive reviews and suggestions.
Funding
This research was funded by Riset ITB 2019 and Riset DIKTI 2019–2020 awarded to AN. A total of 20 instrument sets used in Lombok Island partially supported by ITB, EOS-NTU, PVMBG, and BMKG.
Conflict of Interest
The authors declare that the research was conducted in the absence of any commercial or financial relationships that could be construed as a potential conflict of interest.
Acknowledgments
We are grateful to our colleagues Institut Teknologi Bandung (ITB), the Indonesian Meteorological, Climatological, and Geophysical Agency (BMKG), the Earth Observatory Singapore-Nanyang Technological University (EOS-NTU), and Center for Volcanology and Geological Hazard Mitigation of Indonesia (PVMBG) for participation as a partner to do this study. We also used a script from Huajian Yao for the cross-correlation process. We also used a Fast Marching Surface Tomography program from Nick Rawlinson. To compute sensitivity kernels we also used Computer programs in seismology from Robert B. Herrmann. We also used Generic Mapping Tools (Wessel and Smith, 1998) for producing the images.
References
Bensen, G. D., Ritzwoller, M. H., Barmin, M. P., Levshin, A. L., Lin, F., Moschetti, M. P., et al. (2007). Processing seismic ambient noise data to obtain reliable broad- band surface wave dispersion measurements. Geophys. J. Int. 169, 1239–1260.
Colombi, A., Chaput, J., Brenguier, F., Hillers, G., Roux, P., and Campillo, M. (2014). On the temporal stability of the coda of ambient noise correlations. C. R. Geosci. 346, 307–316.
Dziewonski, A. S., Bloch, S., and Landisman, M. (1969). A technique for the analysis of transient seismic signals. Bull. Seismol. Soc. Am. 59, 427–444. doi: 10.1016/j.ultras.2008.12.001
Foden, J. D. (1983). The petrology of the calcalkaline lavas of rinjani volcano, east sunda arc: a model for Island arc petrogenesis. J. Petrol. 24, 98–130.
Harris, R., and Major, J. (2016). Waves of destruction in the East Indies: the Wichmann catalogue of earthquakes and tsunami in the Indonesian region from 1538 to 1877. Geol. Soc. Spec. Publ. 441, 9–46.
Harsuko, M. R. C., Zulfakriza, Z., Nugraha, A. D., Sarjan, A. F. N., Widiyantoro, S., Rosalia, S., et al. (2020). Investigation of hilbert–huang transform and fourier transform for horizontal-to-vertical spectral ratio analysis: understanding the shallow structure in Mataram City, Lombok, Indonesia. Front. Earth Sci. 8:334. doi: 10.3389/feart.2020.00334
Herrmann, R. B. (2013). Computer programs in seismology: an evolving tool for instruction and research. Seism. Res. Lett. 84, 1081–1088. doi: 10.1785/0220110096
Kennett, B. L. N., Engdahl, E. R., and Buland, R. (1995). Constraints on seismic velocities in the Earth from traveltimes. Geophys. J. Int. 122, 108–124. doi: 10.1111/j.1365-246X.1995.tb03540.x
Kennett, B. L. N., Sambridge, M. S., and Williamson, P. R. (1988). Subspace methods for large scale inverse problems involving multiple parameter classes. Geophys. J. Int. 94, 237–247. doi: 10.1111/j.1365-246x.1988.tb05898.x
Kim, K. Y., and Hong, M. H. (2012). Shear-wave velocity structure of Jeju Island, Korea. Geosciences Journal 16, 35–45. doi: 10.1007/s12303-012-0004-9
Koulali, A., Susilo, S., McClusky, S., Meilano, I., Cummins, P., Tregoning, P., et al. (2016). Crustal strain partitioning and the associated earthquake hazard in the eastern Sunda-Banda arc. Geophys. Res. Lett. 43, 1943–1949.
K’́ohler, A., Weidle, C., and Maupin, V. (2012). On the effect of topography on surface wave propagation in the ambient noise frequency range. J. Seismol. 16, 221–231.
Lavigne, F., Degeai, J. P., Komorowski, J. C., Guillet, S., Robert, V., Lahitte, P., et al. (2013). Source of the great A.D. 1257 mystery eruption unveiled: Samalas volcano, Rinjani volcanic complex, Indonesia. Proc. Natl. Acad. Sci. U.S.A. 110, 16742–16747. doi: 10.1073/pnas.1307520110
Lazcano, S. (2010). “Experiences in pumice soil characterization by surface wave analysis, international,” in Proceeding of the Conferences on Recent Advances in Geotechnical Earthquake Engineering and Soil Dynamics, (At San Diego, CA), 23.
Luo, Y., Yang, Y., Xu, Y., Xu, H., Zhao, K., and Wang, K. (2015). On the limitations of interstation distances in ambient noise tomography. Geophys. J. Int. 201, 652–661. doi: 10.1093/gji/ggv043
Irsyam, M., Widiyantoro, S., Natawidjaja, D. H., Meilano, I., Rudyanto, A., Hidayati, S., et al. (2017). Buku Peta Gempa 2017. Bandung: Badan Penelitian dan Pengembangan Kementerian Pekerjaan Umum dan Perumahan Rakyat (Indonesian).
Mangga, S. A., Atmawinata, S., Hermanto, B., and Amin, T. C. (1994). Geological Map of Lombok Sheet. West Nusa Tenggara: Geological Research Center.
Martha, A. A., Cummins, P. R., Saygin, E., and Widiyantoro, S. (2017). Imaging of upper crustal structure beneath east Java–Bali, Indonesia with ambient noise tomography. Geosci. Lett. 4:14.
Matos, C., Silveira, G., Matias, L., Caldeira, R., Ribeiro, M. L., Dias, N. A., et al. (2015). Upper crustal structure of Madeira Island revealed from ambient noise tomography. J. Volcanol. Geothermal Res. 298, 136–145. doi: 10.1016/j.jvolgeores.2015.03.017
Métrich, N., Vidal, C. M., Komorowski, C. J., Pratomo, I., Michel, A., Kartadinata, N., et al. (2017). New insights into magma differentiation and storage in holocene crustal reservoirs of the lesser Sunda arc: the Rinjani–Samalas volcanic complex (Lombok, Indonesia). J. Petrol. 58, 2257–2284.
Mordret, A., Rivet, D., Landes, M., and Shapiro, N. M. (2014). 3-D shear-velocity anisotropic model of piton de la fournaise volcano (La Réunion Island) from ambient seismic noise. J. Geophys. Res. 120, 406–427.
Nunziata, C. (2010). Low shear-velocity zone in the neapolitan-area crust between the campi flegrei and vesuvio volcanic areas. Terra Nova 22, 208–217. doi: 10.1111/j.1365-3121.2010.00936.x
Nunziata, C., Mele, R., and Natale, M. (1999). Shear wave velocities and primary influencing factors of campi flegrei–neapolitan deposits. Eng. Geology 54, 299–312.
Porritt, R. W., Miller, M. S., O’Driscoll, L. J., Harris, C. W., Roosmawati, N., and Teofilo da Costa, L. (2016). Continent–arc collision in the Banda arc imaged by ambient noise tomography, Earth Planet. Sci. Lett. 449, 246–258. doi: 10.1016/j.epsl.2016.06.011
Pranata, B., Yudistira, T., Widiyantoro, S., Brahmantyo, B., Cummins, P. R., Saygin, E., et al. (2019). Shear wave velocity structure beneath Bandung basin, West Java, Indonesia from ambient noise tomography. Geophys. J. Int. 220, 1045–1054. doi: 10.1093/gji/ggz49.3
Price, N. J., and Audley-Charles, M. G. (1983). Plate rupture by hydraulic fracture resulting in overthrusting. Nature 306, 572–575.
Rachmat, H. (2016). Magmatic Evolution Rinjani Volcano Complex Based on Eruption Product Analysis. Ph. D. Dissertation. Bandung: Padjajaran University.
Rawlinson, N., Pozgay, S., and Fishwick, S. (2010). Seismic tomography: a window into deep Earth. Geoscience 178, 101–135.
Rawlinson, N., and Sambridge, M. (2005). The fast-marching method: an effective tool for tomographic imaging and tracking multiple phases in complex layered media, Explor. Geophys 36, 341–350. doi: 10.1071/EG05341
Rosalia, S., Cummins, P. R., Widiyantoro, S., Yudistira, T., Nugraha, A. D., and Hawkins, R. (2020). Group velocity maps using subspace and transdimensional inversions: ambient noise tomography in the western part of Java, Indonesia. Geophys. J. Int. 220, 1260–1274. doi: 10.1093/gji/ggz498
Sabra, K. G., Gerstoft, P., Roux, P., Kuperman, W. A., and Fehler, M. C. (2005). Extracting time-domain Green’s function estimates from ambient seismic noise. Geophys. Res. Lett. 32:L03310. doi: 10.1029/2004GL021862
Sambridge, M. (1999a). Geophysical inversion with a neighborhood algorithm I: searching a parameter space. Geophys. J. Int. 138, 479–494.
Sambridge, M. (1999b). Geophysical inversion with a neighborhood algorithm II: appraising the ensemble. Geophys. J. Int. 138, 727–746.
Sasmi, A. T., Nugraha, A. D., Muzli, M., Widiyantoro, S., Zulfakriza, Z., Wei, S., et al. (2020). Hypocenter and magintude analysis of aftershocks of 2018 Lombok Earthquakes, Indonesia, using local seimographic networks. seismol. Res. Lett. 91, 2152–2162.
Saygin, E., Cummins, P. R., Cipta, A., Hawkins, R., Pandhu, R., Murjaya, J., et al. (2016). Imaging architecture of the Jakarta Basin, Indonesia with transdimensional inversion of seismic noise. Geophys. J. Int. 204, 918–931. doi: 10.1093/gji/ggv466
Saygin, E., and Kennett, B. L. N. (2010). Ambient seismic noise tomography of Australian continent. Tectonophysics 481, 116–125.
Sethian, J. A., and Popovici, A. M. (1999). 3-D traveltime computation using the fast marching method. Geophysics 64, 516–523.
Shapiro, N. M., and Campillo, M. (2004). Emergence of broadband rayleigh waves from correlations of the ambient seismic noise. Geophys. Res. Lett. 31:L07614. doi: 10.1029/2004GL019491
Silver, E. A., Reed, D., and McCaffrey, R. (1983). Back arc thrusting in the Eastern Sunda arc, Indonesia: a consequence of arc-continent collision. J. Geophys. Res. 88, 7429–7448.
Snieder, R. (2004). Extracting the green’s function from the correlation of coda waves: a derivation based on stationary phase. Phys. Rev. Lett. 69:046610. doi: 10.1103/PhysRevE.69.046610
Stankiewicz, J., Ryberg, T., Haberland, C., and Natawidjaja, D. H. (2010). Lake toba volcano magma chamber imaged by ambient seismic noise tomography. Geophys. Res. Lett. 37:L17306. doi: 10.1029/2010GL044211
Sukardi, S. (1979). Anomaly Bouguer Map, Lombok. Bandung: Geological Research and Development Centre of Indonesia.
Tsai, V. C. (2009). On establishing the accuracy of noise tomography travel-time measurements in a realistic medium. Geophys. J. Int. 178, 1555–1564. doi: 10.1111/j.1365-246X.2009.04239.x
Wathelet, M., Jongmans, D., Ohrnberger, M., and Bonnefoy-Claudet, S. (2008). Array performances for ambient vibrations on a shallow structure and consequences over Vs inversion. J. Seismol. 12, 1–19.
Wessel, P., and Smith, W. H. F. (1998). New, improved version of generic mapping tools released. Eos Trans. Am. Geophys. Union 79, 579–579. doi: 10.1029/98EO00426
Wichmann, A. (1918). The earthquakes of the indian archipelago until the year 1857. Diss. R. Accad. Sci. Amst. 20, 1–177.
Yang, X., Singh, S. C., and Tripathi, A. (2020). Did the flores backarc thrust rupture offshore during the 2018 Lombok earthquake sequence in Indonesia? Geophy. J. Int. 221, 758–768.
Yao, H., and van der Hilst, R. D. (2009). Analysis of ambient noise energy distribution and phase velocity bias in ambient noise tomography, with application to SE Tibet. Geophys. J. Int 179, 1113–1132.
Yao, H., van der Hilst, R. D., and de Hoop, M. V. (2006). Surface-wave array tomography in SE Tibet from ambient seismic noise and two-station analysis–I. phase velocity maps. Geophys. J. Int. 166, 732–744.
Zubaidah, T., Korte, M., Mandea, M., and Hamoudi, M. (2014). New insights into regional tectonics of the Sunda-Banda arcs region from integrated magnetic and gravity modelling. J. Asian. Earth Sci. 80, 172–184. doi: 10.1016/j.jseaes.2013.11.013
Zubaidah, T., Korte, M., Mandea, M., Quesnel, Y., and Kanata, B. (2009). Geomagnetic field anomalies over the Lombok Island region: an attempt to understand the local tectonic changes. Int. J. Earth Sci. 99, 1123–1132.
Zulfakriza, Z., Nugraha, A. D., Widiyantoro, S., Cummins, P. R., Sahara, D. P., Rosalia, S., et al. (2020). Tomographic imaging of the agung-batur volcano complex, Bali, Indonesia, from the ambient seismic noise field. Front. Earth Sci. 8:43. doi: 10.3389/feart.2020.00043
Keywords: Rayleigh wave, cross-correlation, ambient noise tomography, 2018 Lombok earthquakes, neighborhood algorithm
Citation: Sarjan AFN, Zulfakriza Z, Nugraha AD, Rosalia S, Wei S, Widiyantoro S, Cummins PR, Muzli M, Sahara DP, Puspito NT, Priyono A and Afif H (2021) Delineation of Upper Crustal Structure Beneath the Island of Lombok, Indonesia, Using Ambient Seismic Noise Tomography. Front. Earth Sci. 9:560428. doi: 10.3389/feart.2021.560428
Received: 08 May 2020; Accepted: 29 March 2021;
Published: 22 April 2021.
Edited by:
Basilios Tsikouras, Universiti Brunei Darussalam, BruneiReviewed by:
Shu-Huei Hung, National Taiwan University, TaiwanXinfu Li, China University of Geosciences, China
Copyright © 2021 Sarjan, Zulfakriza, Nugraha, Rosalia, Wei, Widiyantoro, Cummins, Muzli, Sahara, Puspito, Priyono and Afif. This is an open-access article distributed under the terms of the Creative Commons Attribution License (CC BY). The use, distribution or reproduction in other forums is permitted, provided the original author(s) and the copyright owner(s) are credited and that the original publication in this journal is cited, in accordance with accepted academic practice. No use, distribution or reproduction is permitted which does not comply with these terms.
*Correspondence: Achmad F. N. Sarjan, YWNobWFkLmZhamFyLm5hcm90YW1hQGdtYWlsLmNvbQ==; Zulfakriza Zulfakriza, enVsZmFrcml6YUBpdGIuYWMuaWQ=