 Fanglong Wang
 Zhongqin Li1,2
 Xiaoni You
 Xi Zhou
94% of researchers rate our articles as excellent or good
Learn more about the work of our research integrity team to safeguard the quality of each article we publish.
Find out more
ORIGINAL RESEARCH article
Front. Earth Sci., 03 March 2021
Sec. Atmospheric Science
Volume 9 - 2021 | https://doi.org/10.3389/feart.2021.527475
In this study, air pollutants were analyzed at a low-industry city on the Silk Road Economic Belt of Northwestern China from 2015 to 2018. The results show that SO2 and CO had a decreasing trend and NO2, O3, PM2.5, and PM10 had an increasing trend during the study period. The primary characteristic pollutants were PM2.5 and PM10, which were higher than China’s Grade II standard. SO2, NO2, CO, PM2.5, and PM10 concentrations showed similar seasonal variation patterns: the highest pollutant concentration was in winter and the lowest in summer. Those pollutants showed a similar diurnal pattern with two peaks, one at 7:00 to 9:00 and another at 21:00 to 22:00. However, O3 concentration was highest in summer and lowest in winter, with a unimodal diurnal variation pattern. The annual average pollution concentrations in Tianshui in 2017 were substantially lower than the concentrations reported by most cities in China. By examining the meteorological conditions at a daily scale, we found that Tianshui was highly influenced by local emissions and a southwest wind. Potential source contributions and concentration weighted trajectory analyses indicated that the pollution from Gansu, Sichuan, Qinghai, and Shaanxi Province could affect the pollution concentration in Tianshui. The results provide directions for the government to take in formulating regional air pollution prevention and control measures and to improve air quality.
As social and economic development and urbanization accelerate, many nations face serious environmental issues such as air pollution, acid rain spread, climate warming, and ozone depletion. Among those issues, air pollution has always been paid close attention because of its important effects on the earth’s climate, human health, and the atmosphere (Chow, 2006; IPCC, 2007; Kan et al., 2007; Lim et al., 2013). In 2014, 92% of the world’s population lived in areas that did not meet the World Health Organization (WHO) air quality guidelines (WHO, 2016). The Asian Development Bank (ADB) research shows that seven of the world’s top 10 polluted cities were in China, where only five cities met the WHO air quality standards (Zhang and Crooks, 2014). The central and eastern regions of China suffered extensive, persistent moderate to severe haze weather in 2013, which affected 11 provinces (cities, districts) with an area of 2.07 million square kilometers. In 2015, the Global Burden of Disease project found that air pollution had caused 1.6 million deaths in China and 4.2 million deaths worldwide (Forouzanfar et al., 2016; Landrigan, 2016). Currently, China’s urban atmospheric environment is polluted with a compound of primarily sulfur dioxide, nitrogen oxide, ozone, and fine particulate matter (PM) (Zhang et al., 2008).
In China, the air pollution problem has attracted wide attention from the government, the public, and researchers. The air quality standard of Total Suspended Particulate (TSP) matter was established in China in the 1970s. In 1996, the air quality standard for PM of 10 μm or less (PM10, Ambient Air Quality Standard GB 3095-1996) was increased, but there was no standard limit on the mass concentration of PM2.5. In February 2012, the Chinese government released new technical regulations, the Ambient Air Quality Index (HJ 633-2012) (MEP, 2012), replacing the Air Pollution Index (API) with the Air Quality Index (AQI), to which PM2.5 and O3 were added for the first time. Since January 2013, the Chinese Ministry of Environmental Protection (MEP) started to approve the monitoring of concentrations of the six criteria air pollutants (carbon monoxide, nitrogen dioxide, ozone, PM, and sulfur dioxide) at the national air quality sites of some major cities. Many researchers have done extensive work at the scale of regions, urban agglomerations, and cities based on the air pollutant data (Ta et al., 2004; Streets et al., 2007; Chu et al., 2008; Chai et al., 2014; Wang et al., 2014a; Xie et al., 2015; Ma and Jia, 2016; Yin et al., 2016; Zhang et al., 2016; Zhao et al., 2016; Guan et al., 2017; Zhou et al., 2018; Yin et al., 2019). Many researchers have reported on air pollution problems in the Beijing–Tianjin–Hebei region, the Pearl River Delta, the Yangtze River Delta, and the Sichuan basin (Hu et al., 2014; Tan et al., 2015; Lai et al., 2016; Wang et al., 2016; Liao et al., 2017; Mao et al., 2018; Zhao et al., 2018). However, those studies focused mainly on China’s east and southeast regions, which had rapid economic development and frequent human activities, and they paid less attention to the northwest region.
Tianshui is a narrow valley city between the Qinling Mountains and the Loess Plateau and the watersheds of the Yellow River and the Yangtze River. It is at the northern edge of the Asian summer monsoon, which is affected by climate change and is one of the fragile areas of climate-sensitive ecology. Tianshui is a low-industry city characterized by agriculture and tourism. It became a national development zone in 2009 and has become a rapid economic development zone. As the subpolar core city and the important development pole of the Guanzhong–Tianshui Economic Zone, Tianshui was listed in the planning of urban agglomeration and regional central cities at the national level during the thirteenth five-year plan period, which was an important strategic node of the “Belt and Road” initiative. Therefore, research on its air pollution and environmental control was important.
Air pollution in Tianshui has been partially studied in recent years; however, many studies focused only on analyzing the characteristics of single air pollutants. Systematic knowledge of pollution characteristics and air quality conditions is still lacking compared with that of other cities in China. In this study, we analyzed the variation characteristics of the air pollutants at three sites in Tianshui from 2015 to 2018. We also studied the relation of the pollutants to meteorological elements and the potential sources of atmospheric PM based on the latest air pollutant data sets. This study will provide a scientific basis for improving the atmospheric environment, formulating practical air pollution control measures, and helping decision makers effectively control air pollution.
Tianshui (34.58°N, 105.72°E) is in the southeast of Gansu Province, which is near the relatively polluted central and western regions of China and on the transport routes of sandstorms in two areas: the Badain Jaran Desert and Hexi Corridor region, and the Taklimakan basin and Gobi Desert region. Tianshui is the northwest Longdongnan regional transport hub and logistics center. The area of the city is approximately 56 km2. It has two districts: Qinzhou and Maiji and five counties: Gangu, Qing’an, Wushan, Qingshui, and Zhangjiachuan. The altitude of the city is low in the northwest and southeast, ranging from 1,000 to 2,100 m a.s.l. It is in the gully region of the Loess Plateau and the western Qinling Mountains (Figure 1). The urban area is confined by the northern and southern mountains, and the northern and southern widths are only 1.3 km, extending 36 km from east to west.
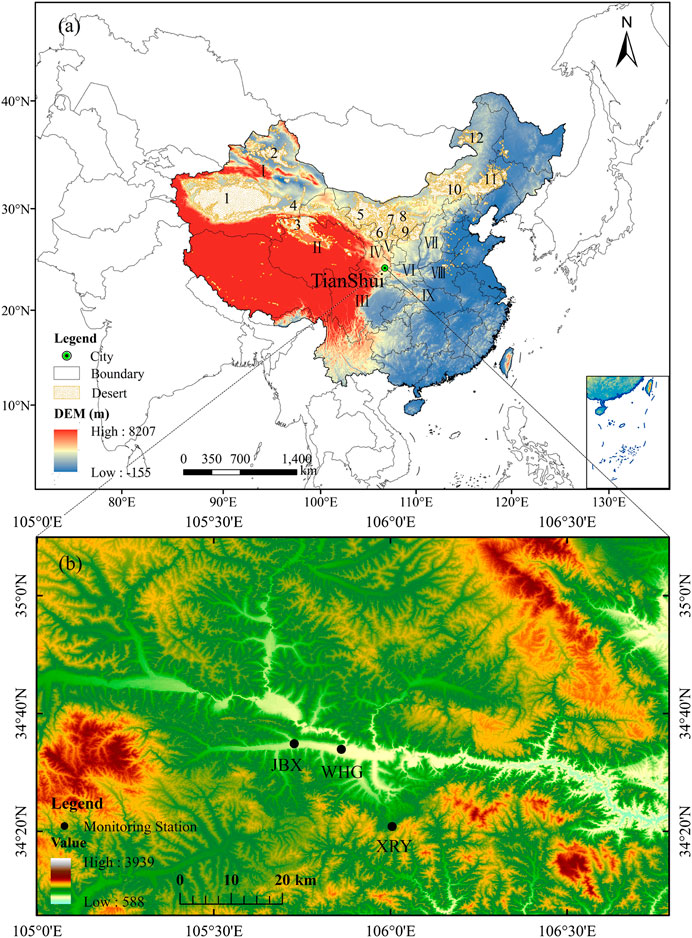
FIGURE 1. Digital elevation data for the area surrounding Tianshui. The data were downloaded from the geospatial data cloud (HYPERLINK “http://www.gscloud.cn/” \o “http://www.gscloud.cn/” http://www.gscloud.cn/) and processed using ArcGIS 10.2 software. (A) Map of China and a location map of the receptor sites: 1. Taklimakan Desert, 2. Gurbantunggut Desert, 3. Qaidam Basin Desert, 4. Kumtag Desert, 5. Badain Jaran Desert, 6. Tengger Desert, 7. Ulan Buh Desert, 8. Kubuqi Desert, 9. Mu Us sandy land, 10. Hongshandake Desert, 11. Keerqin Desert, 12. Hulunbeier Desert. I. Xinjiang Uygur Autonomous Region, II. Qinghai province, III. Sichuan province, IV. Gansu Province, V. Ningxia the Hui Autonomous Region, VI. Shaanxi Province, VII. Shanxi province, VIII. Henan province, IX. Hubei province. (B) Enlarged topographic map of Tianshui. XRY, WHG, and JBX indicate the monitoring stations Xianrenya, Wenhuaguan, and Jinbuxiang, respectively.
The 24 h daily average and hourly concentration data of the AQI and of the six standard pollutants in this study were released by the China National Environmental Monitoring Centre (http://106.37.208.233:20035/). Tianshui has three state-owned automatic ambient air monitoring stations, of which one is a background observation site in a rural area (the XRY, Xianrenya) and two are observation sites in urban areas (the WHG, Wenhuaguan, and the JBX, Jinbuxiang) (Figure 1). We also used data from 168 key environmental monitors in Chinese cities in 2017 to compare with those from Tianshui (MEP, 2013). The surface meteorological data sets such as relative humidity (RH), temperature, wind direction, and wind speed (WS) were derived from the national meteorological science data sharing service platform (HYPERLINK “http://data.cma.cn/” \o “http://data.cma.cn/” http://data.cma.cn/). To study the diurnal variation of air pollutants, we investigated variations in the planetary boundary layer height (PBLH) over the study area. We obtained information from the NOAA (National Oceanic and Atmospheric Administration) website (ftp://arlftp.arlhq.noaa.gov/pub/archives/gdas1) for the global data assimilation system (GDAS) data set. These data give the boundary layer height every 3 h (00:00, 03:00, 06:00, 09:00, 12:00, 15:00, 18:00, and 21:00 UTC), with a spatial resolution of 1° × 1°. The PBLH data in the latitude–longitude grid of 34.58°N and 105.72°E cover the observation site. To compare the data sets, we calculated the PBLH at the same diurnal-hour intervals as the air pollutants. To measure the concentrations of the PM and the gaseous pollutants in the air, we fixed an automatic monitoring system at each site and used standard methods based on GB specification 3095-2012 (http://hbj.new.cqcs.gov.cn/upfiles/2013-3/2013327153015207.pdf); instrument information and methods were listed in the Supplementary Fd. S1.
In this study, we selected the daily meteorological data and the daily and hourly concentrations of six pollutants in Tianshui for the period of January 1, 2015, to December 31, 2018. We then summarized and analyzed the concentration level, time variation characteristics, and potential source distribution of air pollutants (Table 1; Figures 2–3). To study the influence of local meteorological elements on air pollutant concentrations, we also used Pearson correlation coefficient analysis and statistical analysis (Figures 5, 6, Supplementary Tables S1–S3). We calculated the daily average concentrations of air pollutants using the average hourly data of three monitoring points in Tianshui. On the basis of the annual data on air pollutants in each city, we compared the results with those of 168 cities monitored by the Ministry of Environmental Protection (Figure 4) and derived the data from the raw datasets.
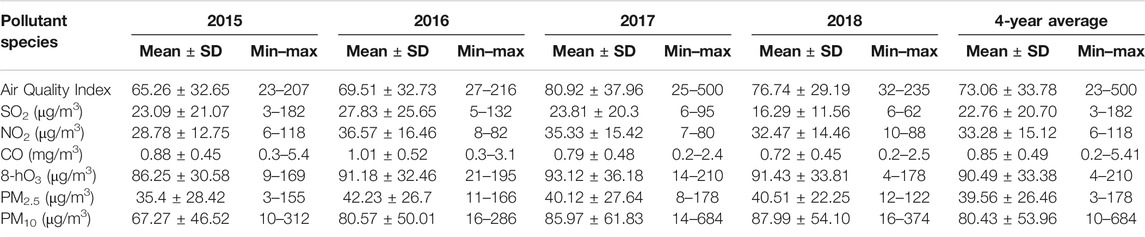
TABLE 1. Statistical summary of Air Quality Index and six criteria pollutants during 2015–2018.
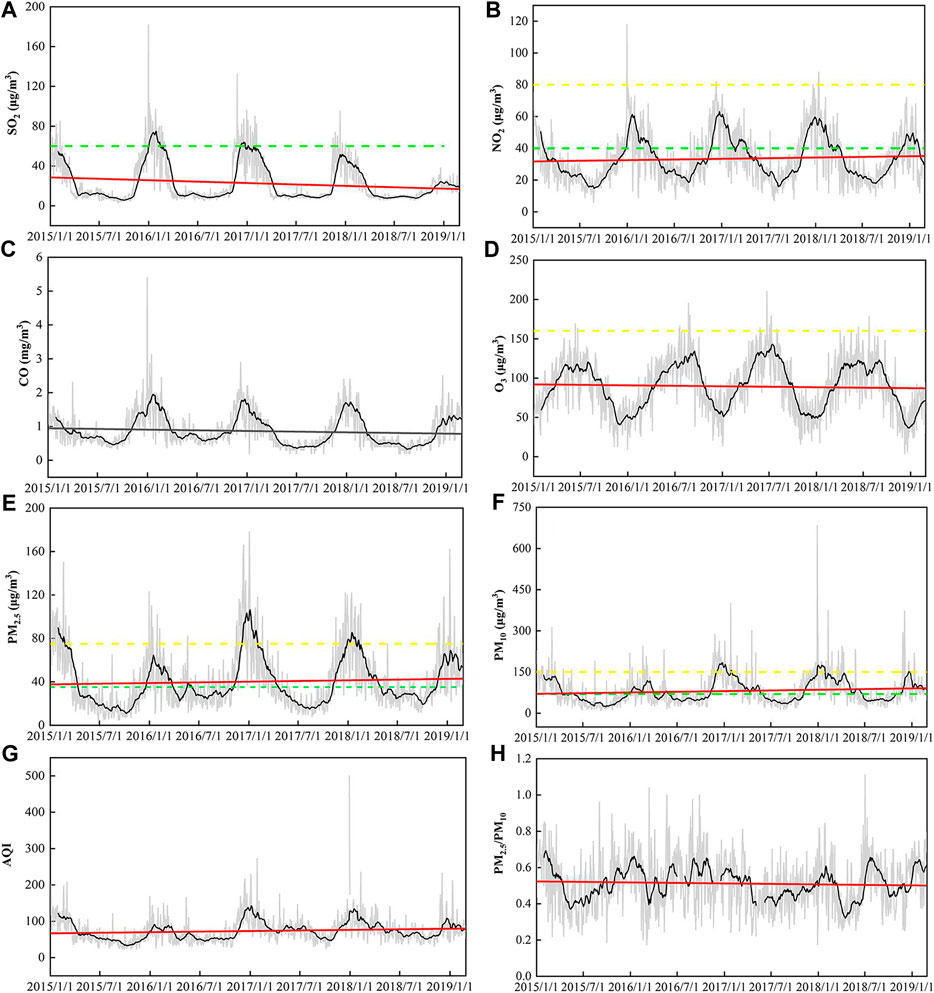
FIGURE 2. Daily concentrations of pollutants in Tianshui from 2015 to 2018. Black lines are the 30-day moving averages, red lines are the linear trends, green dashed lines are annual mean concentration limit values, and yellow dashed lines are daily mean concentration limit values. (A) SO2. (B) NO2. (C) CO. (D) 8-hO3. (E) PM2.5. (F) PM10. (G) AQI. (H) PM2.5/PM10.
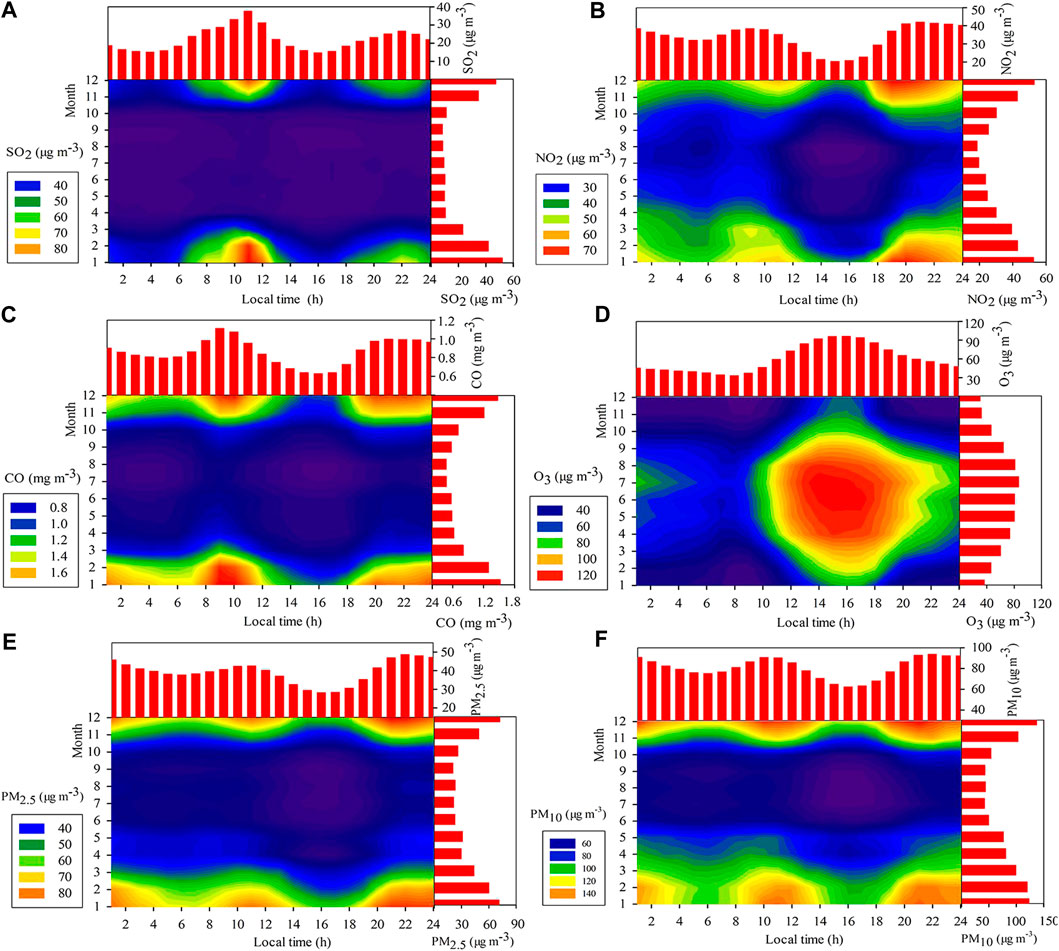
FIGURE 3. Concentrations of gaseous and particulate matter in Tianshui at various daily and yearly times. (A) SO2. (B) NO2. (C) CO. (D) O3. (E) PM2.5. (F) PM10.
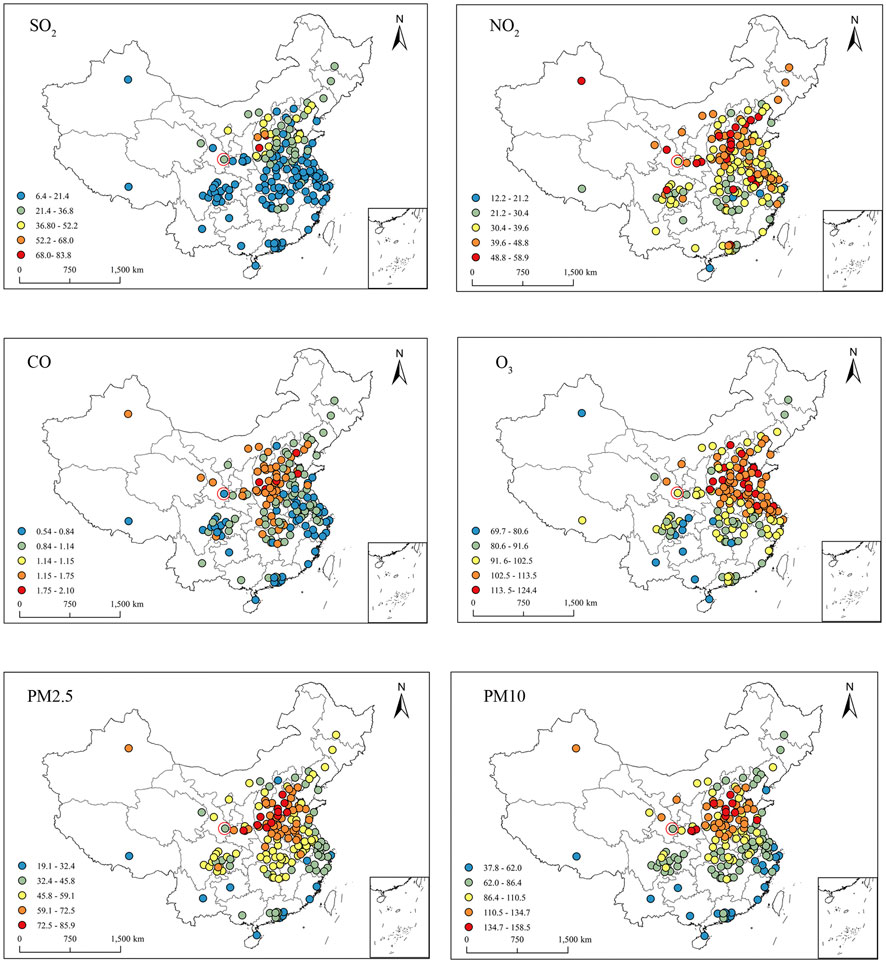
FIGURE 4. Comparison of annual mean concentrations of six air pollutants for 168 major cities in 2017 (μg m−3, except CO mg m-3). The red circle indicates Tianshui. (a) SO2. (b) NO2. (c) CO. (d) O3. (e) PM2.5. (f) PM10.
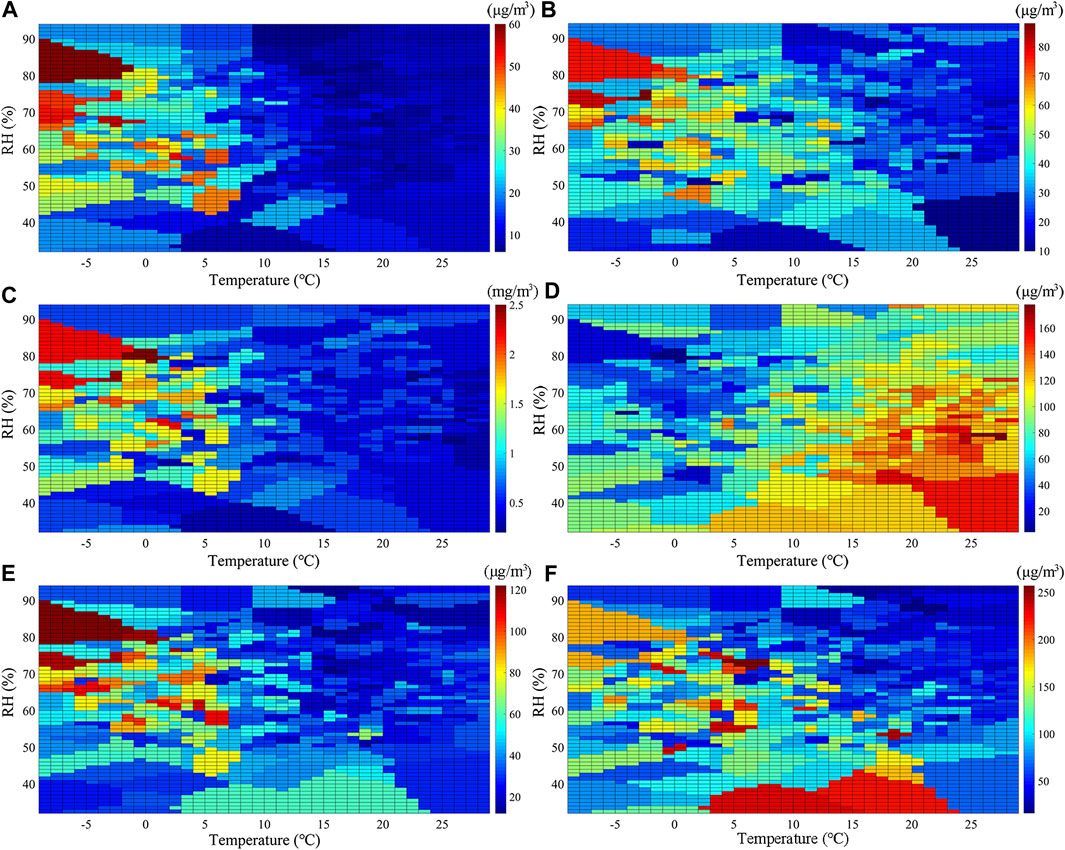
FIGURE 5. Relation of pollutant concentrations to temperature and relative humidity. (a) SO2. (b) NO2. (c) CO. (d) O3. (e) PM2.5. (f) PM10.
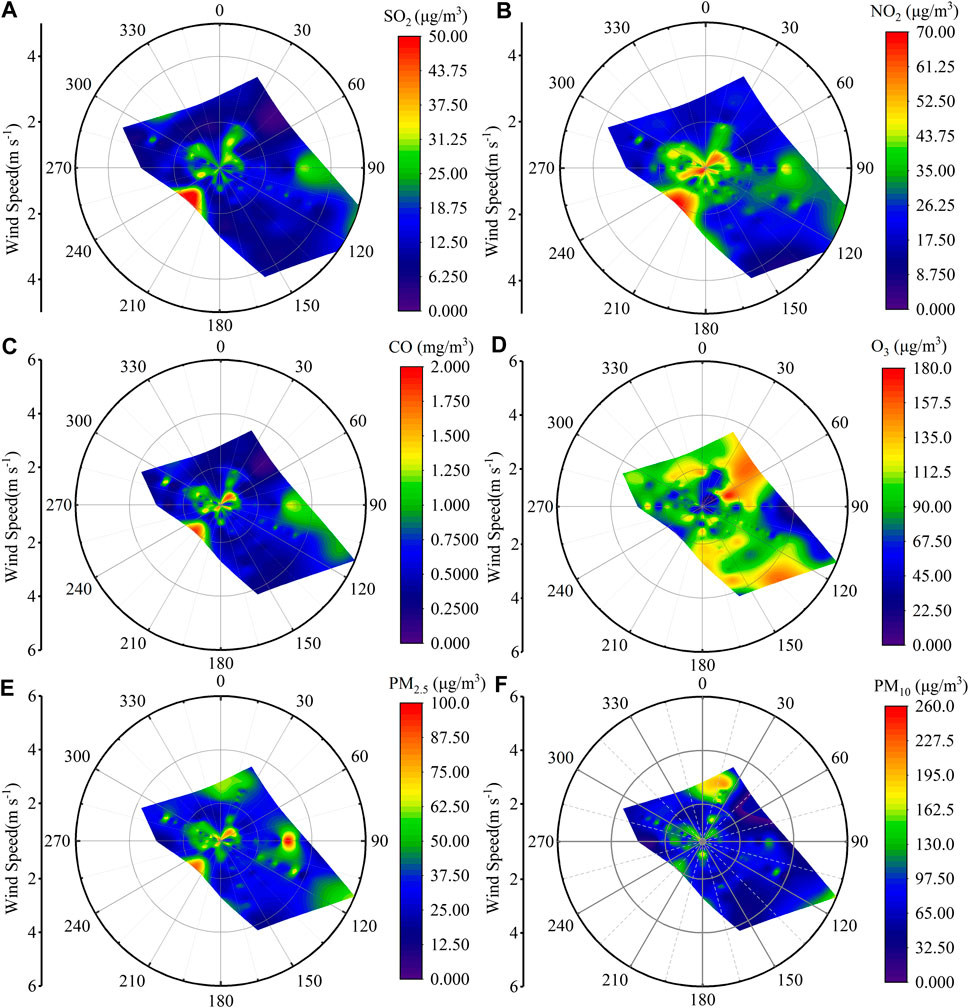
FIGURE 6. Polar plots of SO2, NO2, CO, O3, PM2.5, and PM10 concentrations inTianshui. (a) SO2. (b) NO2. (c) CO. (d) O3. (e) PM2.5. (f) PM10.
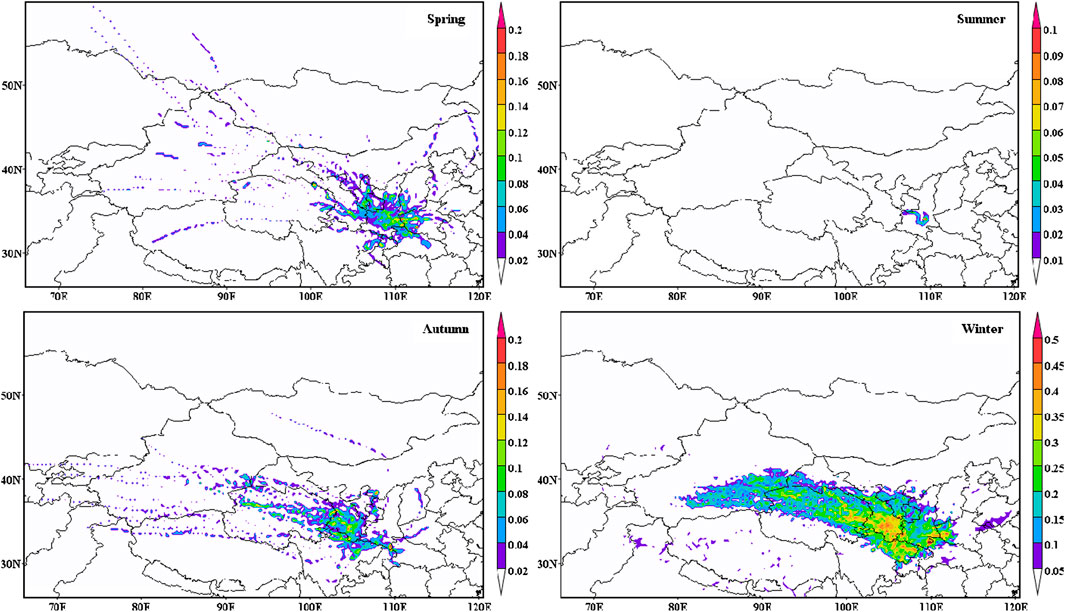
FIGURE 7. Weighted potential source contribution function distribution of PM2.5 in different seasons.
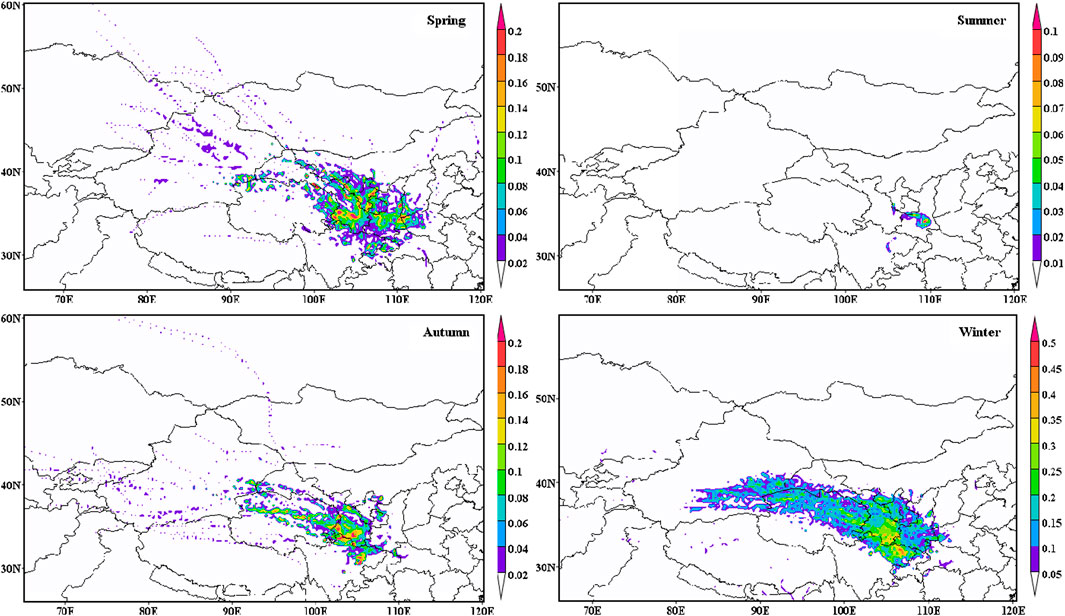
FIGURE 8. Weighted potential source contribution function distribution of PM10 in different seasons.
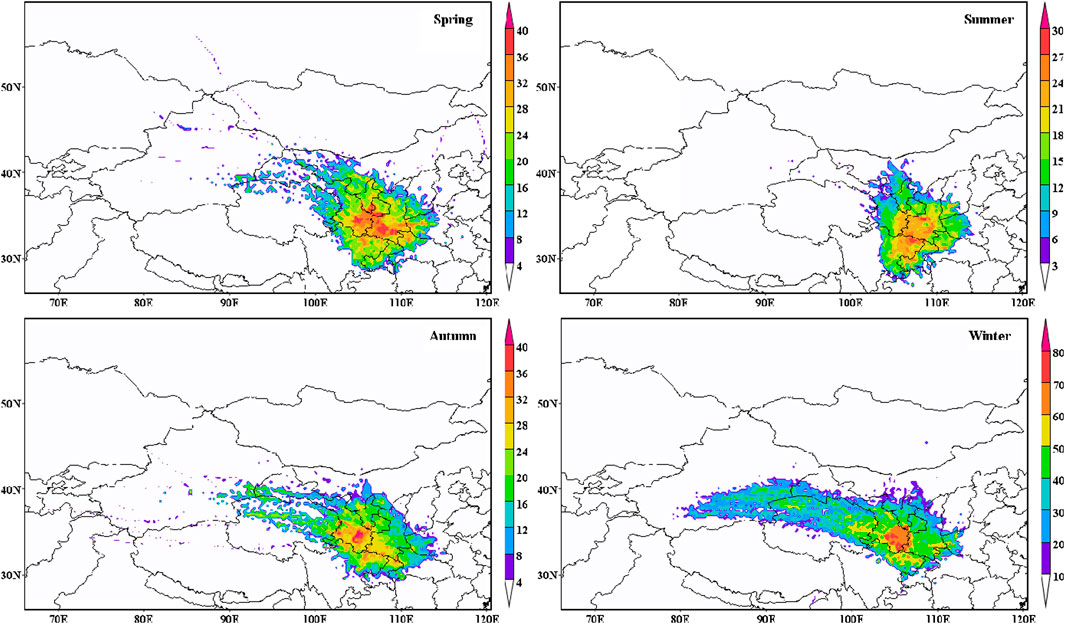
FIGURE 9. Weighted concentration weighted trajectory distribution of PM2.5 in different seasons (μg m−3).
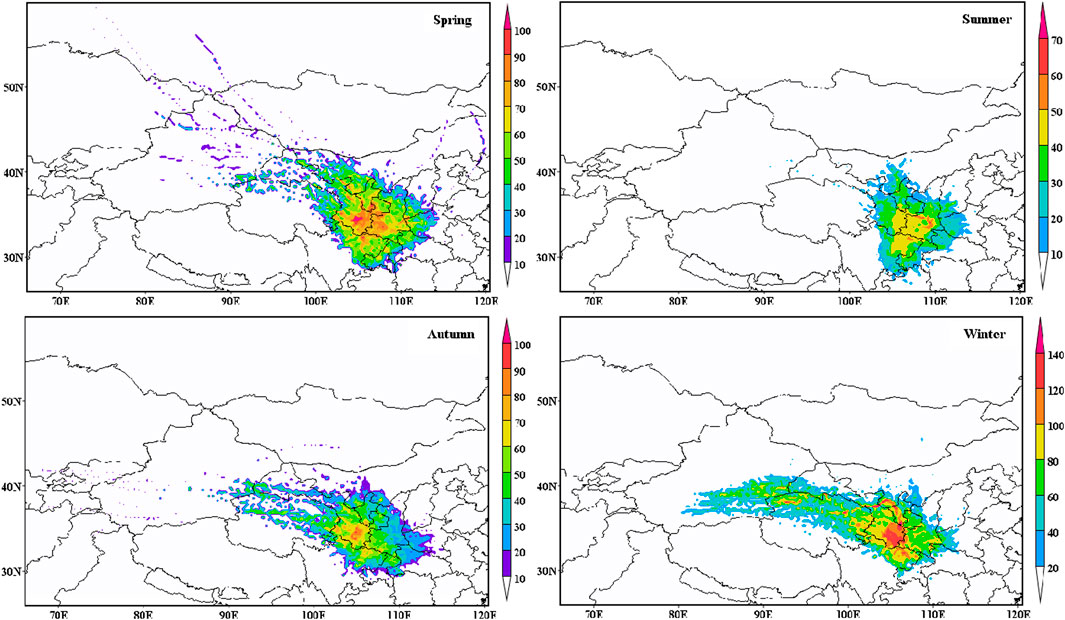
FIGURE 10. Weighted concentration weighted trajectory distribution of PM10 in different seasons (μg m−3).
Data quality assurance was carried out according to HJ 630-2011 specifications (HYPERLINK “http://kjs.mep.gov.cn/hjbhbz/bzwb/other/qt/201109/W020120130585014685198.pdf) before" \o "http://kjs.mep.gov.cn/hjbhbz/bzwb/other/qt/201109/W020120130585014685198.pdf) before"http://kjs.mep.gov.cn/hjbhbz/bzwb/other/qt/201109/W020120130585014685198.pdf) before being published on the public website. On the basis of several methods, we tested the accuracy, consistency, and validity of the data and compared those with the previous data. We also further processed the published data to assess the pollution situation in China. The data had no missing values, confirming its integrity. The validity of the data was demonstrated based on GB 3095-2012 specifications. We calculated the monthly averaged concentrations of six critical pollutants based on at least 25 daily average concentrations. The 24 h average concentrations of each pollutant were calculated only when there were over 20 h of valid data. The 8 h O3 concentrations were calculated only when there were at least 6 h of valid data for every 8 h. To better confirm the data’s quality, an independence, normativeness, and reliability analysis was done using a runs test and a Kolmogorov–Smirnov test. The Cronbach’s alpha was 0.866 (>0.6), which indicates that those data characteristics were favorable. Some previous studies have also used some statistical methods to show that the quality of the data is reliable (Xie et al., 2015; Zhao et al., 2016; Zhou et al., 2018).
To determine the potential long-distance transport pathways of air masses reaching Tianshui, we calculated 3-day backward air-mass trajectories using the hybrid single-particle Lagrangian integrated trajectory (HYSPLIT) model and the NCEP/NCAR GDAS dataset (Draxler and Rolph, 2013). We ran the trajectory calculations four times per day from 2015 to 2018 at 500 m above the ground, with start times of 00:00, 06:00, 12:00, and 18:00 UTC. There, we used MeteoInfo, an open-source software application (Wang et al., 2014b; Wang, 2019) (http://meteothink.org/). This was a free meteorological data display and statistical analysis tool based on a geographic information system and a HYSPLIT model. We used a potential source contribution function (PSCF) analysis to identifying pollution source areas based on airflow trajectory (Ashbaugh et al., 1985). We also used that analysis to identify potential sources of pollution affecting atmospheric PM in the study area. The concentration weighted trajectory (CWT) method had been applied to calculate the weight of the airflow trajectory concentration in the potential source region and to analyze the pollution paths of different trajectories and their potential source regions (Hsu et al., 2003). Those results were included in the HYSPLIT model, and their details were shown in the Supplementary Fd. S2.
In this research, the grid cover region was confined to the range of 24°N to 54°N and 66°E to 119°E and grid cells of 0.25° × 0.25°. On the basis of the Chinese Ambient Air Quality Standards (GB3095-2012) Grade II, the PM2.5 and PM10 standards were set at 75 and 150 μg m−3, which were treated as the “polluted” threshold. The higher values of CWT and PSCF indicated the potential for contributions to high pollution levels and higher potential sources of receptor sites.
Table 1 shows data statistics on the six air pollutants and air quality throughout the study period, according to the dataset for pollutant concentrations from three ambient air quality monitoring stations in Tianshui. The concentration of each pollutant fluctuated greatly throughout the whole year (Figure 2). The concentrations were affected by seasons and weather; they may also have an important relationship with the diffusion of the boundary layer and dust storms. The former has an important effect on the diffusion of pollutants (Marcazzan et al., 2001), and the latter greatly increases the concentration of particulates, in particular, PM10 (Xie et al., 2005).
According to the Chinese Ambient Air Quality Standard CAAQS-2012 issued in 2012, O3, CO, SO2, and NO2 reached the national secondary standard of ambient air quality, whereas PM2.5 and PM10 were 0.13 and 0.15 times the national secondary standard of ambient air pollutants, respectively. We used the 24-h average of pollutants for moving time series processing. The annual change trend of pollutants is shown in Figure 2, where the horizontal dotted line is considered the Grade II standard of the national environmental air quality and the green and yellow lines represent the annual limit and daily limited values, respectively. In four years, the consistency of SO2 (−2.27 μg m−3 year−1) and CO (−0.05 mg m−3 year−1) steadily decreased, whereas NO2 (1.23 μg m−3 year−1), O3 (1.73 μg m−3 year−1), PM2.5 (1.70 μg m−3 year−1), and PM10 (6.91 μg m−3 year−1) increased slightly. Especially, the annual mean value of PM10 increased from 67.27 ± 46.52 to 87.99 ± 54.10 μg m−3 at a rate of 6.91 μg m−3 year−1. The NO2/SO2 ratio is often used as an important index to judge whether atmospheric pollutants are from fixed or moving sources; a larger NO2/SO2 ratio indicates that the contribution of mobile pollution sources to atmospheric pollutants is greater. In this study, from 2015 to 2018 the NO2/SO2 ratio was 1.25, 1.31, 1.48, and 1.99, respectively, indicating that mobile origins were more influential. The PM2.5/PM10 ratio can often identify the sources of airborne particles of different sizes (Wang et al., 2014). In this study, the low PM2.5/PM10 (<0.6) ratio was related to the main contribution of dust storms over long distances, and the high ratios were related to secondary particle formation of SO42−, NO3−, NH4+, and organics. Over the study’s 4 years, the PM2.5/PM10 ratio in Tianshui was lower than 0.53, which was lower than that of most Chinese cities. This indicates that Tianshui was vulnerable to sandstorms in the lower reaches of the Taklimakan Desert and the Hexi Corridor. The annual average consistency of SO2, NO2, CO, and PM2.5 reached its peak in 2016 and then fell year by year, which may be related to some of the environmental protection measures of the government under the background of environmental protection in the whole country (AEMB, 2017).
Figure 3 shows seasonal and daily variations of air pollutant levels in Tianshui from 2015 to 2018. SO2 reached a maximum concentration (47.12 μg m−3) in the winter; the peak month was January (52.10 μg m−3). CO also reached a maximum concentration (1.43 mg m−3) in the winter with the peak month in January (1.52 mg m−3). The NO2 concentration was maximum in winter (49.47 μg m−3), with the peak month in December (52.10 μg m−3). Summer was the lowest season for SO2 (<9.40 μg m−3), NO2 (20.67 μg m−3), and CO (0.51 mg m−3). Apparently, the seasonal variations of SO2, NO2, and CO concentrations showed very similar “U” patterns, with the concentration values being winter > autumn > spring > summer. The result was related to the comprehensive effect of the primary emissions of household heating, the adverse diffusion conditions, and the photochemical reaction (Zhao et al., 2015). Household heating in Tianshui usually started in November and lasted until March: the combustion of fossil fuels in the heating period, industrial coal, residential heating emissions, and poor diffusion conditions in winter helped to highly concentrate pollutants. However, in summer there were fewer combustion sources, and the effect of precipitation moisture removal was strong, thus reducing the concentration of pollutants. The photochemical activity of NO2 caused the chemical reaction cycle relating to ozone and other precursors, so NO2 had low values in summer. But O3 reached a maximum concentration (82.76 μg m−3) in the summer; the seasonal change of O3 displayed a unimodal pattern, with the peak month in August (86.53 μg m−3). That was due mainly to the high temperatures, intensive solar radiation, and a strong photochemical reaction in summer, which were conducive to the formation of O3 (Atkinson and Arey, 2003).
The concentrations of PM10 and PM2.5 were winter > spring > autumn > summer. The PM10 and PM2.5 concentrations showed the greatest values in winter and the lowest values in summer. That was due to the large amount of coal burned by household central heating in winter, the sharp increase in traffic volume during the spring festival travel period, poor weather conditions, and increased temperature inversions, which would accumulate particles and pollution events (Liu et al., 2015). However, the combustion source was less in the summer, the convective activity was vigorous, and the wet cleaning effect of precipitation was strong, which greatly reduced the concentration of the pollutants. PM2.5 and PM10 consistencies were also higher in spring, when it may have been affected by sandstorms and floating dusts (Wang et al., 2014).
We observed pronounced daily variations in SO2, NO2, CO, 8-hO3, PM2.5, and PM10 from 2015 to 2018, as shown in Figure 3. From 00:00 to 4:00, SO2 concentration decreased: there was an early peak at 11:00 (37.79 μg m−3), then the concentration fell to 16:00, after which it rose to a second peak at 22:00. NO2 concentration increased from 5:00, peaked at 11:00 (38.52 μg m−3), decreased to the lowest level (20.39 μg m−3) at approximately 15:00, and then rose to the highest level (42.07 μg m−3) at 21:00. The highest peak of CO appeared at 9:00, the lowest was at 16:00, and the second peak was at 21:00. The highest PM2.5 (48.61 μg m−3) and PM10 values (93.75 μg m−3) both appeared at 22:00, and the lowest PM2.5 and PM10 levels were 28.21 μg m−3 and 62.34 μg m−3, respectively, both at 16:00. In contrast to the daily variations of other air pollutants, the highest and lowest concentrations of O3 occurred at 16:00 and 8:00, respectively.
The SO2, CO, NO2, PM2.5, and PM10 concentrations had a bimodal pattern, with the first and second peaks appearing in the morning (9:00 to 11:00) and late at night (21:00 to 22:00), which corresponded with the variations in the PBLH. The early peak was due mainly to traffic emissions, enhanced human activity, and atmospheric stability (Chen et al., 2015; Supplementary Figure S1). Central heating of homes during the winter heating period may have led to high emissions of pollutants at night. The formation of the boundary layer was accompanied by an increase in WS and solar irradiation. The increase in PBLH, and a high WS, provided a greater volume and space for diluting pollutants, which reduced their concentrations from noon to afternoon. These phenomena were similar to those found by Zhou et al. (2018) and Guan et al. (2017). The highest concentration of O3 occurred in the afternoon, which was related to the photochemical reaction under strong solar radiation conditions. We attributed the evening daily peaks of SO2, NO2, CO, PM2.5, and PM10 mainly to depressed air in the boundary layer and the increased vehicle traffic from goods being transported from other cities.
To better comprehend the air pollutant concentration levels in Tianshui, we selected 168 key cities monitored by the Ministry of Environmental Protection of China (Figure 4). The annual average concentration of SO2 ranged from 6.45 μg m−3 (Fuzhou) to 83.44 μg m−3 (Jinzhong). Of the 168 cities, only three (Lvliang, Linfen, and Jinzhong) exceeded the SO2 Class II standard. The SO2 concentration in Tianshui was 23.81 μg m−3, which exceeded the SO2 Class I standard but was still in the range of middle and lower pollution classes. For NO2, approximately 40% of the cities exceeded the NO2 Class II standard: Haikou and Xian were the lowest (12.21 μg m−3) and the highest (58.90 μg m−3) respectively for annual mean concentrations. The NO2 concentration in Tianshui was 35.33 μg m−3, which was in the moderate pollution class. No city exceeded the CO Class I standard, and the annual mean concentration of CO (0.79 mg m−3) in Tianshui was in the mildest pollution class. For PM2.5 and PM10, approximately 91.07% and 81.55% of cities respectively exceeded the CAAQS Grade II standards. Shijiazhuang had the highest concentrations of PM2.5 and PM10 (85.85 μg m−3 for PM2.5 and 158.55 μg m−3 for PM10), which were twice as high as the CAAQS Grade I standards. The PM2.5 and PM10 concentrations in Tianshui were 40.12 μg m−3 and 85.97 μg m−3 respectively, which exceeded the Class I standard but were still in the middle and lower pollution classes. For O3, no city exceeded the Class II standard, whereas approximately 52.98% of cities exceeded the Class I standard. The average annual concentration of O3 (93.12 μg m−3) in Tianshui was in the moderate pollution class.
By comparing the 168 cities discussed above, we found that in 2017 the most contaminated cities were concentrated mainly in the Beijing–Tianjin–Hebei region and some cities of the provinces of Shandong, Shanxi, Henan, Shaanxi, Anhui, and Jiangsu. The pollution in those regions was derived mainly from industrial and domestic pollution sources and agricultural emissions (Wang et al., 2014), which was similar to the findings of Zhou et al. (2017). Nationwide, PM2.5 was the main contaminant that persisted in China, followed by PM10, O3, and NO2. NO2, PM2.5, and PM10 were the predominant contaminants in the north and the North China Plain, whereas O3 was the major pollutant in the eastern coastal regions. In terms of the comparison between Tianshui and the 168 cities mentioned above, PM2.5 and PM10 pollution was relatively serious, followed by NO2 and O3, whereas SO2 and CO were the lightest in Tianshui. Therefore, improving the air quality in Tianshui should be based on the control and treatment of the PM, and the traffic-source problem should be solved to reduce the NO2 pollutants. The emission of volatile organic compounds should be controlled by preferential control of nitrogen oxides to prevent the deterioration of the O3 pollution situation.
The environmental air quality and air pollutant concentration are affected and controlled by many factors in a region, whereas because the underlying surface of the urban environment changes little over a short period, the pollutant concentration is affected mainly by local emissions and meteorological conditions. Previous studies have pointed out that when the local emissions are relatively stable, the processes of dilution, diffusion, migration, and transformation of pollutants in the atmosphere depend mainly on the meteorological situation (Li et al., 2012). To further research the elements that affect air pollutants, we used a Pearson correlation analysis of meteorological factors (temperature, RH, WS, and wind direction) of air pollutants (Figures 5, 6; Supplementary Table S1). We removed the exceptional data values from the analysis. The variation in the mean daily temperature during the study was between −8.3 and 28.4°C; in the RH, 32% and 94%; and in the WS, 0.6 and 6 m/s. One of the dominant factors affecting the diffusion ability of the atmosphere is temperature, which can affect the transport and diffusion ability of the atmosphere vertically. With an increase in temperature, the vertical convection is intensified, and the vertical transport capacity of the atmosphere is enhanced. This accelerates the exchange movement of atmospheric particles between near the ground and upper altitudes.
We found a marked negative correlation between SO2, NO2, CO, PM2.5, and temperature (Supplementary Table S1), which indicates that the vertical transport capacity of the atmosphere was important in regulating their concentrations. Specifically, the concentrations of SO2, NO2, CO, and PM2.5 when the temperature was less than 8°C were obviously higher than when the temperature was over 8°C (Figure 5). There was a weak negative correlation between PM10 concentration and temperature, and the concentration of PM10 was higher than 200 μg m−3 when the temperature was 3–23°C and humidity was below 40%. This was due mainly to the rising temperature in spring and the dry climate, which enhanced evaporation. Because of this, coupled with the strong wind force, the loose surface layer of the soil was easily blown up, which increased the concentration of particles in the atmosphere (Guan et al., 2017).
For the secondary pollutant O3, there was a strong positive correlation between O3 and temperature. The concentration of O3 could reach over 140 μg m−3 when the temperature was over 20°C, which was due to the important role temperature played during O3 formation (Rasmussen et al., 2012; Pusede et al., 2015). Most pollutants had a weak negative correlation with RH in spring, summer, and autumn, except NO2 in summer and CO in all seasons. This shows that high RH restrains the spread of contaminants. However, the concentrations of CO, SO2, PM2.5, NO2, and PM10 positively correlated with RH in winter, and their mass concentrations generally increased with an RH increase when the temperature was below 0°C. Those mass concentrations reached the highest value when humidity was 80%–90%, which was probably associated with the surge of pollutant emissions in winter, the hygroscopic growth of particles, and the inhibition of the atmospheric boundary layer. A wetter atmosphere usually accompanied a lower boundary layer, which further increased the concentration of pollutants (Zhang et al., 2015). Also, the potential of air pollution by PM10 was the highest when the temperature was 3–23 °C and the RH was below 40%. This finding is similar to those of Csavina et al. (2014) and Tian et al. (2016). The concentrations of NO2, CO, SO2, PM2.5, and PM10 were negatively correlated with WS in each season, which showed that horizontal dispersion was important in regulating the consistency of those concentrations. However, we found a weak positive correlation between the PMs and WS during spring and summer, which reflects an important phenomenon that differentiates Tianshui from other cities. It may be related to the weather processes of sandstorms at high WSs in spring (Supplementary Table S2) and building dust or resuspension of road dust caused by relatively high WSs in summer (Supplementary Table S2). O3 positively correlated with WS in all seasons except spring; this is due mainly to the removal of PM and the increase of solar radiation by a high WS, which enhances the shape of O3 (Atkinson, 2000; Jacob and Winner, 2009; Ran et al., 2009).
Figure 6 shows the results of the polar plots of pollutant concentrations. It shows that the highest SO2, NO2, and CO concentrations resulted mostly from southwest wind, followed by northwest and northeast wind when the WS was less than 2 m s−1, and the high SO2, NO2, and CO consistencies were related to the east and northwest wind when the WS was over 3 m s−1. The easterly wind was related to the highest PM2.5 consistency when the WS was over 3 m s−1, and southwest, northwest, and northeast wind caused a higher PM2.5 consistency. Northwest wind caused a higher PM10 consistency, followed by northwest and northeast wind when the WSs were over 2 m s−1. However, the highest O3 concentrations were observed when winds were from the northwest clockwise to southeast when their WSs were between 0 and 6 m s−1. This result indicates that the pollutant concentration could have been influenced largely by local emissions and foreign transportation. On one hand, the concentration of pollutants was affected mainly by local emissions when the WS was less than 2 m s−1. This is related to the frequent human activities, traffic emissions (southwest Lianhuo Expressway), and more anthropogenic pollution sources in the local area. But the pollutant concentration was affected mainly by the external transportation in the east when the WS was over 3 m s−1: the east of the Tianshui area is adjacent to and downwind from Shaanxi Province and may have been affected by its industrial pollution. Air pollutants would be impacted by specific wind directions more than other wind directions for several reasons. On the one hand, in the upwind area in a specific direction, the discharge of pollutants was higher than that in other regions, which resulted in more pollutants migrating and being transported. On the other hand, the WS in a specific direction was less than that from other directions and was conducive to the accumulation of air pollutants. The WS in a specific direction was much larger than that from other directions and was likely to be related to long-range dust aerosol transportation.
We used the PSCF and CWT methods to understand the long-range transport that affected the levels of the primary polluting PM in Tianshui and to find potential source regions. Details of them were in the Supplementary Fd. S2.
The weighted potential source contribution function (WPSCF) results describe the spatial distributions of PM potential sources obtained by combining backward trajectories. The WPSCF results of four seasons of PM2.5 and PM10 are shown in Figures 7, 8. There, the colors represent the contribution levels of potential source areas: red is associated with high PM concentrations and blue with low concentrations. There is an obvious difference in the four seasons in the WPSCF map distributions. The highest PM2.5 WPSCF values were found in winter, with WPSCF values higher than 0.3 covering mainly the southeast of Gansu; northeast Sichuan; northeast and northwest of Qinghai; and the junction of Shaanxi, Henan, and Hubei, which suggests that the origin of PM2.5 was more regional owing to its long-distance migration (Wang et al., 2015). During winter heating, pollution emissions were high in those areas, which can be regarded as potential sources of PM2.5 pollution in winter.
The values of WPSCF were lower than 0.2 in spring and autumn, so their potential source areas made only a small contribution. Figure 8 shows PSCF maps of the potential sources of PM10. Comparing Figures 7, 8 shows that the distribution and morphology of the PM10 potential contribution sources were very similar to those of PM2.5, and the regions of the largest potential sources of PM10 were also discovered in winter. However, the area of the potential contribution source of PM10 increased in spring, and more potential sources with low contribution levels can be found dispersed in the southeast of Gansu, the Hexi Corridor, Southwest Inner Mongolia and its junction with Gansu, and the northeast and southeast of Ningxia. This may be related to the contribution of dust storms in those areas.
The PSCF method can show only the contribution rate of potential source regions, but not the specific contribution level of the target grid. We used the CWT analysis to calculate the mass concentration of pollutants in the potential source grid to quantitatively show the pollution degree of the potential source area. The weighted concentration weighted trajectory (WCWT) results describe the PM spatial distribution of potential pollution sources. In Figure 9, 10, the regions with red color correspond to the main contributing sources associated with the highest PM values. Figure 9 shows the WCWT results of the four seasons for PM2.5. It conveys a concrete message about the potential contribution of the source areas that may affect PM2.5. The WCWT result was similar to the PSCF values, and more potential sources regions with medium and low contribution levels can be uncovered. In winter, the junction of Shaanxi and Gansu, and the southeast of Gansu and the north Ningxia had the highest WCWT values (>60 μg m−3). This area had the largest PM2.5 contribution, which was related to the heating in winter and the emission intensity of air pollutants in that area. Also, due to the frequent activity of cold air in the northwest, there was a middle- and low-level potential source contribution zone from northwest to southeast, with WCWT values 20 μg m−3–60 μg m−3. In spring, the WCWT values (>32 μg m−3) covering the map were distributed mainly in the southeast on Gansu, the middle north on Shaanxi, and the north of Ningxia. In autumn, the medium WCWT values of the coverage map were distributed in some areas of northeast Gansu Province, which were the contribution sources related to the PM2.5 consistency of 36 μg m−3. In summer, the WCWT values (>21 μg m−3) were displayed mainly in the junction of Shaanxi and Gansu, the middle and south of Shaanxi, the northeastern Sichuan, and the northwest of Chongqin. This is related to the prevalence of southeast winds in summer.
Figure 10 shows the WCWT results of the four seasons for PM10. Comparing the results of Figures 9, 10 shows that the distribution and morphology of their relative contribution sources were very similar. The highest WCWT values of PM10 were found in winter (100 μg m−3 < WCWT <160 μg m−3), followed by spring (80 μg m−3 < WCWT <120 μg m−3) and autumn (80 μg m−3<WCWT<120 μg m−3), then summer (40 μg m−3<WCWT<80 μg m−3).
There were clear seasonal and spatial variations in the potential source areas in Tianshui. The land use in the study area was dominated by agricultural land. Industry, transportation, and other land uses were relatively less, so this land-use status had an important effect on PM concentration. Moreover, Tianshui was vulnerable to the effect of the northwest dust storms and surrounding pollution emission intensity of provinces and cities.
In this study, air pollution characteristics, the influence of local meteorological elements on pollutions concentration, and potential source regions of PM were investigated and studied.
SO2 and CO steadily presented a decreasing trend, yet NO2, O3, PM2.5, and PM10 displayed increasing trends. The concentration of pollutants in winter was substantially higher than in other seasons, whereas high O3 values appeared in summer. PM10 was also higher in spring due to the sandstorms. Compared with 168 cities studied by the Ministry of Environmental Protection, Tianshui had a low concentration of air pollutants (except O3 in the moderate pollution class). The influence of local meteorological factors on pollutants showed that low temperature and high humidity in winter came with hygroscopic growth of the PM, resulting in an increased concentration of pollutants. In spring, the rising temperature and dry climate could have increased the concentration of particles in the atmosphere. The stronger solar radiation at that time was associated with higher secondary pollutant O3 concentrations. The concentrations of NO2, CO, SO2, PM2.5, and PM10 were negatively correlated with WS in each season, whereas a weak positive correlation between PMs and WS was observed in spring. This may be related to the weather processes of sandstorms at high WSs. The results of the polar plots indicate that the concentration of pollutants was affected mainly by local emissions (especially the southwest Lianhuo Expressway) when the WS was less than 2 m s−1. The higher concentration may have been related to the external transport of pollutants in southern Shaanxi Province when the WS was over 3 m s−1.
We applied the PSCF and CWT methods to determine the PM2.5 and PM10 potential source areas. The results show that the potential source regions of PM10 were similar to those of PM2.5. The largest potential source regions of PMs were discovered in winter. The potential source area in Tianshui had a higher WPSCF value for PM2.5 than for PM10 in winter. This was related to the high emission of pollutants during the winter heating period, which contributed to high PM loadings in Tianshui. The potential source areas were in the southeast of Gansu; northeast Sichuan; the northeast and northwest of Qinghai; and the junction of Shaanxi, Henan, and Hubei. Those areas contributed PM2.5 concentrations from 60 to 100 μg m−3 and PM10 concentrations from 100 to 160 μg m−3. However, the potential contribution source area of PM10 increased in spring, and more potential sources with low contribution levels could be found scattered in the southeast of Gansu, the Hexi Corridor, Southwest Inner Mongolia and its junction with Gansu, and the northeast and southeast of Ningxia. This was related to the spring dust storms. The distribution of potential source areas of PM in Tianshui was related to its special geographical location; to the land use, with agricultural land as the main factor; and to the pollution emission intensity of surrounding provinces and cities. Therefore, more effective regional emission reduction measures in Tianshui’s surrounding provinces and cities should be designed to reduce the particulate emissions from regional sources in different seasons.
The datasets generated for this study are available on request to the corresponding author.
FaW: Conceptualization, Data curation, Software, Visualization, Writing ‐ original draft. ZL and FeW: Writing ‐ review and editing. XY: Conceptualization, Data curation, Software, Visualization, Writing ‐ review and editing. DX: Writing ‐ review and editing, Supervision. XinZ and XiZ: Visualization.
This work was supported by the Second Tibetan Plateau Scientific Expedition and Research (2019QZKK0201), the Strategic Priority Research Program of Chinese Academy of Sciences (Class A) (XDA20060201, XDA20020102), the National Natural Science Foundation of China (41761134093; 41471058; 41761017), the State Key Laboratory of Cryosphere Science founding (SKLCS‐ZZ-2020), and the National Science and Technology Basic Resources Survey Program of China (2019FY100202).
The authors declare that the research was conducted in the absence of any commercial or financial relationships that could be construed as a potential conflict of interest.
The author would like to thank the data provided by the Open Environment Data Center of Qingyue.
The Supplementary Material for this article can be found online at: https://www.frontiersin.org/articles/10.3389/feart.2021.527475/full#supplementary-material.
AEMB (2017). The Atmospheric Environment Meteorological Bulletin. Beijing, China: China Meteorological Administration (CMA)
Ashbaugh, L. L., Malm, W. C., and Sadeh, W. Z. (1985). A residence time probability analysis of sulfur concentrations at grand canyon national park. Atmos. Environ. 19 (8), 1263–1270. doi:10.1016/0004-6981(85)90256-2
Atkinson, R., and Arey, J. (2003). Atmospheric degradation of volatile organic compounds. Chem. Rev. 103 (12), 4605–4638. doi:10.1021/cr0206420
Atkinson, R. (2000). Atmospheric chemistry of VOCs and NOx. Atmos. Environ. 34 (12–14), 2063–2101. doi:10.1016/s1352-2310(99)00460-4
Chai, F., Gao, J., Chen, Z., Wang, S., Zhang, Y., Zhang, J., et al. (2014). Spatial and temporal variation of particulate matter and gaseous pollutants in 26 cities in China. J. Environ. Sci. (China). 26 (1), 75–82. doi:10.1016/S1001-0742(13)60383-6
Chen, P., Bi, X., Zhang, J., Wu, J., and Feng, Y., (2015). Assessment of heavy metal pollution characteristics and human health risk of exposure to ambient PM2.5 in Tianjin, China. Particuology 20, 104–109. doi:10.1016/j.partic.2014.04.020
Chow, J. C. (2006). Health effects of fine particulate air pollution: lines that connect. J. Air Waste Management Assoc. 56 (6), 707–708. doi:10.1080/10473289.2006.10464484
Chu, P. C., Chen, Y., Lu, S., Li, Z., and Lu, Y. (2008). Particulate air pollution in Lanzhou China. Environ. Int. 34 (5), 698–713. doi:10.1016/j.envint.2007.12.013
Csavina, J., Field, J., Félix, O., Corral-Avitia, A. Y., Sáez, A. E., and Betterton, E. A. (2014). Effect of wind speed and relative humidity on atmospheric dust concentrations in semi-arid climates. Sci. Total Environ. 487, 82–90. doi:10.1016/j.scitotenv.2014.03.138
Draxler, R. R., and Rolph, G. D. (2013). HYSPLIT (hybrid single-particle Lagrangian integrated trajectory) model access via NOAA ARL READY. Available at: http://www.arl.noaa.gov/HYSPLIT.php. Silver Spring, MD: NOAA Air Resources Laboratory
Forouzanfar, M. H., Afshin, A., Alexander, L. T., Anderson, H. R., Bhutta, Z. A., Biryukov, S., et al. (2016). Global, regional, and national comparative risk assessment of 79 behavioural, environmental and occupational, and metabolic risks or clusters of risks, 1990–2015: a systematic analysis for the global burden of disease Study 2015. Lancet 388 (10053), 1659–1724. doi:10.1016/S0140-6736(16)31679-8
Guan, Q., Cai, A., Wang, F., Yang, L., Xu, C., and Liu, Z. (2017). Spatio-temporal variability of particulate matter in the key part of Gansu Province, Western China. Environ. Pollut. 230, 189–198. doi:10.1016/j.envpol.2017.06.045
Hsu, Y. K., Holsen, T. M., and Hopke, P. K. (2003). Comparison of hybrid receptor models to locate PCB sources in Chicago. Atmos. Environ. 37 (4), 545–562. doi:10.1016/s1352-2310(02)00886-5
Hu, J., Wang, Y., Ying, Q., and Zhang, H. (2014). Spatial and temporal variability of PM2.5 and PM10 over the north China plain and the Yangtze River Delta, China. Atmos. Environ. 95, 598–609. doi:10.1016/j.atmosenv.2014.07.019
IPCC (2007). Climate change: the physical science basis. Contribution of working group I to the fourth assessment report of the intergovernmental panel on climate change. Master’s thesis. Cambridge: University Press
Jacob, D. J., and Winner, D. A. (2009). Effect of climate change on air quality. Atmos. Environ. 43 (1), 51–63. doi:10.1016/j.atmosenv.2008.09.051
Kan, H., London, S. J., Chen, G., Chen, G., Zhang, Y., Song, G., et al. (2007). Differentiating the effects of fine and coarse particles on daily mortality in Shanghai, China. Environ. Int. 33 (3), 376–384. doi:10.1016/j.envint.2006.12.001
Lai, S., Zhao, Y., Ding, A., Zhang, Y., Song, T., Zheng, J., et al. (2016). Characterization of PM2.5 and the major chemical components during a 1-year campaign in rural Guangzhou, Southern China. Atmos. Res. 167, 208–215. doi:10.1016/j.atmosres.2015.08.007
Landrigan, P. J. (2016). Air pollution and health. Lancet Public Health 2 (1), e4–e5. doi:10.1016/S2468-2667(16)30023-8
Li, X. F., Zhang, M. J., Wang, S. J., Zhao, A. F., and Ma, Q. (2012). Variation characteristics and influencing factors of air pollution index in China. Environ. Sci. 33 (6), 1936–1943.
Liao, T., Wang, S., Ai, J., Gui, K., Duan, B., Zhao, Q., et al. (2017). Heavy pollution episodes, transport pathways and potential sources of PM2.5, during the winter of 2013 in Chengdu (China). Sci. Total Environ. 584–585, 1056–1065. doi:10.1016/j.scitotenv.2017.01.160
Lim, S. S., Vos, T., Flaxman, A. D., Danaei, G., Shibuya, K., Adair-Rohani, H., et al. (2013). A comparative risk assessment of burden of disease and injury attributable to 67 risk factors and risk factor clusters in 21 regions, 1990–2010: a systematic analysis for the global burden of disease study 2010. Lancet 380 (9859), 2224–2260. doi:10.1016/S0140-6736(12)61766-8
Liu, Z., Hu, B., Wang, L., Wu, F., Gao, W., and Wang, Y. (2015). Seasonal and diurnal variation in particulate matter (PM10 and PM2.5) at an urban site of Beijing: analyses from a 9-year study. Environ. Sci. Pollut. Res. Int. 22 (1), 627–642. doi:10.1007/s11356-014-3347-0
Ma, X. Y., and Jia, H. L. (2016). Particulate matter and gaseous pollutions in three megacities over China: situation and implication. Atmos. Environ. 140, 476–494. doi:10.1016/j.atmosenv.2016.06.008
Mao, M., Zhang, X., and Yin, Y. (2018). Particulate matter and gaseous pollutions in three metropolises along the Chinese Yangtze River: situation and implications. Int. J. Environ. Res. Public Health. 15 (6). doi:10.3390/ijerph15061102
Marcazzan, G. M., Vaccaro, S., Valli, G., and Vecchi, R. (2001). Characterisation of PM10 and PM2.5 particulate matter in the ambient air of Milan (Italy). Atmos. Environ. 35 (27), 4639–4650. doi:10.1016/s1352-2310(01)00124-8
MEP (2013). Ministry of environmental protection of the people’s Republic of China. National standards on environmental protection: technical specifications for installation and acceptance of ambient air quality continuous automated monitoring system for PM10 and PM2.5 (HJ655-2013). China, Beijing: Ministry of Environmental Protection.
Pusede, S. E., Steiner, A. L., and Cohen, R. C. (2015). Temperature and recent trends in the chemistry of continental surface ozone. Chem. Rev. 115 (10), 3898. doi:10.1021/cr5006815
Ran, L., Zhao, C., Geng, F., Tie, X., Tang, X., Peng, L., et al. (2009). Ozone photochemical production in urban Shanghai, China: analysis based on ground level observations. J. Geophys. Res. 114 (D15), D15301. doi:10.1029/2008jd010752
Rasmussen, D. J., Fiore, A. M., Naik, V., Horowitz, L. W., McGinnis, S. J., and Schultz, M. G. (2012). Surface ozone-temperature relationships in the eastern US: a monthly climatology for evaluating chemistry-climate models. Atmos. Environ. 47, 142–153. doi:10.1016/j.atmosenv.2011.11.021
Streets, D. G., Fu, J. S., Jang, C. J., Hao, J., He, K., Tang, X., et al. (2007). Air quality during the 2008 beijing olympic games. Atmos. Environ. 41 (3), 480–492. doi:10.1016/j.atmosenv.2006.08.046
Ta, W., Wang, T., Xiao, H., Zhu, X., and Xiao, Z. (2004). Gaseous and particulate air pollution in the Lanzhou Valley, China. Sci. Total Environ. 320 (2–3), 163–176. doi:10.1016/j.scitotenv.2003.08.026
Tan, J., Duan, J., Zhen, N., He, K., and Hao, J. (2015). Chemical characteristics and source of size-fractionated atmospheric particle in haze episode in Beijing. Atmos. Res. 167, 24–33. doi:10.1016/j.atmosres.2015.06.015
Tian, Y. Z., Shi, G. L., Huang-Fu, Y. Q., Song, D. L., Liu, J. Y., Zhou, L. D., et al. (2016). Seasonal and regional variations of source contributions for PM10 and PM2.5 in urban environment. Sci. Total Environ. 557–558, 697–704. doi:10.1016/j.scitotenv.2016.03.107
Wang, F. L., Li, Z. Q., You, X. N., Feng, L., Xi, Z., Jilong, T., et al. (2018). Variation characteristics and source analysis of atmospheric pollutants in Tianshui from 2015 to 2017. Acta. Scientiae Circumstantiae 38 (12), 4592–4604. (In Chinese)
Wang, H., An, J., Cheng, M., Shen, L., Zhu, B., Li, Y., et al. (2016). One year online measurements of water-soluble ions at the industrially polluted town of Nanjing, China: sources, seasonal and diurnal variations. Chemosphere 148, 526–536. doi:10.1016/j.chemosphere.2016.01.066
Wang, L., Liu, Z., Sun, Y., Ji, D., and Wang, Y. (2015). Long-range transport and regional sources of PM2.5 in Beijing based on long-term observations from 2005 to 2010. Atmos. Res. 157, 37–48. doi:10.1016/j.atmosres.2014.12.003
Wang, L. T., Wei, Z., Yang, J., Zhang, Y., Zhang, F. F., Su, J., et al. (2014a). The 2013 severe haze over southern Hebei, China: model evaluation, source apportionment, and policy implications. Atmos. Chem. Phys. 14 (6), 3151–3173. doi:10.5194/acp-14-3151-2014
Wang, Y. Q. (2019). An open source software suite for multi-dimensional meteorological data computation and visualisation. J. Open Res. Softw. 7 (1), 21. doi:10.5334/jors.267
Wang, Y. Q. (2014). MeteoInfo: GIS software for meteorological data visualization and analysis[J]. Meteorol. Appl. 21 (2). doi:10.1002/met.1345
Wang, Y. Q., Zhang, X. Y., Arimoto, R., Cao, J. J., and Shen, Z. X. (2004). The transport pathways and sources of PM10 pollution in Beijing during spring 2001, 2002 and 2003. Geophys. Res. Lett. 31 (14), L14110. doi:10.1029/2004gl019732
Wang, Y., Ying, Q., Hu, J., and Zhang, H. (2014b). Spatial and temporal variations of six criteria air pollutants in 31 provincial capital cities in China during 2013–2014. Environ. Int. 73 (1), 413–422. doi:10.1016/j.envint.2014.08.016
WHO (2016). Public health, environmental and social determinants of health (PHE). Available at: http://www.who.int/phe/health_topics/outdoorair/databases/en/.
Xie, S., Qi, Y. Z. L., and Tang, X. (2005). Characteristics of air pollution in Beijing during sand-dust storm periods. Water Air Soil Pollut. Focus. 5 (3–6):217–229. doi:10.1007/s11267-005-0737-9
Xie, Y., Zhao, B., Zhang, L., and Luo, R. (2015). Spatiotemporal variations of PM2.5 and PM10 concentrations between 31 Chinese cities and their relationships with SO2, NO2, CO, and O3. Particuology. 20, 141–149. doi:10.1016/j.partic.2015.01.003
Yin, D. Y., Zhao, S. P., and Qu, J. J. (2016). Spatial and seasonal variations of gaseous and particulate matter pollutants in 31 provincial capital cities, China. Air Qual. Atmos. Health 10 (3), 359–370. doi:10.1007/s11869-016-0432-1
Yin, X. F., Foy, B. D., Wu, K. P., Feng, C., Kang, S., and Zhang, Q. (2019). Gaseous and particulate pollutants in Lhasa, Tibet during 2013–2017: spatial variability, temporal variations and implications. Environ. Pollut. 253, 68–77. doi:10.1016/j.envpol.2019.06.113
Zhang, H. F., Wang, Z. H., and Zhang, W. T. (2016). Exploring spatiotemporal patterns of PM2.5 in China based on ground-level observations for 190 cities. Environ. Pollut. 216, 559–567. doi:10.1016/j.envpol.2016.06.009
Zhang, H. L., Wang, Y. G., Hu, J. L., Ying, Q., and Hu, X. M. (2015). Relationships between meteorological parameters and criteria air pollutants in three megacities in China. Environ. Res. 140, 242–254. doi:10.1016/j.envres.2015.04.004
Zhang, Q., and Crooks, R. (2014). Toward an environmentally sustainable future: country environmental analysis of the people's Republic of China. Adb Reports. http://www.adb.org/sites/default/files/pub/2012/toward-environmentally-sustainable-future-prc.pdf.
Zhang, Y. H., Hu, M., Zhong, L. J., Wiedensohler, A., Liu, S. C., Andreae, M. O., et al. (2008). Regional integrated experiments on air quality over Pearl River Delta 2004 (PRIDE-PRD2004): overview. Atmos. Environ., 42(25):6157–6173. doi:10.1016/j.atmosenv.2008.03.025
Zhao, S. P., Yu, Y., Yin, D. Y., and He, J. (2015). Meteorological dependence of particle number concentrations in an urban area of complex terrain, Northwestern China. Atmos. Res. 164–165, 304–317. doi:10.1016/j.atmosres.2015.06.001
Zhao, S., Yu, Y., Yin, D., He, J., Liu, N., Qu, J., et al. (2016). Annual and diurnal variations of gaseous and particulate pollutants in 31 provincial capital cities based on in situ air quality monitoring data from China National Environmental Monitoring Center. Environ. Int. 86, 92–106. doi:10.1016/j.envint.2015.11.003
Zhao, S., Yu, Y., Yin, D., Qin, D., He, J., and Dong, L. (2018). Spatial patterns and temporal variations of six criteria air pollutants during 2015 to 2017 in the city clusters of Sichuan Basin, China. Sci. Total Environ. 624, 540–557. doi:10.1016/j.scitotenv.2017.12.172
Zhou, T. C., Sun, J., and Yu, H. (2017). Temporal and spatial patterns of China’s main air pollutants: years 2014 and 2015. The Atmosphere 8 (8), 137. doi:10.3390/atmos8080137
Keywords: air pollutions, meteorological condition, potential source, HYSPLIT model, Tianshui
Citation: Wang F, Li Z, Wang F, You X, Xia D, Zhang X and Zhou X (2021) Air Pollution in a Low-Industry City in China’s Silk Road Economic Belt: Characteristics and Potential Sources. Front. Earth Sci. 9:527475. doi: 10.3389/feart.2021.527475
Received: 19 January 2020; Accepted: 07 January 2021;
Published: 03 March 2021.
Edited by:
Yang Liu, Emory University, United StatesCopyright © 2021 Wang, Li, Wang, You, Xia, Zhang and Zhou. This is an open-access article distributed under the terms of the Creative Commons Attribution License (CC BY). The use, distribution or reproduction in other forums is permitted, provided the original author(s) and the copyright owner(s) are credited and that the original publication in this journal is cited, in accordance with accepted academic practice. No use, distribution or reproduction is permitted which does not comply with these terms.
*Correspondence: Xiaoni You, MTc2NjM5NjQ4QHFxLmNvbQ==
Disclaimer: All claims expressed in this article are solely those of the authors and do not necessarily represent those of their affiliated organizations, or those of the publisher, the editors and the reviewers. Any product that may be evaluated in this article or claim that may be made by its manufacturer is not guaranteed or endorsed by the publisher.
Research integrity at Frontiers
Learn more about the work of our research integrity team to safeguard the quality of each article we publish.