- 1State Key Laboratory of Cryospheric Sciences, Northwest Institute of Eco-Environment and Resources, Chinese Academy of Sciences, Lanzhou, China
- 2College of Resources and Environmental Engineering, Tianshui Normal University, Tianshui, China
- 3School of History Culture and Tourism, Longnan Teachers College, Longnan, China
- 4College of Earth and Environment Sciences, Lanzhou University, Lanzhou, China
Light-absorbing impurities (LAIs) in surface snow and snow pits together with LAIs’ concentrations and their impacts on albedo reduction and sequent radiative forcing (RF) have been investigated in the past. Here, we focused on temporal–spatial distributions of LAIs, especially on the albedo reduction and radiative forcing caused by the LAIs in Urumqi Glacier No.1. Various snow samples, including fresh snow, aged snow, and granular ice were collected between 3,770 and 4,105 m a.s.l of Urumqi Glacier No.1 during the snowmelt season of 2015. For the surface snow samples, BC and OC concentrations were 582 and 1,590 ng g−1, respectively. Mineral dust (MD) concentrations were 110 μg g−1. Due to the different ablation status of the glacier surface, LAIs accumulate at the lower altitude of the glacier. The estimation by the Snow, Ice, and Aerosol Radiative (SNICAR) model indicated that BC and MD could reduce the albedo by 12.8 and 10.3% in fresh snow, aged snow by 23.3 and 5.9%, and granular ice by 22.4 and 26.7%, respectively. The RF of MD was higher than that of BC in fresh snow and granular ice, whereas the RF of BC exceeded MD in aged snow. These findings suggested that BC was the main forcing factor in snow melting and dust was the main forcing factor in accelerating glacier melt.
Introduction
Light-absorbing impurities (LAIs) play a vital role in melting snow and glaciers in High Asia (Ming et al., 2012; Qian et al., 2015) and across the globe (Warren and Wiscombe, 1980; Hansen and Nazarenko, 2004; Flanner et al., 2007; Painter et al., 2013). LAIs include black carbon (BC), organic carbon (OC; in this study, only water-insoluble OC is considered), and mineral dust (MD). As for BC, it is derived from the incomplete combustion of fossil fuels and biomass (natural and anthropogenic). BC can influence global warming and change cloud formation processes in the atmosphere (Jacobson, 2001; Ramanathan et al., 2007; Gertler et al., 2016), which is a significant agent of climate warming (Ramanathan and Carmichael, 2008; Bond et al., 2013). LAIs deposited on glacier surface via precipitation and dry deposition may accelerate glacier melting by absorbing solar radiation (Bond et al., 2013; Gabbi et al., 2015). Therefore, it is critical to assess their contributions to glacier melting and get a picture of glacier runoff and water resources in glacierized catchments.
Glacier and snow cover are important water resources on the earth. There are nearly 8,000 glaciers in Tien Shan, which are the life-depending water sources maintaining both human living and the ecosystem. However, a large number of glaciers in Tien Shan are influenced by human activities (Schmale et al., 2017). Prior studies have reported LAIs record in surface snow, ice cores, and snow pits of glaciers, including the Tibetan Plateau and Tien Shan (Ming et al., 2013a; Zhao et al., 2013; Qu et al., 2014; Yang et al., 2015; Ming et al., 2016; Schmale et al., 2017). However, in situ data of LAIs on glacier surface during the melt season in Tien Shan are still scarce, which is important for understanding the temporal variability and spatial distribution of LAIs of glacier surface and essential for evaluating the contribution of LAIs to glacier melting. Furthermore, studies paid little attention to quantify the LAIs’ effect on albedo reduction in different melting conditions (fresh snow, aged snow, and granular ice) in Tien Shan.
Much work so far has focused on variability of LAIs’ concentrations and the effect of LAIs on snow albedo (Ming et al., 2013b; Yasunari et al., 2013; Kaspari et al., 2014; Qu et al., 2014; Zhao et al., 2014; Li et al., 2017; Niu et al., 2017; Wang et al., 2017). Flanner et al. (2007) used the Snow, Ice, and Aerosol Radiative (SNICAR) model and suggested that BC could cause the RF more than 20 W m−2 on TP in spring. Using the same model, it was found that BC could cause an average RF of 6 W m−2 in High Asia glaciers (Ming et al., 2013b). Ming et al. (2009), suggesting that black carbon deposited on the surface may accelerate the melting of these glaciers by analyzing BC concentrations from seven glaciers in west China. Qu et al. (2014) studied the spatial distribution of BC and MD on Zhadang Glacier and estimated the RF caused by BC and MD. Xu et al. (2012) analyzed snow samples in Tien Shan and indicated that BC could influence glacier melting when BC concentrations were as much as 400 ng g−1 in the summer. Ming et al. (2016) indicated that snow aging, BC, and dust could reduce albedo by 44, 25, and 7%, respectively, in the accumulation zone of Urumqi Glacier No.1. These recent results suggest that LAIs have great variations in quantity and are critical for albedo reduction and glacier melting, and further studies need to reveal the spatial–temporal variability and spatial distribution of LAIs on the glacier surface and quantify the contribution of LAIs to albedo reduction and glacier melting. He et al. (2018) updated the SNICAR model and quantified the effects of snow grain shape and BC–snow mixing state on BC–snow albedo effects over the TP, which advanced the understanding of BC effects on snow albedo reduction and associated uncertainties in the TP. In addition, many recent studies have shown that snow grain shapes and BC–/dust–snow mixing states have important effects on snow albedo and radiative effects (Flanner et al., 2012; He et al., 2014; Dang et al., 2016; He et al., 2019), and this may lead to a large change in the value of the estimates of the albedo reduction caused by LAI.
Here, snow and ice samples were collected from the ablation and accumulation zones of Urumqi Glacier No.1. Meanwhile, the physical characteristics were also in situ observed, such as spectral albedo and snow density. The objectives of this study were 1) to depict the spatial–temporal variation of BC and other LAIs’ concentrations in the snow and ice of Urumqi Glacier No.1, 2) to investigate the changes of the OC/BC ratios, and 3) to simulate snow albedo reduction and RF caused by measured BC and MD, using the SNICAR model.
Experiment and Methods
Site Description
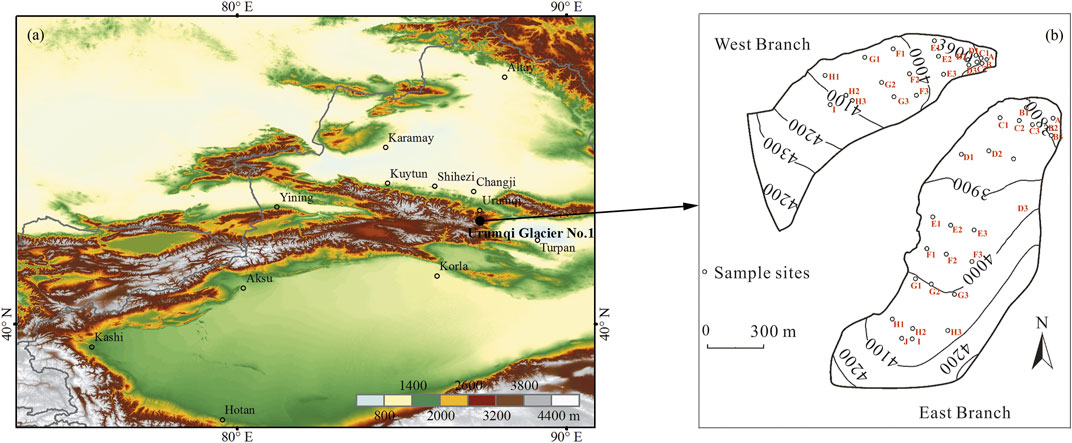
Urumqi Glacier No.1 (43°08′N, 86°82′E) is located in the headwaters of the Urumqi River in Tien Shan (Figure 1). Urumqi Glacier No.1 is the best monitored glacier with the longest data series in China and one of the reference glaciers in the World Glacier Monitoring Service (WGMS). Urumqi Glacier No.1 represents a large number of glaciers in northwest China (Che et al., 2019). This glacier is a northwest-facing valley glacier and has an elevation ranging from 3,743 to 4,484 m a.s.l. Urumqi Glacier No.1 consists of the east branch (1.086 km2) and the west branch (0.591 km2), and the total area is 1.667 km2.
The total annual precipitation was 549 mm, and the daily mean air temperature was −3.6°C in 2015. During the ablation period (May–September), the daily average temperature was 3.6°C. The precipitation was 454 mm, which accounts for 83% of the yearly total (Figure 2). For the past decades, the air temperature caused the glacier ablation to exceed accumulation. Urumqi Glacier No.1 was melting rapidly and separated into two branches in 1993 (Xu et al., 2011). Equivalent black carbon (EBC) was measured with a seven-wavelength Aethalometer (AE-31) at the Tian Shan Glaciological Station (43°12′N, 87°07′E, 2,100 m) located at the northeast of Urumqi Glacier No.1, approximately 30 km from Urumqi Glacier No.1. Daily mean EBC was in the range of 287–2080 ng/m3 with a mean of 1,011 ng/m3 during the study period.
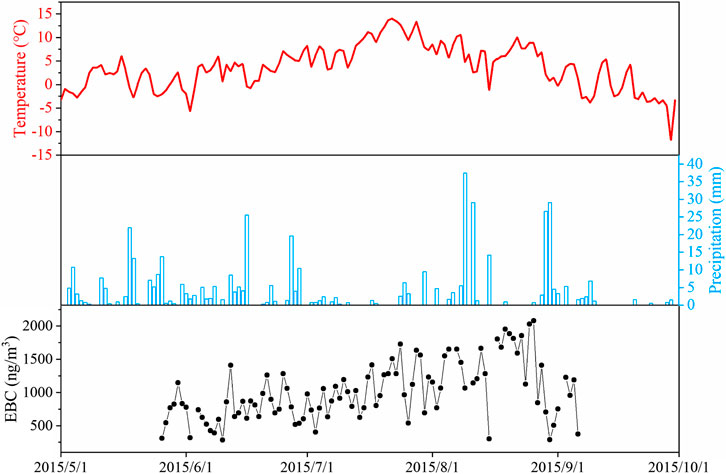
FIGURE 2. Time series of daily-averaged temperature, precipitation, and equivalent black carbon (EBC) concentrations. EBC data came from the Tian Shan Glacier Station (43°12′N, 87°07′E, 2,100 m), about 30 km northeast of Urumqi Glacier No.1.
Sampling and Field Observations
A total of 96 surface samples were collected from Urumqi Glacier No.1 cover 9 days during the ablation period (May–September) in 2015. Sample collections and spectral albedo measurements were carried out at 23 sites on the east branch and 22 sites on the west branch (Figure 1). The snow line was approximately 4,050 m on the east branch during the study period. Whirl-Pak™ bags were used to collect 5 cm surface snow and ice samples on the surface of the glacier in a 50 cm × 50 cm square. All the samples were kept frozen and transported to the State Key Laboratory of Cryospheric Science (SKLCS) of Northwest Institute of Eco-Environment and Resources in Lanzhou. Furthermore, to simulate the radiative effect of LAIs with the SNICAR model, the physical characteristics of the snow were also observed. It should be noted that it was hard to distinguish the grain size for snow and ice by lens-based methods, so we assumed 50 μm for fresh snow (Nolin and Dozier, 2000) and 200–800 μm for aged snow and granular ice in central estimates (Schmale et al., 2017).
A spectroradiometer (Model ASD® Handheld 2) was used for spectral albedo observation of the glacier, which covers a radiative wavelength of 325–1,075 nm with a 1 nm spectral resolution. The accuracy of this spectroradiometer was ±1 nm. The spectroradiometer was held at the height of approximately 50 cm above the surface of the glacier to measure spectral reflectance. We used a whiteboard for whiteboard reflection correction and to calibrate every 10 min to prevent the sensor from responding to the drift of the system and the influence of changes in the sun’s incident angle. We calculated the broadband albedo of the snow ice surface by dividing the sum of the reflected irradiances of all spectral wavelengths as follows:
where α denotes the broadband albedo, λ denotes the wavelength, and i denotes the reference incoming solar irradiance. A more detailed description of albedo could be seen in former work (Ming et al., 2013a; Ming et al., 2015). The incoming shortwave radiation was measured from the radiometer (Kipp & Zonen NR LITE; spectral range, 305–2,800 nm) with 10 µV/Wm−2 sensitivity, which was mounted on the automatic weather station (AWS) at 3,782 m.
Sample Analysis
In the laboratory, snow and ice samples were placed at room temperature and melted in a clean room. When the samples were completely melted, we used the quartz fiber filters (0.45 μm pore size, 47 mm in diameter, Whatman) to filter the samples. A vacuum pump was used to accelerate melting, and the Whirl-Pak bag and filter devices were flushed to allow full filtration (Xu et al., 2006; Wang et al., 2012). We dried the filter in a desiccator at 550°C for 6 h and washed the filter and samples twice with ultrapure water during the filtration process to remove the possible carbonaceous matters. The MD was weighed by using a microbalance (Liang You FA2104, accuracy: 0.1 mg). We calculated the difference between the weight before filtering and the weight after filtering. The sample deposited on each filter covered an area of approximately 12.56, and 0.5 cm2 punches of the filter were used for BC and OC analysis. We used the thermal/optical reflectance carbon analyzer (Desert Research Institute Model 2001) to measure BC and OC at the Institute of Arid Meteorology in Lanzhou. This analyzer followed the Interagency Monitoring of Protected Visual Environments (IMPROVE) protocol and used the thermal/optical reflectance (TOR) method (Chow et al., 2004). The OC was gradually heated in a nonoxidizing atmosphere at 120, 250, 450, and 550°C, and BC was heated in an oxidizing atmosphere of 98% He and 2% oxygen at 550, 700, and 800°C. The uncertainty of analysis was approximately 15% for BC and 16% for OC (Xu et al., 2009).
SNICAR Model and Radiative Forcing
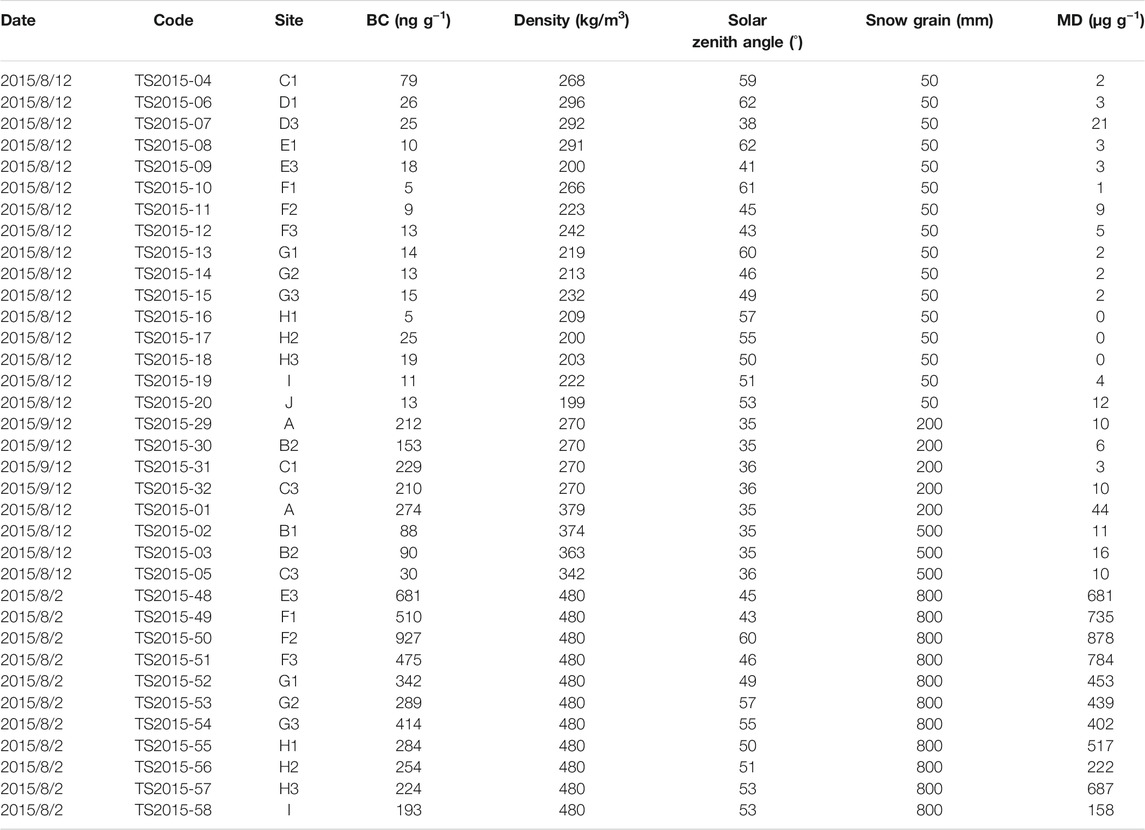
We evaluated BC and MD in the snow of glaciers using the Snow, Ice, and Aerosol Radiative (SNICAR) model (Flanner et al., 2007; Zhao et al., 2014; Wang et al., 2017), which can simulate the change of snow albedo for a given BC and MD concentration. Details concerning the simulations of albedo have been introduced in the previous work (Yasunari et al., 2010; Ming et al., 2013a). Snowpack depth was considered as 0.05 m. The solar zenith angle was calculated according to the local sampling time and geographic locations. The albedo of the underlying ground was taken as 0.2–0.6 in the visible band and 0.1–0.4 in the near-infrared band in situ. The mass absorption cross section (MAC) of BC was set as 11.3 (Ming et al., 2016), the median of typical MAC values (Hadley and Kirchstetter, 2012). The modeling results cover the spectral albedo from 350 to 2,500 nm. Here, we are only concerned with the range of 325–1,075 nm. Snow densities and snow grain size were taken as measured. Clear sky and direct radiation were chosen for the very low cloud amount (∼1).
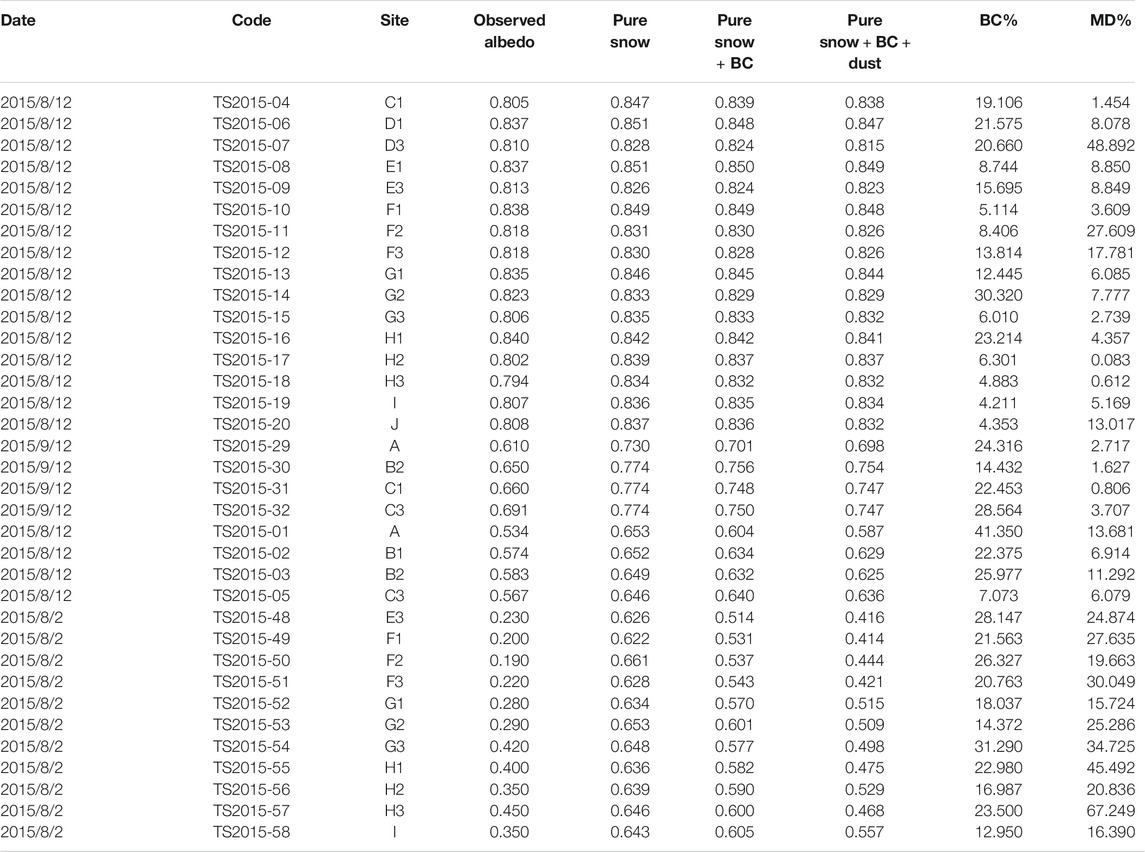
To research the RF and the role in climate change of LAIs, the SNICAR model was used to simulate the varying of snow albedo induced by BC and MD. It should be noted that the SNICAR model could not simulate the effect of OC in snow because the optical properties of OC cannot be reliably estimated (Flanner et al., 2007). The detailed input parameter of the SNICAR model is listed in Table 1.
The sensitive analysis was as follows: 1) The concentrations of BC and MD in the model were set to 0, to simulate albedo of snow and ice without the effect of BC and MD; 2) BC data were input into the model, and the MD concentrations were set to 0 to simulate the effect of BC on snow and ice albedo; and 3) BC and MD data were input into the model to simulate the effect of BC and dust on albedo. The contribution of BC and MD to the reduction of albedo was calculated by a series of sensitivity analyses.
Based on the albedo simulations, RF was defined using the following equation:
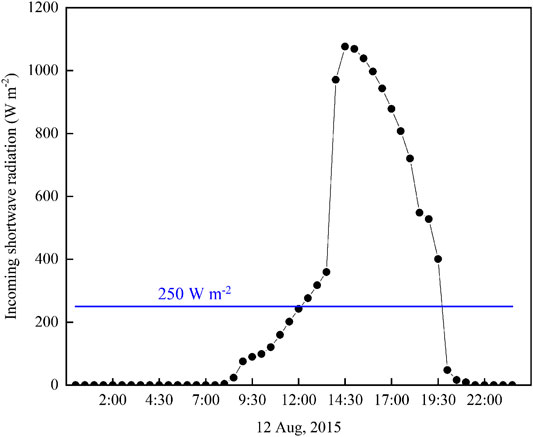
where Rin-short denoted the incident solar radiation observed by using the radiometer and Δα denoted the reduction of albedo. For example, the highest incoming shortwave radiation was observed at the noon on 12th August, and the average incoming shortwave radiation was 250 W m−2 (Figure 3).
Results
Temporal Variability of LAIs
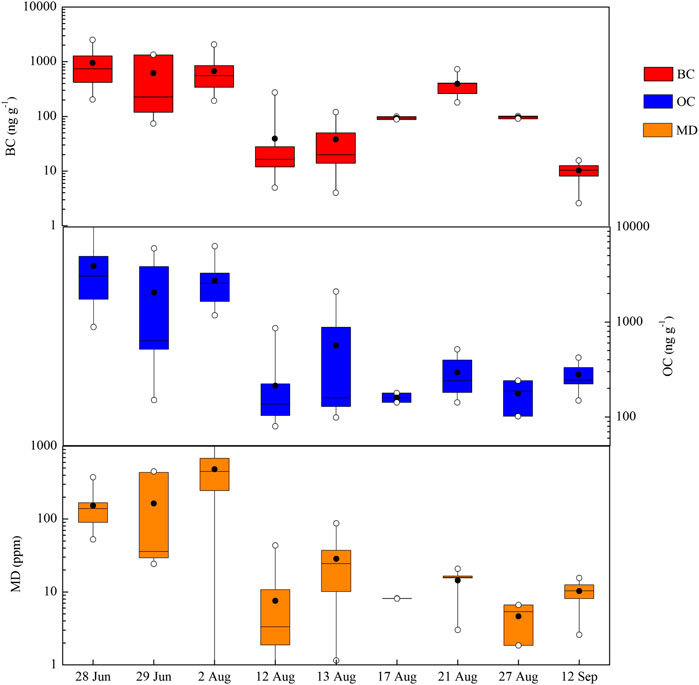
As can be seen from Figure 4, LAIs’ concentrations of surface snow had obvious changes with time. BC concentrations were in the range of 32–2,258 ng g−1 with an average of 582 ng g−1, while OC concentrations were in the range of 102–5,712 ng g−1 with an average of 1,590 ng g−1. For MD, concentrations were in the range of 2–484 μg g−1 with an average of 110 μg g−1. The highest BC concentrations were associated with the areas of strong glacier melt.
On 28 June, BC concentrations were 2,258 ± 2,887 ng g−1 and OC concentrations were 5,712 ± 4,820 ng g−1 on the east branch. These relatively high values could be associated with the pollutants from cities and deserts and the glacier surface melting conditions of the glacier (Dong et al., 2016). BC and OC concentrations on the east branch were larger than those on the west branch due to the lower elevation. However, the west branch of Urumqi Glacier No.1 is enriched with more dust at 3,900 m due to the local dust. In July, the pollution from the atmosphere was getting worse and LAIs could deposit on the glacier surface. The glacier surface was covered with aged snow and granular ice. The scarce precipitation and higher temperature have further enriched the LAIs in the surface snow (Figure 2). On 2 August, the glacier surface was dominated by granular ice, and LAIs were easily removed by melt water. On 12 August, the glacier surface was buried by fresh snow, and the mean BC concentrations were 39 ± 61 ng g−1 and then increased to 94 ± 9 ng g−1 after 5 days of melting. Snow fell again on 27 August, and BC concentrations were 97 ng g−1. In September, snowmelt weakened, and LAIs stayed at a low level. Even though no more data were taken afterward, combined with the prior results, we could infer that LAIs were still present at a low level due to a lower temperature and fewer emissions until the next melt period in 2016 (Xu et al., 2012). Therefore, the temporal variability of LAIs in surface snow was mainly dependent on the melting state of the glacier surface.
The highest OC/BC ratio was 8.77 on the east branch and 19.99 on the west branch in mid-August. Higher OC/BC ratio indicated that local emissions were mainly caused by biomass combustion, not fossil fuel combustion. By the end of August, the OC/BC ratio gradually decreased, which suggested OC accounted for a large proportion of fresh snow, but with the process of snow melting, OC was easier to be removed than BC by meltwater (Xu et al., 2012; Yang et al., 2015). OC/BC ratios held steady at about 1.69 during the first half of September, which suggested that the scavenging efficiency of BC and OC both remained stable.
Spatial Variability of LAIs
Figure 5 shows the correlations between LAIs and the sampling elevations on the east branch of Urumqi Glacier No.1. Note that LAIs and the sampling elevations have a poor correlation on the west branch during June 29 and August 13 due to the special terrain of Urumqi Glacier No.1. On June 28, LAIs enriched at the elevations of 3,800 m–3,850 m causing a negative correlation between the MD and elevations (r = −0.64, p < 0.05). On August 2, enriched LAIs were found towards the terminal of the glacier, and the glacier surface was mainly granular ice. Since more intense melting was likely to occur at lower elevations, there is a strong negative correlation between the BC and OC concentration and the sampling elevations. On August 12, the glacier surface was mainly fresh snow. LAIs decreased with the increasing elevation, with a significant negative correlation. On September 12, the glacier melting slowed down, and LAIs began to accumulate on the glacier surface. The BC and OC concentrations were still negatively correlated with elevations. The correlation between MD and elevations was poor during autumn, which was different from that on August 12. This is due to the weakening of melting in autumn, while MD was gradually decreased.
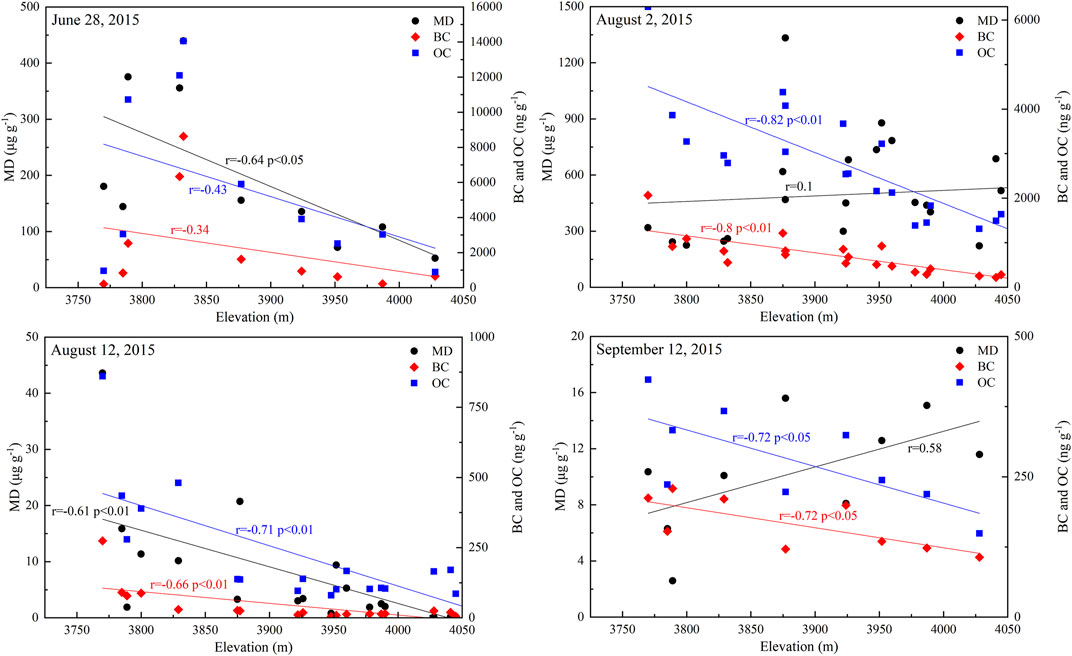
FIGURE 5. Correlations between LAIs and the sampling elevations on the east branch of Urumqi Glacier No.1. Note that the scales were different for different sampling dates.
To investigate the distribution of LAIs on glacier specifically, we used sites of stakes for measuring mass balance as sample points, and LAIs’ concentrations were analyzed over the glacier area of east branch on Glacier No.1 by using spline interpolation method. BC concentrations varied significantly with elevations, and the maximum concentrations depended on the glacier front (Figure 6). On 2 August, a large number of LAIs were exposed on the surface of the glacier in low-altitude areas, and the LAIs’ concentration was higher. OC and BC were removed by melt water in the main stream line of glacier, which might restrict the effect of LAIs on the melting of the glacier, although a darkening on glacier terminus was observed. On 12 August, the glacier was covered by fresh snow and BC concentrations were the lowest (39 ± 61 ng g−1), which could be considered as typical BC concentrations for fresh snow.
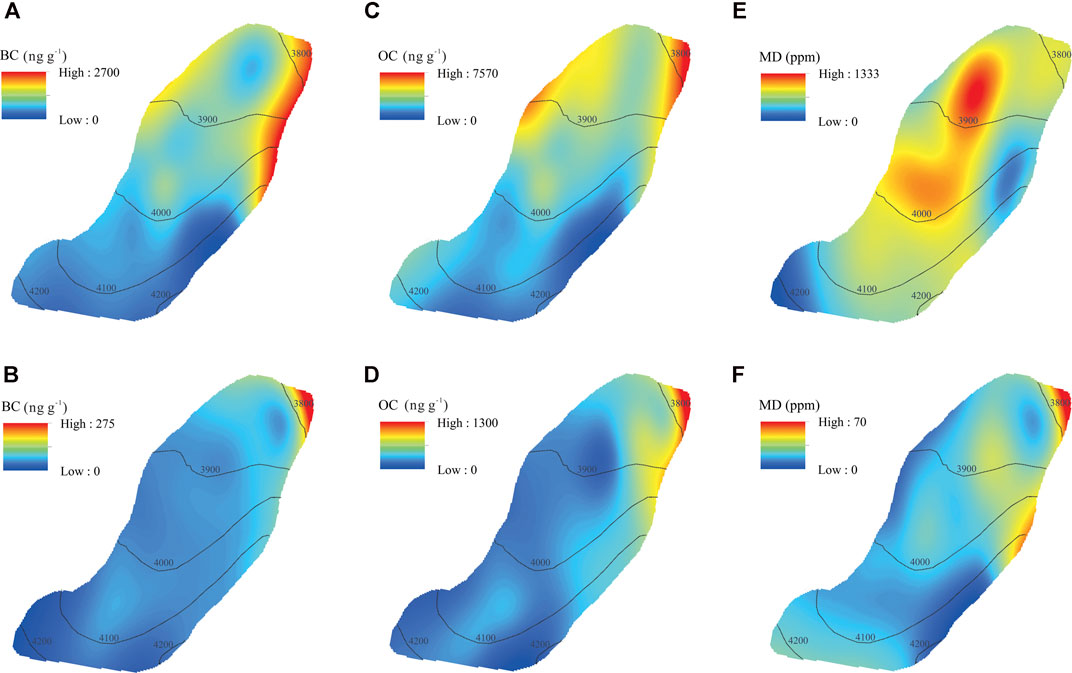
FIGURE 6. Spatial variations of BC in the surface snow/ice. (A), (C), and (E) BC, OC, and MD concentrations on 2 August, glacier surface mainly covered by granular ice; (B), (D), and (F) BC, OC, and MD concentrations on 12 August, glacier surface mainly covered by fresh snow.
As for the entire glacier, a strong elevation gradient was observed, and the LAIs’ concentrations were significantly higher at altitudes below 4,000 m than above 4,000 m. LAIs’ enrichment mainly occurred on the central part of the glacier and the terminus of the glacier, and the enrichment was weak at the top of the glacier. There was a decreasing trend in LAIs with increasing elevation, which suggested that LAIs’ concentrations were mainly dependent on the melting state of the glacier surface. In general, when elevation decreased, the ablation of the glacier increased. In addition, the elevation gradient has significant implications for spatial variations in LAIs’ deposition, thus resulting in spatial variations of RF with glacier melting.
Comparison of BC Concentrations in Snow and Ice
We compared our observed BC, OC, and MD concentrations in Urumqi Glacier No.1 (Table 2) with previous research from snow and ice in High Asia. For fresh snow, BC concentrations of Urumqi Glacier No.1 were similar to those of Muji Glacier (25 ng g−1) in the western Tibetan Plateau; OC concentrations were higher than those for Xiao Dongkemadi Glacier (157.97 ng g−1); and MD concentrations were also higher than those for Xiao Dongkemadi Glacier (1.89 μg g−1) (Yang et al., 2015; Li et al., 2017). For aged snow, BC and MD concentrations of Urumqi Glacier No.1 were similar to those of glaciers at the edge of Tibetan Plateau (e.g., Laohugou Glacier No.12 and Baishui Glacier No.1) and significantly higher than those of glaciers in the Tibetan Plateau hinterland (e.g., Zhadang Glacier) (Qu et al., 2014; Niu et al., 2017; Zhang et al., 2017a). It may be due to the relatively low altitude of glaciers at the edge of TP. As the temperature rises, ice and snow melt more easily, and LAIs are concentrated on the glacier surface. In addition, these glaciers are more susceptible to the spread of pollutants over long distances. By comparison, it could be concluded that BC concentrations of Urumqi Glacier No.1 were at a relatively high level in High Asia, and this might be attributed to regional and local emissions (Dong et al., 2016b; Zhang et al., 2017b).
Previous research has suggested that local emissions and long-distance transported pollutants from Central Asia could also be potential contributors to black carbon and dust in Urumqi River Valley (Dong et al., 2016a; Zhang et al., 2020). BC concentrations in this work showed a small difference relative to the reported concentrations on Urumqi Glacier No.1; for example, BC concentrations were in the range of 250–500 ng g−1 in the summer of 2004 (Xu et al., 2012). The discrepancy was mostly mainly due to previous studies focusing on snow pits in the accumulation zone of glaciers and less attention to the ablation zones. The differences in concentrations of BC and dust among different glaciers may indicate the differences of deposition, enrichment, and reexposure of impurities over different regions.
Effects of LAIs on Albedo
The albedo in different sample sites on August 12 is shown in Figure 7. For fresh snow (C1-J), the albedo showed smaller variability. For aged snow (A-C3), the albedo was increased with the decrease in LAIs’ concentrations. As for the entire glacier, the albedo was higher at a higher elevation. It should be noted that the albedo at C1 was much higher than the albedo at C3, and the main cause was the different air temperatures at the different sampling time. With the increase in temperature, snow grain size gradually increased, which could change the albedo of snow. Parameters for sensitivity analysis with the SNICAR model for Urumqi Glacier No.1 are listed in Table 3. Given the current data, uncertainties by BC measurements were estimated to be about 3–6%.
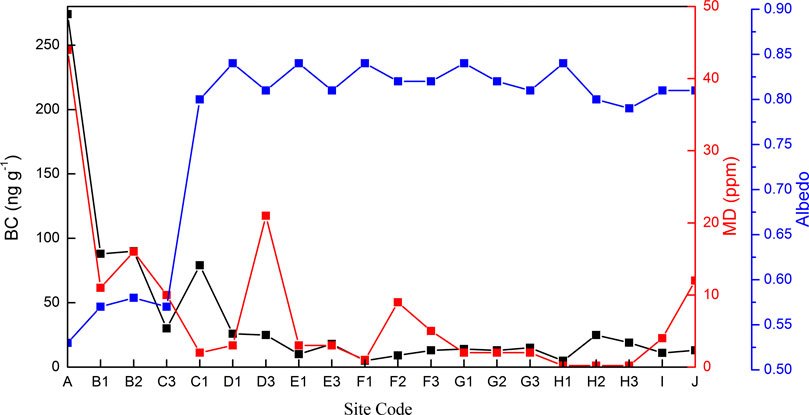
FIGURE 7. The mean albedo of surface snow/ice measured by the Analytical Spectral Devices (ASD) on 12 August, along with BC and dust concentrations at the sampling sites.
Based on the melting conditions of the glacier surface, the samples were divided into three types: fresh snow, aged snow, and granular ice. The influence of BC and MD on reducing albedo of Urumqi Glacier No.1 in three melting conditions is shown in Figure 8. The sensitivity analysis suggested that BC and MD in fresh snow could reduce the albedo by 12.8 and 10.3%, in aged snow could reduce the albedo by 23.3 and 5.9%, and in granular ice could reduce the albedo by 21.5 and 29.8%. BC exceeded MD which contributed a major portion of the albedo reduction in fresh snow and aged snow. BC played a vital role in the process of snow melting on Urumqi Glacier No.1. However, with the disappearance of snow on the glacier surface, most of the glacier surface was covered with MD, which played a key role in glacier melting (Takeuchi and Li, 2008). Therefore, the reduction of albedo by surface BC and MD was the main factor that accelerated glacier retreating in the context of global warming.
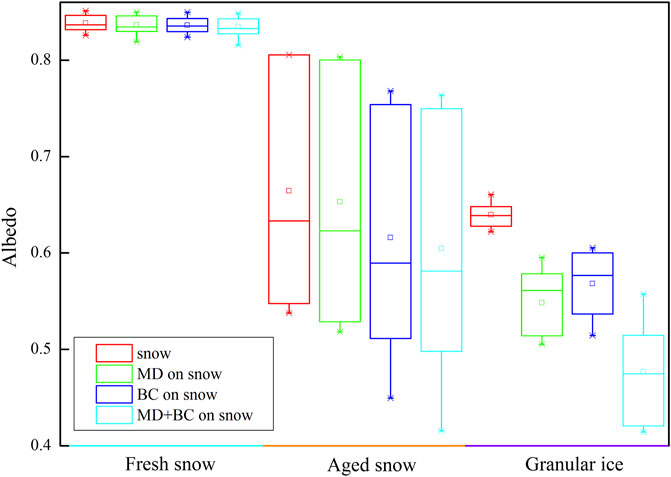
FIGURE 8. The reduction of albedo by BC and MD on Urumqi Glacier No.1 under three different melting conditions: fresh snow, aged snow, and granular ice.
Discussion
We calculated the RF in three scenarios, only BC, only MD, and both MD and BC on Urumqi Glacier No.1, using Eq. 2. As shown in Figure 9, the RF induced by BC only in fresh snow, aged snow, and granular ice was 1.38, 22.76, and 46.66 W m−2, respectively. The RF induced by MD only in fresh snow, aged snow, and granular ice was 1.52, 5.47, and 59.63 W m−2, respectively. The RF induced by BC and MD in the granular ice and aged snow was higher than that in fresh snow. The RF of MD was higher than that of BC in fresh snow and granular ice, whereas the RF of BC exceeded MD in aged snow, which indicated that BC was the dominant factor in the melting of snow and MD caused higher RF when the glacier surface was without snow distribution.
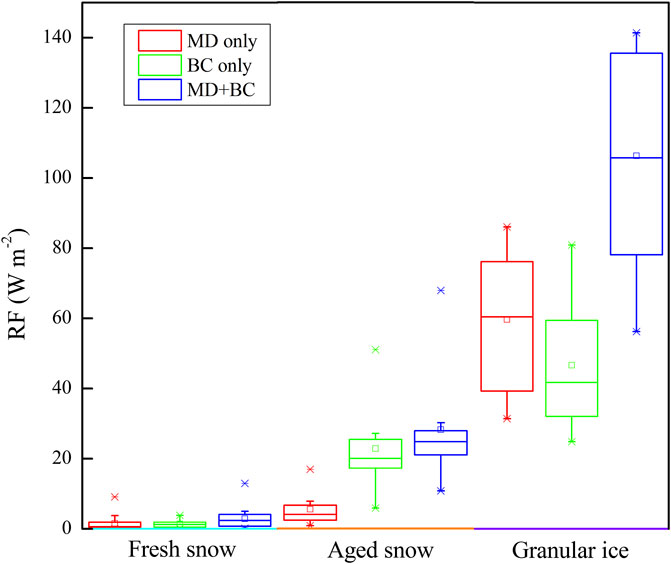
FIGURE 9. The contribution of RF of BC and MD on Urumqi Glacier No.1 under three different melting conditions: fresh snow, aged snow, and granular ice.
Many studies of RF caused by BC have been conducted in High Asia (Qu et al., 2014; Yang et al., 2015; Li et al., 2017; Niu et al., 2017). For surface snow from glaciers in High Asia, RF induced by the effect of BC and dust ranged from several W m−2 to more than 100 W m−2 (Zhang and Kang, 2017). The RF caused by BC in Urumqi Glacier No.1 was higher than that in a large number of glaciers in High Asia, such as Dongkemadi Glacier, Qiyi Glacier, and Laohugou No.12 Glacier (Ming et al., 2013b; Zhang et al., 2017). This was because the concentrations of BC and MD over Urumqi Glacier No.1 in the atmosphere were much higher than those over other glaciers in High Asia.
Conclusion
This study provides the observational data of LAIs’ concentrations of the glacier surface on Urumqi Glacier No.1 during the ablation season of 2015. BC concentrations ranged between 32 and 2,258 ng g−1, and the concentrations of OC and MD were 1,590 and 110 μg g−1, respectively. Temporal distributions of LAIs suggested that LAIs’ concentrations gradually increased as the snow melting progressed. Temporal distributions of LAIs were mainly dependent on the different melting state of the glacier surface. LAIs were early enriched at lower elevations of the glacier. BC and MD could significantly reduce the albedo of snow at the glacier surface, and we found BC and MD at the glacier surface reduced the albedo 12.8 and 10.3% in fresh snow, reduced the albedo 23.3 and 5.9% in aged snow, and reduced the albedo 21.5 and 29.8% in granular ice, respectively. BC played a vital role in the process of snow melting on Urumqi Glacier No.1. MD may play a key role in glacier melting when the snow disappears. The calculated result showed that the average RF induced by BC in fresh snow, aged snow, and granular ice was 1.38, 22.76, and 46.66 W m−2, respectively. Average RF induced by MD only was 1.52 W m−2 for fresh snow, 5.47 W m−2 for aged snow, and 59.63 W m−2 for granular ice. It was suggested that BC played an important role in snow melting and dust was the main forcing factor in accelerating glacier melt.
Data Availability Statement
The datasets generated for this study are available on request to the corresponding author.
Author Contributions
ZL designed the experiment. XY performed the experiments. YS collected the samples. XZ (1st author) and XY wrote the manuscript. MS and XZ (5th author) reviewed and edited the manuscript.
Funding
This work was supported by the SKLCS founding (SKLCS-ZZ-2019), the Strategic Priority Research Program of Chinese Academy of Sciences (Class A) (XDA20020102; XDA20060201), the Innovative Research Group Project of the National Natural Science Foundation of China (41721091), and the National Natural Science Foundation of China (41761134093; 41471058).
Conflict of Interest
The authors declare that the research was conducted in the absence of any commercial or financial relationships that could be construed as a potential conflict of interest.
Publisher’s Note
All claims expressed in this article are solely those of the authors and do not necessarily represent those of their affiliated organizations, or those of the publisher, the editors, and the reviewers. Any product that may be evaluated in this article, or claim that may be made by its manufacturer, is not guaranteed or endorsed by the publisher.
Acknowledgments
The authors thank the staff working in the Tian Shan Glaciological Station for helping collect data. They also gratefully thank the reviewers for their constructive comments.
References
Bond, T. C., Doherty, S. J., Fahey, D. W., Forster, P. M., Berntsen, T., DeAngelo, B. J., et al. (2013). Bounding the Role of Black Carbon in the Climate System: A Scientific Assessment. J. Geophys. Res. Atmos. 118 (11), 5380–5552. doi:10.1002/jgrd.50171
Che, Y., Zhang, M., Li, Z., Wei, Y., Nan, Z., Li, H., et al. (2019). Energy Balance Model of Mass Balance and its Sensitivity to Meteorological Variability on Urumqi River Glacier No.1 in the Chinese Tien Shan. Sci. Rep. 9, 13958. doi:10.1038/s41598-019-50398-4
Chow, J. C., Watson, J. G., Chen, L.-W. A., Arnott, W. P., Moosmüller, H., and Fung, K. (2004). Equivalence of Elemental Carbon by thermal/optical Reflectance and Transmittance with Different Temperature Protocols. Environ. Sci. Technol. 38, 4414–4422. doi:10.1021/es034936u
Dang, C., Fu, Q., and Warren, S. G. (2016). Effect of Snow Grain Shape on Snow Albedo. J. Atmos. Sci. 73 (9), 3573–3583. doi:10.1175/jas-d-15-0276.1
Dong, Z., Kang, S., Qin, D., Li, Y., Wang, X., Ren, J., et al. (2016a). Provenance of Cryoconite Deposited on the Glaciers of the Tibetan Plateau: New Insights From Nd-Sr Isotopic Composition and Size Distribution. J. Geophys. Res. Atmos. 121, 7371–7382. doi:10.1002/2016JD024944
Dong, Z., Qin, D., Kang, S., Liu, Y., Li, Y., Huang, J., et al. (2016b). Individual Particles of Cryoconite Deposited on the Mountain Glaciers of the Tibetan Plateau: Insights into Chemical Composition and Sources. Atmos. Environ. 138, 114–124. doi:10.1016/j.atmosenv.2016.05.020
Flanner, M. G., Liu, X., Zhou, C., Penner, J. E., and Jiao, C. (2012). Enhanced Solar Energy Absorption by Internally-Mixed Black Carbon in Snow Grains. Atmos. Chem. Phys. 12 (10), 4699–4721. doi:10.5194/acp-12-4699-2012
Flanner, M. G., Zender, C. S., Randerson, J. T., and Rasch, P. J. (2007). Present-day Climate Forcing and Response from Black Carbon in Snow. J. Geophys. Res. 112 (D11202), 1–17. doi:10.1029/2006JD008003
Gabbi, J., Huss, M., Bauder, A., Cao, F., and Schwikowski, M. (2015). The Impact of Saharan Dust and Black Carbon on Albedo and Long-Term Glacier Mass Balance. Cryosphere Discuss. 9 (1), 1385–1400. doi:10.5194/tcd-9-1133-2015
Gertler, C. G., Puppala, S. P., Panday, A., Stumm, D., and Shea, J. (2016). Black Carbon and the Himalayan Cryosphere: A Review. Atmos. Environ. 125, 404–417. doi:10.1016/j.atmosenv.2015.08.078
Hadley, O. L., and Kirchstetter, T. W. (2012). Black-carbon Reduction of Snow Albedo. Nat. Clim Change 2 (6), 437–440. doi:10.1038/nclimate1433
Hansen, J., and Nazarenko, L. (2004). Soot Climate Forcing via Snow and Ice Albedos. Proc. Natl. Acad. Sci. 101 (2), 423–428. doi:10.1073/pnas.2237157100
He, C., Flanner, M. G., Chen, F., Barlage, M., Liou, K.-N., Kang, S., et al. (2018). Black Carbon-Induced Snow Albedo Reduction over the Tibetan Plateau: Uncertainties from Snow Grain Shape and Aerosol-Snow Mixing State Based on an Updated SNICAR Model. Atmos. Chem. Phys. 18 (15), 11507–11527. doi:10.5194/acp-18-11507-2018
He, C., Li, Q., Liou, K. N., Takano, Y., Gu, Y., Qi, L., et al. (2014). Black Carbon Radiative Forcing over the Tibetan Plateau. Geophys. Res. Lett. 41 (22), 7806–7813. doi:10.1002/2014gl062191
He, C., Liou, K. N., Takano, Y., Chen, F., and Barlage, M. (2019). Enhanced Snow Absorption and Albedo Reduction by Dust‐Snow Internal Mixing: Modeling and Parameterization. J. Adv. Model. Earth Syst. 11, 3755–3776. doi:10.1029/2019ms001737
Jacobson, M. Z. (2001). Strong Radiative Heating Due to the Mixing State of Black Carbon in Atmospheric Aerosols. Nature 409 (6821), 695–697. doi:10.1038/35055518
Kaspari, S., Painter, T. H., Gysel, M., Skiles, S. M., and Schwikowski, M. (2014). Seasonal and Elevational Variations of Black Carbon and Dust in Snow and Ice in the Solu-Khumbu, Nepal and Estimated Radiative Forcings. Atmos. Chem. Phys. 14 (15), 8089–8103. doi:10.5194/acp-14-8089-2014
Li, X., Kang, S., He, X., Qu, B., Tripathee, L., Jing, Z., et al. (2017). Light-absorbing Impurities Accelerate Glacier Melt in the Central Tibetan Plateau. Sci. Total Environ. 587-588 (3), 482–490. doi:10.1016/j.scitotenv.2017.02.169
Ming, J., Du, Z., Xiao, C., Xu, X., and Zhang, D. (2012). Darkening of the Mid-himalaya Glaciers since 2000 and the Potential Causes. Environ. Res. Lett. 7 (1), 014021–014033. doi:10.1088/1748-9326/7/1/014021
Ming, J., Wang, P., Zhao, S., and Chen, P. (2013a). Disturbance of Light-Absorbing Aerosols on the Albedo in a winter Snowpack of Central Tibet. J. Environ. Sci. 25 (8), 1601–1607. doi:10.1016/S1001-0742(12)60220-4
Ming, J., Wang, Y., Du, Z., Zhang, T., Guo, W., Xiao, C., et al. (2015). Widespread Albedo Decreasing and Induced Melting of Himalayan Snow and Ice in the Early 21st century. Plos One 10 (6), e0126235–13. doi:10.1371/journal.pone.0126235
Ming, J., Xiao, C., Cachier, H., Qin, D., Qin, X., Li, Z., et al. (2009). Black Carbon (BC) in the Snow of Glaciers in West China and its Potential Effects on Albedos. Atmos. Res. 92 (1), 114–123. doi:10.1016/j.atmosres.2008.09.007
Ming, J., Xiao, C., Du, Z., and Yang, X. (2013b). An Overview of Black Carbon Deposition in High Asia Glaciers and its Impacts on Radiation Balance. Adv. Water Resour. 55 (3), 80–87. doi:10.1016/j.advwatres.2012.05.015
Ming, J., Xiao, C., Wang, F., Li, Z., and Li, Y. (2016). Grey Tienshan Urumqi Glacier No.1 and Light-Absorbing Impurities. Environ. Sci. Pollut. Res. 23 (10), 9549–9558. doi:10.1007/s11356-016-6182-7
Niu, H., Kang, S., Shi, X., Paudyal, R., He, Y., Li, G., et al. (2017). In-situ Measurements of Light-Absorbing Impurities in Snow of Glacier on Mt. Yulong and Implications for Radiative Forcing Estimates. Sci. Total Environ. 581-582, 848–856. doi:10.1016/j.scitotenv.2017.01.032
Nolin, A. W., and Dozier, J. (2000). A Hyperspectral Method for Remotely Sensing the Grain Size of Snow. Remote Sens. Environ. 74 (2), 207–216. doi:10.5194/tc-12-2371-201810.1016/s0034-4257(00)00111-5
Painter, T. H., Seidel, F. C., Bryant, A. C., Skiles, M., and Rittger, K. (2013). Imaging Spectroscopy of Albedo and Radiative Forcing by Light-Absorbing Impurities in Mountain Snow. J. Geophys. Res. Atmos. 118 (18), 9511–9523. doi:10.1002/jgrd.50520
Qian, Y., Yasunari, T. J., Doherty, S. J., Flanner, M. G., Lau, W. K. M., Ming, J., et al. (2015). Light-absorbing Particles in Snow and Ice: Measurement and Modeling of Climatic and Hydrological Impact. Adv. Atmos. Sci. 32 (1), 64–91. doi:10.1007/s00376-014-0010-0
Qu, B., Ming, J., Kang, S.-C., Zhang, G.-S., Li, Y.-W., Li, C.-D., et al. (2014). The Decreasing Albedo of the Zhadang Glacier on Western Nyainqentanglha and the Role of Light-Absorbing Impurities. Atmos. Chem. Phys. 14 (20), 11117–11128. doi:10.5194/acp-14-11117-2014
Ramanathan, V., and Carmichael, G. (2008). Global and Regional Climate Changes Due to Black Carbon. Nat. Geosci 1 (1), 221–227. doi:10.1038/ngeo156
Ramanathan, V., Ramana, M. V., Roberts, G., Kim, D., Corrigan, C., Chung, C., et al. (2007). Warming Trends in Asia Amplified by Brown Cloud Solar Absorption. Nature 448 (7153), 575–578. doi:10.1038/nature06019
Schmale, J., Flanner, M., Kang, S., Sprenger, M., Zhang, Q., Guo, J., et al. (2017). Modulation of Snow Reflectance and Snowmelt from Central Asian Glaciers by Anthropogenic Black Carbon. Sci. Rep. 7, 40501. doi:10.1038/srep40501
Takeuchi, N., and Li, Z. (2008). Characteristics of Surface Dust on Ürümqi Glacier No. 1 in the Tien Shan Mountains, China. Arctic Antarctic Alpine Res. 40, 744–750. doi:10.1657/1523-043010.1657/1523-0430(07-094)[takeuchi]2.0.co;2
Wang, M., Xu, B., Zhao, H., Cao, J., Joswiak, D., Wu, G., et al. (2012). The Influence of Dust on Quantitative Measurements of Black Carbon in Ice and Snow when Using a Thermal Optical Method. Aerosol. Sci. Techn. 46 (1), 60–69. doi:10.1080/02786826.2011.605815
Wang, X., Pu, W., Ren, Y., Zhang, X., Zhang, X., Shi, J., et al. (2017). Observations and Model Simulations of Snow Albedo Reduction in Seasonal Snow Due to Insoluble Light-Absorbing Particles during 2014 Chinese Survey. Atmos. Chem. Phys. 17 (1-3), 2279–2296. doi:10.5194/acp-17-2279-2017
Warren, S. G., and Wiscombe, W. J. (1980). A Model for the Spectral Albedo of Snow. II: Snow Containing Atmospheric Aerosols. J. Atmos. Sci. 37 (12), 2734–2745. doi:10.1175/1520-0469(1980)037<2734:amftsa>2.0.co;2
Xu, B., Cao, J., Hansen, J., Yao, T., Joswia, D. R., Wang, N., et al. (2009). Black Soot and the Survival of Tibetan Glaciers. Proc. Natl. Acad. Sci. U S A 106 (52), 22114–22118. doi:10.1073/pnas.0910444106
Xu, B., Cao, J., Joswiak, D. R., Liu, X., Zhao, H., and He, J. (2012). Post-depositional Enrichment of Black Soot in Snow-Pack and Accelerated Melting of Tibetan Glaciers. Environ. Res. Lett. 7 (1), 014022–014035. doi:10.1088/1748-9326/7/1/014022
Xu, B., Yao, T., Liu, X., and Wang, N. (2006). Elemental and Organic Carbon Measurements with a Two-step Heating-Gas Chromatography System in Snow Samples from the Tibetan Plateau. Ann. Glaciol. 43 (1), 257–262. doi:10.3189/172756406781812122
Xu, X., Pan, B., Hu, E., Li, Y., and Liang, Y. (2011). Responses of Two Branches of Glacier No. 1 to Climate Change from 1993 to 2005, Tianshan, China. Quat. Int. 236, 143–150. doi:10.1016/j.quaint.2010.06.013
Yang, S., Xu, B., Cao, J., Zender, C. S., and Wang, M. (2015). Climate Effect of Black Carbon Aerosol in a Tibetan Plateau Glacier. Atmos. Environ. 111, 71–78. doi:10.1016/j.atmosenv.2015.03.016
Yasunari, T. J., Bonasoni, P., Laj, P., Fujita, K., Vuillermoz, E., Marinoni, A., et al. (2010). Estimated Impact of Black Carbon Deposition during Pre-monsoon Season from Nepal Climate Observatory - Pyramid Data and Snow Albedo Changes over Himalayan Glaciers. Atmos. Chem. Phys. 10 (14), 6603–6615. doi:10.5194/acp-10-6603-2010
Yasunari, T. J., Tan, Q., Lau, K.-M., Bonasoni, P., Marinoni, A., Laj, P., et al. (2013). Estimated Range of Black Carbon Dry Deposition and the Related Snow Albedo Reduction over Himalayan Glaciers during Dry Pre-monsoon Periods. Atmos. Environ. 78 (7), 259–267. doi:10.1016/j.atmosenv.2012.03.031
Zhang, X., Li, Z., Ming, J., and Wang, F. (2020). One-Year Measurements of Equivalent Black Carbon, Optical Properties, and Sources in the Urumqi River Valley, Tien Shan, China. Atmosphere 11, 478. doi:10.3390/atmos11050478
Zhang, Y., Kang, S., Li, C., Gao, T., Cong, Z., Sprenger, M., et al. (2017a). Characteristics of Black Carbon in Snow from Laohugou No. 12 Glacier on the Northern Tibetan Plateau. Sci. Total Environ. 607-608, 1237–1249. doi:10.1016/j.scitotenv.2017.07.100
Zhang, Y., and Kang, S. (2017b). Research Progress of Light-Absorbing Impurities in Glaciers of the Tibetan Plateau and its Surroundings. Chin. Sci. Bull. 62, 4151–4162. doi:10.1360/N972017-00505
Zhao, C., Hu, Z., Qian, Y., Ruby Leung, L., Huang, J., Huang, M., et al. (2014). Simulating Black Carbon and Dust and Their Radiative Forcing in Seasonal Snow: a Case Study over North China with Field Campaign Measurements. Atmos. Chem. Phys. 14 (20), 11475–11491. doi:10.5194/acp-14-11475-2014
Keywords: Urumqi Glacier No.1, surface snow, radiative forcing (RF), albedo, light-absorbing impurities (LAIs)
Citation: Zhang X, Li Z, You X, She Y, Song M and Zhou X (2021) Light-Absorbing Impurities on Urumqi Glacier No.1 in Eastern Tien Shan: Concentrations and Implications for Radiative Forcing Estimates During the Ablation Period. Front. Earth Sci. 9:524963. doi: 10.3389/feart.2021.524963
Received: 07 January 2020; Accepted: 23 August 2021;
Published: 08 October 2021.
Edited by:
Michael Lehning, École Polytechnique Fédérale de Lausanne, SwitzerlandReviewed by:
Cenlin He, National Center for Atmospheric Research (UCAR), United StatesHelle Astrid Kjær, Niels Bohr Institute, Denmark
Copyright © 2021 Zhang, Li, You, She, Song and Zhou. This is an open-access article distributed under the terms of the Creative Commons Attribution License (CC BY). The use, distribution or reproduction in other forums is permitted, provided the original author(s) and the copyright owner(s) are credited and that the original publication in this journal is cited, in accordance with accepted academic practice. No use, distribution or reproduction is permitted which does not comply with these terms.
*Correspondence: Xiaoni You, MTc2NjM5NjQ4QHFxLmNvbQ==
 Xin Zhang
 Zhongqin Li1
 Xiaoni You