 Stephen Self
 Tushar Mittal
 Anne Elizabeth Jay
95% of researchers rate our articles as excellent or good
Learn more about the work of our research integrity team to safeguard the quality of each article we publish.
Find out more
ORIGINAL RESEARCH article
Front. Earth Sci. , 17 February 2021
Sec. Volcanology
Volume 8 - 2020 | https://doi.org/10.3389/feart.2020.630604
This article is part of the Research Topic Basaltic Volcanism: From Magmatic Processes to Eruptive Styles View all 9 articles
Constraining the eruption rates of flood basalt lava flows remains a significant challenge despite decades of work. One potential observable proxy for eruption rates is flood basalt lava-flow lobe thicknesses, a topic that we tackle here quantitatively. In this study, we provide the first global compilation of pāhoehoe lava-lobe thicknesses from various continental flood basalt provinces (∼ 3,800 measurements) to compare characteristic thicknesses within and between provinces. We refer to thin lobes (∼ ≤5 m), characteristic of “compound” lavas, as hummocky pāhoehoe lava flows or flow-fields. Conversely, we term thicker lobes, characteristic of “simple” flows, as coming from sheet-lobe-dominated flows. Data from the Deccan Traps and Columbia River flood-basalt provinces are archetypal since they have the most consistent datasets as well as established chemo- and litho-stratigraphies. Examining Deccan lobe thicknesses, we find that previously suggested (and disputed) distinct temporal and regional distributions of hummocky pāhoehoe and sheet-lobe-dominated flow fields are not strongly supported by the data and that each geochemically defined formation displays both lobe types in varying amounts. Thin flow-lobes do not appear to indicate proximity to source. The modal lobe thickness of Deccan formations with abundant “thin” lava-lobes is 8 m, while the mode for sheet-lobe-dominated formations is only 17 m. Sheet-lobes up to 75–80 m are rare in the Deccan and Columbia River Provinces, and ones >100 m are exceptional globally. For other flood basalt provinces, modal thickness plots show a prevalence toward similar lobe thicknesses to Deccan, with many provinces having some or most lobes in the 5–8 m modal range. However, median values are generally thicker, in the 8–12 m range, suggesting that sheet-lobes dominate. By contrast, lobes from non-flood basalt flow-fields (e.g., Hawai’i, Snake River Plain) show distinctly thinner modes, sub-5 m. Our results provide a quantitative basis to ascertain variations in gross lava morphology and, perhaps, this will in future be related to emplacement dynamics of different flood basalt provinces, or parts thereof. We can also systematically distinguish outlier lobes (or regions) from typical lobes in a province, e.g., North American Central Atlantic Magmatic Province lava-lobes are anomalously thick and are closely related to feeder-intrusions, thus enabling a better understanding of conditions required to produce large-volume, thick, flood basalt lava-lobes and flows.
Continental flood basalt (CFB) province emplacement represents some of the largest volcanic events in Earth history, associated with the biggest (up to or perhaps > than 5,000 km3; Self et al., 2014) and longest (∼ 1,000 km; Self et al., 2008) recognized lava flow-fields on Earth. Although flood basalt lava flows have been studied extensively for decades, we still lack a good understanding of some fundamental aspects of lava flow emplacement, such as typical eruptive fluxes. Lava flow morphology, especially flow thickness, is a fundamental characteristic of CFBs that is potentially linked to lava-flow eruptive rates (e.g., Bondre et al., 2004). Thus, analysis of lava flow morphology can help examine the spatial and temporal variations in the emplacement rate of a CFB province. These spatiotemporal eruptive rate variations are critical for understanding the magmatic plumbing systems of CFBs (Sheth and Cañón-Tapia, 2015; Ernst et al., 2019) as well as the environmental impacts (e.g., Schmidt et al., 2016; Clapham and Renne 2019; Hull et al., 2020; Landwehrs et al., 2020).
However, studying lava flow morphology for CFB flows is challenging for a variety of reasons. First, the morphology and physical form of lava flows may change across and within different formations in CFB provinces as well as chronologically throughout the emplacement of a CFB (Passey and Bell, 2007; Kale et al., 2020a). Thus, any analysis needs to carefully account for these effects. Second, most previous CFB studies provide only a qualitative description of morphology or are focused on a single outcrop or region. Consequently, it is not easy to quantify any spatio-temporal variations between different morphological styles. Furthermore, consistent terminology is essential to accurately compare flow morphologies over 100s of km and across CFBs. Finally, in field geology, the eye is always drawn to the extremes, be they small or large. Thus, a quantitative analysis is necessary to estimate the average or typical lava-body thicknesses reported from CFB provinces and systematically compare differences (if any) between provinces.
We address these challenges by comparing lava flow morphology (with a clearly defined terminology) across multiple CFB provinces and modern analogs with a specific focus on the Deccan Traps (henceforth Deccan). A simple expression of flow morphology is lava-lobe thickness, as this represents the essential morphological difference reported from CFB pāhoehoe (phh) lavas – sheet-lobe-dominated (simple) vs. hummocky-lobe-dominated (compound) lavas (e.g., Walker, 1971; Bondre et al., 2004; Sheth, 2006; Jay et al., 2018). The thickness of lobes or flows is also perhaps the only physical property of basalt lavas consistently reported across many studies. We first describe our volcanological terminology for CFB flows following Self et al. (1998) and Thordarson and Self (1998). Within our terminology, thin (<5 m) lobes can be equated to hummocky-lobe-dominated flows and thicker (> 5 m) lobes to sheet lobe-dominated flows. It is important to note that lava flow-fields are, to some extent, always compound (e.g., Vye-Brown et al., 2013). Thus, the influence of typical CFB province outcrop scales (an approximately 2D slice of a large 3D flow structure) on interpreting whole lava flow-fields and typical province-wide lobe thicknesses requires careful attention.
We then present lava lobe thickness data based on logs made through flood-basalt lava sequences from which we can estimate the value and range of lobe thicknesses for each formation (or sometimes sections) and whole CFB provinces. Data are presented first for the Deccan Volcanic Province (Deccan) (Figure 1A), with most information coming from the Western Ghats (Sahyadri) where the geochemical stratigraphy is well-understood (e.g., Subbarao, 1999; Kale et al., 2020a; Kale et al., 2020b). The relationship of typical lobe thicknesses among the various geochemical formations provides important insights into the changing style of eruption of typical Deccan units as the main lava pile grew during its ∼ 1 Ma lifetime (Sprain et al., 2019; Schoene et al., 2019). Our work also makes it possible to test and quantify the suggestions of Deshmukh (1988), Walker (1971), Walker (1999) that smaller “compound” lava lobes dominate in the northern areas of the main Deccan province and that thicker “simple” flows occur more commonly to the south and east (Figure 1C). This observation was interpreted as being indicative of a lava morphology change due to changing distance from source. Although the idea has been disputed by others (Bondre et al., 2004; Self et al., 2006; Jay et al., 2018), our new dataset can help further quantitatively test this hypothesis. Next, we compile lobe thickness measurements from other CFB provinces (for a total of ∼ 3,800 individual measurements) from multiple studies. In concert with other studies (e.g., Bondre et al., 2004; Duraiswami et al., 2017; Jay et al., 2018) our results help illustrate the variety in a specific morphological lava feature (lobe thickness), both within a single CFB formation and for entire CFB provinces. Additionally, we can possibly use lobe thickness distributions to quantitatively compare and group together various CFBs with similar flow emplacement dynamics. This analysis thus provides a framework to generalize results from individual well-studied CFB sections, such as the Columbia River Basalts (CRB, e.g., Vye-Brown et al., 2013), to other CFB lava flow-fields.
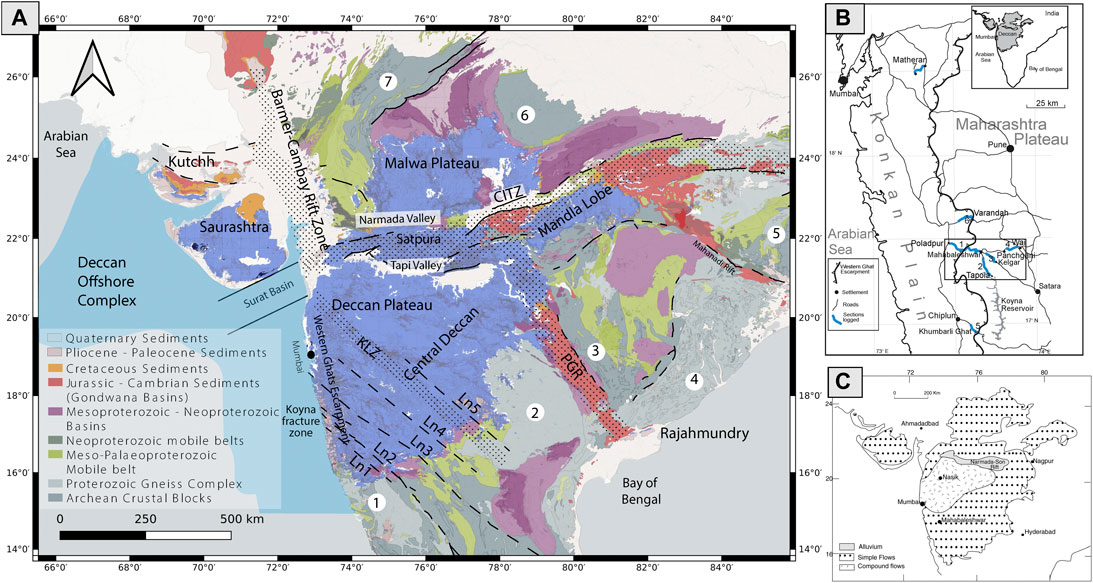
FIGURE 1. (A) Simplified geologic map of India showing distribution of main outcrops of Deccan Volcanic Province (DVP) and main sub-provinces (Deccan Plateau including the Western Ghats), Satpura region, Mandla Lobe, Malwa Plateau, and Kutchh-Saurashtra region (blue color). Figure also shows major sedimentary basins (with Gondwana basins highlighted in red), Proterozoic mobile belts, and major cratons: 1: Western Dharwar Craton, 2: Eastern Dharwar Craton, 3: Bastar Craton, 4: Eastern Ghats Belt, 5: Singhbhum Craton, 6: Bundelkhand Craton, 7: Aravalli Craton. Primary tectonic faults and lineaments (dashed lines) in Central India related to pre-existing Indian crustal features are: Barmer-Cambay rift zone, Central India Tectonic Zone (CITZ), Pranhita-Godavari rift zone (PGR), Kurduwadi Lineament zone (KLZ), Western Ghats Escarpment, Koyna Fracture Zone, and Ln 1-5 (lineaments inferred based on integrated analysis of gravity and magnetic data, Rajaram et al., 2017). (B) Map of Western Ghats area where majority of DVP data comes from, after Jay (2005); traverses for lava data shown in blue (see Figure 4). (C) Sketch map of DVP showing Deshmukh (1988) distribution of simple and compound lavas. Mumbai is located on all three maps.
Since observations show that 'a'ā flows (sensu lato) seem to be exceedingly rare in most CFB provinces, including the Deccan (Brown et al., 2011), and despite some reports to the contrary (e.g., Duraiswami et al., 2014), we will focus only on phh lava flow fields. The occasional ‘a’ā lobe in a phh flow-field is not unexpected. We use flow-field (see Self et al., 1997, after; Kilburn and Lopes, 1991) as a convenient term for the entire products of one effusive eruption, be it a CFB lava eruption or a much smaller one. We use the term (inflated) lava sheet-lobe (as per Self et al., 1997; Self et al., 1998; Thordarson and Self, 1998), shortened to sheet-lobe (SL), to describe widespread lava bodies surrounded by lava crusts. Note that this category would include a number of the transitional flow types such as the rubbly pāhoehoe flows reported in Deccan Traps (e.g., Duraiswami et al., 2017) as well as modern basaltic eruptions (Laki – Guilbaud et al., 2005). These bodies are much more extensive in the horizontal than the vertical axis and are mostly ≥5 m in total thickness. In CFB provinces these lobes are seen only in 2-D exposures (e.g., Figures 2A–C) and are equivalent to lava bodies called “simple,” although Walker (1971), in defining this term, wrote:
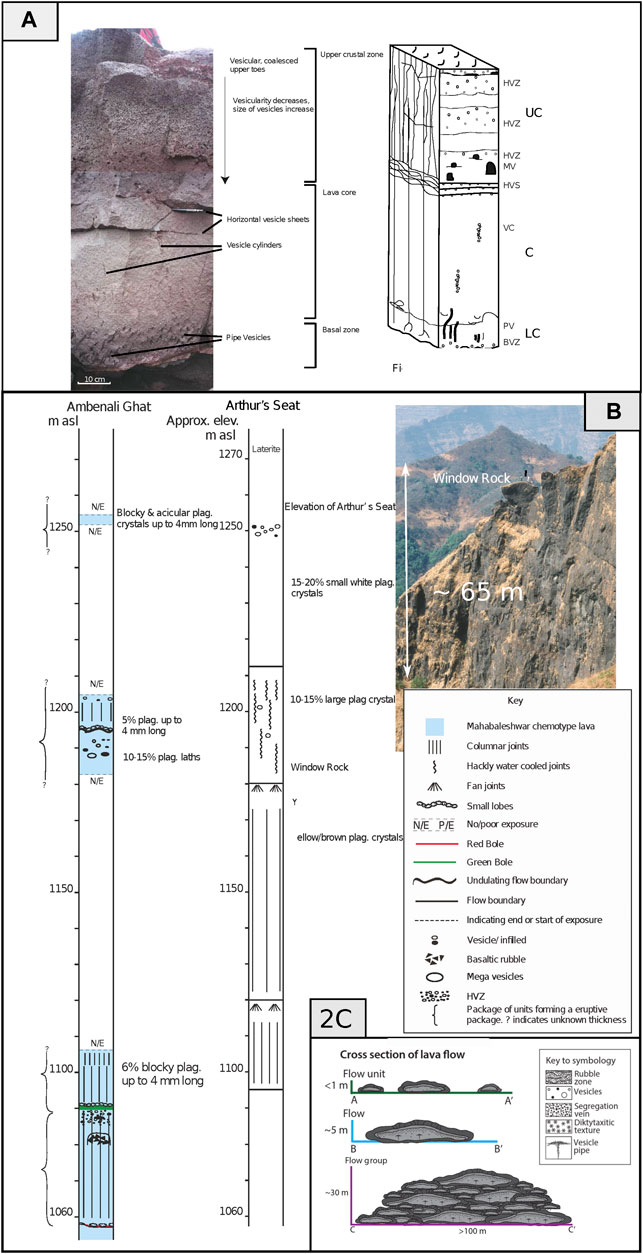
FIGURE 2. (A) Cartoon of section through hypothetical sheet flow lobe, after Thordarson and Self (1998), showing common arrangement of internal physical features; right face: UC – upper crustal zone; C – core; LC lower crustal zone; HVZ – horizontal vesicular zone; MV – megavesicles; VC – vesicle cylinders; PV – pipe vesicles; BVZ – basal vesicular zone; left face shows typical form and arrangement of cooling joints. On left, an ∼1 m thick lava lobe on Kīlauea, Hawai’i, formed about 1991, showing all features on cartoon. (B) Comparison of logs of poorly exposed Deccan lavas where Ambenali Ghat climbs through upper part of Mahabaleshwar Fm sequence with stratigraphically equivalent lavas at Arthur’s Seat, 7 km to north along strike, dominated by thick sheet lobes (inset photo shows the ∼60-m-thick lobes at Window Rock, Arthur’s Seat, people for scale!). Ambenali Ghat road area is thought to have poor exposure due to presence of thinner lobes that are more prone to erosion and weathering, representing lateral transition from thick sheet-lobe-dominated cliff exposures to N (Arthur’s Seat) to an area dominated by thinner lobes; modified from Jay (2005). (C) Cartoon of hummocky pāhoehoe pile of lava forming though stages (A–C), based on lavas in the Kimama drill core, Snake River Plain, after Potter et al. (2019).
In consequence, he [Walker] doubts if simple basalt flows occur at all, although simple andesite, dacite, rhyolite and trachyte flows do appear to exist. The application of the terms simple, compound, and multiple to basalt is probably most useful for older lavas which belong to dissected volcanic piles and are therefore not seen in their entirety; the terms are most usefully used in a descriptive way to convey the character of a flow as seen in a particular cross-section. If the average basalt lava flow were seen in its entirety it would prove to be compound and locally multiple in character, though over much of its extent it might be made of a single unit.
We thus use sheet-lobe(s) for what have been called simple flows in outcrop (Figure 2A). We use hummocky pāhoehoe (HP, Swanson, 1973; Swanson et al., 1979; Hon et al., 1994) for what have been called compound phh flows in outcrop (made of several to many small lava lobes, Figure 2C), and we suggest that lobes of < and >5 m thickness is a convenient divide for distinguishing HP lavas from SLs, in CFBs at least. We find that the lobes in HP-dominated flow sequences are usually <5 m and show only nascent internal structure of the type shown on Figure 2A. We note that SLs considerably thinner than 3 m exist in the lava flow-field of the recent (1983–2018) eruption on Kīlauea, Hawai’i (Sharma et al., 2000, see our Figure 2A); these possess all features of much thicker SLs, but they are not of concern to this paper. The internal structure of SLs (Figure 2A) is also different and more variably developed than that of many HP lobes, and the internal structure is used to distinguish the top and bottom crusts of lava lobes.
We obtained lava lobe thickness data from detailed volcanological logs made through lava piles in CFB provinces largely using exposures along road cuts (and rail-road cuts) but also in natural cliffs and slopes, and, occasionally, streambeds and drill cores. Lobe thickness data from the Deccan were measured by Jay (2005) and reported in Jay et al. (2009) for a total of ∼ 5 km of lava flows across multiple transects (see Figure 1B, for location of the logged transects). Complementary paleomagnetic and geochemical work was done on lava samples from these Deccan traverses (as well as geochronology; Renne et al., 2015; Sprain et al., 2019). Thus, given the current geochemical stratigraphic framework (Figure 3B; Beane et al., 1986; Jay and Widdowson, 2008), we can clearly assign each flow lobe to a geochemical formation. We have similar logs for the CRB and Karoo flood basalt provinces (Jay et al., 2018; Moulin et al., 2017), collected by the authors. For the Deccan and Karoo, the logs are exemplified by those in Figure 3A (Supplementary Figure S1, see also Figure 4 in Jay et al., 2009 and Jay et al., 2018). Data also exist from drill-hole cores in the Koyna region of the Western Ghats, part of the Deccan where scientific drill-holes were made (Mishra et al., 2017; Sinha et al., 2017), as well as the Killari Scientific Drill Hole (Gupta et al., 2003; Kumar et al., 2010). In order to extend the spatial coverage to other Deccan sub-provinces besides the Western Ghats, we also include previously published sections from the north-western Deccan (Peng and Mahoney, 1995), Narmada-Tapi Rift Zone region (Mahoney et al., 2000; Tejankar, 2002; Doke, 2014), Malwa Lobe (Kasiviswanandham, 2003), and Mandla Lobe (Sengupta and Ray, 2006; Pathak et al., 2017).
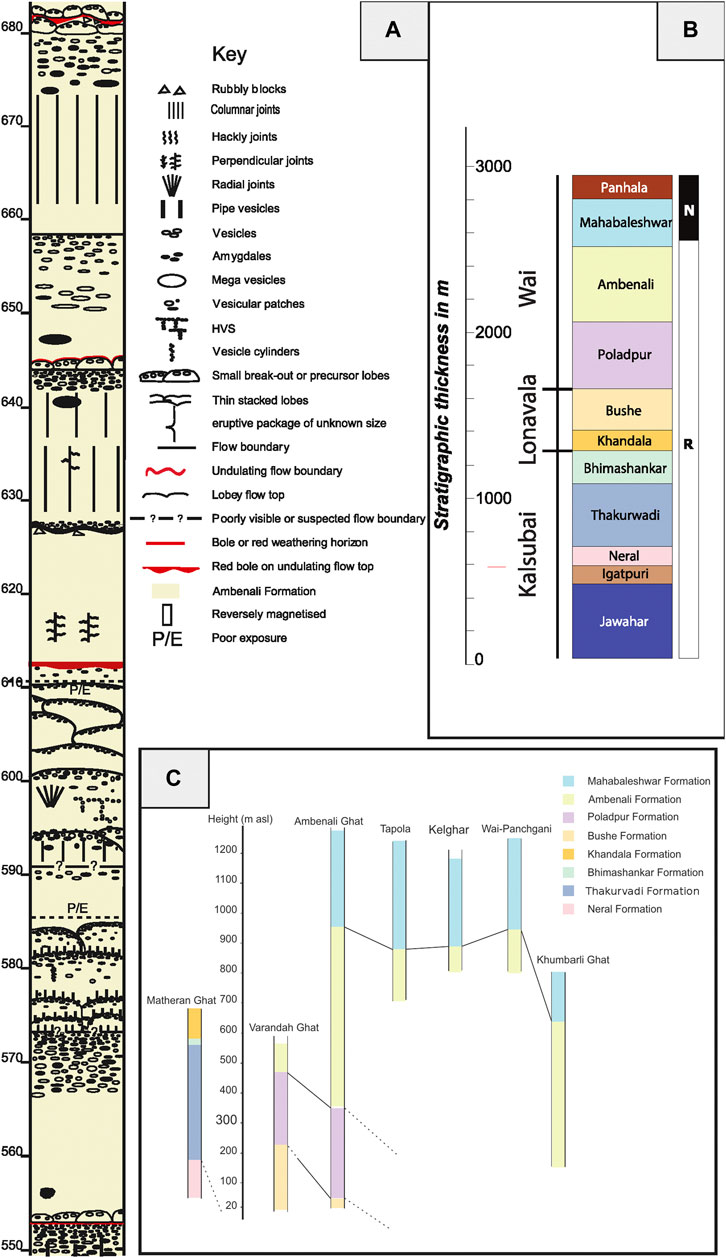
FIGURE 3. (A) Detailed log of small section of Ambenali Ghat traverse, Deccan Volcanic Province, within Ambenali Formation lavas (see Figure 3B) illustrating variety of morphologies in lava flows within one chemo-stratigraphic formation. Section is from 550 to 680 m above sea level and shows several sheet lobes under- and overlain by smaller precursor and break-out lobes, respectively, as well as other physical lava features indicated on key: from Jay (2005). (B) Composite section of Western Ghats lava flow stratigraphy showing geochemically defined formations (following Beane et al., 1986). This study includes data from all named formations except Jawar, Igatpuri, and Panhala. Magnetic polarity of lavas is expressed at right, R – chron 29r; N = chron 29n, after Jay et al. (2009). (C) Simplified stratigraphic logs of various Deccan transects showing geochemical formations (following Jay et al., 2009).
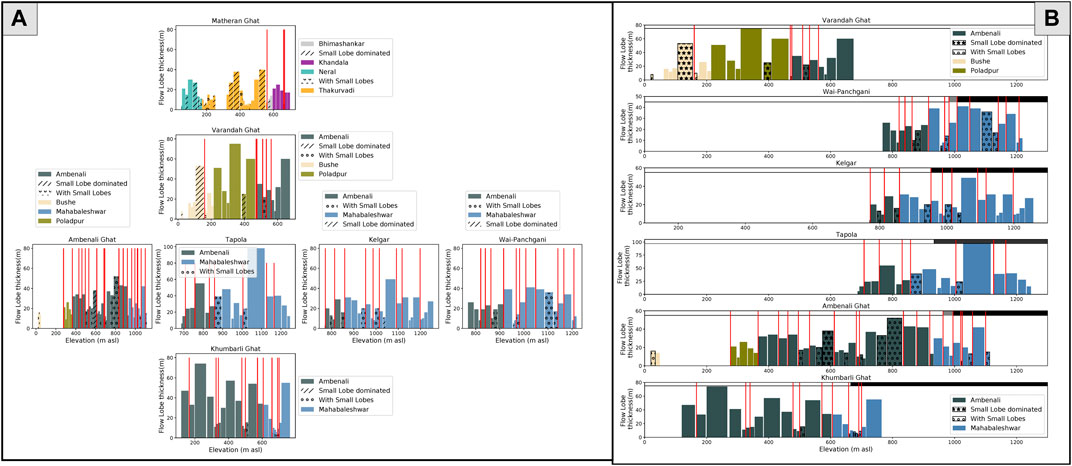
FIGURE 4. (A) Plots of lobe thickness in each Deccan lava formation vs altitude above mean sea level for traverses in central Western Ghats area; width of bar = lobe thickness (see Figure 1B for traverse locations). Formations are shown by bar color (see key); + open dots = with small lobes; + stars = small-lobe-dominated. Red vertical lines show boles (weathering horizons, see text, note the bole line thickness is not to scale). Note also that lobes >40 m thick are uncommon. (B) Flow thickness plotted against elevation above mean sea level in six logs through parts of Western Ghats lava series. Plots given from N to S (top to bottom; see Figure 1B for traverse locations) represent distance of ∼80 km. Formation ornaments as on (A).
For the CRB province, data are from Thordarson and Self (1998), Vye-Brown et al. (2013) including various unpublished measurement by the authors using the same logging principles as the abovementioned studies. Data from the nearby Snake River Plain basalts, included as an example of a “plains”-type basalt province (mini-CFB, after Greeley, 1982), are from a deep drill-hole core reported by Potter et al. (2019). Criteria for distinction of flow-lobes in that core are described by the authors (et seq., pgs 3–8) and are like those employed by us, allowing a consistent lobe delineation.
We also include similar datasets for other CFBs from a few studies (see Supplementary Data Sheet S1) while ensuring that the flow lobe definition used in these studies is as consistent as possible with our terminology. The provinces are CAMP, Ethiopian flood basalts, Emeishan flood basalts, the Siberian Traps, the North Atlantic Magmatic Province (NAMP; mainly the Faroe Islands and Greenland), the Big Island of Hawai’i (for purposes of comparison), and, briefly, Ontong Java Plateau, to include an oceanic LIP. For all provinces with data on lobes, we have followed the assigned stratigraphic nomenclature of the lava flow-fields or formations from the respective studies.
Lobe thicknesses were measured from the top of each upper lava crust to the bottom of the lower crust (Figure 2A) ignoring any soil and/or weathering-induced lava rubble at top or bottom but including altered flow-tops (usually vesicular). SL lateral extents are not reported in this work and knowledge of these is sparse. The thickness of any small and/or thin precursor or breakout lobes associated with SLs were measured separately and the data included as independent lava lobes. The main challenge when measuring thicknesses of lava lobes is to capture the full range of lobe sizes. In our logs, we measured the thicknesses of small HP-type lobes on a few characteristic lobes and the thickness of the whole HP-dominated part of the sequence. Although this provides a first-order estimate of HP lobes and small-lobe-dominated portions of SLs, we anticipate that small lobes are overall likely under-reported in our analysis. We also note that the thickest lobes are rarely completely exposed due to limited outcrop size and/or accessibility (e.g., as at Arthur’s Seat in the Deccan, Figure 2B; Supplementary Figure S1), and that the thinnest lobes occur in such abundance that measuring a significant thickness of lava lobe-by-lobe is a daunting task. Moreover, piles of thin lobes are often severely weathered. We thus realize that in plots of numbers of lobes of various thicknesses, both the extremes in size are not as well represented as the middle parts of the size distribution.
In our Deccan dataset, flow lobes <2 m were measured by hand using a tape measure and the thicknesses are good to ±∼ 10 cm (1 cm for the thinnest lobes). For thicker lobes, the thickness was calculated using a barometric altimeter for each individual sheet lobe using the elevation at the top and bottom of each lobe. This choice helps minimize any errors due to instrument drift throughout the day due to changing temperature. Given the lack of accurate topographic maps, we anchored the elevation of the top, bottom, and middle of each traverse, such as Ambenali Ghat, using a differential GPS which we left running for up to 3 h. Almost all lobes reported are complete, but we did measure a few partial lobes to capture the highest end of the thickness spectrum. In these cases, virtually the whole lobe was measurable, and the sparse number is not expected to make a difference to the top end of the reported thickness spectra for the Deccan, Karoo, or CRB data sets.
We find no significant statistical difference between data obtained from surface exposures vs. those from cores drilled through the lava piles (when comparing results from the same geochemical formations), even though traverses through surface-exposed lava piles often stretch for many kilometers laterally (Figure 1B).
Lava-lobe thickness data from the Deccan are plotted in various ways; we give more details on the Deccan set as all others follow with similar plots. The ways are: lobe thicknesses of individual lobes vs altitude above sea level (as a measure of stratigraphic height); plots of lobe thickness vs. number-of-lobes-in-each-thickness-bin; and also as an univariate kernel density estimator to calculate the probability density function of lava flow thicknesses in a data set. This latter plot gives an immediate, useful view of the whole thickness distribution. We also present “violin” plots where the thickness distribution is represented in the vertical (y) and the number of measured lobes is expressed in the horizontal (x) axis.
Thickness data plotted against elevation, equivalent to stratigraphy in many parts of the 66.4-65.5 Ma-old Deccan Province (Sprain et al., 2019), including a subdivision of the lava pile into formations (Figures 3B, 4A,B), show that measured Deccan lava lobes vary from < a few m thick to ∼ 90 m thick (the latter in the Mahabaleshwar Formation). The stratigraphic subdivision shown is that for the recognized chemostratigraphic Deccan formations. Although the lithostratigraphic subdivision (after Godbole et al., 1996) is also used in the literature (e.g., Verma and Khosla, 2019), it is not as well developed as the chemostratigraphic formations and we thus do not use it for the analysis here. The plots on Figure 4A are arranged by latitude of the traverse (top = N, bottom = S) and the main weathering horizons (boles) recognized in the lava pile are shown by vertical red lines. The bole data are by no means complete and no significance should be placed upon it, other than in a first-order sense (see comments below). Gaps in the data indicate gaps in exposure on the traverses. Further, the data come from a small region of the central Western Ghats of western India in Maharashtra State, so there could be regional bias (Figure 1B).
One limitation of our present Deccan data is that only one traverse (Matheran) includes the lowest chemostratigraphic formations (Kalsubai Sub-group). This lack will be addressed in future work. Nevertheless, it can be seen (Figure 4A) that all formations logged have small lobes, and all formations except Khandala have at least one small-lobe-dominated section. Note that the Ambenali Ghat traverse covers over twice as much elevation as the others, and this ghat is, in fact, the informally recognized Western Ghats “type section” on which much work has been based (e.g., Beane et al., 1986; Mahoney et al., 1982; Chenet et al., 2008; Jay et al., 2009). Thicknesses of lobes within and among formations do not vary greatly, with all formations except Neral, Bhimashankar, and Khandala having lobes at least 40 m thick. Based on our two traverses that include significant Kalsubai (lowest) and Lonavala (middle) Sub-group lava sequences (Matheran and Varandah Ghats), there appears to be a slight prevalence for small-lobe-dominated (or hummocky phh) lavas in those formations, in accordance with previous studies (e.g., Bondre et al., 2004).
Figure 4B plots lava lobe thicknesses mainly from the Wai Formation in the same scheme as Figure 4A to examine possible lobe thickness variations over 80 km distance from N to S. No strong pattern of variation is evident, yet southward could be more distal from some suggested sources areas (Vanderkluysen et al., 2011). We also see that the altitude of the Ambenali-Mahabaleshwar contact varies by more than 50 m in a relatively small region (also see Figure 2C) thus illustrating that using altitude for large scale correlation is potentially problematic.
Furthermore, we can use the Ambenali-Mahabaleshwar contact height and the location of Chron 29N-Chron 29R transition as well characterized time tie-points to assess whether flow lobe characteristics (number, thickness, small-lobe-dominated fraction) are spatially variable. We find that among sections, the number of flow lobes varies from 2 to 5 with thicknesses ranging from 5 m to 35 m with some sections having small-lobe-dominated flows (e.g., Kelgar, Tapola, Wai-Panchgani) while others do not (e.g., Ambenali Ghat, Khumbarli Ghat). There is no clear relationship between flow lobes in individual sections which suggest that lava flow morphology characteristics can significantly vary over small spatial distances (compared to the scale of the overall CFB province). A mild southerly dip to the lava pile of 0.5–1° in the study area (Mitchell and Widdowson, 1991) explains why the older formations appear in the north and why stratigraphically higher formations occur at progressively lower elevations southward. The types of lavas plotted in Figure 4B can be seen in the logs in Supplementary Figure S1.
The whole range and modes of lobe thickness in each Deccan formation (Figure 5A) and sub-group (Figure 5B) are shown as univariate kernel density estimators to calculate the probability density function (PDF) of lava flow thicknesses in a data set. In these plots the thickness is plotted against the PDF and the area under the curve totals to 1; the range and mode of the PDF is conveniently seen, and the formations or sub-groups can be easily compared. The number of lobe occurrences in each thickness bin is plotted on the y axis. The “thick tail” of the PDF represents the thickest SLs. Formations with bimodal plots, such as the Bushe, appear to have a mode in the HP range and another in the SL range. We find that all formations, bar one, have lobes covering the whole range of thickness up to 30 m, and one formation (Mahabaleshwar) covers the entire range up to 90 m (see also Figure 4). The Bhimashankar Formation, which is very thin (∼ 35 m in the Matheran traverse, Figure 4A) and composed of only a few lobes, is the exception having a maximum SL thickness of 14 m (Figure 5A). There is clearly a mode in the 20 ± 5 m range in all formations (except Bhimashankar – measured on one traverse only which is possibly not diagnostic) that represents typical SL sizes with a rarity of much thicker lobes. The smallest lobes, individual precursors to or breakout from SLs and from HP lobes, are in the range of a few m in each formation. Thus, overall, there is only a weak relationship between formation and lobe thickness, which is also explored in later plots. The thickest SLs are generally in the range 50–60 m for the Wai Sub-group and Bushe Formation lavas, but smaller for the others, especially those from the Kalsubai Sub-group, which range around 30–40 m and make up smaller proportions of the PDF.
FIGURE 5. (A) Plots of univariate kernel density estimators to calculate probability density function (PDF) of lava lobe thicknesses in Deccan data set. Vertical scale is % of PDF with area under PDF curve normalizing to one. Result for each recognized formation is arranged from youngest to oldest (top to bottom) with ticks at base of each plot showing actual value of measured lava lobe thicknesses. (B) Univariate kernel density estimator to calculate probability density function (PDF) of lava lobe thicknesses in accumulated formations within each Deccan subgroup, see Figure 3B). Plot gives useful view of whole thickness distribution at a glance: middle (Lonavala) subgroup has one modal lobe thickness of ∼18 m and another at ∼50 m; lowest (Kalsubai) subgroup has smallest modal lobe thickness and coarse tail extending toward 50 m; upper (Wai) subgroup has same median thickness as middle subgroup and coarse tail extending toward 100 m. Each subgroup has small lobes and lowest one contains highest percentage.
Whole sub-groups of the Deccan have indicative thickness PDFs (Figures 5B, 6B) that support some of the conclusions of previous studies (Bondre et al., 2004), in that the lower, older sub-group (Kalsubai) formations together have the most peaked and thinnest mode, and the upper sub-group (Wai) has the broadest mode with a mean thickness similar to that for the middle sub-group (Lonavala) formations. This reflects that the Kalsubai subgroup may overall be composed of more HP-type lava flow fields than the upper two sub-groups but testing the reality and details of this suggestion require further work. The coarse lobe mode in the Bushe Formation data (Figure 5A) suggests that there may be a genuine bimodal aspect to that formation’s thickness characteristics, although more measurements are needed to confirm this inference.
FIGURE 6. (A) Violin plot of flow lobe thickness variation (y axis) vs formations in various traverses through DVP lavas of Western Ghats (x axis). Width of violin represents amount of data for each formation and thickness range encapsulated in vertical distribution. White dot marks mean of distribution and black bar 75th – 25th percentile range. (B) Same as Figure 5B, but with PDF for two Koyna area cores added (Koyna); note similarity with upper (Wai) sub-group PDF. In addition, flow lobe thickness datasets shown for Killari region (South-Eastern Deccan Plateau, Wai subgroup flows), and Deccan sub-Provinces (Mandla, Malwa, Narmada-Tapi Rift Zone = Satpura, and North Western Deccan = Cambay Rift Zone/Saurashtra, seeFigure 1A).
An overall comparison of the Deccan lobe thickness data is seen on a “violin” plot (Figure 6A), where the lobe thickness variation (y axis) is plotted by the different formations in the various traverses (x axis). The width of the violin represents the amount of data for each formation and the thickness range is encapsulated in the vertical distribution. A white dot marks the mean of the distribution and a black bar the 75th – 25th percentile range. The prevalence of 20–30 m thick SLs is evident, with the traverse composed of older lavas (Matheran, including Kalsubai and Lonavala Sub-groups) having slightly smaller means, but not by a marked amount. The plot clearly shows that the thickest SLs are in the minority in terms of occurrence. Additionally, the figure illustrates that lobe thickness distribution for a single formation can be variable across different sections further illustrating the spatially variability of flow morphology in DVP even on a small regional scale.
An independent Deccan data set comes from lobe thickness measurements on drill core obtained from the Koyna area in the Western Ghats (Sinha et al., 2017; Mishra et al., 2017), near to our Khumbarli Ghat traverse. Although the cored lava formations are not named in these papers, the local geology suggests they are Wai Sub-group (Duraiswami et al., 2017). The distribution of SL thicknesses is like our Wai Sub-group data, seen on Figure 6B, with a mean and mode around 18–20 m. A maximum reported lobe thickness of 165 m for one lobe in the Koyna cores must be treated with suspicion as no other lobes of comparable thickness have been found in our work, but it could be real. We also show lobe thickness distributions from other regions of the Deccan in Figure 6B. Killari is located in the Central Deccan region and is considered part of the eastern extent of the Wai Subgroup flows (Jay and Widdowson 2008). However, we find that SL thickness is distinctively different from the Wai lavas with much thicker lobes in the Killari region. This could potentially indicate an effect of changing flow-lobe thickness with distance from the eruptive center, but we do not have good constraints on the eruptive locations (Vanderkluysen et al., 2011; Kale et al., 2020a). By contrast, the flows in the north-western Deccan (Saurashtra region) are similar to the oldest Western Ghats flows (Kalsubai group) in terms of lobe thickness (Figure 6B). From our data compilation, we find that lava flows in the northern Narmada-Tapi Rift Zone as well as the Malwa Lobe region have a similar modes of lobe thickness (∼ 20 m thick) to the Western Ghats flows. The flows in this region are most like the Wai Subgroup flows in terms of their thickness distributions. Finally, the Mandla Lobe flows have slightly thicker lobes (mode of ∼ 25 m) than the Wai Subgroup flows with a distinct lack of thin (<5 m) lobes.
We use measured sections on three Karoo 182–183 Ma-old CFB province phh lava successions from Moulin et al. (2017), Jay et al. (2018), following Figure 4 of the latter reference. The successions are at Naude’s Neck, Oxbow, and Moteng Pass. There are no significant differences between lobe-thickness distributions at each location. Overall, the mean size of lobes appears to be thinner than in the Deccan. Almost 50% of the lavas logged by Jay et al. (2018) are HP, a higher proportion than in any Deccan formation (Figure 7A vs. Figure 4A). The PDF of the size distributions at the three locations shows the similarity and mean size of sheet lobes, around 12–15 m: Figure 7B). A few SLs ∼ >30 m thick exist, and the violin plots of all locations (Supplementary Data Sheet S2) show how similar the means of the size distributions are, with Naude’s Nek lava lobes being a little thinner than the others.
FIGURE 7. (A) Plots of lobe thickness for Lesotho part of Karoo CFB Province from Jay et al. (2018) and Moulin et al. (2017) plotted as function of altitude above mean sea level; width of bar = lobe thickness. Groups shown by bar color (see key in B); + open dots = with small lobes; + stars = small-lobe-dominated. Red vertical lines = boles (weathering horizons, note bole line thickness not to scale). (B) Plots of univariate kernel density estimators to calculate PDFs of lava lobe thicknesses of three Karoo sequences. Note relative similarity of the three distributions, due to SLs from 15 to 18 m thick, with Naude Nek lobes being a little thinner due to prevalence of HP lobes down to a few meters thickness.
Data from the CRB Province are assembled at the formation level for comparison purposes with thickness data from the Deccan (Figure 8A). We present data for the Grande Ronde Basalt and Wanapum Basalt Formations, the two lava formations emplaced at the climax of CRB volcanism, between 16.5 and 15.9 Ma ago (Barry et al., 2010; Kasbohm and Schoene, 2018). Figure 8A shows that the PDFs for size distributions of whole formations are quite similar, with a mode at around 15 m for thin SLs and another mode for thicker SLs in the Grande Ronde. One advantage of displaying CRB data is that, uniquely in global LIPs, the components are known down to the level of individual flow-fields. Thus, in Figure 8A, we can see that Wanapum Basalt shows quite considerable variation between the different members comprising the formation: the Roza, Gingko, Sand Hollow, and Palouse Falls plots are all single flow-fields and are members of the Wanapum Formation; Wallula Corehole comprises data from several Wanapum members, and Grande Ronde and Wallula Grand Ronde plots are collective for the Grande Ronde Basalt Formation, and thickness data are quite similar to each other. Figure 8B displays PDFs of the same data as Figure 8A showing clearly that most CRB data is for SLs, with HP-thickness lobes in the minority.
FIGURE 8. (A) Plots of univariate kernel density estimators to calculate PDF of lava lobe thicknesses for individual Wanapum Formation eruptive flow-fields (Palouse Falls; Gingko; Sand Hollow; Roza), Wanapum Formation data collectively, and Grande Ronde and Wallula Grand Ronde Formations; both the latter plots are Grande Ronde Basalt Formation (see text) from the Columbia River Basalt Province. (B) Summary PDFs of lava lobe thicknesses for individual Wanapum eruptive flow-fields (Palouse Falls; Gingko; Sand Hollow; Roza), Wanapum Formation data collectively, and Grande Ronde and Wallula Grand Ronde plots, which are Grande Ronde Basalt Formation (see text). (B, inset) shows plot of univariate kernel density estimators to calculate PDF of lobe thicknesses for lavas of Kimama Borehole, Snake River Plain (after Potter et al., 2019); note thinness cf. Columbia River Basalt data.
Lobes in the flow-fields of the Palouse Falls and Sand Hollow eruptions are recognized to be composed mainly of coarser SLs, while the Gingko flow field has more small SL lobes than most CRB flows, with Roza lobes falling a little thicker in typical SL size than Gingko (Vye-Brown et al., 2013). Overall, the PDF plots show that CRB flow-lobes consist of a higher proportion of thicker lobes than both Deccan and Karoo Provinces (there is a bigger % of the PDF curve under the 30–60 m range). In other words, the CRB possesses a higher proportion of thicker sheet lobes than the Western Ghats region of the Deccan but, as such a small part of the Deccan is considered by our data, these claims may not be sustained after future work.
For the Snake River Plain Province lobe thickness data, an example of “plains”-type volcanism logged in the Kimama borehole by Potter et al. (2019), it is clear (Figure 8B inset) that the modal size of lobes is considerably smaller than in the CRB. In fact, this thick pile of basalt, which accumulated over ∼ 6 Ma, is almost all HP in nature. There is a strong mode in the 2–3 m thickness range and little of the PDF distribution in the thick range (extending only up to 20 m). This contrasts strongly with the nearby CRB and the Deccan, as expected.
The Deccan, Karoo, and CRB represent our primary data in this study since the datasets were all collected in a relatively homogeneous manner by the authors. For other CFBs, the data quantity and quality are more variable. In the following, we discuss compiled data from other provinces in order of decreasing LIP age using only PDFs of size distributions. As much as possible, we have tried to utilize a consistent terminology for defining what constitutes a lava lobe based on published stratigraphic logs.
Physical aspects of the 257–260 Ma-old basalt lavas of the Emeishan Province of China have been studied in several sections (Huang and Opdyke, 1998; Ali et al., 2002; Liu et al., 2012; Xu et al., 2018) and modal PDFs of size distributions of the lobes consistently show them to be around 5 m for one location. Other locations have modes of ∼ 12–15 m, with occasional thicker lobes up to 80 m, and even reported up to 150 m (Figure 9A) in others. It is not known if the thinner lobes constitute HP-type “compound” lobes or very thin SLs given the lack of relevant information in the published studies.
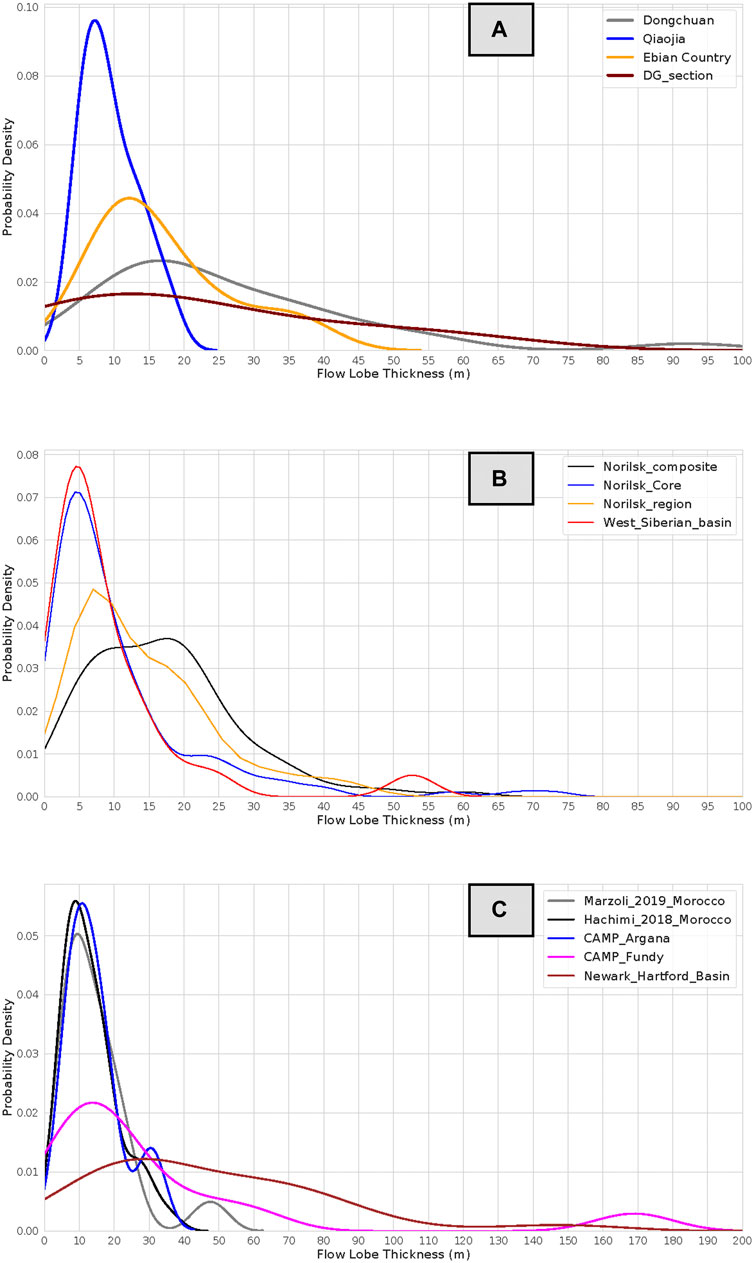
FIGURE 9. (A)Plot of univariate kernel density estimators to calculate PDF of lobe thicknesses for lavas of Emeishan CFB Province, China, from 4 different areas; see text for details. (B) Plot of univariate kernel density estimators to calculate PDF of lobe thicknesses for lavas from Siberian CFB Province, Russia; see text for details. (C) Plot of univariate kernel density estimators to calculate PDFs of lobe thicknesses for lavas of CAMP Province in Morocco (including Argana Basin) and NE North America (Newark and Fundy Basins).
Lobe thickness data from the 251 Ma-old Siberian Traps are available from a cored drill hole at Norilsk (Mikhaltsov et al., 2012) and in the West Siberian Basin (Reichow et al., 2005), as well as two datasets from surface lava flow exposures in the Norilsk region (Heunemann 2003; Krivolutskaya et al., 2018), see Figure 9B. The two core datasets both show a mode in the region of 5 m. It is not known whether these are HP or thin SL-type lavas, but there are a few lobes reported to be in the 20–80 m range. By contrast, the lobe thickness for the surface Norilsk lava flows is much greater with a mode from 8 to 20 m thickness, more analogous to other CFBs. Although each of the datasets have a few exceptionally large lobes (>80 m thickness), we are unsure whether these measurements are accurate or are instead biased due to missing exposure.
There are a few measurements of lobe thicknesses from the 200-Ma-old CAMP lavas. Those from Morocco show modes of PDFs of 8–10 m (Figure 9C), presumably thin SLs, with thicker lobes in places up to 50 m (Argana, El Hachimi et al., 2011; Marzoli et al., 2019). This suggests that the sequences in Morocco are dominated by thin sheet lobes, but in NE North America much thicker CAMP lobes have been recorded, with thicknesses of lobes from 60 m up to 180 m in the Newark and Fundy basins (e.g., Phillpotts, 1998; Whiteside et al., 2007: Olsen, 1980, Olsen et al., 1989; Schaller et al., 2011; Puffer et al., 1992; Puffer et al., 2018), and these are convincingly inflated SLs.
The North Atlantic Magmatic Province (NAMP) is represented by lavas from the Faroe Islands, the seafloor around that area, and a section from West Greenland. Faroes lavas were erupted subaerially around 55–57 Ma ago (Cramer et al., 2013). Basalt lava lobe thicknesses have been provided for various cored formations (Nelson et al., 2009; Boldreel, 2006; Bücker et al., 1998) and for exposures on the islands (Passey and Bell, 2007), see Figure 10A. Workers describe some formations as formed of SLs, with another of HP lavas, and another of an alternating sequence of the two: Beinisfjord Fm = SLs; Malistindar Fm = HPs; Enni Fm = alternating. Lopra borehole, which is on-land Faroes, mainly penetrated the Beinisfjord Fm (SLs); this is borne out by the data which shows lobes of mode 15 m, extending up to 60 m, like Deccan SLs. Thickness data presented for lobes in HP-dominated flows are few and ambiguous. The Enni Formation (Millett et al., 2017) shows a smaller mode than that dominated by SLs but with a tail extending to thick SL dimensions., as expected.
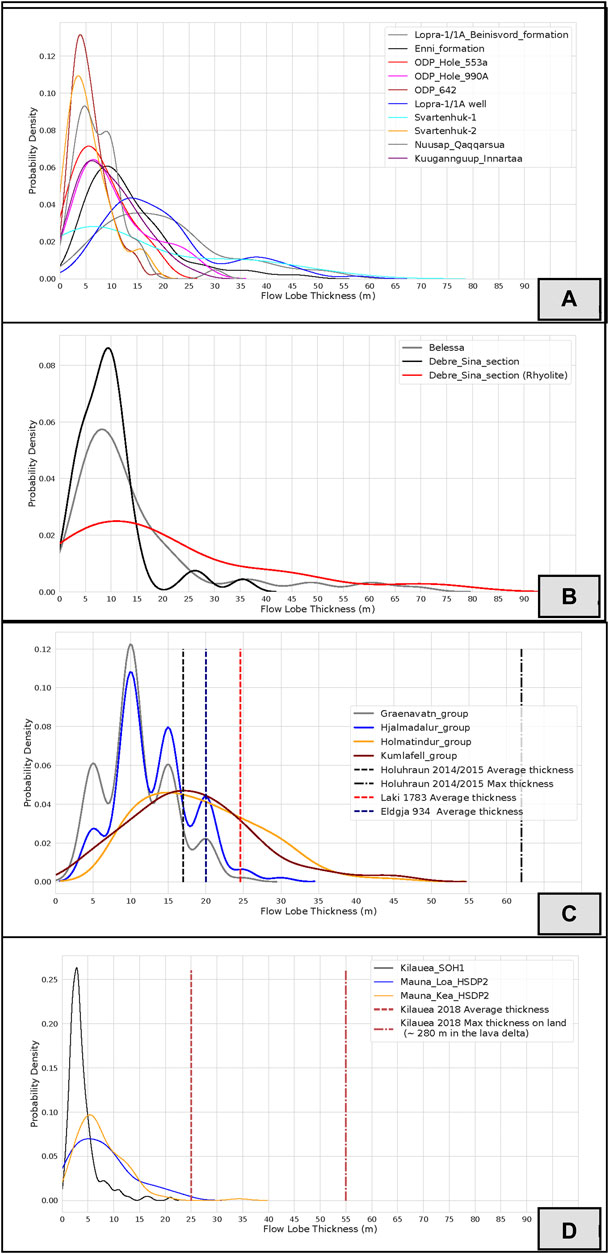
FIGURE 10. (A) Plot of univariate kernel density estimators to calculate PDF of lobe thicknesses for NAIP formations in Faroe Islands, West Greenland, and the North Sea floor (ODP data); see text for details. (B) Plot of univariate kernel density estimators to calculate PDF of lobe thicknesses for lavas from Ethiopian Traps; see text for details. (C) Plot of univariate kernel density estimators to calculate PDF of lobe thicknesses for lavas from the Neogene Flood Basalt Province in Iceland along with typical flow lobe thickness for a few modern eruptions. See text for details. (D) Plot of univariate kernel density estimators to calculate PDF of lobe thicknesses for lavas from island of Hawa’i, including Mauna Loa, Mauna Kea, and Kīlauea. See text for details.
West Greenland and seafloor NAMP lavas recovered from Ocean Drilling Project cored holes (Planke, 1994) have thinner lava lobes in general (also see Figures 10A), the size of which overlap with the thinner lobes from the Faroes, described as “compound-braided pāhoehoe” (Passey and Bell, 2007). These would be termed HP lavas by the terminology used in this study. The age and relationship of these lavas to the whole Faroes Group is not well determined.
Geochronology of the Ethiopian Traps has shown lavas about 29–30 Ma by the Ar-Ar method (Rochette et al., 1998) and lobe thicknesses are available for two sites, Belessa and Debre Sina (Lhuillier and Gilder, 2019). The two sites show remarkably similar thickness variations among the flow lobes (Figure 10B), with a distinct mode in the PDF in the 8–10 m range, and a strong tail toward SLs as thick as 80 m. The bulk of the measurements are in the thinner range, but it is not known whether these are thin SLs or thicker HP lobes. Overall, the lobe thickness range is like that seen within the Deccan except that the main modal thickness is a little thinner than Deccan SLs and thicker than Deccan HP lobes.
Lobe-scale data on subaqueous LIPs are rare (Deschamps et al., 2014) but there is a little on the 125–120 Mya Ontong Java Plateau (Inoue et al., 2008). On Malaita Island, individual pillowed and non-pillowed basalt sheets vary in thickness between 60 cm and 80 m; about 50% of measured basalt sheets are 5–10 m thick, and >95% are less than 25 m (Petterson, 2004), similar to subaerial LIPs. Given the lack of detailed stratigraphic sections in the study, we did not plot any Ontong Java data.
For another comparison to CFBs, we also show data for the Icelandic Neogene flood basalt province which represents some of the oldest sub-aerial exposures from northwestern (∼ 17 Ma, Riishuus et al., 2013) and northeastern Iceland (∼ 14 Ma, Martin and Sigmarsson, 2010). Similar to other larger flood basalts, these lavas are hypothesized to be primarily erupted from dike-fed fissures and are mostly tholeiitic basalts (Walker, 1964; Gibson, 1966). In Figure 10C, we plot data from detailed stratigraphic logs from northeastern Iceland of the Kumlafell Group, Hólmatindur Group, Hjálmadalur Group, and the Grænavatn porphyritic basalt group (moving stratigraphically upward, Óskarsson and Riishuus 2014 , Óskarsson et al., 2017). The mode thickness for Icelandic Neogene basalts ranges from 15 m (for the first two stratigraphic groups) to 10 m (for the upper two groups). Thus, overall, the lobe thickness range is like that of Deccan SL-dominated sub-groups.
Hawai’ian lava lobe thicknesses from Kīlauea, Mauna Kea, and Mauna Loa are reported by Katz and Cashman (2003) for flows in the HSDP1 and SOH-1 cores collected on the Big Island (Garcia et al., 2007). While obviously not CFBs, these are shown here because various authors have alluded to similarities in emplacement style between Hawai’ian and CFB lava flows (e.g., Hon et al., 1994; Self et al., 1997; Sheth 2006). Kīlauean lobes are the thinnest of the Big Island volcanoes with a strong PDF mode at 3 m and a small coarser tail toward 20 m (Figure 10D). Mauna Loa and Mauna Kea PDFs show a broader size distribution, with stronger tails toward thicker lobes, possibly SLs, but, again, with few lobes thicker than 20 m. The modal lobe thickness is 8 m for the two large shield volcanoes, contrasting strongly with that of Kīlauea. Overall, Hawaiian SLs are thinner than in most CFB provinces, and HP lobes are also thinner, especially for Kīlauea. Much more data are needed to make a definitive case for these relationships.
Finally, we also plot the thickness of flow-fields, rather than individual lobes, for a few prominent historical basaltic eruptions – the Laki 1783 eruption, the Eldgjá 934 eruption, the Holuhraun 2014/2015 eruption (from Iceland), and the Kīlauea 2018 eruption (Lundgren et al., 2019, both average as well as the maximum on-land thickness near the vent). It is noteworthy that the typical flow field thicknesses for modern eruptions are like the mode of lava lobe thickness in the Deccan and CRB, as well as the Karoo, provinces. This potentially suggests that typical flow-lobe thickness for CFBs do not require extra-ordinary large eruptive fluxes per se, based on modern analogs. It is unclear whether the typical thickness implies a typical flow rate for all CFBs or a rheological/physical constraint on the thickness to which sheet lobes can inflate.
With our full dataset, we can start comparing lobe thickness distributions for various CFBs. We note that some data sets have few measured lobes compared with others (see Supplementary Figure S2A and Figure 2B) and some warnings are given about this when the corresponding results are discussed. We display summary data on Figure 11A as thickness ranges per province or formation (with a range from 0–80 m), and on Figure 11B as “violin” plots scaled to equal width so that the total ranges can be more easily appreciated. The homogeneity of data sets from various CFB provinces is encouraging, meaning that workers in different provinces are recognizing the same features to enable them to separate the lava piles into lobes. Differences and similarities between data sets can be interpreted within currently used knowledge of lava morphology and appear to make sense. This is the first compilation of lava lobe thicknesses from CFBs and other basaltic provinces and should serve as a basic data set for future work.
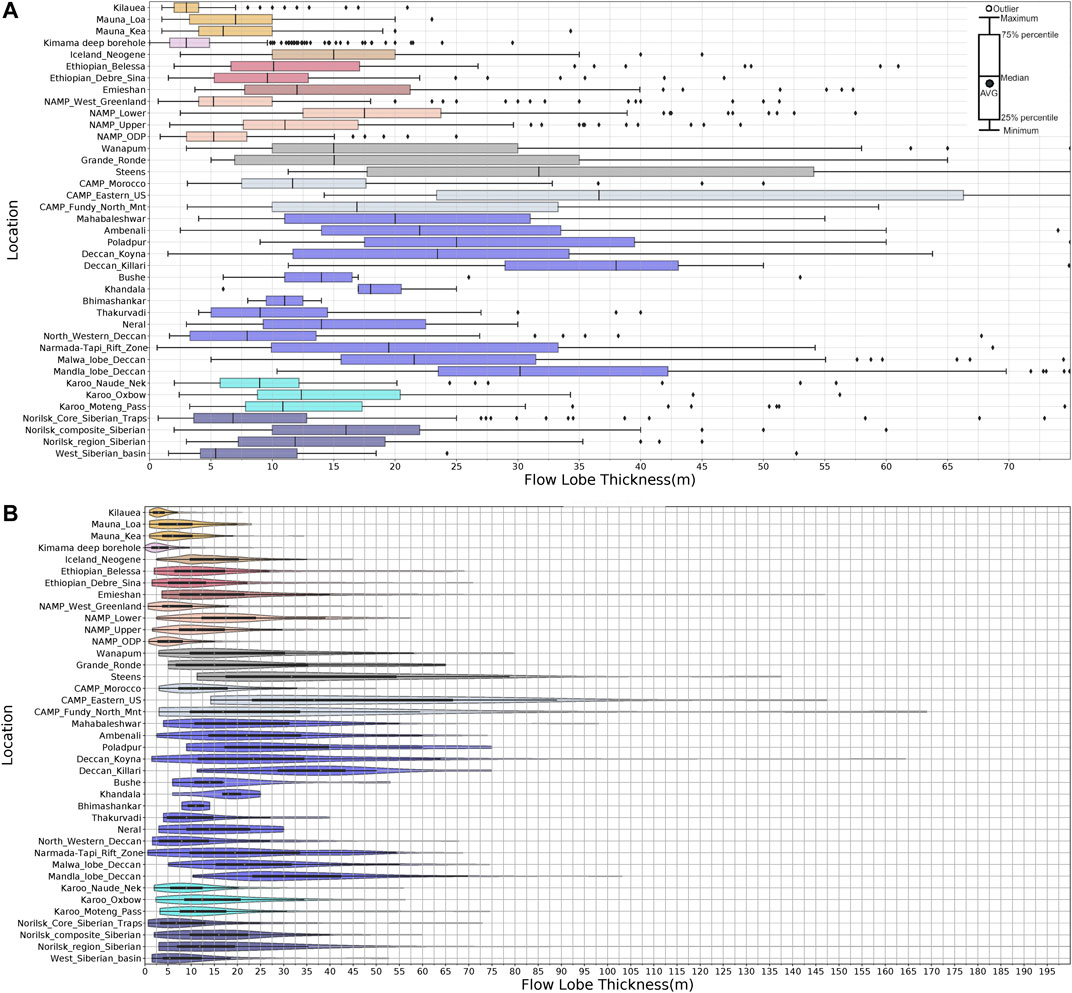
FIGURE 11. (A) Box plot of lobe thicknesses in various CFB provinces, formations, and volcanoes for which data is available vs thickness of lobes. CFB provinces color-coded so that formations of each province have same color (and same colors as Figure 12). Bar in box is median (50th percentile); ends of box are 25th and 75th percentile; whisker ends are 5th and 95th percentile, and dots are outlying thicknesses of whole lobe thickness distribution for each entry. Data cut off at 75 m thickness; see (B) for whole range. (B) Violin plot of lobe thicknesses in various CFB provinces, formations, and volcanoes for which data is available vs thickness of lobes. Violins scaled to equal width so that total ranges more easily seen; as (A) for colors. White dot inside violin is median (50th percentile); ends of box are 25th and 75th percentile; line ends are 5th and 95th percentile; rest of violin encloses all data of whole lobe thickness distribution for each entry.
The obvious difference is that non-CFB volcanoes (sensu lato) are generally constructed by thinner lobes than those found in most CFB provinces. Thus, Hawai’ian and the Snake River Plain basalts (Kimama borehole) lobe thicknesses stand out from CFB data on Figures 11A,B, having modal lobe thicknesses of 3–7 m. We must also remember, for CFBs, that measured thinner lobes are under-represented due to the large number of lobes involved in HP sequences. A few CFBs have equally thin lobe sets to those from non-CFB provinces, namely the Siberian core-hole for which data exists, and NAMP lavas sampled in sea-floor sequences and on West Greenland.
The mode of most CFB data sets ranges from 15–20 m (Figure 11). These are known to be SLs in the Deccan, Karoo, and CRB, and are assumed to be sheet lobes in other provinces. While very thick SLs may only occur in CFB provinces, those over 40 m thick are rare (usually outside the 75th percentile) in all provinces other than part of CAMP; for the NE North American CAMP lobes the number of measurements is small and the point about thicker lobes needs further substantiation. Overall, most CFBs have generally thicker lobes than non-CFB systems, while some CFBs have equally thin lobes to non-CFB provinces. Whether this is a product of emplacement mechanism and rates, or not, awaits further data being available in the future.
Deccan data clearly show that lobes in the upper three formations, Mahabaleshwar, Ambenali, and Poladpur (constituting the Wai Sub-group) have thicker median and modal thicknesses than the lower formations. Cores from the Koyna area have the same range as the exposed Wai Sub-group flows which is consistent with the corresponding location of the Koyna cores in the geochemical stratigraphy Duraiswami et al., 2017). However, all formations in the cores contain lobes with smaller thicknesses, like those of the lower formations. Thick SLs (>65 m) are outliers to the size distribution in all Wai Sub-group lavas.
The Lonavala Sub-group is formed by the Bushe Formation, which has a similar lobe-size distribution to the Wai lavas except for lacking lobes >∼ 20 m thick, and the Khandala Formation, which has a similar lobe-size distribution to the Wai lavas except for lacking thin lobes (but this is based on measurements in one traverse only). The lowest recognized Kalsubai Sub-group lavas range from lobes of similar thicknesses (Neral and Thakurvadi Formations) to the Wai Sub-group, to being of limited size-range (Bhimashankar Formation), but, again, data are few for the latter. Further, the whole data set under-represents the thinnest lobes, such that the modes of the Kalsubai Sub-group may be smaller than shown, and all Kalsubai modes are thinner than the rest of the Deccan dataset. From this we confirm past suggestions (e.g., Bondre et al., 2004) that the distribution of “compound lavas” (our thin, HP-type lobes) is due to the outcrop pattern of the stratigraphy of the Deccan and not proximity to source vents (Raja Rao et al., 1999).
Thickness ranges for the Wanapum and Grande Ronde Formations (together forming 87 vol% of the CRB province) are similar and are also like the Wai Sub-group of the Deccan, all dominated by SLs. Still, thin lobes down to <3 m thickness do exist in these CRB and Deccan formations and in the Deccan form occasional HP lava flows and/or flow-fields. Again, there is no correlation between the occurrence of HP-type lobes and proximity to source in the CRB. Data from the Karoo lavas are skewed toward thinner lobes (modes of 8–12 m) but are a mixture of HP and thin SLs according to Jay et al., 2018 and Moulin et al., 2017. These measured lavas are from one area in the Karoo Province, so may have a locational bias and not be typical of other areas of the Karoo. The relationship to source vents for the Karoo lavas is not known but Jay et al. (2018) work suggests the same conclusion as for the Deccan data, that HP-type lavas are not an indicator of proximity to source. In fact, the presence of flow-lobe tumuli in the Karoo lavas led Jay et al. (2018) to propose that the Naude Nek site was distal from source vents.
Other thickness data sets from CFB provinces are more data-poor and perhaps less representative of the whole province. Some e.g., the Siberian Traps borehole, must be locationally biased, having only thin lobes, whereas a full range of lobe thicknesses might be expected in such a major LIP (Figure 9B).
Figure 11B extrapolates the lobe data ranges to include thickest outliers. It can be seen that CAMP NE North America (including Fundy and North Mountain, Canada; Kontak, 2008) has the thickest lobes, all nominally SLs, but this may be a reflection of the concentration of studies on thick lobes which contain interesting post-emplacement features, while passing over thinner lobes? Further, perhaps parts of such an old province constituted of small and thin lobes are ill-exposed or preserved, as proposed for parts of the Deccan. These CAMP locations contain the thickest SLs in the whole data set, with occasional lobes approaching 200 m thick in two locations (Hartford; Philpotts, 1998, and Fundy; Dostal and Dupuy, 1984). It is also noteworthy that these large lobe thicknesses are comparable to the large offshore thickness of Kilauea 2018 flow-field (∼ 280 m). This suggests that, potentially, the presence of a specific topographic break may have been responsible for the anomalously thick lobes associated with CAMP. Moreover, as sills and dykes occur in the same region (Puffer et al., 1992; Philpotts, 1998) these thickest lobes may have a connection with distance to source i.e., they accompany each other? This conjecture is worthy of further exploration but does not hold for the CRB and Deccan province lavas.
In order to quantitatively compare flow-lobe thickness across various CFBs, and accounting for the different flow numbers (and section thicknesses – see Supplementary Figure S2), we use the Anderson-Darling (AD) test statistic (Scholz and Stephens 1987) and the Epps-Singleton (ES) test statistic (Epps and Singleton 1986) to test the likelihood that every two corresponding datasets (shown in Figure 11) have the same underlying probability distribution (while accounting for the different number of samples in the two datasets). The AD test is more sensitive toward the comparing the tails of the distribution for the two datasets while the ES test is biased toward the comparing the mean value of the datasets. We use the results of the pair-wise likelihood results (either ES or AD statistic) for all datasets as the distance metric to perform hierarchical clustering for our lava-lobe thickness dataset (Virtanen et al., 2020; Huerta-Cepas et al., 2016; Figure 12). These results provide a clear, quantitative way to group various CFBs and nicely illustrate that the Kilauea and Kimama borehole datasets are distinct from those of CFBs (Figure 12). Furthermore, some of the large geochemical or stratigraphic units in CFBs, Grande Ronde Formation and Wai Sub-group, or Ambenali and Mahabaleshwar Formations, as well as the North-Eastern US CAMP sections, are a distinct group. This suggests some characteristic change in lava flow emplacement properties and allows a future analysis of relationships between lava flow-field volumes, differences in lava geochemistry, and LIP associated climatic perturbations.
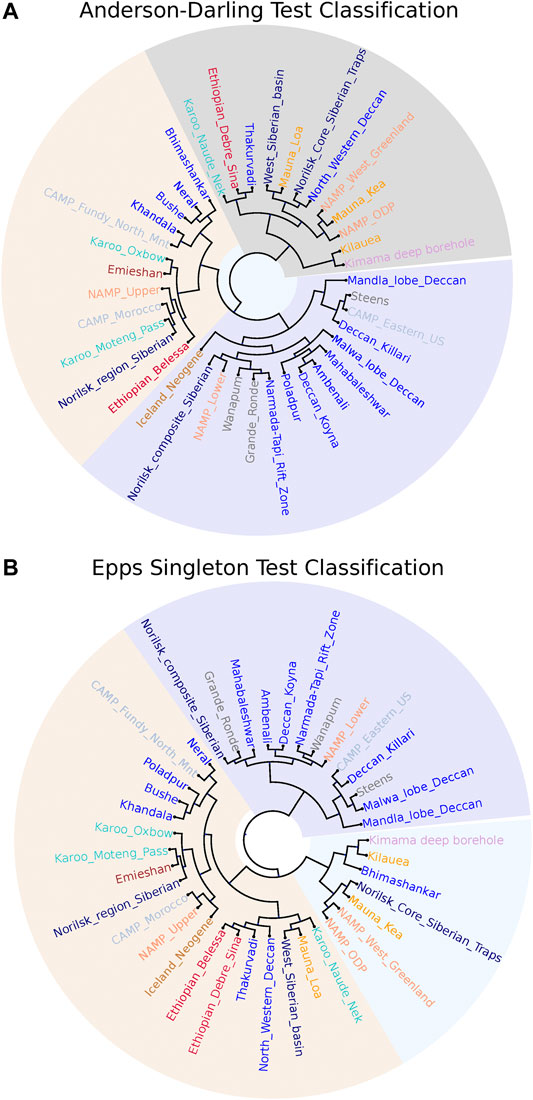
FIGURE 12. (A) Clustering of flow lobe thickness distributions using distance metric based on Anderson-Darling statistical tests. CFB provinces are color-coded so that formations of a CFB Province have the same color (same colors as Figure 11). CFB Provinces are clustered into three distinct sub-groups highlighting classes of PDFs. (B) Clustering of flow lobe thickness distributions using distance metric based on Epps Singleton statistical tests. CFB provinces are color-coded so that formations of a CFB province have the same color (same colors as Figure 11). CFB provinces are clustered into three distinct sub-groups highlighting classes of PDFs.
We have summarized quantitative differences in terms of lava body thicknesses and types between the main formations and sub-groups of CFB provinces, especially for the Deccan Volcanic Province. The global mode for lobe thickness of pāhoehoe sheet-lobes in CFB provinces is in the range 15–20 m. The similarity of lobe thickness range for many CFB provinces underlines the similarity of processes on-going during the emplacement of these lava flow-fields, both worldwide and throughout geologic time. Furthermore, it probably also reflects the exceptionally low slopes across active LIPs. With many formations in CFB provinces displaying a range of lobe thicknesses and having hummocky-pāhoehoe-type lobes and units, it is difficult to generally accept emplacement-related criteria e.g., closeness to vents, based on lobe characteristics.
For thin-lobe-dominated, or hummocky pahoehoe (HP), flow-fields, the number of thin lobes and the mean thickness will always be under-represented because they are too numerous and/or weathered to measure accurately. HP flow-fields represent approximately 5% of the total thickness of the Deccan Wai Sub-group but up to 77% in some formations in the Kalsubai Sub-group (the latter based on one traverse only, Jay, 2005). This estimate is biased because the older Deccan formations are under-represented in our work to date. We do note that CFBs have typically thicker flow-lobe means and modes vs. Hawai’i or the Snake River Plain Province. So, on average, there may potentially be a difference in eruptive rate between these provinces. However, there is significant uncertainty from a process-scale model of what is needed to form CFB-scale inflated sheet-lobes. One can have longer-lived eruptions with 10 s of km3/year magma fluxes, or 100 s of km3/year fluxes of eruptions lasting for a shorter time, or something which has variations of eruptive flux between these two end-members (e.g., Laki 1783, Thordarson and Self, 2003; Rader et al., 2017). While some studies (e.g., Bondre et al., 2004) have argued for a relationship between eruption rates and flow lobe thickness, some other modern analog studies (e.g., Thordarson and Self, 1998) and experimental work (Rader et al., 2017) have not found a systematic relationship. Consequently, there is an open question whether lobe or flow thickness can be used to infer eruption rates, both absolutely (comparing, say, Hawai’i with a CFB province) or in a relative sense.
What gaps in knowledge exist and how this can work be applied? It is complicated to summarize single CFB province emplacement mechanisms based on good physical rationale, and single logs (small areas) can be biased and challenging from which to extrapolate. We expect some criteria expounded upon here to change, even for the Deccan, but possibly not for the Columbia River Basalt Province, with future work and data. We appeal for more data on physical lava properties from all basalt lava provinces. All data we report here are from syn- and post-Mesozoic lavas. More work is needed to compile data from pre-Mesozoic CFB province lava lobes. Some data exist but we did not expand this study to include them. Additionally, more process-based studies are required to better map the relationship between CFB lava flow morphology, particularly lobe thickness, and eruption rates.
The datasets presented in this study can be found in online repositories. The names of the repository/repositories and accession numbers can be found below: The lava lobe thickness datasets used in this study are provided as Supplementary files with the article along with Jupyter Notebooks for data analysis as well as various analysis plots for each CFB dataset. A copy of the code and the dataset is also available at: https://doi.org/10.6084/m9.figshare.13173695.v1.
SS is responsible for writing, field data collection, and formulation of the study. TM is responsible for data compilation, data analysis, as well as contribution to the writing and analysis. AJ contributed to the formulation and writing, as well as major field data collection.
SS acknowledges funding support from NSF EAR-1615021 and the Esper S. Larsen Fund of the University of California, Berkeley. TM acknowledges graduate funding support from the NSF grant EAR #1615203 and the Crosby Postdoc Fellowship at MIT. AJ has been supported by The Open University (United Kingdom), a NERC (United Kingdom) studentship, and the Daphne Jackson Trust.
The authors declare that the research was conducted in the absence of any commercial or financial relationships that could be construed as a potential conflict of interest.
We thank Mark Richards suggesting this study, and for reading and commenting upon an early version of the manuscript, and Paul Renne, Benjamin Black, Michael Manga, and Loÿc Vanderkluysen for useful discussions. We thank Andrea Marzoli and an reviewer and Aaron Pietruszka (Special Topic editor) for their valuable comments.
The Supplementary Material for this article can be found online at: https://www.frontiersin.org/articles/10.3389/feart.2020.630604/full#supplementary-material.
Ali, J. R., Thompson, G. M., Song, X., and Wang, Y. (2002). Emeishan Basalts (SW China) and the ‘end-Guadalupian’crisis: magnetobiostratigraphic constraints. J. Geol. Soc. 159 (1), 21–29. doi:10.1144/0016-764901086
Barry, T. L., Self, S., Kelley, S. P., Reidel, S., Hooper, P., and Widdowson, M. (2010). New 40Ar/39Ar dating of the Grande Ronde lavas, Columbia River Basalts, United States: implications for duration of flood basalt eruption episodes. Lithos. 118, 213–222. doi:10.1016/j.lithos.2010.03.014
Beane, J. E., Turner, C. A., Hooper, P. R., Subbarao, K. V., and Walsh, J. N. (1986). Stratigraphy, composition and form of the Deccan Basalts, Western Ghats, India. Bull. Volcanol. 48, 61–83. doi:10.1007/BF01073513
Boldreel, L. O. (2006). Wire-line log-based stratigraphy of flood basalts from the Lopra-1/1A well, Faroe Islands. Geol. Surv. Den. Greenl. Bull. 9, 7–22. doi:10.34194/geusb.v9.4855
Bondre, N. R., Duraiswami, R. A., and Dole, G. (2004). Morphology and emplacement of flows from the Deccan volcanic province. Bull. Volcanol. 66, 29–45. doi:10.1007/s00445-003-0294-x
Brown, R. J., Blake, S., Bondre, N. R., Phadnis, V. M., and Self, S. (2011). `A`ā lavas in the Deccan Volcanic Province, India, and their significance to the nature of continental flood basalt eruptions. Bull. Volcanol. 73, 737–752. doi:10.1007/s00445-011-0450-7
Bücker, C. J., Delius, H., and Wohlenberg, J. (1998). Physical signature of basaltic volcanics drilled on the northeast Atlantic volcanic rifted margins. Geol. Soc., London, Spec. Pubs. 136 (1), 363–374. doi:10.1144/gsl.sp.1998.136.01.29
Chenet, A. L., Fluteau, F., Courtillot, V., Gerard, M., and Subbarao, K. V. (2008). Determination of rapid eruption across the Cretaceous–Tertiary boundary using paleomagnetic secular variation: results from a 1200 m thick section in the Mahabaleshwar Escarpment. J. Geophys. Res. 113, 27. doi:10.1029/2006JB004635
Clapham, M. E., and Renne, P. R. (2019). Flood basalts and mass extinctions. Ann. Rev. Earth Planet. Sci. 47, 275–303. doi:10.1146/annurev-earth-053018-060136
Cramer, E. L., Sherlock, S. C., Halton, A. M., and Blake, S. (2013). Which age is the true age? Unravelling within-flow 40Ar/39Ar age variations in Faroe Islands basalt lavas,” in Conference paper: goldschmidt volume: mineralogical magazine, Vol. 77, 924.
Deschamps, A., Grigné, C., Le Saout, M., Soule, S. A., Allemand, P., Van Vliet‐Lanoe, B., et al. (2014). Morphology and dynamics of inflated subaqueous basaltic lava flows. Geochem. Geophys. Geosyst. 15 (6), 2128–2150. doi:10.1002/2014GC005274
Deshmukh, S. S. (1988). “Petrographic variations in compound flows of Deccan Traps and their significance,” in Deccan flood basalts, geological society India memoir. Editor K. V. Subbarao (Bangalore: Geological Society of India), Vol. 10, 305–319.
Doke, S. B. (2014). Study of Deccan trap flows. PhD thesis. Chikhaldara Ghat Section, District of Amravati: Dr. Babasaheb Ambedkar Marathwada University.
Dostal, J., and Dupuy, S. (1984). Geochemistry of the North Mountain basalts (Nova Scotia, Canada). Chem. Geol. 45, 245–261. doi:10.1016/0009-2541(84)90040-8
Duraiswami, R. A., Gadpallu, P., Maskare, B., Purwant, A., Meena, P., Krishnamurthy, P., et al. (2017). Volcanology and lava flow morpho-types from the Koyna-Warna, Region, Western Deccan Traps, India. J. Geol. Soc. India. 90, 742–747. doi:10.1007/s12594-017-0785-6
Duraiswami, R. A., Gadpallu, P., Shaikh, T. N., and Cardin, N. (2014). Pahoehoe – a’a transitions in the lava flow fields of the western Deccan Traps, India – implications for emplacement dynamics, flood basalt architecture and volcanic stratigraphy. J. Asian Earth Sci. 84, 146–166. doi:10.1016/j.jseaes.2013.08.025
El Hachimi, H., Youbi, N., Madeira, J., Bensalah, M. K., Martins, L., Mata, J., et al. (2011). Morphology, internal architecture and emplacement of lava flows from the Central Atlantic Magmatic Province (CAMP) of Argana Basin (Morocco). Geol. Soc. London, Spec. Pubs. 357, 167–193. doi:10.1144/SP357.9
Epps, W., and Singleton, K. J. (1986). An omnibus test for the two-sample problem using the empirical characteristic function. J. Statis. Comp. Simul. 26, 177–203. doi:10.1080/00949658608810963
Ernst, R. E., Liikane, D. A., Jowitt, S. M., Buchan, K. L., and Blanchard, J. A. (2019). A new plumbing system framework for mantle plume-related continental Large Igneous Provinces and their mafic-ultramafic intrusions. J. Volc. Geotherm. Res. 384, 75–84. doi:10.1016/j.jvolgeores.2019.07.007
Garcia, M. O., Haskins, E. H., Stolper, E. M., and Baker, M. (2007). Stratigraphy of the Hawai’i Scientific Drilling Project core (HSDP2): anatomy of a Hawai’ian shield volcano. Geochem. Geophys. Geosyst. 8 (2), 1525–2027. doi:10.1016/j.jvolgeores.2019.07.007
Gibson, I. L. (1966). The crustal structure of eastern Iceland. Geophys. J. Internat. 12 (1), 99–102. doi:10.1111/j.1365-246X.1966.tb03105.x
Godbole, S. M., Rana, R. S., and Natu, S. R. (1996). “Lava stratigraphy of Deccan Basalts of Western Maharashtra,” in Deccan Basalts, Special Publications Gondwana Geological Society. Editors S. S. Deshmukh, and K. K. K. Nair (Bombay: Gondwana Geological Society), Vol. 2, 125–134.
Greeley, R. (1982). The Snake River Plain, Idaho: representative of a new category of volcanism. J. Geophys. Res. 87 (B4), 2705–2712. doi:10.1029/JB087iB04p02705
Guilbaud, M. N., Self, S., Thordarson, T., and Blake, S. (2005). Morphology, surface structures, and emplacement of lavas produced by Laki, AD 1783–1784. Geol. Soc. America Spec. Pap. 396, 81–102. doi:10.1130/2005.2396(07)
Gupta, H. K., Srinivasan, R., Rao, R. U. M., Rao, G. V., Reddy, G. K., Roy, S., et al. (2003). Borehole investigations in the surface rupture zone of the 1993 Latur SCR earthquake, Maharashtra, India: overview of results,” in Memoirs geological society of India. New Delhi: Geological Society of India, 54, 1–22.
Heunemann, C. (2003). Direction and intensity of Earth’s magnetic field at the permo-triassic boundary: a geomagnetic reversal recorded. PhD dissertation.Siberian Trap Basalts, Russia: Verlag nicht ermittelbar.
Hon, K., Kauahikaua, J., Denlinger, R., and Mackay, K. (1994). Emplacement and inflation of pahoehoe sheet flows: observations and measurements of active lava flows on Kilauea Volcano, Hawai’i. Geol. Soc. Amer., Bull. 106, 351–370. doi:10.1130/0016-7606(1994)106<0351:EAIOPS>2.3.CO;2
Huang, K., and Opdyke, N. D. (1998). Magnetostratigraphic investigations on an Emeishan basalt section in western Guizhou province, China. Earth Planet Sci. Lett. 163 (1–4), 1–14. doi:10.1016/S0012-821X(98)00169-1
Huerta-Cepas, J., Serra, F., and Bork, P. (2016). ETE 3: reconstruction, analysis, and visualization of phylogenomic data. Mol. Biol. Evol., 33, 1635. doi:10.1093/molbev/msw046
Hull, P. M., Bornemann, A., Penman, D. E., Henehan, M. J., Norris, R. D., Wilson, P. A., et al. (2020). On impact and volcanism across the Cretaceous-Paleogene boundary. Science. 367 (6475), 266–272. doi:10.1126/science.aay5055
Inoue, H., Coffin, M. F., Nakamura, Y., Mochizuki, K., and Kroenke, L. W. (2008). Intrabasement reflections of the Ontong Java Plateau: implications for plateau construction. Geochem. Geophys. Geosyst. 9, Q04014 doi:10.1029/2007GC001780
Jay, A. E. (2005). Volcanic architecture of the Deccan Traps, Western Maharashtra, India: an integrated chemostratigraphic and palaeomagnetic study. PhD thesis. Milton Keynes: Open University.
Jay, A. E., and Widdowson, M. (2008). Stratigraphy, structure and volcanology of the SE Deccan continental flood basalt Province: implications for eruptive extent and volumes. J. Geol. Soc. London. 165, 177–188. doi:10.1144/0016-76492006-062
Jay, A. E., MacNiocall, C., Self, S., Widdowson, M., and Turner, W. (2009). New paleomagnetic data from the Mahabaleshwar plateau, Deccan province: implications for volcanistratigraphic architecture of continental flood basalt provinces. J. Geol. Soc. London. 166, 13–24. doi:10.1144/0016-76492007-150
Jay, A. E., Marsh, J. S., Fluteau, F., and Courtillot, V. E. (2018). Inflated pāhoehoe flows in the Naude’s Nek Pass, Lesotho remnant, Karoo continental flood basalt Province: use of flow-lobe tumuli in understanding flood basalt emplacement. Bull. Volcanol. 80, 17. doi:10.1007/s00445-017-1189-6
Kale, V. S., Bodas, M., Chatterjee, P., and Pande, K. (2020a). “Emplacement history and evolution of the Deccan Volcanic Province, India,” in Episodes J. Int. Geosci., 43 (1), 278–298.
Kale, V. S., Dole, G., Shandilya, P., and Pande, K. (2020b). Stratigraphy and correlations in Deccan Volcanic Province, India: quo vadis? Geol. Soc. Am. Bull. 132 (3–4), 588–607. doi:10.1130/B35018.1
Kasbohm, J., and Schoene, B. (2018). Rapid eruption of the Columbia River flood basalt and correlation with the mid-Miocene climate optimum. Sci. Adv. 4, eaat8223. doi:10.1126/sciadv.aat8223
Kasiviswanandham, A. (2003). Flow stratigraphy and paleomagnetic investigations of Bagli Volcanics, Malwa Deccan Traps MP, and to develop constraints on its petrogenesis. Amravati, Maharashtra: Sant Gadge Baba Amravati University.
Katz, M. G., and Cashman, K. V. (2003). Hawai’ian lava flows in the third dimension: identification and interpretation of pahoehoe and ′a′a distribution in the KP-1 and SOH-4 cores. Geochem. Geophys. Geosyst. 4, 8705. doi:10.1029/2001GC000209
Kilburn, C. R. J., and Lopes, R. C. M. (1991). General patterns of flow field growth: aa and blocky lavas. J. Geophys. Res. 96, 19721–19732. doi:10.1029/91JB01924
Kontak, D. J. (2008). On the edge of CAMP: geology and volcanology of the Jurassic North Mountain Basalt, Nova Scotia. Lithos. 101, 74–101. doi:10.1016/j.lithos.2007.07.013
Krivolutskaya, N. A., Kuzmin, D. V., Gongalsky, B. I., Roshchina, I. A., Kononkova, N. N., Svirskaya, N. M., et al. (2018). Stages of trap magmatism in the Norilsk area: new data on the structure and geochemistry of the volcanic rocks. Geochem. Int. 56 (5), 419–437. doi:10.1134/S0016702918050026
Kumar, K. V., Chavan, C., Sawant, S., Raju, K. N., Kanakdande, P., Patode, S., et al. (2010). Geochemical investigation of a semi-continuous extrusive basaltic section from the Deccan Volcanic Province, India: implications for the mantle and magma chamber processes. Contrib. Mineral. Petrol. 159 (6), 839–862. doi:10.1007/s00410-009-0458-6
Landwehrs, J. P., Feulner, G., Hofmann, M., and Petri, S. (2020). Climatic fluctuations modeled for carbon and sulfur emissions from end-Triassic volcanism. Earth Planet Sci. Lett. 537, 116174. doi:10.1016/j.epsl.2020.116174
Lhuillier, F., and Gilder, S. A. (2019). Palaeomagnetism and geochronology of Oligocene and Miocene volcanic sections from Ethiopia: geomagnetic variability in the Afro-Arabian region over the past 30 Ma. Geophys. J. Internat. 216 (2), 1466–1481. doi:10.1093/gji/ggy517
Liu, C., Pan, Y., and Zhu, R. (2012). New paleomagnetic investigations of the Emeishan basalts in NE Yunnan, southwestern China: constraints on eruption history. J. Asian Earth Sci. 52, 88–97. doi:10.1016/j.jseaes.2012.02.014
Lundgren, P. R., Bagnardi, M., and Dietterich, H. (2019). Topographic changes during the 2018 Kīlauea eruption from single-pass airborne InSAR. Geophys. Res. Lett. 46, 9554–9562. doi:10.1029/2019GL08350
Mahoney, J. J., Macdougall, J. D., Lugmair, J. W., Murali, A. V., Sankar Das, M., and Gopalan, K. (1982). Origin of the Deccan Trap flows at Mahabaleshwar inferred from Nd and Sr isotopic and chemical evidence. Earth Planet Sci. Lett. 60, 47–60. doi:10.1016/0012-821X(82)90019-X
Mahoney, J. J., Sheth, H. C., Chandrasekharam, D., and Peng, Z. X. (2000). Geochemistry of flood basalts of the Toranmal section, northern Deccan Traps, India: implications for regional Deccan stratigraphy. J. Petrol. 41 (7), 1099–1120. doi:10.1093/petrology/41.7.1099
Martin, E., and Sigmarsson, O. (2010). Thirteen million years of silicic magma production in Iceland: links between petrogenesis and tectonic settings. Lithos. 116 (1–2), 129–144. doi:10.1016/j.lithos.2010.01.005
Marzoli, A., Bertrand, H., Youbi, N., Callegaro, S., Merle, R., Reisberg, L., et al. (2019). The Central Atlantic Magmatic Province (CAMP) in Morocco. J. Petrol. 60, 945–996. doi:10.1093/petrology/egz021
Mikhaltsov, N. E., Kazansky, A. Y., Ryabov, V. V., Shevko, A. Y., Kuprish, O. V., and Bragin, V. Y. (2012). Paleomagnetism of trap basalts in the northwestern Siberian craton, from core data. Russ. Geol. Geophys. 53 (11), 1228–1242. doi:10.1016/j.rgg.2012.09.009
Millett, J. M., Hole, M. J., Jolley, D. W., and Passey, S. R. (2017). Geochemical stratigraphy and correlation within large igneous provinces: the final preserved stages of the Faroe Islands Basalt Group. Lithos. 286, 1–15. doi:10.1016/j.lithos.2017.05.011
Mishra, S., Misra, S., Vyas, D., Nikalje, D., Warhade, A., and Roy, S. (2017). A 1251 m thick Deccan flood basalt pile recovered by scientific drilling in the Koyna region, Western Maharashtra. J. Geol. Soc. India. 90, 788–794. doi:10.1007/s12594-017-0792-7
Mitchell, C., and Widdowson, M. (1991). A geological map of the southern Deccan Traps, India and its structural implications. J. Geol. Soc. London. 148, 495–505. doi:10.1144/gsjgs.148.3.0495
Moulin, M., Fluteau, F., Courtillot, V. E., Marsh, J., Delpech, G., Quidelleur, X., et al. (2017). Eruptive history of the Karoo lava flows and their impact on early Jurassic environmental change. J. Geophys. Res. Solid Earth. 122, 738–772. doi:10.1002/2016JB013354
Nelson, C. E., Jerram, D. A., and Hobbs, R. W. (2009). Flood basalt facies from borehole data: implications for prospectivity and volcanology in volcanic rifted margins. Petrol. Geosci. 15 (4), 313–324. doi:10.1144/1354-079309-842
Olsen, P. E. (1980). “Triassic and Jurassic formations of the Newark Basin,” in Field studies of New Jersey geology and guide to feld trips: 52nd annual meeting of the New York State Geological Association. Editor W. Manspeizer (Newark: Newark College of Arts and Sciences, Rutgers University), 2–39.
Olsen P. E., Schlische R. W., and Gore P. J. W. Editors (1989). ““Field guide to the tectonics, stratigraphy, sedimentology, and paleontology of the Newark Supergroup, Eastern North America.” internat,”, T351, 174.
Óskarsson, B. V., and Riishuus, M. S. (2014). The mode of emplacement of Neogene flood basalts in eastern Iceland: facies architecture and structure of simple aphyric basalt groups. J. Volc. Geotherm. Res. 289, 170–192. doi:10.1016/j.jvolgeores.2014.11.009
Óskarsson, B. V., Andersen, C. B., Riishuus, M. S., Sørensen, E. V., and Tegner, C. (2017). The mode of emplacement of Neogene flood basalts in Eastern Iceland: the plagioclase ultraphyric basalts in the Grænavatn group. J. Volc. Geotherm. Res. 332, 26–50. doi:10.1016/j.jvolgeores.2017.01.006
Passey, S. R., and Bell, B. R. (2007). Morphologies and emplacement mechanisms of the lava flows of the Faroe Islands Basalt Group, Faroe Islands, NE Atlantic Ocean. Bull. Volcanol. 70, 139–156. doi:10.1007/s00445-007-0125-6
Pathak, V., Patil, S. K., and Shrivastava, J. P. (2017). Tectonomagmatic setting of lava packages in the Mandla lobe of the eastern Deccan volcanic province, India: palaeomagnetism and magnetostratigraphic evidence. Geol. Soc. London Spec. Pubs. 445 (1), 69–94. doi:10.1144/SP445.3
Peng, Z. X., and Mahoney, J. J. (1995). Drillhole lavas from the northwestern Deccan Traps, and the evolution of Réunion hotspot mantle. Earth Planet Sci. Lett. 134 (1–2), 169–185. doi:10.1016/0012-821X(95)00110-X
Petterson, M. G. (2004). The geology of north and central Malaita, Solomon Islands: the thickest and most accessible part of the world’s largest (Ontong Java) ocean plateau. Geol. Soc., London, Spec. Pubs. 229 (1), 63–81. doi:10.1144/GSL.SP.2004.229.01.06
Philpotts, A. R. (1998). Nature of a flood-basalt-magma reservoir based on the compositional variation in a single flood-basalt flow and its feeder dike in the Mesozoic Hartford Basin. Connecticut. Contrib. Mineral. Petrol. 133, 69–82. doi:10.1007/s004100050438
Planke, S. (1994). Geophysical response of flood basalts from analysis of wire line logs: Ocean Drilling Program Site 642, Vøring volcanic margin. J. Geophys. Res., Solid Earth. 99 (B5), 9279–9296. doi:10.1029/94JB00496
Potter, K. E., Champion, D. E., Duncan, R. A., and Shervais, J. W. (2019). Volcanic stratigraphy and age model of the Kimama deep borehole (Project Hotspot): evidence for 5.8 million years of continuous basalt volcanism, central Snake River Plain, Idaho. Geosphere. 15, 736–758. doi:10.1130/GES01679.1
Puffer, J. H., Block, K. A., Steiner, J. C., and Laskowich, C. (2018). Complex layering of the Orange Mountain Basalt: New Jersey, United States. Bull. Volcanol. 80, 54. doi:10.1007/s00445-018-1231-3
Puffer, J. H., Husch, J. M., and Benimoff, A. I. (1992). “The palisades sill and Watchung Basalt flows, Northern New Jersey and Southeastern New York: a geological summary and field guide,” in New jersey geological survey open-file report OFR. Trenton, NJ: New Jersey Department of Environmental Protection and Energy Division of Science and Research, Geological Survey, 92–101.
Rader, E., Vanderkluysen, L., and Clarke, A. B. (2017). The role of unsteady effusion rates on inflation in long-lived lava flow fields. Earth Planet Sci. Lett. 477, 73–83. doi:10.1016/j.epsl.2017.08.016
Raja Rao, C. S., Sahasrabudhe, Y. S., Deshmukh, S. S., and Raman, R. (1999). “Distribution, structure and petrography of the Deccan Traps, India,” in Deccan volcanic province. Geological Society of India Memoir. Editor K. V. Subbarao (Bangalore: Geological Society of India), Vol. 43, 401–414.
Rajaram, M., Anand, S. P., Erram, B. N., and Shinde, B. N. (2017). “Insight into the structures below the Deccan Trap-covered region of Maharashtra, India, from geopotential data,” in Tectonics of the Deccan large igneous province. Editors S. Mukherjee, A. A. Misra, G. Calve`s, and M. Nemcˇok (London: Geological Society, London, Special Publications), 445, 219–236.
Reichow, M. K., Saunders, A. D., White, R. V., Al’Mukhamedov, A. I., and Medvedev, A. Y. (2005). Geochemistry and petrogenesis of basalts from the West Siberian Basin: an extension of the Permo–Triassic Siberian Traps, Russia. Lithos. 79 (3–4), 425–452. doi:10.1016/j.lithos.2004.09.011
Renne, P. R., Sprain, C. J., Richards, M. A., Self, S., Vanderkluysen, L., and Pande, K. (2015). State shift in Deccan volcanism at the Cretaceous-Paleogene boundary, possibly induced by impact. Science. 350 (6256), 76–78. doi:10.1126/science.aac7549
Riishuus, M. S., Duncan, R. A., and Kristjansson, L. (2013). Revised geochronology and magnetostratigraphy of northwest Iceland. AGUFM, 2013, GP43A–1196.
Rochette, P., Tamrat, E., Ferraud, G., Pik, R., Courtillot, V., Ketefo, E., et al. (1998). Magnetostratigraphy and timing of the Oligocene Ethiopian traps. Earth Planet Sci. Lett. 164, 497–510. doi:10.1016/S0012-821X(98)00241-6
Schaller, M. F., Wright, J. D., and Kent, D. V. (2011). Atmospheric PCO₂ perturbations associated with the Central Atlantic magmatic province. Science. 331 (6023), 1404–1409. doi:10.1126/science.1199011
Schmidt, A., Skeffington, R. A., Thordarson, T., Self, S., Forster, P. M., Rap, A., et al. (2016). Selective environmental stress from sulphur emitted by continental flood basalt eruptions. Nat. Geosci. 9, 77–82. doi:10.1038/ngeo2588
Schoene, B., Eddy, M. P., Samperton, K. M., Keller, C. B., Keller, G., Adatte, T., et al. (2019). U-Pb constraints on pulsed eruption of the Deccan Traps across the end-Cretaceous mass extinction. Science. 363, 862–866. doi:10.1126/science.aau2422
Scholz, F. W., and Stephens, M. A. (1987). K-sample anderson-darling tests. J. Amer. Statistical Assoc. 82, 918–924. doi:10.1080/01621459.1987.10478517
Self, S., Jay, A. E., Widdowson, M., and Keszthelyi, L. P. (2008). Correlation of the Deccan and Rajamundry Trap lavas: are these the longest and largest lava flows on Earth? J. Volcanol. Geotherm. Res. 172, 3–19. doi:10.1016/j.jvolgeores.2006.11.012
Self, S., Keszthelyi, L. P., and Thordarson, Th. (1998). The importance of pāhoehoe. Ann. Rev. Earth Planet. Sci. 26, 81–110. doi:10.1146/annurev.earth.26.1.81
Self, S., Schmidt, A., and Mather, T. A. (2014). Emplacement characteristics, time scales, and volcanic gas release rates of continental flood basalt eruptions on Earth. Geol. Soc. Am. Spec. Pap. 505 (16), 2505. doi:10.1130/2014
Self, S., Thordarson, Th., and Keszthelyi, L. (1997). “Emplacement of continental flood Basalt lava flows,” in AGU geophysics monograph 100, large igneous provinces. Editors J. J. Mahoney, and M. F. Coffin (Washington, DC: American Geophysical Union), 381–410.
Self, S., Widdowson, M., Thordarson, T., and Jay, A. E. (2006). Volatile fluxes during flood basalt eruptions and potential effects on the global environment: a Deccan perspective. Earth Planet Sci. Lett. 248, 517–531. doi:10.1016/j.epsl.2006.05.041
Sengupta, P., and Ray, A. (2006). Primary volcanic structures from a type section of Deccan Trap flows around Narsingpur-Harrai-Amarwara, central India: implications for cooling history. J. Earth System Sci. 115 (6), 631–642. doi:10.1007/s12040-006-0006-y
Sharma, K., Keszthelyi, L., Thornber, C., and Self, S. (2000). Variations in cooling, crystallization textures, and glass chemistry during emplacement of Kilauea Pahoehoe lobes, as constrained by in situ field experiments. GSA Abstr. Programs, 32–37.
Sheth, H. C. (2006). The emplacement of pahoehoe lavas on Kilauea and in the Deccan traps. J. Earth Syst. Sci. 115, 615–629. doi:10.1007/s12040-006-0007-x
Sheth, H. C., and Cañón-Tapia, E. (2015). Are flood basalt eruptions monogenetic or polygenetic? Int. J. Earth Sci. 104 (8), 2147–2162. doi:10.1007/s00531-014-1048-z
Sinha, D. K., Som, A., and Roy, S. (2017). The subsurface megascopic characteristics of basalt and basement rocks from Koyna-Warna area of Maharashtra, India. J. Geol. Soc. India. 90, 761–768. doi:10.1007/s12594-017-0788-3
Sprain, C. J., Renne, P. R., Vanderkluysen, L., Pande, K., Self, S., and Mittal, T. (2019). The eruptive tempo of Deccan volcanism in relation to the Cretaceous-Paleogene boundary. Science. 363, 866–870. doi:10.1126/science.aav1446
Subbarao K. V. (1999). “Deccan volcanic province,” in Memoirs of the geological society of India. (Bangalore: Geological Society India), 43, 547.
Swanson, D. A. (1973). Pahoehoe flows from the 1969-1971 Mauna Ulu eruption, Kilauea Volcano, Hawai’i. Geol. Soc. Am. Bull. 84, 615–626. doi:10.1130/0016-7606(1973)84<615:PFFTMU>2.0.CO;2
Swanson, D. A., W. A., Dufiqeld, D. B., Jackson, and D. W., Peterson, Chronological narrative of the 1969-71 Mauna Ulu eruption of Kilauea volcano, Hawaii, U.S. Geol. Surv. Prof. Pap., 1056, 55 pp., 1979.
Tejankar, A. V. (2002). Study of Deccan trap flows in Toranmal ghat section. PhD thesis. Dhule district: Dr. Babasaheb Ambedkar Marathwada University.
Thordarson, T., and Self, S. (2003). Atmospheric and environmental effects of the 1783–84 Laki eruption: a review and re-assessment. J. Geophys. Res. 108, 4011. doi:10.1029/2001JD002042
Thordarson, T., and Self, S. (1998). The Roza Member, Columbia River Basalt Group; a gigantic pahoehoe lava flow field formed by endogenous processes? J. Geophys. Res. B Solid Earth. 103, 27411–27445. doi:10.1029/98JB01355
Vanderkluysen, L., Mahoney, J. J., Hooper, P. R., Sheth, H. C., and Ray, R. (2011). The feeder system of the Deccan Traps (India): insights from dike geochemistry. J. Petrol. 52, 315–343. doi:10.1093/petrology/egq082
Verma, O., and Khosla, A. (2019). Developments in the stratigraphy of the Deccan Volcanic Province, peninsular India. Compt. Rendus Geosci. 351, 461–476. doi:10.1016/j.crte.2019.10.002
Virtanen, P., Gommers, R., Oliphant, T. E., Haberland, M., Reddy, T., Cournapeau, D., et al. (2020). SciPy 1.0: fundamental algorithms for scientific computing in python. Nat. Methods. 17, 261–272. doi:10.1038/s41592-019-0686-2
Vye-Brown, C. L., Self, S., and Barry, T. L. (2013). Architecture and emplacement of flood basalt flow fields: case studies from the Columbia River flood basalts, United States. Bull. Volcanol. 75, 697. doi:10.1007/s00445-013-0697
Walker, G. P. L. (1971). Compound and simple lava flows and flood basalts. Bull. Volcanol. 35, 579–590. doi:10.1007/BF02596829
Walker, G. P. L. (1964). Geological investigations in eastern Iceland. Bull. Volcanol. 27 (1), 351–363. doi:10.1007/BF02597532
Walker, G. P. L. (1999). “Some observations and interpretations on the Deccan Traps,” in Deccan volcanic province, geological society of India memoir. Editor K. V. Subbarao (New Delhi: Geological Society of India) 43, 367–396.
Whiteside, J. H., Olsen, P. E., Kent, D. V., Fowell, S. J., and Et-Touhami, M. (2007). Synchrony between the Central Atlantic magmatic province and the Triassic–Jurassic mass-extinction event. Palaeogeogr. Palaeoclimatol. Palaeoecol. 244 (1–4), 345–367. doi:10.1016/j.palaeo.2006.06.035
Keywords: continental flood basalt provinces, Deccan Traps, Columbia River basalts, pāhoehoe, flow-field, sheet-lobe, hummocky pāhoehoe lavas
Citation: Self S, Mittal T and Jay AE (2021) Thickness Characteristics of Pāhoehoe Lavas in the Deccan Province, Western Ghats, India, and in Continental Flood Basalt Provinces Elsewhere. Front. Earth Sci. 8:630604. doi: 10.3389/feart.2020.630604
Received: 18 November 2020; Accepted: 18 December 2020;
Published: 17 February 2021.
Edited by:
Aaron J. Pietruszka, University of Hawaii, United StatesReviewed by:
Raymond Duraiswami, Savitribai Phule Pune University, IndiaCopyright © 2021 Self, Mittal and Jay. This is an open-access article distributed under the terms of the Creative Commons Attribution License (CC BY). The use, distribution or reproduction in other forums is permitted, provided the original author(s) and the copyright owner(s) are credited and that the original publication in this journal is cited, in accordance with accepted academic practice. No use, distribution or reproduction is permitted which does not comply with these terms.
*Correspondence: Stephen Self, c3NlbGZAYmVya2VsZXkuZWR1
Disclaimer: All claims expressed in this article are solely those of the authors and do not necessarily represent those of their affiliated organizations, or those of the publisher, the editors and the reviewers. Any product that may be evaluated in this article or claim that may be made by its manufacturer is not guaranteed or endorsed by the publisher.
Research integrity at Frontiers
Learn more about the work of our research integrity team to safeguard the quality of each article we publish.