 Lori K. Fenton
 Simone Silvestro
 Gary Kocurek3
95% of researchers rate our articles as excellent or good
Learn more about the work of our research integrity team to safeguard the quality of each article we publish.
Find out more
ORIGINAL RESEARCH article
Front. Earth Sci. , 19 January 2021
Sec. Quaternary Science, Geomorphology and Paleoenvironment
Volume 8 - 2020 | https://doi.org/10.3389/feart.2020.619704
This article is part of the Research Topic Physics and Geomorphology of Sand Ripples on Earth and in the Solar System View all 5 articles
In Scandia Cavi on Mars, barchans migrating over a field of transverse aeolian ridges (TARs) leave behind distinctive trails (“wakes”) comprising both TARs undergoing exhumation and coarse-grained ripples being shed from the barchans. With distance upwind from the barchans, the combined pattern of these bedforms coarsens and defect density decreases, thus appearing to mature with exposure time. We present results of morphological analyses of the wake bedform crestlines using HiRISE images, seeking to determine how the wake pattern reflects TAR growth and pattern development. TARs interact with each other, exhibiting defect repulsions and possible lobe extensions, indicating that these bedforms have migrated in the past, despite the lack of identifiable change in overlapping images spanning 9.5 years. Mapping one wake in detail, we found that the TAR pattern is not affected by superposing ripples. However, the ripples undergo many interactions, first with one another, and later (with distance upwind) with the underlying TARs. Near the dune, many ripples laterally link, growing in length, and they preferentially form along TAR crests, resulting in small bedform repulsions and longer superposing ripples. Most of these ripples will be consumed by the TARs, an as-yet unreported growth dynamic for TARs that is consistent with the work of others, who have found a continuum between TARs and the meter-scale ripples that form on dunes. Constructing a DTM, orthorectifying HiRISE images, and measuring dune migration rates places the timescale of ripple absorption by TARs in a wake at several thousand years, with the first ∼1,000 years dominated by lateral linking of ripples. Assuming that TAR growth is accomplished entirely through dune burial and subsequent ripple consumption, we estimate a lower limit age of the TARs, and by extension, the dune field, to be ∼270 kyr.
Bedforms such as dunes and ripples abound on Mars, attesting to the wind’s relentless sculpting of the landscape and its ability to contribute significantly to the planet’s geologic record. Owing to differing boundary conditions and corresponding bedform dynamics, however, direct comparisons of bedforms on Mars (as well as on other planetary bodies) to those on Earth is not straightforward. In particular, one recent hypothesizing of meter-scale ripples on Mars, occupying the phase space between small impact ripples and dunes (Lapotre et al., 2016; Hugenholtz et al., 2017; Lapotre et al., 2018; Duran Vincent et al., 2019), is that they represent a bedform class rarely occurring on Earth. In the phase diagrams of Duran Vincent et al. (2019), such meter-scale ripples consist of both 1) dark “large ripples” largely composed of fine, well sorted sand, best exemplified by bedforms superimposed upon dunes at Bagnold Dune Field (Lapotre et al., 2016), and 2) relatively bright-toned, transverse aeolian ridges (TARs) formed in coarser, poorly sorted sediment. In contrast, Sullivan et al. (2020) have argued that meter-scale ripples on Mars form by the same dynamic process as impact ripples, and that a size continuum from impact ripples to meter-scale ripples is a result of a lower wind dynamic pressure cap imposed by the low-density martian atmosphere.
Historically, TARs have long been regarded as enigmatic bedforms with morphological characteristics similar to both dunes and ripples (e.g., Bourke et al., 2003; Zimbelman, 2010; Zimbelman and Scheidt, 2014; Lämmel et al., 2018). Common on Mars, occupying ∼7% of the martian surface (Berman et al., 2011), TARs are typically straight-crested and bright relative to much larger, dark sand dunes (Ward, 1979; Edgett, 1997; Thomas et al., 1999; Malin and Edgett, 2001). TARs occur most commonly in the low- and mid-latitudes (Wilson and Zimbelman, 2004; Balme et al., 2008; Berman et al., 2011; Geissler and Wilgus, 2017), and exhibit a wide range of wavelengths (6 to 140 m) and heights (0.3 to 6.4 m) (Hugenholtz et al., 2017). Only a few possible terrestrial analogs to TARs have been proposed (Milana, 2009; de Silva et al., 2013; Foroutan and Zimbelman, 2016; Foroutan et al., 2019; Foroutan and Zimbelman, 2020), limiting the prospect of comparative planetology studies. Long thought to be immobile (e.g., Bridges et al., 2013), Silvestro et al. (2020) demonstrated that some TARs in high sand flux areas migrate, with sand fluxes two orders of magnitude lower than nearby dune crest sand fluxes. Their proximity to likely source regions suggests that TARs have not migrated far from their source regions (e.g., Thomas et al., 1999; Fenton et al., 2003; Balme et al., 2008; Berman et al., 2011; Kerber and Head, 2012; Fenton et al., 2015).
TARs, like other bedforms, often occur in fields that exhibit a regular pattern, as defined by characteristic bedform spacing, orientation, and crest length. The emergence of bedform-field patterns is thought to arise by interactions between the bedforms themselves within the field (i.e., self-organization), primarily as bedforms or bedform segments of different sizes migrate at different speeds (Werner, 1995; Coleman and Melville, 1996; Elbelrhiti et al., 2008; Narteau et al., 2009; Kocurek et al., 2010; Gao et al., 2015a). Bedform interactions typically result in pattern coarsening and dominate field dynamics after an early phase of bedform emergence and growth (Narteau et al., 2009). Moreover, specific types of interactions, with identifiable morphologies, are associated with stages of pattern maturation or disruptions (Kocurek et al., 2010; Zgheib et al., 2018). Because bedform patterns occur as a result of interactions caused by bedform migration, the presence of a pattern implies a history of bedform migration. For TARs, the presence of well-formed patterns and characteristic interaction morphologies, therefore, implies that although TAR migration sufficient to allow for interactions has not been observed, it has in fact occurred.
In this paper we present analysis of a site in Scandia Cavi on Mars, located near the north polar sand sea Olympia Undae, in which TAR patterns in different apparent states of maturation are arrayed in a sequence of exposures. Large dark barchans migrate over the TARs, leaving behind trails or “wakes” of bedforms that are distinct in wavelength from surrounding undisturbed TARs (Figure 1). These bedforms are thought to represent TARs and coarser-grained ripples that lag behind the migrating barchans. Just upwind of each dune, the bedform pattern in the wake is poorly organized, with closely spaced crestlines and many bedform terminations (i.e., defects). With distance upwind from the dunes, the bedform pattern appears to mature, approaching that found in adjacent areas that have not recently been buried by a dune. Ideally, the coarsening or maturation of a TAR pattern would be illustrated in a time-series, but this is not possible given the apparent slow migration of TARs. However, at this site, distance upwind from the dunes effectively provides a timeline of TAR and ripple pattern development.
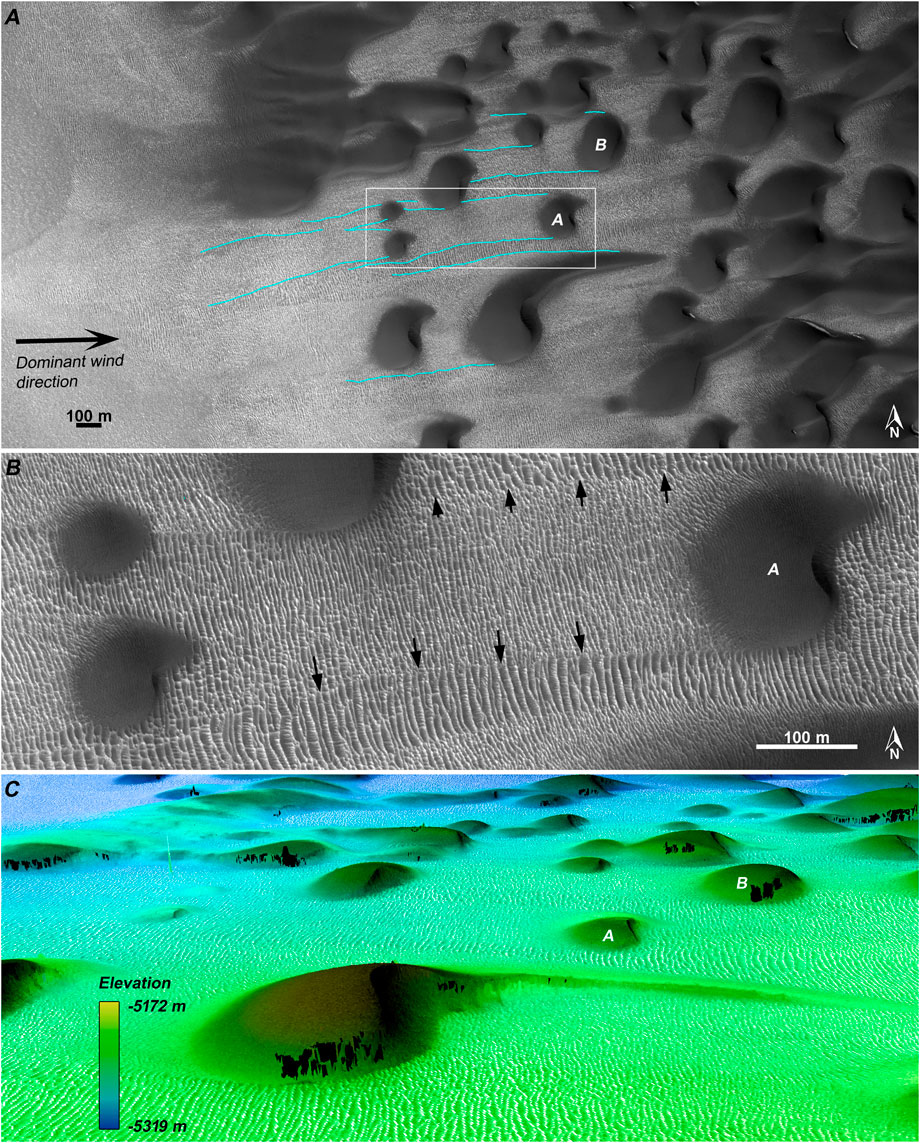
FIGURE 1. TAR-filled wakes made by migrating barchans (HiRISE ESP_017426_2570). (A) The western margin of the dune field, with barchans and barchanoid dunes trailing wakes. Studied dunes are labeled as A and B; the white box shows the location of (B) the wake stretching upwind of Dune A. The barchan’s passage leaves behind a relatively disorganized bedform pattern, contrasting with the surrounding TAR pattern (black arrows indicate locations along the wake margins), and appearing to mature with distance upwind of the dune (i.e., over time). (C) Perspective view of the study dunes made from the constructed DTM (black areas indicate pixels that did not co-register because of dune activity; the view is vertically exaggerated by 2x).
There are two possible endmember hypotheses that describe how the bedform pattern in the wakes has developed:
1. The passing dune and its wake bury the underlying TAR pattern, and a new TAR pattern emerges upwind of the dune, produced entirely from ripples shed from the dune as they evolve into TARs. In this case, the spatially varying change in wavelength observed along the wakes would be indicative of TAR pattern evolution from a uniform bed.
2. The passing dune and its wake bury the TAR pattern, but the TARs are simply progressively exhumed as the ripples migrate out of the area or are deflated. In this case, the spatially varying pattern change observed along the wakes represents the timeline required for ripples to migrate out of the area or be deflated away, leaving only the exhumed TAR pattern.
A third possibility is a process intermediate between the above two cases:
3. The passing dune and wake bury the TAR pattern, but the ripples shed from the dune interact with TARs being exhumed from burial, transferring some of their sediment to the TARs. In this case, the spatially varying change observed along the wakes represents the time that the ripples take to interact with already established TARs, but not the development time of the TARs themselves.
In the first and third hypotheses, ripples left by the passing dune evolve into (in the first hypothesis) or become incorporated into (in the third hypothesis) TARs. In the second hypothesis, ripples are a relatively more mobile set of bedforms distinct from TARs. We present analysis of the wake pattern and bedform morphology that supports the third hypothesis, thus identifying a new potential mechanism for TAR growth. This mechanism can only occur where dunes and ripples superpose (or once superposed) TARs, and thus it would not apply to all TARs on Mars.
The study area is located in the Scandia Cavi, which comprises depressions tens to hundreds of kilometers wide in the Scandia sub-basin of the north polar plains of Mars. Tanaka et al. (2014) mapped the Cavi as part of their “Hesperian polar edifice” (Hpe) unit. The ice-rich deposits forming the rugged terrain of Scandia Tholi, Colles, and Cavi may have been formed by mud volcanism and diapirism (Tanaka et al., 2003; Skinner and Mazzini, 2009; Tanaka et al., 2011). Our study area is in a ∼300 m deep, 40 × 100 km cavus that is interior to a larger cavus complex that is as much as 1 km deep and spans 120 × 200 km (Figure 2).
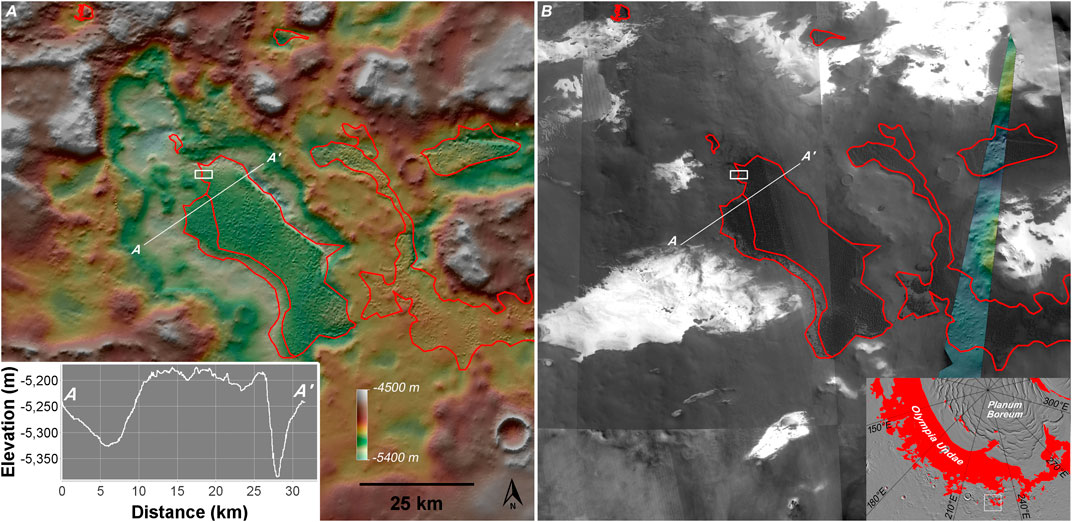
FIGURE 2. The study area shown on (A) MOLA 512 pixel per degree hillshade (Smith et al., 2003) and (B) CTX global mosaic (Dickson et al., 2018). Insets show the elevation profile for the line from A to A′ and the regional context of the dune field. Red outlines correspond with MGD3 dune field outlines (Hayward, 2011), and the white boxes indicate the location of Figure 1A. The figure was made using Java Mission-planning and Analysis for Remote Sensing (JMARS; Christensen et al., 2009).
The dunes with wakes are found on the upwind margin of a 706 km2 dune field located on the eastern floor of the interior cavus, centered at 227.4°E, 76.7°N and at a mean elevation of −5,200 m. One of several similar dune fields in the cavus complex, these are outliers of the vast Olympia Undae, the margin of which lies 85 km to the north. In constructing the northern region of the Mars Global Digital Dune Database (MGD3), Hayward (2011) mapped this dune field as two distinct regions, with the western portion (dune field identifier “Dune ID” = 2270+766) having sparser sand coverage (<80%) than the larger eastern portion (Dune ID = 2277+766). A topographic profile across the northern part of the dune field shows that the dunes have formed on a low plateau 120–200 m high.
The dunes forming wakes are located in the northwestern portion of the dune field (see Figure 3), where a number of overlapping HiRISE images have been acquired. The western margin of the dune field comprises barchans with east-facing lee slopes, coalescing eastward to barchanoid dunes in the dune field’s center. The barchan morphology indicates formative winds mainly from the west, but the dunes are not situated in a purely unidirectional environment. Elongated northern horns and some linear dunes are suggestive of a secondary wind from the southwest (Tsoar, 1983; Tsoar, 1984; Parteli et al., 2014; Gao et al., 2015b; Lü et al., 2018). In addition, on the northeast margin of the dune field there are southwest-facing barchans that indicate the occurrence of a northeasterly wind. These dunes meet the eastward-marching dunes to form a long linear ridge that extends south along the eastern border of the dune field.
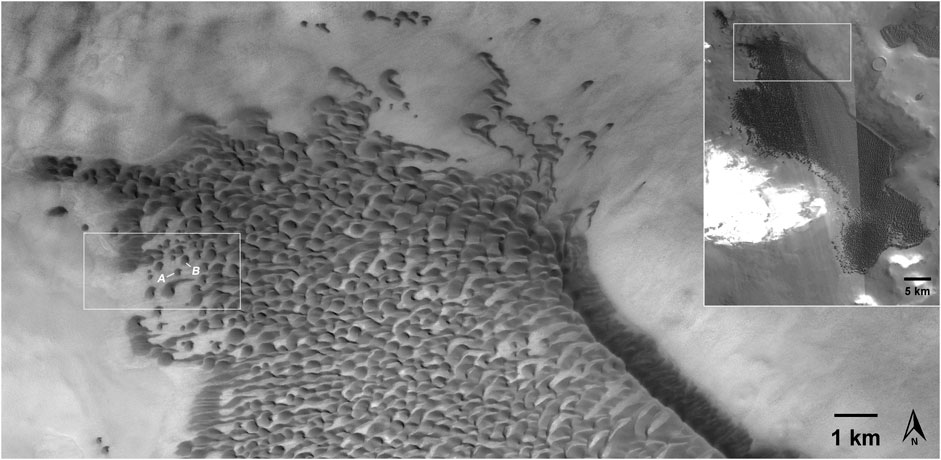
FIGURE 3. The northern end of the dune field (CTX image J22_053517_2571), context shown in the inset. The box indicates the location of Figure 1, and Dunes A and B are indicated. The figure was made using JMARS (Christensen et al., 2009).
Two dunes were selected for wake pattern analysis, based on several factors, including the length of their wakes, consistent sediment coverage, relative lack of interference from nearby dunes, and relative uniformity of the TAR pattern downwind of the dune to serve as comparison to the wake pattern (Figure 4). Although many other wakes are visible in the HiRISE images, very few were sufficiently isolated, uniform, or undisturbed by lateral dunes to permit robust pattern analysis.
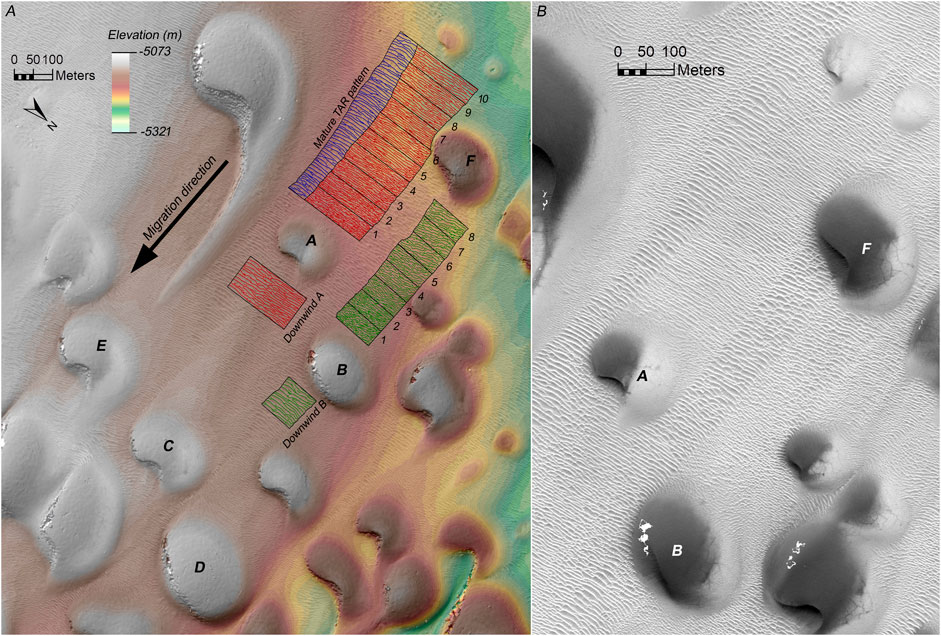
FIGURE 4. (A) Orthorectified HiRISE image ESP_044722_2570 draped on the HiRISE DTM, showing the location of the study area and mapped crest outlines for Dunes A (red) and B (green), as well as a relatively undisturbed adjacent section of the TAR field that has developed into a mature pattern (blue). The wakes were segmented into 50-m-long polygons, and two 100-m-long downwind regions represent the initial pattern before being buried by Dunes A and B. Dune C is downwind of Dune A, Dune D is downwind of the southern portion of Dune B, Dune E is downwind of the mature pattern, and Dune F is directly upwind of Dune B and buries the northern part of the Dune A wake. (B) Orthorectified HiRISE image ESP_044722_2570 of the Dune A and B wakes without mapped crestlines.
Dune A is a stubby, slightly asymmetric barchan with nearly non-existent horns (width = 180 m, length = 120 m, height = 9.8 m). Its lee face is east-facing and crescentic, with the southern end curving around a convex nose to face southeast. It is ∼400 m upwind of the nearest dune downwind (Dune C), which has permitted the initial (“Downwind A” in Figure 4A) TAR pattern to relax into a relatively uniform, apparently mature state before being overridden by Dune A to form the Dune A wake. The Dune A wake extends ∼500 m upwind of Dune A before it is partially buried by two smaller dunes. At a distance of ∼300 m upwind of Dune A, the northern edge of the wake is overridden by a dune that overprints this part of the wake with its own wake (Dune F), which was excluded from our analysis. The width of the Dune A wake varies by 7% (ranging from 178–191 m), suggesting that Dune A did not significantly grow or shrink as it migrated over the 500 m distance the wake extends. Assuming that the wind regime has remained relatively invariant over that time, the nearly constant wake width suggests that the migration rate of Dune A has also remained fairly stable.
Dune B is a stubby barchan with no horns (width = 235 m, length = 160 m, height = 17.5 m). Its lee face is straight and faces southeast. Its southern half is ∼350 m upwind of the nearest dune downwind (Dune D), but its northern half is only ∼120 m upwind of the nearest dune downwind (a barchan between Dunes B and D, see Figure 4). The northern half of the Dune B wake is further complicated by a small barchan that overrides the wake ∼150 m upwind of Dune B, but this barchan does not encroach on the southern portion of the Dune B wake. Downwind of the southern half of Dune B is an apparently mature and uniform TAR pattern that indicates the likely conditions of the local TAR pattern that has not yet been buried by Dune B (“Downwind B” in Figure 4A). For these reasons, we mapped and analyzed only the southern half of the Dune B wake along a length of 400 m. As with Dune A, the width of the Dune B wake does not vary significantly, suggesting that Dune B has migrated at a constant rate, provided that the wind regime has remained unchanged during the period of wake formation.
Also included in the analysis is a 500 m long, 50–80 m wide area adjacent and just south of the Dune A wake (labeled “Mature TAR pattern” in Figure 4A). This portion of the TAR field is at least ∼650 m upwind of the nearest disrupting dune (Dune E), and thus has had more time than the Dune A and B wakes to develop into a long-crested, widely spaced pattern with few defects. The contrast between the mature region and the dune wakes is readily apparent in Figure 4B, particularly when it is compared to the portions of the wakes closest to the dunes.
To compute dune migration rates, any overlapping HiRISE images must be aligned and orthorectified to remove parallax distortions. We built a digital terrain model (DTM) using the HiRISE stereo pair images listed in Table 1 with the NASA Ames Stereo Pipeline (ASP) (Beyer et al., 2018). We then orthorectified stereo and non-stereo images over the DTM using the Co-registration of Optically Sensed Images and Correlation (COSI-Corr) tool (Leprince et al., 2007; Bridges et al., 2012). At the DTM production stage in ASP we performed bundle adjustment by running the program bundle_adjust, which corrects for errors in camera position and orientation. The DTM was further aligned over a MOLA raster (115 m/pixel) using the program pc_align (Beyer et al., 2018), resulting in dune topography that is well resolved in the DTM (Figures 1C, 4A). To quantitatively test our results, we subtracted the NASA ASP DTM from the MOLA raster. The computed elevation difference was 0.22 ± 7.24 m, which is in line with similar values reported elsewhere (e.g., Kim and Muller, 2009; Kim et al., 2012). The non-stereo images (Table 1) were co-registered at the orthorectification stage in COSI-Corr over the stereo image ESP_044722_2570 by giving a set of tie points. The resulting normalized misregistration error was 0.52 ± 2.09 pixels for ESP_017426_2570 (60 tie points) and 0.02 ± 2.2 pixels for ESP_062023_2570 (40 tie points). The co-registration was further improved, individually for each of the study dunes, by applying a spline transformation in ArcMap using 12 tie points on static features surrounding the slip faces, such as boulders, which produced a fit with a root-mean-square error <0.01 m. The resulting images exhibit very little offset on surfaces surrounding the dunes (Supplementary Animations S1, S2).
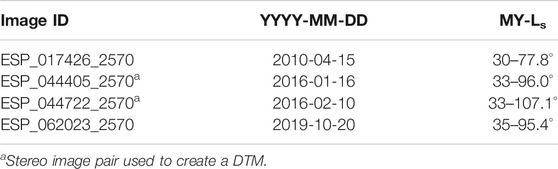
TABLE 1. Orthorectified HiRISE images and their acquisition dates.
The locations of slip face brink lines and slip face toe lines were mapped for Dunes A and B in each orthoimage (Supplementary Animations S1, S2). The displacement over time was calculated by measuring the area between brink/toe lines in successive images and dividing by the length of the earlier of the brink/toe lines. The uncertainty was calculated by conservatively estimating a typical crestline displacement error of 0.5 m. Although toe lines advanced downwind with time, brink lines sometimes underwent backwasting, receding as new alcoves formed. As a result, the brink line change is a net displacement that is the sum of its advancement (positive migration) and recession (negative migration). Net migration rates are the resulting net displacement divided by the time change between successive images. This was determined for both toe and brink lines; we considered the final net migration rate of the dunes to be the average of those measured for the brink and toe. Following Ould Ahmedou et al. (2007), a barchan’s migration rate, or celerity,
To measure pattern change along each wake, we used the method of Werner and Kocurek (1999) to measure bedform spacing and defect density. Using ArcMap™ 10.5 by Esri®, TAR crests within each wake were mapped at a scale of 1:200, a resolution sufficient to resolve bedform interactions. The resulting polylines were clipped into several 50 m-long polygons (10 for Dune A, 8 for Dune B), bounded laterally by the wake margins (see Figure 4A). Within each 50 m segment, we measured the polygon’s area
The mean bedform spacing in each 50 m polygon was measured using two methods. In the first method, we calculated the bedform spacing by dividing the polygon area by the sum of crest lengths
Dune migration rates were determined using orthorectified HiRISE images of Dunes A and B, as described in Section Dune Migration Rates. Table 2 lists the slip face brink and toe migration rates between each set of image pairs, and Supplementary Animations S1, S2 show the observed changes between successive images. Each time period encompassed more than a single seasonal cycle, but the images were acquired at nearly the same season, with the first time period spanning ∼3 Mars years (MY) and the second spanning ∼2 MY. In both periods, the net dune advancement is toward the southeast, with more advancement on the southeastern portions of the toe, and less on the northeastern portions of the toe. On both dunes, the brink advanced more than the toes in the first period, whereas the toes advanced more than the brinks in the second period. This temporal change in migration behavior and its consistency on both dunes suggests a difference in lee slope processes from the first to the second period (e.g., the second period appears to have been prone to more alcove formation). By assuming that the mean of the brink and toe advancement rates represents the mean lee face migration in each time period, we determined that the first period experienced approximately twice the lee face advancement rate as the second period. This suggests significant interannual variations in dune activity, underscoring the crucial need for long baseline migration rate estimates to robustly determine the mean crest sand fluxes within any dune field on Mars.
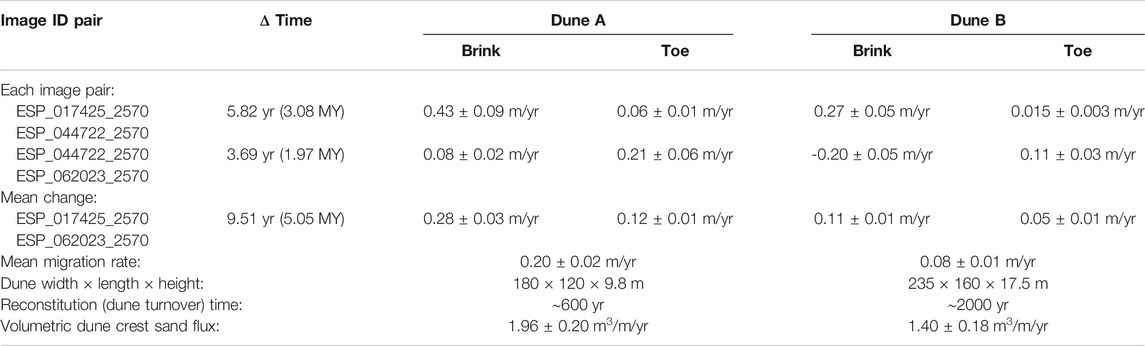
TABLE 2. Dune migration rates.
Averaging the brink and toe advancement, the mean migration rate over the whole 9.51 years (5.05 MY) period is 0.20 ± 0.02 m/yr for Dune A and 0.08 ± 0.01 m/yr for Dune B, generally toward the southeast. The resulting volumetric crest sand fluxes are 1.96 ± 0.20 and 1.40 ± 0.18 m3/m/yr, respectively. These values are on the low end, but not unusual, for actively migrating martian dunes (Bridges et al., 2013; Chojnacki et al., 2019; Davis et al., 2020). The crest sand fluxes are an order of magnitude or more lower than those measured at the Olympia Undae margin ∼200 km to the northwest (Chojnacki et al., 2019; Boazman et al., 2020), despite the study dunes’ location at the windward edge of the dune field, where sand fluxes are typically at a maximum (e.g., Jerolmack et al., 2012). The high walls of the Scandia Cavi likely shield our study area from fierce polar winds.
The Dune A and B wakes extend undisturbed upwind from their perturbing dunes by 500 m and 400 m, respectively. By assuming that the measured dune migration rates over the past 9.5 years are representative of the last several thousand years, the distance upwind of the dunes along each wake can be mapped onto a timeline. The variation in migration rates between the first and second time periods suggests that the dunes are subject to substantial interannual differences in activity, calling into question this assumption. The width of both wakes is uniform, indicating that the dunes have not grown or shrunk while constructing their wakes, which would have further complicated determination of the timeline. Acknowledging that the variation in wind transport capacity over the past several thousand years cannot yet be ascertained, we rely on the best available data and assume that the 9.5 years timeline represents the mean dune migration rate over the past several thousand years. Under this assumption, the most distal parts of the Dune A and B wakes would have lain exposed for ∼2,500 and 5,000 years, respectively (approximately 4 and 2.5 dune turnover times). Even at these upwind ends, the wake patterns are visibly less well organized than the adjacent mature pattern (Figure 4), suggesting that TAR patterns in Scandia Cavi require several thousand years to approach an apparent high level of maturity after burial by a dune.
The TAR patterns downwind of the wakes represent initial states of the wakes before being buried by Dunes A and B. The TARs in these regions have lain undisturbed since the passage of dunes immediately downwind of them. Figure 4A shows the location of the three dunes immediately downwind of the Dune A and B patterns and the mature pattern (Dunes C, D, and E, respectively). The migration rate of these dunes can be estimated by measuring their height, and by assuming that the volumetric crest fluxes of Dunes A and B are representative of those nearby
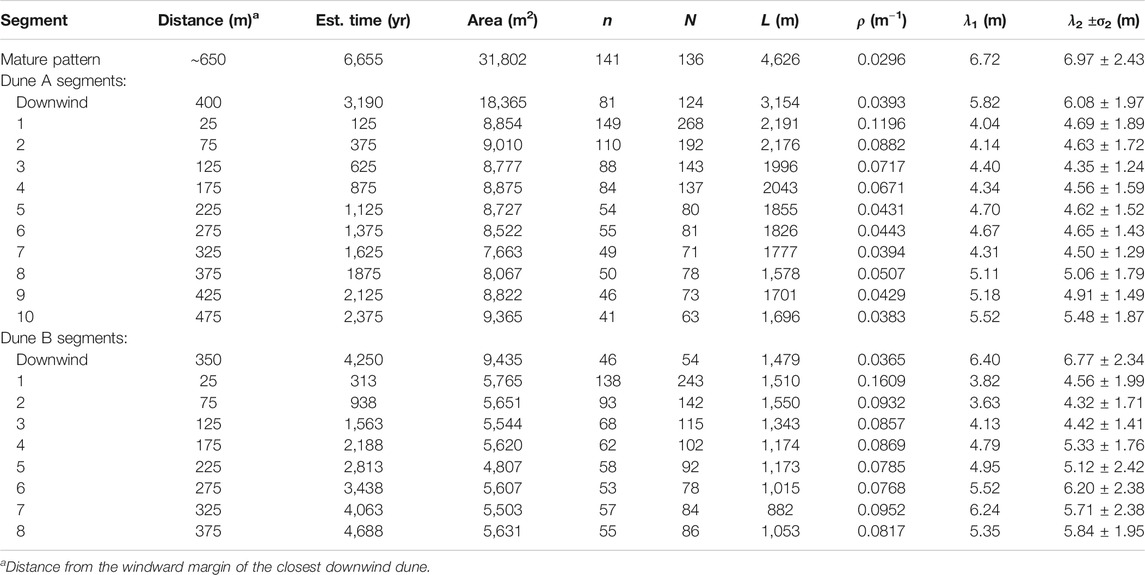
TABLE 3. Pattern analysis measurements of wakes.
The mean orientations of the wake margins (Table 4) illustrate the long-term eastward migration of the dunes. This is consistent with the occurrence of eastward-facing lee slopes containing many mass-wasting slumps mainly formed by transverse winds from the west (Eastwood et al., 2012). The mapped wake bedforms are not perfectly orthogonal to the wake margins, but rather they are rotated slightly counterclockwise from orthogonal (∼97° and ∼109° for the wakes of Dunes A and B, respectively, see also Supplementary Figure S4). This suggests that the TARs may respond to a slightly different subset of winds than the dunes, possibly being mobilized only by winds strong enough to activate the TARs. If this is the case, then the TAR orientations suggest that a strong southwesterly wind may act in concert with the main westerly wind to form TAR crests, which is consistent with elongated northerly barchan arms observed throughout this part of the dune field.
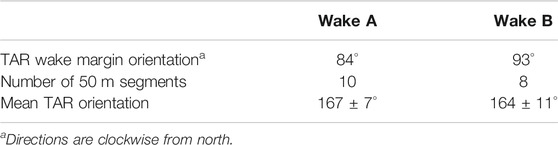
TABLE 4. Characteristics of measured wakes.
The results of mapping crestlines and pattern analysis are listed in Table 3. Figure 5 shows the mean bedform spacing
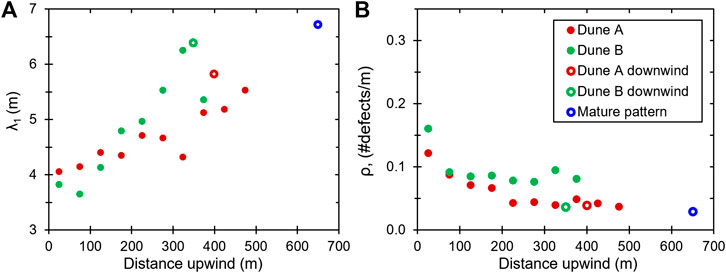
FIGURE 5. A general trend toward bedform maturity along the dune wakes is shown by their (A) mean bedform spacing
In the Dune A and B wakes, the initial downwind spacing of 5.8 and 6.4 m is disrupted by the dune, resulting in a spacing of 4.0 and 3.8 m immediately upwind of the dunes, respectively (Figure 5A). Likewise, the initial defect density of 0.030–0.037 m−1 abruptly jumps by a factor of ∼4 to 0.120 and 0.161 m−1 upwind of the Dunes A and B, respectively (Figure 5B). In both wakes, bedform spacing generally increases and defect density generally decreases with distance upwind from the dunes, as would be expected for a coarsening pattern. The Dune B wake bedform spacing increases more over the same distance than the Dune A wake, but its defect density drops less over the same distance. As with the initial downwind patterns, the migration rate of the perturbing dune may influence how the wake pattern evolves, with the slower Dune B producing a wider wake crestline spacing and higher defect density than Dune A. At its upwind end, the Dune A wake largely resembles the pattern of the initial downwind region, but the Dune B defect density does not quite reach the state of its initial downwind region. Neither wake reaches the high bedform spacing and low defect density exhibited by the mature pattern.
Table 4 includes wake bedform wavelengths calculated by counting individual crest-to-crest distances along lines orthogonal to the mean wake crestline orientation
The pattern within the wakes represents a combination of exhumed TARs and ripples shed from the passing barchans (the latter will be hereafter referred to as “ripples”). To determine the degree to which the ripples interact with the underlying TAR pattern, and to determine whether ripples could grow into straight-crested, widely spaced TARs, we determined which of the mapped crestlines are TARs and which are ripples. Once identified, we investigated variations in the patterns of each bedform type with distance from the perturbing dune to constrain which processes control pattern change along the wake.
Figure 6A shows the results of this categorization for Dune A, the region downwind of Dune A, and the mature pattern. Dune B was not mapped because only the south side of its wake was adjacent to known TARs, thus limiting confident categorization of crestlines. Firstly, all the long-crested bedforms in the mature pattern area were mapped as TARs with a high confidence level (in blue). Where they extended into the wake, these crestlines were similarly coded in blue, and interpreted as TARs that predated the passage of the perturbing dune, and either had not been buried or had been exhumed. Similarly, bedform crestlines within the wake that extended into the largely unperturbed area north of the wake were coded blue. These crestlines typically had a relatively low sinuosity and nearly always spanned a substantial fraction of the wake’s width. TAR crestlines identified with a moderate level of confidence (in green) were similarly straight and long, seeming to fill the space between TARs that appeared to be approximately twice as wide as nearby TARs (i.e., contributing to a regularly spaced TAR pattern), but these crestlines did not cross the lateral margins of the wake. Crestlines mapped with a low level of confidence (in yellow) were shorter, did not cross the wake margin, filled the wide spacing between more confidently identified TARs, and often appeared to be extensions of more confidently identified TARs that were partly buried by ripples. We considered the remaining crestlines to be ripples (in red). The ripple crestlines were often very sinuous and short (typically <∼50 m in length), commonly filling gaps between TARs but sometimes superposing TAR crestlines.
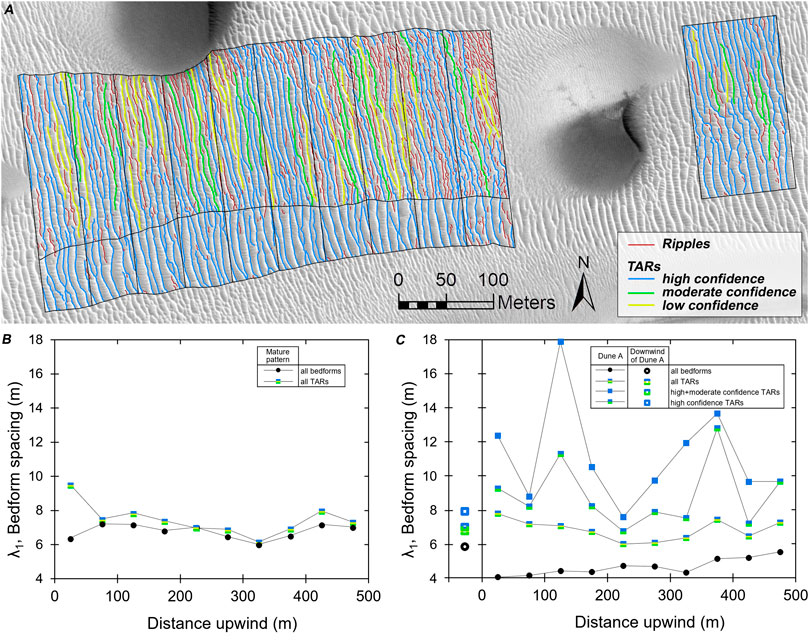
FIGURE 6. (A) TARs and ripples identified in the Dune A wake, downwind region and in the mature pattern (orthorectified HiRISE image ESP_044722_2570). The variation of bedform and TAR spacing with distance upwind in the (B) mature pattern and the (C) wake indicate that the TAR spacing in each area is fairly constant, suggesting that the passage of Dune A did not strongly affect the TAR pattern in the wake.
The orientations of TAR and ripple crestlines lend some confidence in our categorization of TARs distinctly from ripples (Supplementary Figure S5). At all sites, bedforms identified as TARs have a lower angular standard deviation that is always contained within that of ripples. Further, in most cases the mean ripple orientation is slightly counterclockwise of the mean TAR orientation (given the broad standard deviations, this difference is not statistically significant, but the trend holds at all but three locations). These consistencies suggest that TARs and ripples respond differently to incident winds, and thus may be regarded as distinct sets of bedforms.
Once the TARs were distinguished from ripples, we compared the TAR pattern along the wake to that of the mature and downwind patterns. If ripples introduced by Dune A have disrupted the TAR pattern, then the TARs should appear less ordered than those in the region downwind of Dune A, becoming more ordered with distance upwind of the dune. The mature TAR pattern serves as a control, as it has not been recently buried by a dune and thus it should exhibit a reasonably consistent degree of maturity along the length of the wake. A simple measure of this disorder is the measured TAR spacing in the wake, in which:
1. a spacing wider than that measured in the downwind and mature areas indicates that not all TARs are being identified (perhaps because they have been buried by ripples),
2. a narrower spacing indicates that either the TAR pattern has indeed been disrupted by Dune A’s ripples (consistent with the first hypothesis in Section Introduction), or that some ripples have been misidentified as TARs, and
3. a spacing equal to that measured in the downwind and mature areas suggests that the passage of Dune A has little effect on the TARs (consistent with the second hypothesis in Section Introduction).
In Figure 6B, the spacing of the bedforms in the mature pattern adjacent to the wake has no trend with distance, mostly varying between ∼6-8 m (the mean spacing is 7.3 ± 0.9 m). This range provides some measure of both the average and expected variation of TAR spacing within the wake in an undisrupted environment. In the wake (Figure 6C), the spacing of TARs mapped with high confidence varies considerably, but this variation drops to a near steady spacing of 6.8 ± 0.6 m when TARs mapped with moderate and low confidence are included, matching that measured in the downwind region. From this we conclude that the TAR pattern in the wake, to the degree that it can be distinguished from ripples, does not appear to substantially vary with distance from Dune A, and thus that the ripples have not significantly perturbed the TAR pattern (consistent with the second hypothesis in Section Introduction). Additionally, the TARs identified in the wake predate formation of the wake; the wake consists of the previous TARs plus the addition of ripples shed by migrating dune.
TARs display morphologies typical of interactions with each other, demonstrating that they have migrated in the past, and perhaps continue to do so very slowly. Figure 7 provides several examples of these interactions in the mature pattern, where TARs were most confidently mapped. Numerous terminations curve toward other TARs, indicating ongoing defect repulsions (DR). During a defect repulsion the faster-migrating defect (impactor) of the upwind bedform collides with the downwind bedform (target). Subsequently, the defect combines with a segment of the target in a continuous crestline, and the redundant target crestline segment is ejected downwind (ejecta) (Landry and Werner, 1994; Werner and Kocurek, 1999; Kocurek et al., 2010). In a few places, two TAR crests appear to have approached one another and merged over a short (<10 m) distance. This is similar to the lobe extensions (LE) observed by Venditti et al. (2005), in which a short portion of a crestline migrates faster than the rest of the bedform, forming a convex lobe that overtakes and merges with the next bedform downwind. Alternately, these interactions may simply be defect and bedform repulsions that look much like lobe extensions. In a bedform repulsion, both defects of an upwind bedform (i.e., their terminations) collide and recombine with a downwind bedform, and the central redundant segment is ejected downwind (Landry and Werner, 1994; Brothers et al., 2017). Short crestlines (red in Figure 7) in the mature TAR pattern may represent either ripples or ejecta from previous interactions.
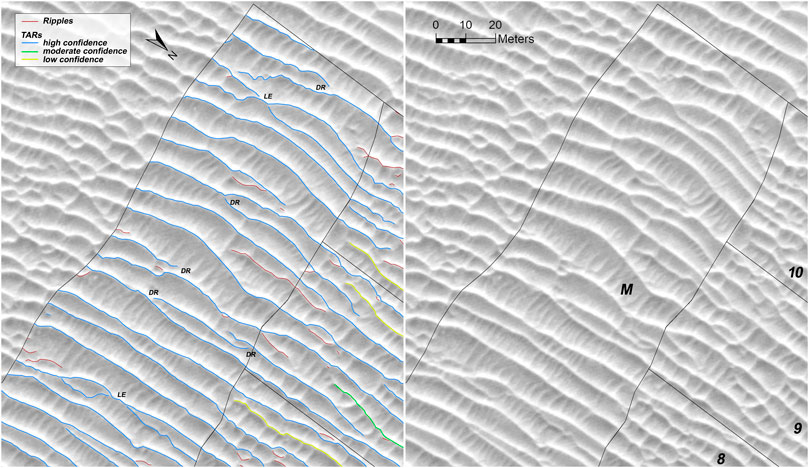
FIGURE 7. TAR interactions in the mature pattern, shown with and without mapped crestlines (orthorectified HiRISE image ESP_044722_2570). Identified interactions are defect repulsion (DR) and possible lobe extensions (LE). Numbers correspond with wake segments, and the mature region is labeled M.
In order to understand what happens to ripples in the wake, we investigated whether the ripples were simply migrating over the TARs, or if the ripples were interacting with the TARs. The overall growth in all bedform spacing along the Dune A wake (Figures 5A, 6C) cannot be attributed to changes in TARs (Section Distinguishing TARs and ripples in the Dune A wake, Figure 6), so it must be caused by ripples undergoing constructive interactions over this distance (i.e., over time). Constructive interactions are defined as those that reduce the number of bedforms and defects within the field, and thereby contribute to pattern coarsening (Kocurek et al., 2010). Indeed, small ripples diminish in number with distance upwind of Dune A, while longer ripples (mainly >∼20 m) appear (Supplementary Figure S6). Bedforms interpreted to be ripples were also found in the downwind area and mature pattern (Figure 6) despite their marked dropoff in number along the wakes. Their uniform presence, even in the most mature patterns, may represent ejecta from TAR interactions, or they may indicate that ripples unrelated to the large dark dunes migrate into or originate within the area.
Short ripples (<∼20 m long) occur along the entire wake, interacting with TARs in small defect repulsions and bedform repulsions that likely will result in their being absorbed by the TARs (see “BR” in Figure 8B). Although small segments of ejecta result, these will likely merge with the much larger underlying target TAR or a downwind TAR. While still on the stoss slope of the dune, some ripples have linked with each other laterally to become moderately long-crested (e.g., Supplementary Figure S3). Immediately upwind of Dune A, ripples bury some of the TARs, often preferentially forming along TAR crestlines or crossing them at a shallow angle (Figure 8A). This trend of ripples superposing TARs at a shallow angle is also seen in some longer ripples farther upwind in the wake (arrows in Figure 8B), where the southern ends of the ripples are downwind of the TARs they superpose, and the northern ends are upwind. This slight counterclockwise rotation suggests the ripples respond to incident winds than the TARs (also seen in Supplementary Figure S5). However, such superposing ripples are not found at the distal upwind part of the wake, nor are they found in the downwind or mature areas (Figure 9A). It is likely that by this point, the superposing ripples have merged with the underlying TARs, thus contributing to TAR growth. In these more mature patterns, longer bedforms identified as ripples tend to be parallel to the TARs, and they were found in troughs between TARs (rather than crossing them). It is possible that in time these long ripples may become TARs, but most of those shed from the dune are consumed by the TARs.
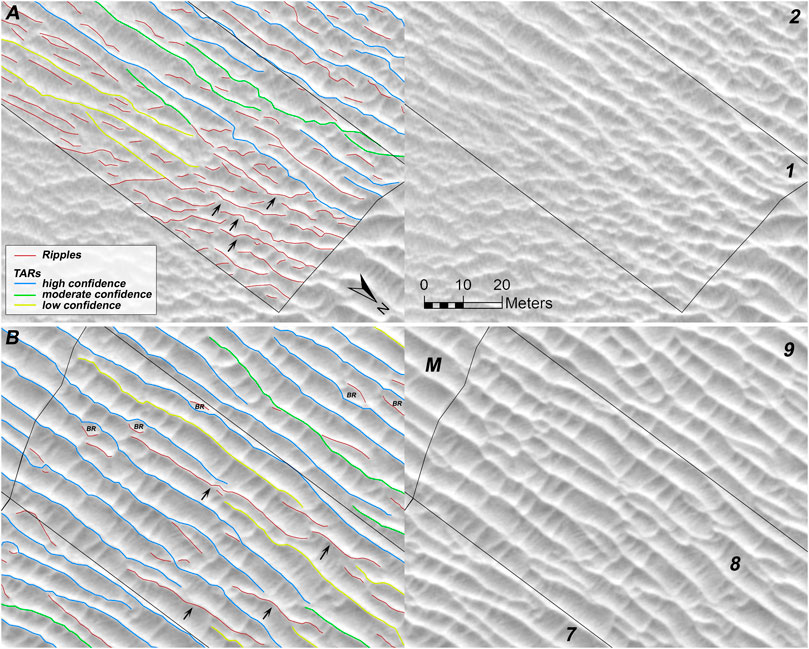
FIGURE 8. Ripples and TARs (A) just upwind of Dune A and (B) farther upwind in the Dune A wake, shown with and without mapped crestlines (orthorectified HiRISE image ESP_044722_2570). Numbers correspond with wake segments, the mature region is labeled M, arrows indicate ripples that superpose TARs, bedform repulsions between TARs and ripples are labeled BR.
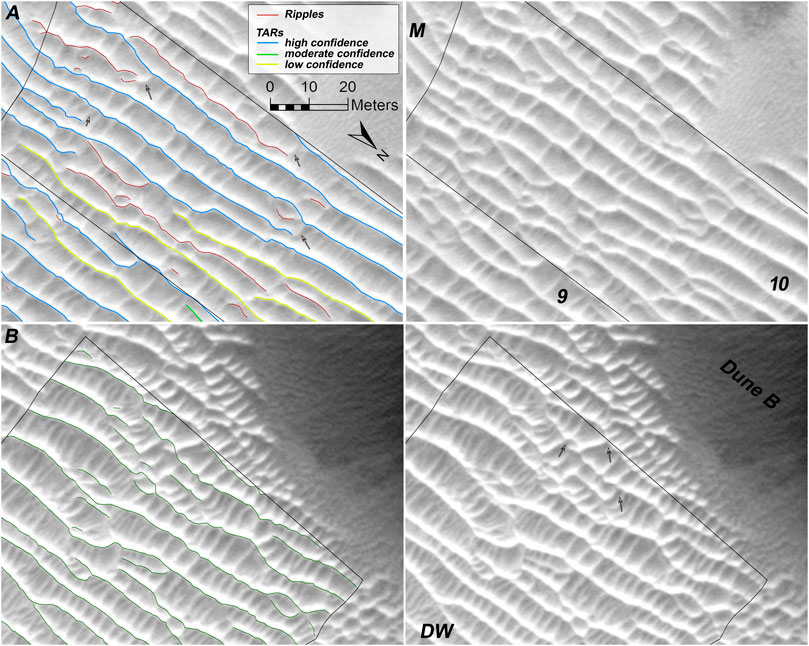
FIGURE 9. Ripples and TARs shown with and without mapped crestlines at (A) the upwind edge of the mapped Dune A wake and (B) along-slope ripples influencing TARs downwind of Dune B (orthorectified HiRISE image ESP_044722_2570). Numbers correspond with wake segments, the mature region is labeled M, the downwind region is labeled DW. Arrows indicate along-slope ripples that connect the larger bedforms at a defect in the pattern and, where the ASRs are large enough, potentially contributing to defect generation on TAR crestlines.
Not yet discussed are the numerous short along-slope ripples (ASR) that are oriented orthogonally to the larger TARs and ripples. Given that they are parallel to the dominant westerly wind, it is possible that they are longitudinal (e.g., Silvestro et al., 2016). Alternatively, they may be transverse to subordinate winds with southerly and/or northerly components that are funneled along the slopes of TARs and ripples (e.g., Sullivan et al., 2007). None were observed to move or change in the overlapping HiRISE images (Supplementary Animations S1, S2). Occasionally the ASRs grow large enough relative to the TARs that the two bedforms interact. Figure 9B shows an area just downwind of Dune B where TAR crest sinuosity aligns with locations where ASRs intersect the TARs. In some places the ASRs have disrupted the TAR crests enough to create defects. The TAR and ASR pattern here somewhat resembles the networked TARs of Balme et al. (2008); this sort of interaction may explain the many polygonal TARs observed on Mars (e.g., those of Victoria and Endurance craters in Meridiani Planum). Although the ASRs more often appear to be too small to interact with the larger TARs and growing ripples in the wakes, they often link these larger bedforms at their defects (see arrows in Figure 9A). The ASRs may play a role in defect generation, perhaps contributing to the low but constant level of ripple/ejecta production observed in the more mature patterns.
Because the TARs migrate too slowly to measure over the 9.5 years between the first and last HiRISE images, interactions between TARs and ripples cannot be monitored. As a result, understanding the process of pattern development in the dune wakes requires consideration of bedform morphology to rule out or support the three hypothesized cases put forth in Section Introduction. Table 5 summarizes our findings.
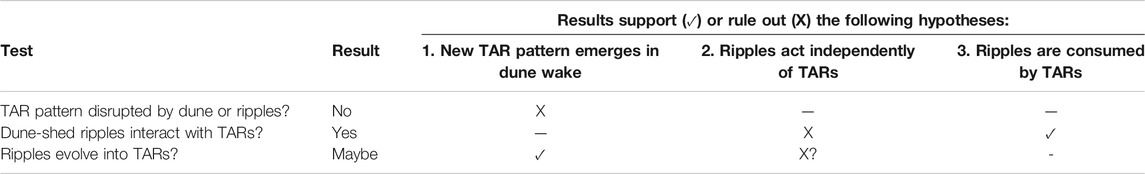
TABLE 5. Results of testing the hypotheses of wake bedform pattern development.
In Section Distinguishing TARs and Ripples in the Dune A Wake, we determined that the TAR pattern in the Dune A wake does not vary along the wake, nor is it dramatically different from that observed in either the mature pattern to the south of the wake or the downwind region. Neither the passage of Dune A nor the ripples shed from Dune A have disrupted the underlying TAR pattern. This result rules out the first endmember hypothesis, that the passage of the dune buried the TAR pattern, which then reformed solely from dune-shed ripples. Thus, the observed progression toward pattern maturity (Section Pattern Analysis Along the Wakes) does not represent that of TAR evolution alone.
In Section Ripple Interactions we investigated whether ripples interact with TARs in the Dune A wake. Short ripples (<∼20 m crest length) form small bedform and defect repulsions with TAR crests along the entire length of the wake. Longer ripples superpose TARs along the first ∼400 m upwind of the dune, but farther upwind they only appear in troughs between TARs. In both cases, the small repulsions and superposed ripples will be absorbed by the larger underlying TARs. These observations rule out the second endmember case in Section Introduction, that ripples shed from the dunes bypass the TARs without interacting with them. The observed progression toward pattern maturity (Section Pattern Analysis Along the Wakes) does not reflect that of ripples merely migrating out of the wake, but rather that of ripples either linking to each other or interacting with the underlying TARs.
Having ruled out the first two hypotheses, the third is the most plausible, that ripples shed from the dune interact with exhumed TARs, mostly being consumed by them. We propose that this process is an as-yet unreported growth dynamic for TARs, that is consistent with other work finding a continuum between ripples superposed on dunes and TARs (e.g., Duran Vinent et al., 2019). The ripples represent only a small fraction of the volume of the TARs, thus not measurably affecting TAR wavelength or, to the resolution limit of our DTM, TAR heights. A few long ripples linger in the most distal part of the wake, suggesting that some portion of the first endmember case may occur. That is, some of the long ripples may evolve into new TARs, but they do so without measurably affecting the underlying TAR pattern. To first order, though, the observed progression toward wake pattern maturity represents the time during which ripples are absorbed into the already established TARs.
Using the migration rates of Dunes A and B, the age of the wake exposures can be used to date the timing of pattern development. All else being equal, the two wake patterns should develop at roughly the same rate. Figure 10 shows how the wake bedform spacing and defect density vary with time, assuming that the dune migration rates over the past 9.5 years are both constant and representative of those over the past several thousand years. In both wakes (Figure 10A), the bedform wavelength changed little over the first ∼1,000 years and then began to grow, approximately following a power law such that for the TAR wavelength in meters
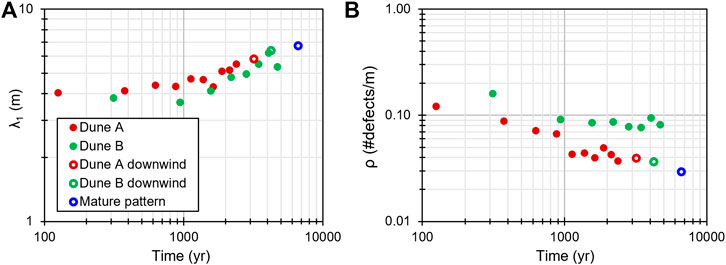
FIGURE 10. (A) Mean bedform spacing and (B) defect density with estimated age in the wakes, downwind of each dune, and the mature pattern (see Figure 4).
In the case of Dune A, the defect density dropped to a value similar to that of the initial downwind region by ∼1,500 years. However, the defect density in Dune B has not managed to reach the low density found in the initial downwind region of Dune B within its ∼5 kyr timespan. Dune B migrates more slowly than Dune A, likely producing a relatively higher flux of ripples to bury the TARs, link laterally with one another, and then become absorbed by underlying TARs. This may explain why the Dune B wake wavelengths are lower than those of Dune A, but it would not explain why the Dune B wake defect density does not drop to match that of the area downwind of Dune B. Some unknown process in the Dune B wake appears to be introducing new defects at a rate faster than the TARs can absorb ripples. A possibility is the presence of a dune immediately upwind of the Dune B wake (labeled “F” in Figure 4). The Dune B wake would experience an elevated sand flux coming from the northern Dune F horn (or rather, the region of the dune that would be a horn if it were there), as well as a reduced sand flux from the central part of Dune F slip face (e.g., Hersen et al., 2004). These effects, and possibly the differential between them, may be sufficient to introduce new defects to the ripples in the Dune B wake.
As with all bedforms, pattern coarsening through TAR-TAR interactions is thought to be the original mechanism for Scandia Cavi TAR growth, but TAR interactions with the dune-shed ripples provides an additional mechanism for TAR growth, in which sand from the ripples is incorporated into the TARs. The timescale for TAR pattern coarsening cannot be determined with the available data, but the contribution to TAR growth from the absorption of the ripples may be constrained to a degree by using the migration rate of the dunes and making some simplistic assumptions. Hypothetically, if TAR growth progressively increased by 1% with the passage of each dune leaving a sediment wake, and if absorption of dune-shed ripples were the sole source of TAR growth, then the current TAR bedforms could be constructed to their current state with the passage of ∼100 dunes. In this part of the dune field, the barchans are spaced by
tLike many bedforms, the martian TARs develop into fields with distinctive patterns and identifiable interactions. These interactions imply that the TARs have migrated, but without the opportunity for detailed stratigraphic analysis or a time-series of bedform interactions, their development has remained poorly understood. We analyzed a time sequence of TAR and ripple exposures, left as trails in the wake of barchans that have migrated over a TAR field located in Scandia Cavi on Mars. Ripples formed on the barchan stoss slopes merge and lag behind the dunes, producing a pattern along the wake that appears to mature over a distance of several hundred meters upwind of each dune (i.e., bedform wavelength increases and defect density decreases).
We conducted morphological analyses of the wake bedform crestlines to distinguish between the following three hypotheses describing the observed pattern development: 1) the pattern in the wake of each dune forms anew from sediment deposited by the barchans, burying the underlying TARs, 2) the wake pattern consists of relatively immobile TARs being exhumed while the more mobile ripples lagging behind the dunes migrate away without interacting with the TARs, or 3) an intermediate case in which ripples first bury, and then interact with established TARs, finally being consumed by the TARs.
The primary findings are as follows:
- The TAR pattern emerges from burial largely unscathed by the passage of the barchan, ruling out the first hypothesis.
- Ripples in the wake laterally link with one another or form small bedform repulsions with TARs. Most of these ripples will be consumed by TARs because the linked ripples are too long to readily migrate out of the area and the bedform repulsions are too small to act independently of the TARs This supports the third hypothesis and rules out the second, although the presence of long ripples at the far upwind portion of the wake suggests that a small fraction of ripples may survive and grow into new TARs.
- We propose that consumption of dune-shed ripples is a growth mechanism for TARs, consistent with recent work suggesting a continuum between ripples and TARs.
- In addition to TARs and dune-shed ripples are ASRs, small ripples oriented orthogonal to the main wake pattern. Generally, these ripples are too small to interact with the larger bedforms, but they frequently link TARs and dune-shed ripples at their defects. In a few locations the ASR are large enough to disrupt TAR crestlines, potentially contributing to defect generation throughout the greater TAR field.
- The timing of TAR growth cannot be accurately measured with available data. However, by assuming that 1) current dune migration rates are representative of long-term dune migration (0.20 ± 0.02 m/yr for Dune A and 0.08 ± 0.01 m/yr for Dune B), that 2) TAR growth occurs entirely through ripple consumption, and that 3) the passage of each successive barchan contributes to 1% of a TAR’s volume, we estimate a lower limit age of TARs in this part of the dune field to be ∼270 kyr.
- Because the TARs have not been observed to migrate over the 9.5 year period of available image monitoring, and because (in contrast) the dunes are actively migrating and contributing sediment to their wakes, we suggest that at the present, consumption of ripples by TARs is the dominant mechanism of TAR growth in these dune wakes.
- We mapped distance along the two wakes to a timeline, by assuming that the dunes have migrated at steady rates for the last several thousand years. The resulting temporal trends in bedform spacing and defect density in the dune wakes were consistent with an initial period of ∼1,000 years dominated by constructive ripple-ripple interactions, such as lateral linking, that eliminated defects without substantially coarsening the pattern. This period was followed by several thousand years of ripple-TAR interactions that both removed defects and gradually increased the overall bedform wavelength. The pattern coarsened at roughly the same rate in both dune wakes, but defect densities varied at different rates, possibly as a result of varying boundary conditions caused by proximity to other dunes.
There are broader implications to this work that can be applied to TARs elsewhere on Mars. The construction of TARs through consumption of ripples presently appears to be the main mechanism of TAR growth in the dune wakes of Scandia Cavi. The same process may occur anywhere on Mars where dunes migrate over TARs, but it cannot occur where no dunes are present. In such locations, TARs may have grown through interactions with other TARs. However, many TAR fields are associated with dune fields, where TARs are often less eroded than those found far from dunes (Berman et al., 2011) and where some are actively migrating today (Silvestro et al., 2020). Balme et al. (2008) first proposed that TARs may only be active in the vicinity of active sand dunes, which could be explained by our proposed growth mechanism. It remains to be seen whether TAR growth through TAR-TAR interactions presently occurs on Mars, or if it may have been active only in the past under a different climate state. Further work to determine the activity level of TAR-TAR and TAR-ripple growth mechanisms requires modeling and long-term monitoring of promising sites.
The raw data supporting the conclusions of this article will be made available by the authors, without undue reservation.
LF, SS, and GK contributed to the conception and design of the study. LF mapped the study area and performed statistical analyses of the results. SS constructed the DTM and orthorectified HiRISE images. GK and LF categorized bedforms by type and identified bedform interactions. LF wrote the first draft of the manuscript. All authors contributed to manuscript revision, read, and approved the submitted version.
This work was funded by the NASA Mars Data Analysis Program under Grant number 80NSSC18K1415.
The authors declare that the research was conducted in the absence of any commercial or financial relationships that could be construed as a potential conflict of interest.
A portion of this work was presented at the Sixth International Planetary Dunes Workshop on 12–13 May, 2020 (Fenton et al., 2020). We thank Matt Chojnacki for ensuring that the most useful HiRISE images were obtained for this study. We also thank the reviewers for constructive comments and suggestions.
The Supplementary Material for this article can be found online at: https://www.frontiersin.org/articles/10.3389/feart.2020.619704/full#supplementary-material.
Balme, M., Berman, D. C., Bourke, M. C., and Zimbelman, J. R. (2008). Transverse aeolian ridges (TARs) on Mars. Geomorphology 101 (4), 703–720. doi:10.1016/j.geomorph.2008.03.011
Berman, D. C., Balme, M. R., Rafkin, S. C. R., and Zimbelman, J. R. (2011). Transverse aeolian ridges (TARs) on Mars II: distributions, orientations, and ages. Icarus 213 (1), 116–130. doi:10.1016/j.icarus.2011.02.014
Beyer, R. A., Alexandrov, O., and McMichael, S. (2018). The Ames Stereo Pipeline: NASA’s open source software for deriving and processing terrain data. Earth and Space Science 5, 537–548. doi:10.1029/2018EA000409
Boazman, S. J., Grindrod, P. M., Balme, M. R., Vermeesch, P., Davis, J. M., Baird, T. R., et al. (2020). “Polar dune migration at Scandia Cavi, Mars: the effects of seasonal processes,” in 51st Lunar and Planetary Science Conference. (cancelled due to COVID-19), March 16–March 20, 2020. Available at: https://www.hou.usra.edu/meetings/lpsc2020/eposter/1975.pdf [abstract].
Bourke, M. C., Wilson, S. A., and Zimbelman, J. R. (2003). “The variability of transverse aeolian ridges in troughs on Mars,” in Lunar and planetary science conference XXXIV. Houston, TX, March 17–March 21, 2003 [abstract].
Bridges, N. T., Ayoub, F., Avouac, J.-P., Leprince, S., Lucas, A., and Mattson, S. (2012). Earth-like sand fluxes on Mars. Nature 485, 339–342. doi:10.1038/nature11022
Bridges, N., Geissler, P., Silvestro, S., and Banks, M. (2013). Bedform migration on Mars: current results and future plans. Aeolian Research 9, 133–159. doi:10.1016/j.aeolia.2013.02.004
Brothers, S. C., Kocurek, G., Brothers, T. C., and Buynevich, I. V. (2017). Stratigraphic architecture resulting from dune interactions: white sands dune field, New Mexico. Sedimentology 64 (3), 686–713. doi:10.1111/sed.12320
Chojnacki, M., Banks, M. E., Fenton, L. K., and Urso, A. C. (2019). Boundary condition controls on the high-sand-flux regions of Mars. Geology 47 (5), 427–430. doi:10.1130/G45793.1
Christensen, P. R., Engle, E., Anwar, S., Dickenshied, S., Noss, D., Gorelick, N., et al. (2009). “JMARS—a planetary GIS,” in American geophysical union fall meeting, San Francisco, CA, December 14–December 18, 2009 [abstract].
Coleman, S. E., and Melville, B. W. (1996). Initiation of bed forms on a flat sand bed. J. Hydraul. Eng. 122 (6), 301–310. doi:10.1061/(ASCE)0733-9429
Davis, J. M., Grindrod, P. M., Boazman, S. J., Vermeesch, P., and Baird, T. (2020). Quantified aeolian dune changes on Mars derived from repeat context camera images. Earth and Space Sci. 7 (2), e2019EA00874. doi:10.1029/2019EA000874
de Silva, S. L., Spagnuolo, M. G., Bridges, N. T., and Zimbelman, J. R. (2013). Gravel-mantled megaripples of the Argentinean Puna: a model for their origin and growth with implications for Mars. Geol. Soc. Am. Bull. 125 (11–12), 1912–1929. doi:10.1130/B30916.1
Dickson, J. L., Kerber, L. A., Fassett, C. I., and Ehlmann, B. L. (2018). “A global, blended CTX mosaic of Mars with vectorized seam mapping: a new mosaicking pipeline using principles of non-destructive image editing,” in 49th Lunar and planetary science conference, The Woodlands, TX, March 19–March 23, 2018 [abstract].
Duran Vinent, O., Andreotti, B., Claudin, P., and Winter, C. (2019). A unified model of ripples and dunes in water and planetary environments. Nat. Geosci. 12, 345–350. doi:10.1038/s41561-019-0336-4
Eastwood, E. N., Kocurek, G., Mohrig, D., and Swanson, T. (2012). Methodology for reconstructing wind direction, wind speed and duration of wind events from aeolian cross-strata. J. Geophys. Res. 117, F03035. doi:10.1029/2012JF002368
Edgett, K. (1997). Aeolian dunes as evidence for explosive volcanism in the Tharsis region of Mars. Icarus 130 (1), 96–114. doi:10.1006/icar.1997.5806
Elbelrhiti, H., Andreotti, B., and Claudin, P. (2008). Barchan dune corridors: field characterization and investigation of control parameters. J. Geophys. Res. 113 (F2), 1–21. doi:10.1029/2007JF000767
Fenton, L. K., Bandfield, J. L., and Ward, A. W. (2003). Aeolian processes in proctor crater on Mars: sedimentary history as analyzed from multiple data sets. J. Geophys. Res. 108 (E12), 5129. doi:10.1029/2002JE002015
Fenton, L. K., Michaels, T. I., and Chojnacki, M. (2015). Late Amazonian aeolian features, gradation, wind regimes, and sediment state in the vicinity of the Mars exploration rover opportunity, Meridiani Planum, Mars. Aeolian Res. 16, 75–99. doi:10.1016/j.aeolia.2014.11.004
Fenton, L. K., Silvestro, S., and Kocurek, G. (2020). “Pattern evolution in transverse aeolian ridges (TARs) in Scandia Cavi, Mars,” in The virtual Sixth International Planetary Dunes Workshop, May 12–15, 2020. Available at: https://www.hou.usra.edu/meetings/dunes2020/pdf/3027.pdf [abstract].
Foroutan, M., Steinmetz, G., Zimbelman, J. R., and Duguay, C. R. (2019). Megaripples at Wau-an-Namus, Libya: a new analog for similar features on Mars. Icarus 319, 840–851. doi:10.1016/j.icarus.2018.10.021
Foroutan, M., and Zimbelman, J. R. (2016). Mega-ripples in Iran: a new analog for transverse aeolian ridges on Mars. Icarus 274, 99–105. doi:10.1016/j.icarus.2016.03.025
Foroutan, M., and Zimbelman, J. R. (2020). Evaluation of large data sets for transverse aeolian ridges (TARs) on Earth and Mars. Planet. Space Sci. 189, 104966. doi:10.1016/j.pss.2020.104966
Gao, X., Narteau, C., and Rozier, O. (2015a). Development and steady states of transverse dunes : a numerical analysis of dune pattern coarsening and giant dunes. J. Geophys. Res.: Earth Surf. 120, 2200–2219. doi:10.1002/2015JF003549
Gao, X., Narteau, C., Rozier, O., and Du Pont, S. C. (2015b). Phase diagrams of dune shape and orientation depending on sand availability. Sci. Rep. 5, 1–12. doi:10.1038/srep14677
Geissler, P. E., and Wilgus, J. T. (2017). The morphology of transverse aeolian ridges on Mars. Aeolian Res. 26, 63–71. doi:10.1002/2014JE004633
Hayward, R. K. (2011). Mars global digital dune database (MGD3): north polar region (MC-1) distribution, applications, and volume estimates. Earth Surf. Process. Landforms 36 (14), 1967–1972. doi:10.1002/esp.2219
Hersen, P., Andersen, K., Elbelrhiti, H., Andreotti, B., Claudin, P., and Douady, S. (2004). Corridors of barchan dunes: stability and size selection. Phys. Rev. E - Stat. Nonlinear Soft Matter Phys. 69 (1), 1–12. doi:10.1103/PhysRevE.69.011304
Hugenholtz, C. H., Barchyn, T. E., and Boulding, A. (2017). Morphology of transverse aeolian ridges (TARs) on Mars from a large sample: further evidence of a megaripple origin? Icarus 286, 193–201. doi:10.1016/j.icarus.2016.10.015
Jerolmack, D. J., Ewing, R. C., Falcini, F., Martin, R. L., Masteller, C., Phillips, C., et al. (2012). Internal boundary layer model for the evolution of desert dune fields. Nat. Geosci. 5 (3), 206–209. doi:10.1038/ngeo1381
Kerber, L., and Head, J. W. (2012). A progression of induration in Medusae Fossae formation transverse aeolian ridges: evidence for ancient aeolian bedforms and extensive reworking. Earth Surf. Process. Landforms 37 (4), 422–433. doi:10.1002/esp.2259
Kim, J. R., and Muller, J. P. (2009). Multi-resolution topographic data extraction from Martian stereo imagery. Planet. Space Sci. 57, 2095. doi:10.1016/ j.pss.2009.09.024
Kim, J. R., Lin, S. Y., Hong, J. W., Kim, Y. H., and Park, C. K. (2012). Implementation of Martian virtual reality environment using very high-resolution stereo topographic data. Comput. Geosci. 44, 184–195. doi:10.1016/j.cageo.2011.09.018
Kocurek, G., Ewing, R. C., and Mohrig, D. (2010). How do bedform patterns arise? New views on the role of bedform interactions within a set of boundary conditions. Earth Surf. Process. Landforms 35, 51–63. doi:10.1002/esp.1913
Lämmel, M., Meiwald, A., Yizhaq, H., Tsoar, H., Katra, I., and Kroy, K. (2018). Aeolian sand sorting and megaripple formation. Nat. Phys. 14, 22–30. doi:10.1038/s41567-018-0106-z
Landry, W., and Werner, B. T. (1994). Computer simulations of self-organized wind ripple patterns. Phys. Nonlinear Phenom. 77 (1–3), 238–260.
Lapotre, M. G. A., Ewing, R. C., Lamb, M. P., Fischer, W. W., Grotzinger, J. P., Rubin, D. M., et al. (2016). Large wind ripples on Mars: a record of atmospheric evolution. Science 353 (6294), 55–58. doi:10.1126/science.aaf3206
Lapotre, M. G. A., Ewing, R. C., Weitz, C. M., Lewis, K. W., Lamb, M. P., Ehlmann, B. L., et al. (2018). Morphologic diversity of martian ripples: implications for large-ripple formation. Geophys. Res. Lett. 45 (19), 229–310. doi:10.1029/2018GL079029
Leprince, S., Barbot, S., Ayoub, F., and Avouac, J. P. (2007). Automatic, precise, ortho-rectification and coregistration for satellite image correlation, application to ground deformation measurement. IEEE J. Geosci. Remote Sens. 45 (6), 1529–1558. doi:10.1109/TGRS.2006.888937
Lü, P., Dong, Z., and Rozier, O. (2018). The combined effect of sediment availability and wind regime on the morphology of aeolian sand dunes. J. Geophys. Res.: Earth Surface 123 (11), 2878–2886. doi:10.1029/2017JF004361
Malin, M. C., and Edgett, K. S. (2001). Mars global surveyor Mars orbiter camera: interplanetary cruise through primary mission. J. Geophys. Res. 106 (E10), 429–523. doi:10.1029/2000JE001455
Narteau, C., Zhang, D., Rozier, O., and Claudin, P. (2009). Setting the length and time scales of a cellular automaton dune model from the analysis of superimposed bed forms. J. Geophys. Res. 114 (F03006), 1–18. doi:10.1029/2008JF001127
Ould Ahmedou, D., Ould Mahfoudh, A., Dupont, P., Ould El Moctar, A., Valance, A., and Rasmussen, K. R. (2007). Barchan dune mobility in Mauritania related to dune and interdune sand fluxes. J. Geophys. Res. 112 (F2), F02016. doi:10.1029/2006JF000500
Parteli, E. J. R., Kroy, K., Tsoar, H., Andrade, J. S., and Pöschel, T. (2014). Morphodynamic modeling of aeolian dunes: review and future plans. Eur. Phys. J. Spec. Top 223 (11), 2269–2283. doi:10.1140/epjst/e2014-02263-2
Silvestro, S., Vaz, D. A., Yizhaq, H., and Esposito, F. (2016). Dune-like dynamic of Martian aeolian large ripples. Geophys. Res. Lett. 43. doi:10.1002/2016GL070014
Silvestro, S., Chojnacki, M., Vaz, D. A., Cardinale, M., Yizhaq, H., and Esposito, F. (2020). Megaripple migration on Mars. J. Geophys. Res. Plan 125. doi:10.1029/2020JE006446
Skinner, J. A., and Mazzini, A. (2009). Martian mud volcanism: terrestrial analogs and implications for formational scenarios. Mar. Petrol. Geol. 26 (9), 1866–1878. doi:10.1016/j.marpetgeo.2009.02.006
Smith, D., Neumann, G., Arvidson, R. E., Guinness, E. A., and Slavney, S. (2003). Data from: Mars global surveyor laser altimeter mission experiment gridded data record. NASA planetary data system, MGS-M-MOLA-5-MEGDR-L3-V1.02003. https://pds-geosciences.wustl.edu/missions/mgs/megdr.html.
Sullivan, R., Arvidson, R., Grotzinger, J., Knoll, A., Golombek, M., Jolliff, B., et al. (2007). “Aeolian geomorphology with MER opportunity at Meridiani planum, Mars,” in 38th Lunar and planetary science conference, League City, TX, March 12–March 16, 2007 [abstract]. doi:10.1029/2005JE002541
Sullivan, R., Kok, J. F., Katra, I., and Yizhaq, H. (2020). A broad continuum of aeolian impact ripple morphologies on Mars is enabled by low wind dynamic pressures. J. Geophys. Res. 125, e2020JE006485. doi:10.1029/2020JE006485
Tanaka, K. L., Skinner, J. A., Hare, T. M., Joyal, T., and Wenker, A. (2003). Resurfacing history of the northern plains of Mars based on geologic mapping of Mars global surveyor data. J. Geophys. Res. 108 (E4), 8043. doi:10.1029/ 2002JE001908
Tanaka, K. L., Fortezzo, C. M., Hayward, R. K., Rodriguez, J. A. P., and Skinner, J. A. (2011). History of plains resurfacing in the Scandia region of Mars. Planet. Space Sci. 59 (11-12), 1128–1142. doi:10.1016/j.pss.2010.11.004
Tanaka, K. L., Skinner, J. A., Dohm, J. M., Irwin, R. P., Kolb, E. J., Fortezzo, C. M., et al. (2014). Geologic map of Mars. U.S. Geological Survey Geologic Investigations Map 3292 Scale 1:20,000,000 2014, 43. doi:10.3133/sim3292
Thomas, P. C., Malin, M. C., Carr, M. H., Danielson, G. E., Davies, M. E., Hartmann, W. K., et al. (1999). Bright dunes on Mars. Nature 397, 27–29. doi:10.1038/17557
Tsoar, H. (1983). Dynamic processes acting on a longitudinal (seif) sand dune. Sedimentology 30 (4), 567–578. doi:10.1111/j.1365-3091.1983.tb00694.x
Tsoar, H. (1984). The formation of seif dunes from barchans—discussion. Zeitschrift für Geomorphologie Stuttgart 28 (1), 99–103.
Venditti, J. G., Church, M., and Bennett, S. J. (2005). On the transition between 2D and 3D dunes. Sedimentology 52 (6), 1343–1359. doi:10.1111/j.1365-3091.2005.00748.x
Ward, A. W. (1979). Yardangs on Mars: evidence of recent wind erosion. J. Geophys. Res. 84 (B14), 8147–8166. doi:10.1029/JB084iB14p08147
Werner, B. T. (1995). Eolian dunes: computer simulations and attractor interpretation. Geology 23 (12), 1107–1110. doi:10.1130/0091-7613(1995)023<1107
Werner, B. T., and Kocurek, G. (1999). Bedform spacing from defect dynamics. Geology 27 (8), 727–730. doi:10.1130/0091-7613(1999)027<0727:BSFDD>2.3.CO;2
Wilson, S. A., and Zimbelman, J. R. (2004). Latitude-dependent nature and physical characteristics of transverse aeolian ridges on Mars. J. Geophys. Res. 109 (E10), E10003. doi:10.1029/2004JE002247
Zgheib, N., Fedele, J. J., Hoyal, D. C. J. D., Perillo, M. M., and Balachandar, S. (2018). Direct numerical simulation of transverse ripples: 1. Pattern initiation and bedform interactions. J. Geophys. Res.: Earth Surf. 123, 448–477. doi:10.1002/2017JF004398
Zimbelman, J. R. (2010). Transverse aeolian ridges on Mars : first results from HiRISE images. Geomorphology 121 (1–2), 22–29. doi:10.1016/j.geomorph.2009.05.012
Keywords: megaripples, large Martian ripples, transverse aeolian ridges, remote sensing, bedform interactions, bedform patterns
Citation: Fenton LK, Silvestro S and Kocurek G (2021) Transverse Aeolian Ridge Growth Mechanisms and Pattern Evolution in Scandia Cavi, Mars. Front. Earth Sci. 8:619704. doi: 10.3389/feart.2020.619704
Received: 20 October 2020; Accepted: 09 December 2020;
Published: 19 January 2021.
Edited by:
Davide Tiranti, Agenzia Regionale per la Protezione Ambientale (ARPA), ItalyReviewed by:
Matt Telfer, University of Plymouth, United KingdomCopyright © 2021 Fenton, Silvestro and Kocurek. This is an open-access article distributed under the terms of the Creative Commons Attribution License (CC BY). The use, distribution or reproduction in other forums is permitted, provided the original author(s) and the copyright owner(s) are credited and that the original publication in this journal is cited, in accordance with accepted academic practice. No use, distribution or reproduction is permitted which does not comply with these terms.
*Correspondence: Lori K. Fenton, bGZlbnRvbkBzZXRpLm9yZw==
Disclaimer: All claims expressed in this article are solely those of the authors and do not necessarily represent those of their affiliated organizations, or those of the publisher, the editors and the reviewers. Any product that may be evaluated in this article or claim that may be made by its manufacturer is not guaranteed or endorsed by the publisher.
Research integrity at Frontiers
Learn more about the work of our research integrity team to safeguard the quality of each article we publish.