- 1Atmosphere and Ocean Research Institute, University of Tokyo, Kashiwa, Japan
- 2Institute of Surface-Earth System Science, Tianjin University, Tianjin, China
- 3Graduate School of Science and Engineering, University of Toyama, Toyama, Japan
- 4Department of Chemistry, Gakushuin University, Tokyo, Japan
- 5Institute for Geothermal Sciences, Kyoto University, Beppu, Japan
- 6University Museum, Hokkaido University, Sapporo, Japan
- 7Faculty of Agriculture and Marine Sciences, Kochi University, Nangoku, Japan
- 8Department of Geosciences, National Taiwan University, Taipei, Taiwan
- 9Department of Geophysics, Tohoku University, Sendai, Japan
- 10Geotop, Research Center on the Dynamics of the Earth System, Université Du Québec à Montréal, Montreal, QC, Canada
Carbon capture and storage (CCS) is considered a key technology for reducing CO2 emissions into the atmosphere. Nonetheless, there are concerns that if injected CO2 migrates in the crust, it may trigger slip of pre-existing faults. In order to test if this is the case, covariations of carbon, hydrogen, and oxygen isotopes of groundwater measured from Uenae well, southern Hokkaido, Japan are reported. This well is located 13 km away from the injection point of the Tomakomai CCS project and 21 km from the epicenter of September 6th, 2018 Hokkaido Eastern Iburi earthquake (M 6.7). Carbon isotope composition was constant from June 2015 to February 2018, and decreased significantly from April 2018 to November 2019, while total dissolved inorganic carbon (TDIC) content showed a corresponding increase. A decrease in radiocarbon and δ13C values suggests aquifer contamination by anthropogenic carbon, which could possibly be attributable to CCS-injected CO2. If such is the case, the CO2 enriched fluid may have initially migrated through permeable channels, blocking the fluid flow from the source region, increasing pore pressure in the focal region and triggering the natural earthquake where the brittle crust is already critically stressed.
Introduction
There is a global consensus that some form of carbon capture and storage (CCS) technology is necessary to reduce CO2 emission associated with fossil fuel combustion into the atmosphere (IPCC Special Report, 2005). The majority of research into this technology has focused on securely isolating CO2 from the Earth’s surface and storing it in a reservoir which is sealed by an impermeable cap rock (Johnson et al., 2005; Michael et al., 2011). This strategy should prevent CO2 from leaking into the closest areas around the injection well but it may promote horizontal flow of CO2-rich fluids through available permeable horizons. Interactions between injected fluids and high angle faults may result in fluid accumulation and increases in pore pressure in the region around the area. This increase in pressure may propagate to much deeper regions where the brittle crust is already critically stressed and perhaps trigger slippage of pre-existing faults (Zoback and Gorelick, 2012). This mechanism is similar to the triggering of anthropogenic seismicity during high-pressure hydraulic injection experiments (Grigoli et al., 2018). However, to date, there are no case studies reported on the possible environmental consequences of CCS-CO2 injection.
The 2018 Hokkaido Eastern Iburi earthquake (M6.7) occurred on September 6th, 2018 in Northern Japan, close to the major active Ishikari-Teichi-Toen Fault Zone (ITTFZ), with a focal depth of 37 km (Asano and Iwata, 2019). The earthquake triggered large landslides and caused severe damage to the surrounding area with 36 casualties. Uniform strain accumulation was observed in this area from data collected by a global navigation satellite system in very recent years (Ohzono et al., 2019). The large-scale Tomakomai CCS demonstration project, built in the same region, was initially suspected to have indirectly caused the earthquake (KIKO network, 2019). The Japan CCS Co. Ltd.—the company that developed the project - reported that the CO2 injection point was too far from the epicenter to produce any appreciable amount of strain change or to induce an earthquake (Japan CCS, 2019). However, many concerns still exist regarding the potential relationship between large-scale CO2 injection and local earthquakes, and given that there is little consensus as to the potential consequences, further study is needed. Deep wells close to the CCS site may provide direct evidence of the CO2 leakage that can potentially trigger natural earthquakes.
Groundwater Samples
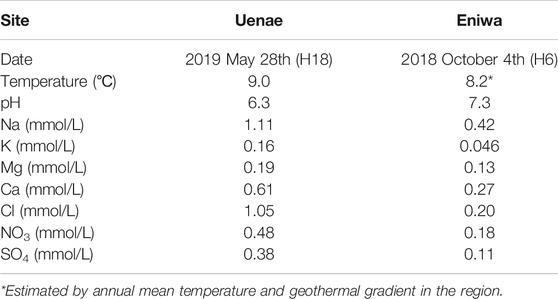
We collected groundwater samples from wells used for producing commercial bottled mineral water at Uenae and Eniwa sites, located 13 and 29 km from the CCS Tomakomai site, respectively (Figure 1). Commercial water has a precise production date and both the chemical compositions and stable isotopic composition are well preserved (Tsunogai and Wakita, 1995; Onda et al., 2018), with the exception of helium because of the high permeability of this gas through PET bottles. We purchased as many bottles as possible covering a period of three years before and a year and half after the M6.7 earthquake. Both wells are 90–100 m deep and tap a volcanic-sedimentary aquifer belonging to the Shiatsu pyroclastic flow, which erupted in the Late Pleistocene (Nakagawa et al., 2018). High-quality drinking mineral water is available from altered ignimbrite units. Chemical compositions of representative samples from Uenae and Eniwa sites are listed in Table 1 together with temperature and pH. Twenty-one untreated bottled water samples were analyzed for carbon, hydrogen and oxygen isotopes. The samples cover the period from June 2015 to February 2020, and include the critical period between April 2016 and December 2019, when a total of 300 kilotons of CO2 were injected, as well as the timing of the M6.7 Hokkaido earthquake event in September 2018.
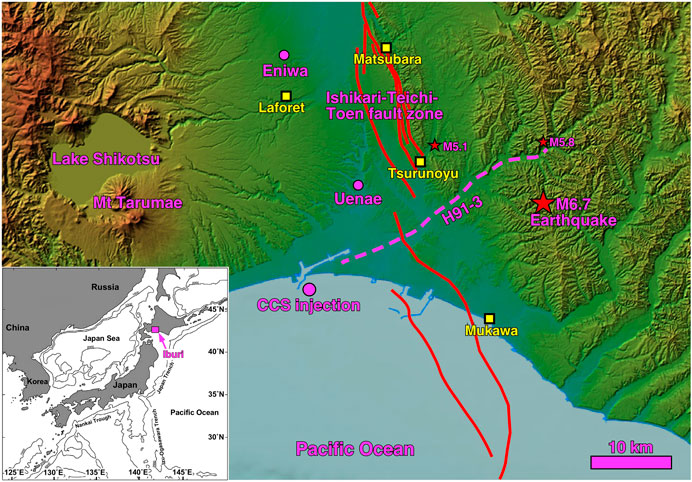
FIGURE 1. Location of Uenae and Eniwa sampling wells in the Hokkaido Iburi region; the CCS-CO2 injection point (purple dots); and main shock epicenter (M6.7) of the 2018 Hokkaido Eastern Iburi earthquake (red star). Two additional red stars denote the epicenters of the M5.1 earthquake on July 1st, 2017 and of the largest (M5.8) aftershock on February 21st, 2019. The red lines represent active faults in the Ishikari-Teichi-Toen fault zone (ITTFZ). The purple dashed line denotes the seismic reflection transect H91-3. Yellow squares show hot springs sampled for helium isotopes. The inset map shows the location of the Iburi region in Hokkaido, Japan.
Carbon, Hydrogen, Oxygen, and Helium Isotopes, and 14C Activity Measurements
We have carefully selected unopened mineral water bottles to avoid contamination by air CO2, which has a different isotopic composition than dissolved carbonates. Carbon isotopes were measured at the Atmosphere and Ocean Research Institute, University of Tokyo, Japan with a conventional continuous flow mass spectrometer (Delta V plus, Thermo Fisher) after standard decarbonation with phosphoric acid. Experimental details followed the methodology provided in Zhao et al. (2019). The 13C/12C ratios were calibrated against our in-house standard, converted to conventional V-PDB units, and expressed as δ values in per mil (‰). Total Dissolved Inorganic Carbon (TDIC) concentrations were estimated by a peak height method with standard samples of known amounts of TDIC. Experimental errors on carbon isotopes and TDIC concentrations were calculated by repeated measurements of standard samples. Hydrogen (2H/1H) and oxygen (18O/16O) isotopes of water were measured with a cavity ring-down spectrometer without any preprocessing at Geotop, Université du Québec à Montréal, Canada, using a Los Gatos LGR-T-LWIA-45-EP, and then verified at the Atmosphere and Ocean Research Institute, University of Tokyo, Japan (Onda et al., 2018) using a L2120-I Analyzer (PICARRO Co. Ltd.). They were calibrated against in-house standards, converted to the conventional V-SMOW units, and expressed as δ values in per mil (‰). Experimental errors on hydrogen and oxygen isotopes were calculated by repeated measurements of standard samples. TDIC was precipitated and purified. It was then reduced into pure amorphous carbon and the 14C/12C ratios were measured with a compact AMS system at the Institute of Surface-Earth System Science, Tianjin University, China (Dong et al., 2019). Extracted helium and neon from spring water samples were purified with hot Ti getters and charcoal traps held in liquid nitrogen. The 4He/20Ne ratios were measured by online QMS, and helium was separated from neon by a cryogenic charcoal trap. The 3He/4He ratios were measured with a noble gas mass spectrometer (Helix SFT, Thermo Fisher). Experimental details are provided in Sano et al. (2008).
Tomakomai Carbon Capture and Storage Demonstration Project
A large-scale CCS demonstration project was undertaken by the Japanese government in the Tomakomai site in Hokkaido, Japan (Figure 1). Intensive stakeholder engagement was implemented by the Japan CCS company because the operation was taking place in the port area close to a highly populated city. The CO2 source was offgas derived from a hydrogen production unit of an oil refinery located in the region. A high purity CO2 (>99%) was recovered from the offgas by an amine scrubbing process and the gaseous CO2 was compressed and then injected into two different offshore geological reservoirs (Yamanouchi et al., 2011; Sawada et al., 2018). The host reservoirs are the shallow Moebetsu Formation located at a depth of approximately 1000 m below the seabed and the deep Takinoue Formation with the depth of 2400 m. The former is a Lower Quaternary saline aquifer composed of 200 m thick sandstone, while the latter is a Miocene saline aquifer which consists of volcanic and volcaniclastic rocks with a thickness of 600 m. A schematic diagram of geological section is referred from Tanaka et al. (2017) and reproduced in Supplementary Figure S1. The CO2 injection of the shallow reservoir started in April 2016 and continued until November 2019. A total of 300 kilotons of gaseous CO2 was injected gradually (Supplementary Figure S2). A smaller amount of CO2, approximately 100 tons, was injected into the deeper reservoir.
Discussion
Temporal Variations of Stable and Radioactive Isotopes in Groundwater
The δ13C values and the TDIC contents, δ2Η and δ18O values, and 14C activity were measured in commercially-bottled groundwater as stated above, and are listed in Table 2. The δ13C value of the TDIC in Uenae well groundwater was constant at −17.8 ± 0.2‰ from June 2015 through February 2018, and then decreased to −18.8 ± 0.2‰ with some fluctuation (Figure 2A). The TDIC concentration at Uenae was also constant from June 2015 to February 2018, and increased significantly in December 2018, which is the inverse of the observed trend for δ13C (Figure 2B). On the other hand, the δ13C of TDIC in groundwater from the Eniwa well decreased over time, from −18.5‰ to −20.9‰, except for October 2017, while TDIC concentration remained constant at 0.68 ± 0.03 mmol/L, except for the most recent sample. Injected CO2 was the by-product of a hydrogen production unit of an oil refinery (Sawada et al., 2018). Its δ13C value should therefore have been lighter than −25‰ (Hoefs, 2018) and its 14C activity close to zero, because fossil fuels are too old to contain any anthropogenic 14C. Injection began in April 2016 and reached 100 kilotons of CO2 in November 2017 (Supplementary Figure S2), which is approximately one third of the total injected amount (Tanaka et al., 2014; Japan CCS, 2020). There was no heavy rain or flooding in the region during this period. Additionally, there is no large bridge or dam construction close to the observation wells that could have altered the groundwater system and triggered the earthquake (Gupta and Iyer, 1984). The Uenae site is located in non-volcanic frontal arc region, even though it is close to the volcanic front. There is no known cause, and no physical or chemical processes, capable of changing geochemical parameters such as carbon isotopes of groundwater except for oxidation of organic matter.
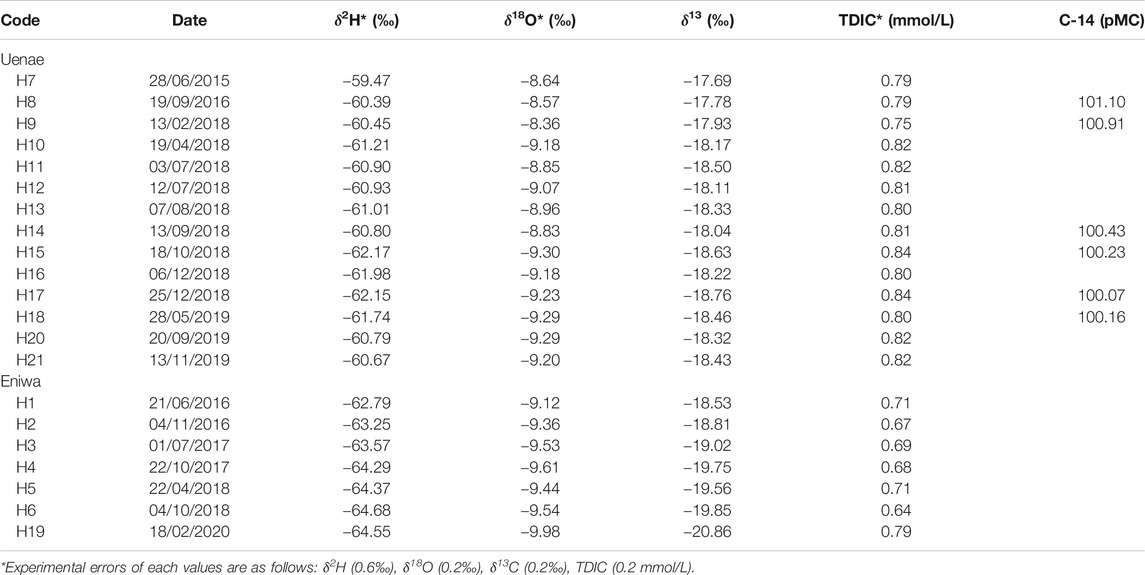
TABLE 2. Hydrogen, oxygen and carbon isotopes together with total DIC contents of groundwater samples in Hokkaido, Japan.
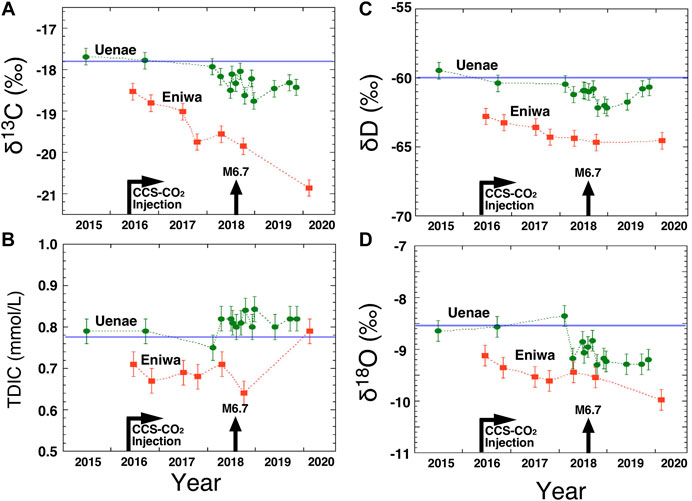
FIGURE 2. Temporal variations of (A)δ13C values of total carbonate in mineral water (B) total dissolved inorganic carbon (TDIC) concentration (mmol/L), (C)δ2H, and (D)δ18O values of mineral water. Error bars show 2σ values. Blue lines represent averages of three samples (2015, 2016, and april 2018) from the Uenae well. Start dates of CCS-CO2 injection and origin time of M6.7 earthquakes (M6.7 in Figure 1) are indicated by arrows in (A) and (D).
There may be a deep magmatic carbon component in the region close to Uenae (Marumo et al., 1995; Nitta and Inoue, 2011). The δ13C values of approximately −4‰ in magmatic CO2 is much heavier than that of present groundwater TDIC. Addition of a magmatic component should increase δ13C values of our samples. However this is not the case. The observed increase in TDIC contents at Uenae may be attributable to the CO2 injected at the Tomakomai site, because of the concomitant decrease in δ13C (Figure 2A), which is also observed in the 14C activity of the total carbonate (Supplementary Figure S3). It is possible to calculate δ13C values of CO2 in the samples under the chemical and isotopic equilibrium of groundwater (Barbieri et al., 2020). When we take into account the mass balance equation of TDIC, Mg2+, Ca2+, SO42− using data set of Table 1 and assuming the δ13C value of −7‰ in local carbonate rock (Nitta and Inoue, 2011), δ13C values of hypothetical CO2 gas in the Uenae sample would become approximately −50‰, much lighter than those of present groundwater TDIC. This may be attributable to the discrepancy between the referred local carbonate and the true δ13C value of calcite in aquifer system.
At the Uenae site, both δ2H and δ18O groundwater values were constant at −60.1 ± 0.5‰ and −8.52 ± 0.15‰, respectively, from June 2015 to February 2018 (Figures 2C,D). These values then fluctuated and decreased significantly down to −62.2‰ and −9.3‰, respectively, from April 2018 to December 2018. These variations are similar to those of the carbon isotopes, and may be attributable to groundwater mixing with light δ2H and δ18O of summer precipitation in the region (Kawaraya et al., 2016; Supplementary Figure S4). At Eniwa, δ2H values decreased slightly from −62.8‰ to −64.3‰ and consistently from June 2016 to February 2020, while δ18O values remained constant with the value of −9.43‰ except for the most recent sample of −9.98‰. These oxygen isotope values may be explained by the mixing of local surface meteric water and a deep high temperature water (Nitta and Inoue, 2011).
Potential Triggering Mechanism of the Hokkaido Earthquake
Previous studies have indicated a high probability that earthquakes are triggered by the injection of large volumes of CO2 into the brittle crust (Zoback and Gorelick, 2012; Nicol et al., 2011). In this case study, the possible link between groundwater geochemical anomalies, the Hokkaido earthquake, and the CCS-CO2 injection was examined. Figure 3 shows a schematic vertical cross-section of the studied region before the CCS CO2 injection of April 2016 (Stage 1), including two features: Figure 3A (top) is P-wave velocity (Vp) structure of the crust and uppermost mantle in the region (Kobayashi et al., 2019). A part of this figure (red square) is enlarged in Figure 3B, which shows geological structure of the seismic section along H91-3 in Figure 1 (Yokokura et al., 2014). The CO2 injected in the Moebetsu and Takinoue Formations are shown by broken curves. ITTFZ and Uenae indicate the major active fault system and the monitoring well, respectively. There may be upward natural fluid flows by buoyancy through a fault system as well as permeable aquifer (black arrows in Figures 3A,B) where a deeper flow (Figure 3A) was suggested by a seismological study (Hua et al., 2019). The upper boundary of Takinoue Formation is consistent with the active fault in the left side of diagram, but it is discrepant in the right. The branch position is approximately 1 km left side beneath the Uenae site.
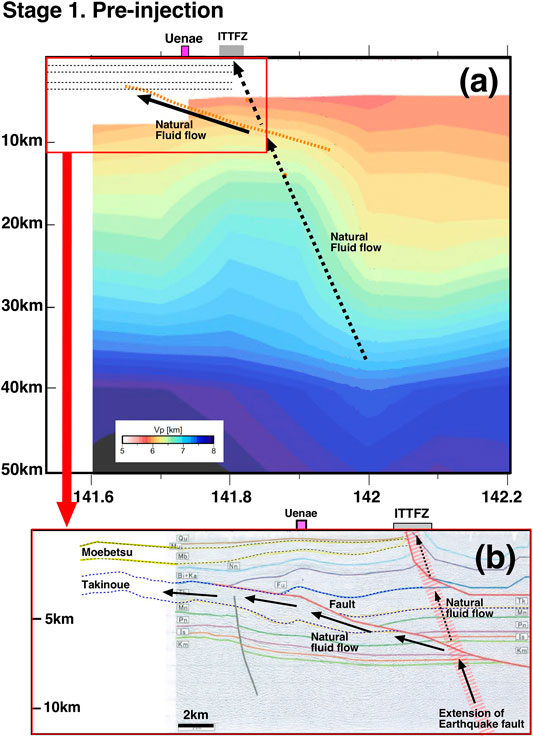
FIGURE 3. Schematic vertical cross-section of the Hokkaido Iburi region along the H91-3 seismic profile of Figure 1, and its extension southwest and northeast before CCS-CO2 injection (A) P-wave velocity (Vp) structure of the crust and uppermantle in the region. The orange dotted curve shows a fault determined by seismic reflection survey, which corresponds to the red solid line in bottom figure. The black solid and dotted arrows show possible natural fluid flows in the region supported by a seismological study. (B) Modified subsurface structure of the seismic section along H91-3 in Figure 1 reported by Yokokura et al. (2014). Red square of top figure is enlarged here. The red solid line is the active fault. Uenae and ITTFZ denote the position of Uenae site and ITTFZ.
Figure 4 shows the cross-section of two years after the injection of CO2 (Stage 2), which is also immediately before the M6.7 earthquake. This indicates a geochemical model explaining the possible role of CO2 in triggering the M6.7 earthquake, together with the distribution of earthquake occurred in the region and the hypothetical CO2 accumulation zone. A large amount of CO2, up to the 100 kilotons injected by the Tomakomai CCS project at the time, may have accumulated below the cap rock. Regional CO2 monitoring indicates no apparent CO2 leakage immediately above or in the vicinity of the cap rock (Sawada et al., 2018; Japan CCS, 2019). Long before the M6.7 earthquake, a seismic reflection survey was conducted along transect H91-3 by the National Institute of Advanced Industrial Science and Technology, AIST (Yokokura et al., 2014), as illustrated in Figure 1. The seismic survey revealed a low-angle fault, starting from the CCS-CO2 injection area and dipping eastward (orange dotted line in Figures 3A,4A,5A). Generally speaking, a fault plane is a mechanically weak and possibly a more permeable surface than the surrounding region. There was upward natural fluid flow though the low-angle fault and Takinoue Formation (black arrows in Figure 3B). Injected CO2 of Takinoue layer could be dissolved in local saline groundwater and make a high-pressure gas-water mixture, which can not go downward but may have temporally interrupted the fluid flow and the internal pressure could be buildup in the region. The increased pressure may propagate into deeper part, that is reverse direction of natural fluid flow, subject to the trajectory of pink dotted arrows in Figures 4A,B. Then dilatation may occur in the fault system (Arrows in circles in Figure 4B). The presence of this increase of pore pressure is suggested by the increase of natural earthquakes that took place along the fault in 2017 and 2018, when compared to those in 2016 (see Supplementary Figure S5).
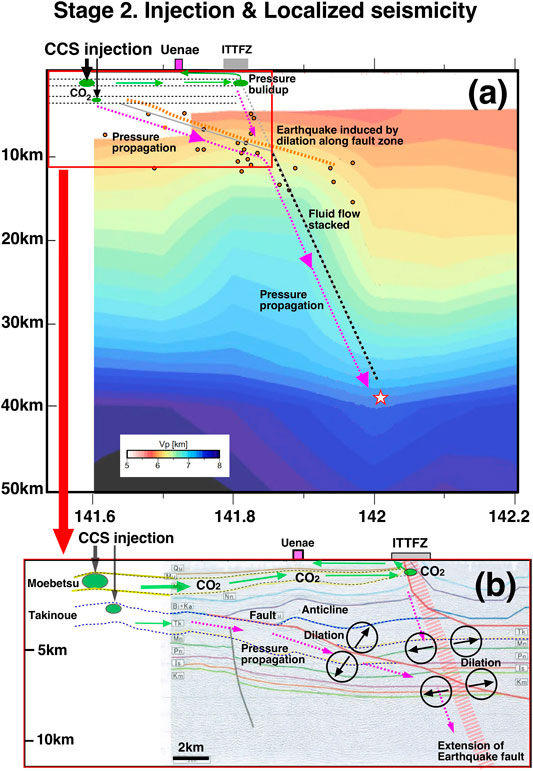
FIGURE 4. Schematic vertical cross-section of the Hokkaido Iburi region along the H91-3 seismic profile of Figure 1, and its extension southwest and northeast in two years after CCS-CO2 injection and immediately before the M6.7 earthquake (A) P-wave velocity (Vp) structure of the crust and upper mantle in the region. The red dotted arrows and gray thin line show possible pressure propagation and a pre-existing fault in the region, respectively. The orange dotted curve denotes a fault found by seismic reflection survey. Orange dots are possibly induced earthquakes by dilation along fault zone. (B) Modified subsurface structure of the seismic section along H91-3 in Figure 1 reported by Yokokura et al. (2014). Red square of top figure is enlarged here. The green solid arrows and red dotted arrows show movement of CO2 fluid and direction of pressure propagation, respectively. Arrows in circles indicate the dilation due to pore pressure.
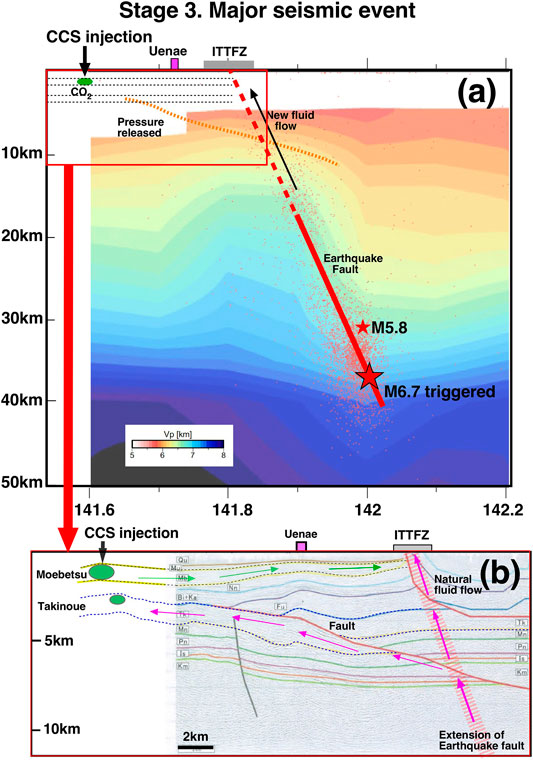
FIGURE 5. Schematic vertical cross-section of the Hokkaido Iburi region along the H91-3 seismic profile of Figure 1, and its extension southwest and northeast soon after the M6.7 earthquake (A) P-wave velocity (Vp) structure of the crust and uppermantle in the region. The red solid line and dotted line show earthquake fault and hypothetical new fluid flow, respectively. The orange dotted curve denotes a fault found by seismic reflection survey. Distributions of small red dots are aftershocks. A large red star indicates the position of main shock (M6.7). (B) Modified subsurface structure of the seismic section along H91-3 in Figure 1 reported by Yokokura et al. (2014). Red square of top figure is enlarged here. The red solid arrows and green arrows are direction of CO2 fluid movement and possible pressure propagation.
The major part of the CO2 injected in the Moebetsu Formation may be mixed with saline water which subsequently moved along the permeable layer towards the east as indicated by green arrow in Figures 4A,B. Most of the CO2-fluid (gas-water mixture) may arrive at the area beneath the Uenae site, where there is no permeable connection between the Moebetsu Formation and shallow volcanic-sedimentary aquifer. Our sampling well taps the latter aquifer. Some part of CO2-fluid may travel further eastward and will arrive at the region beneath the ITTFZ. When the high-pressure fluid encountered another high angle fault, which is possibly part of the ITTFZ, the CO2-fluid may have accumulated in the region (Figures 4A,B), building up the pore pressure. There may be a pre-existing fault closer to the seismogenic fault of the M6.7 earthquake, at the western edge of the low-Vp zone (Figure 4A). In addition, low Vp/Vs was identified east of the slip area, suggesting the presence of water or fluid (Kobayashi et al., 2019). Before the M6.7 earthquake, there may have been natural upward fluid flow in the region parallel to the seismogenic fault (Hua et al., 2019). When the anthropogenic CO2-fluid accumulated above this area, natural fracture flow may have been blocked, increasing pore pressure in the region. This increase as well as hydrological perturbations in the Takinoue Formation may have propagated to a much deeper region, and high pressure finally arrived at the focal zone of the M6.7 earthquake, again this is the reverse direction of natural fluid flow (dotted line in Figure 3A). It may have induced dilation of fault system and then have triggered the natural slip of pre-existing faults in a region where the brittle crust was already critically stressed.
Part of CO2-fluid may have ascended through the ITTFZ fault zone by buoyancy and introduced into the Shiatsu aquifer at a 90–100 m depth, where the Uenae monitoring well draws groundwater (green arrows in Figures 4A,B). The increase in TDIC concentration and the concomitant decrease in δ13C values and 14C activity in the Uenae mineral water would be caused by the injected low-δ13C and 14C-free CO2. Concordant with the TDIC concentration and carbon isotopic variation, both δ2H and δ18O values also decrease over time (Figure 2). Their relationship has a slope of 2.2 in the δ18O-δ2H diagram (Supplementary Figure S4), departing from the Global Meteoritic Water Line, which has a slope of 8. This suggests that the water carrying the injected CO2 may have a low δ18O value, and is then mixed with Uenae groundwater, which recharges possibly in the region (Supplementary Figure S4).
Figure 5 shows the cross-section after the M6.7 earthquake. The aftershock distribution of the M6.7 event coincides closely with the seismogenic fault. It is worth noting that the extension of the seismogenic fault estimated from the source fault model (Asano and Iwata, 2019) of the M6.7 earthquake (solid red line in Figure 5A) connects the epicenter with the ITTFZ at the surface (wide dotted red line; Figure 5B). Aftershocks of the M6.7 event terminated at a depth of ∼10 km, where the pore pressure was high and the region may be ductile due to the interruption of natural fluid flow by CO2 injection. After the earthquake, new fluid flow may occur beneath the ITTFZ (Figures 5A,B), which will be discussed in the latter section.
Velocity of Anthropogenic Fluid Flow
In the proposed geochemical model, the velocity of the CO2-fluid flow should correspond with the sequence of events (i.e., the injection of CO2, the groundwater anomaly, and the M6.7 earthquake) for it to be considered realistic (Figures 3–5). In the case of the Uenae well, the carbon anomaly began in April 2018, while CO2-injection began in April 2016. The total distance from the CCS injection point to Uenae is estimated to be ca. 30 km along the trajectory of movement simulated in the model (green arrows in Figure 4A). The average fluid velocity is then calculated to be approximately 40 m/day. This value is higher than the typical confined groundwater velocity of 1 m/day (Shibasaki, 1981), but is consistent with the maximum velocity calculated for Japanese sedimentary basins of 40 m/day (Shibasaki, 1981) and the value > 50 m/day of volcanic CO2-fluid flow observed at the 1986 eruption of Izu-Oshima volcano in Japan (Sano et al., 1988; Sano et al., 1995). If we assume a velocity of 40 m/day, the first phase of injected CO2 may have arrived at the build up and accumulation zone (Figure 4A) in September 2017, which is one year before the M6.7 earthquake. This may have been a sufficient amount of time for pore pressure to build up in the deep focal region. Considering a high-pressure injected CO2 and enhanced permeability along the fault plane, one may assume a faster velocity than 40 m/day, similar to the case of above Izu-Oshima volcano. During the great 2011 Tohoku-Oki earthquake (Mw 9.0), a velocity of 4 km/day was estimated for the upward migration of mantle fluids along the fault plane at the subducting plate interface (Sano et al., 2014). This value is two orders of magnitude greater than 40 m/day. If this higher fluid flow rate is applied to our model, the injected CO2-fluid phase could have reached the accumulation point within 5 days of injection. On the other hand, a groundwater flow rate from ITTFZ to the Uenae well may be slower than 40 m/day. Therefore, either groundwater anomalies might have not yet have appeared in the more distant Eniwa well after the M6.7 earthquake, because the distance between the two wells is ca. 20 km (Figure 1), or significant increase of total carbonate in February 2020 (Figure 2B) may be due to the CCS-CO2 injection.
Natural Fluid Flow Paralleling the Seismogenic Fault
For the model to be valid, it must be assumed a fluid flow through a pre-existing fault plane (Figures 3A,B), before the M6.7 Eastern Iburi earthquake. The fluid in the source zone may have originated from the dehydration of the subducting Pacific slab beneath southern Hokkaido, a phenomenon clearly identified by low-seismic velocity anomalies, high attenuation, and high Poisson’s ratio (Hua et al., 2019). Tomography suggests that the fluid from the slab dehydration ascended through the forearc mantle wedge and then entered the seismogenic fault in the crust, triggering the 2018 Eastern Iburi earthquake. The same mechanism also caused the 1995 M7.2 Kobe earthquake (Zhao et al., 1996), as well as the 2000 M7.3 western Tottori earthquake and the 2016 M6.6 central Tottori earthquake in southwestern Japan, where the Philippine Sea plate is subducting (Zhao et al., 2018). If this is the case, the deep fluid would have a mantle helium signature with a high 3He/4He ratio (Sano and Fischer, 2013). We collected hot and mineral spring water samples from four sites around the ITTFZ after the M6.7 Eastern Iburi earthquake (Figure 1) and measured the 3He/4He and 4He/20Ne ratios at different sampling times (Table 3; Figure 6). At three sites close to the ITTFZ (Matsubara, Tsurunoyu, and Mukawa), the air-corrected 3He/4He ratios increased significantly after the M6.7 earthquake. In September 2018, the 3He/4He ratio is 0.36 ± 0.03 Ra at Matsubara and 0.06 ± 0.02 Ra at Tsurunoyu. Immediately after the M6.7 earthquake, in November 2019, the ratio increased to 0.68 ± 0.08 Ra at Matsubara and 0.15 ± 0.05 Ra at Tsurunoyu; it was 0.01 ± 0.08 Ra at Mukawa in December 2018, but increased to 0.09 ± 0.01 Ra in November 2019. In contrast, the ratio is almost constant, at 0.66 ± 0.04 Ra, at the Laforet site located far from the ITTFZ (Figure 1). These results suggest that a mantle helium component was slightly enriched in the ITTFZ subsurface region fluids after the M6.7 earthquake. Before CCS-CO2 injection, there may have been steady state fluid flow including a small mantle helium component (Figures 3A,B). Immediately before and during the M6.7 event, the natural fluid flow may have been interrupted by high pore pressure caused by CO2 accumulation (Figures 4A,B). Consequently, the surface manifestation of mantle helium may have ceased or have been weakened. After the M6.7 earthquake, new channels may have been created from the deep crust to the ITTFZ subsurface region. The 3He/4He ratios of natural springs then increased significantly because of the connection to the mantle source (Figure 6). Therefore, the overall variation of the measured helium isotopes in groundwater supports the proposed geochemical model of the M6.7 Eastern Iburi earthquake triggering.
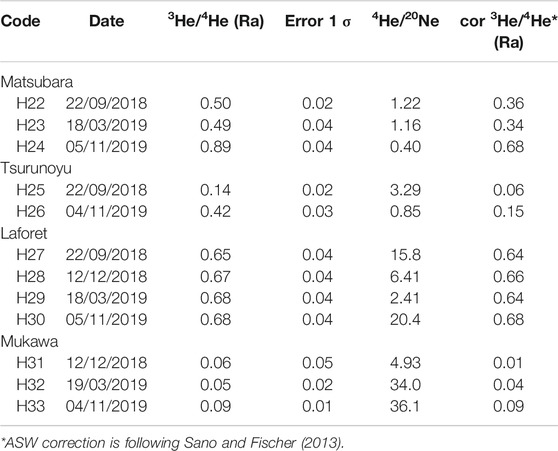
TABLE 3. Helium isotopes and helium/neon ratios of natural springs after the M6.7 earthquake in Hokkaido, Japan.
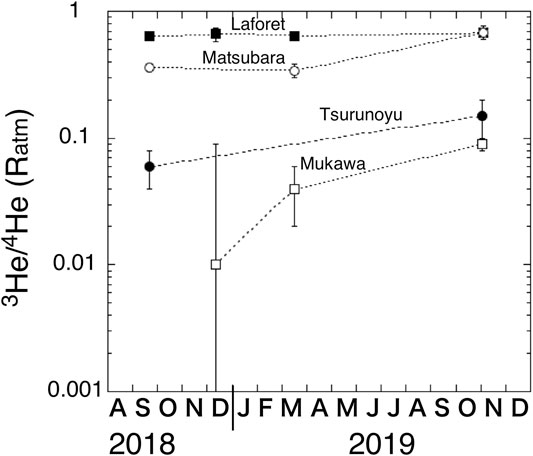
FIGURE 6. Temporal variations of air-corrected 3He/4He ratios and normalized to the air ratio (Ratm = 1.382 × 10⁻⁶), measured in natural springs after the M6.7 earthquake at Mukawa, Tsurunoyu, Matsubara, and Laforet in Hokkaido, Japan. Error bars are 2σ.
Relationship Between δ13C and 14C Activity of Groundwater Carbonate
There is a simple correlation between observed δ13C values and 14C activity of total carbonate in groundwater samples from the Uenae well (Supplementary Figure S6) with a correlation coefficient, r2 = 0.85. There may be three independent carbon components in subduction-type region (Sano and Marty, 1995): 1) surface carbon (a mixture of organic and marine carbonate carbon) with intermediate δ13C (−10‰ in surface meteoric water by Nitta and Inoue, 2011) and high 14C; 2) anthropogenic (CCS injection) carbon with low δ13C (−25‰) and low 14C; and 3) deep-seated carbon (possibly derived from the mantle) with high δ13C (−6‰) and low 14C. The correlation between δ13C and 14C may be explained by the binary mixing of the surface and anthropogenic CCS carbon from September 2016 to May 2019. Even though there is an increase of mantle helium component in hot and mineral springs close to the ITTFZ region (Figure 6), a substantial amount of deep-seated carbon was not introduced into the Uenae aquifer after the M6.7 earthquake, which should have made the δ13C value higher. This mechanism should be studied more precisely in future work.
Conclusion
In conclusion, secular variations of carbonate contents, carbon isotopes (δ13C), and 14C activity in groundwater at the Uenae well, southern Hokkaido, Japan may have some relation to the CO2 injection from the Tomakomai CCS demonstration project in the area. Considering the position of the pre-existing fault, the natural earthquakes that occurred between 2016 and 2017, and the crustal structure of the region, the injected CO2 fluid may have interrupted a natural fluid flow in the deep Takinoue Formation and may have increased pore pressure in the area. The injected CO2 fluid in the shallow Moebetsu Formation, may have flowed into the region just beneath ITTFZ region. The accumulation of CO2-fluid could have potentially interrupted the natural upward fluid flow, thereby increasing the pore pressure in the focal area, and possibly triggering the 2018 Hokkaido Eastern Iburi earthquake. A part of CO2-fluid may be incorporated in the aquifer of the Uenae site and may have induced chemical and isotopic variations of the groundwater. Future projects should consider regional sampling of noble gas and stable isotopes to confirm the potential influence of carbon sequestration on seismicity.
Data Availability Statement
The original contributions presented in the study are included in the article/Supplementary Material, further inquiries can be directed to the corresponding author.
Author Contributions
YS designed the study. YS, TK, TS, and A-TC conducted field trips and sample collection. KS measured carbon isotopes and carbonate contents in groundwater. NT analyzed groundwater oxygen and hydrogen isotopes. NT, TK, and A-TC measured helium isotopes and helium/neon ratios of hot spring samples. SX analyzed C-14 of carbonate in groundwater. JY and YN provided geological interpretations of the area. J-OP and DZ provided the seismological model and implication. YS, GS and DP wrote the manuscript. All authors contributed to the final manuscript preparation.
Funding
This work was partly supported by a research grant from the Japan Society for the Promotion of Science (17H00777).
Conflict of Interest
The authors declare that the research was conducted in the absence of any commercial or financial relationships that could be construed as a potential conflict of interest.
Acknowledgments
We gratefully acknowledge the regional mineral water companies for groundwater sampling. We thank KT for reviewing the paper and TM for help with analyzing hydrogen and oxygen isotopes of water samples. J-FH is thanked for hydrogen and oxygen isotopic analyses at Geotop in Montreal, Canada. We thank reviewers for constructive comments.
Supplementary Material
The Supplementary Material for this article can be found online at: https://www.frontiersin.org/articles/10.3389/feart.2020.611010/full#supplementary-material
References
Asano, K., and Iwata, T. (2019). Source rupture process of the 2018 Hokkaido Eastern Iburi earthquake deduced from strong-motion data considering seismic wave propagation in three-dimensional velocity structure. Earth Planets Space 71, 101. doi:10.1186/s40623-019-1080-0
Barbieri, M., Boschetti, T., Barberio, M. D., Billi, A., Franchini, S., Iacumin, P., et al. (2020). Tracing deep fluid source contribution to groundwater in an active seismic area (central Italy): a combined geothermometric and isotopic (δ13C) perspective. J. Hydrol. 582, 124495. doi:10.1016/j.jhydrol.2019.124495
Dong, K., Lang, Y., and Xu, S. (2019). Progress in XCAMS at Tianjin University. Rad. Detect. Tech. Meth. 3, 62. doi:10.1007/s41605-019-0141-z
Grigoli, F., Cesca, S., Rinaldi, A. P., Manconi, A., Lopez-Comino, J. A., Clinton, J. F., et al. (2018). The November 2017Mw5.5 Poyang earthquake: a possible case of induced seismicity in South Korea. Science 360, 1003–1006. doi:10.1126/science.aat2010
Gupta, H. K., and Iyer, H. M. (1984). Are reservoir-induced earthquakes of magnitude ≧5.0 at Koyna, India, proceeded by pairs of earthquakes of magnitude ≧4.0?. Bull. Seismol. Soc. Am. 74, 863–873.
Hua, Y., Zhao, D., Xu, Y., and Wang, Z. (2019). Arc-arc collision caused the 2018 Eastern Iburi earthquake (M 6.7) in Hokkaido, Japan. Sci. Rep. 9, 13914. doi:10.1038/s41598-019-50305-x
IPCC Special Report, (2005). “Carbon dioxide capture and storage,” in Prepared by working group III of the intergovernmental panel on climate change (Cambridge, England: Cambridge University Press), 442.
Japan CCS, (2019). Report of influence of the 2018 Hokkaido Eastern Iburi earthquake on CO2 reservoir by CCS project. Available at: https://www.japanccs.com/wp/wp-content/uploads/2019/09/report_re2.pdf. second version.
Japan CCS, (2020). Tomakomai CCS demonstration project. Project overview and schedule. Available at: https://www.japanccs.com/en/business/demonstration/overview.php.
Johnson, J. W., Nitao, J. J., and Morris, J. P. (2005). in Carbon dioxide capture for storage in deep geologic Formations. Editor S. M. Benson (Amsterdam, Netherlands: Elsevier Science), 787–813.
Kawaraya, H., Abiko, T., and Matsubaya, O. (2016). Hydrogen and oxygen isotopic ratios of precipitation at Noboribetsu, Hokkaido. (Akita, Japan: Graduate School of Science and Technology Reports, Akita University Reports) 37, 31–36.
KIKO Network (2019). Risky dreams: carbon capture, utilization and storage (CCUS). Available at: https://www.kikonet.org/eng/publication-en/2019-08-15/paper-on-ccus.Position paper
Kobayashi, K., Hayashi, K., and Yarai, H. (2019). Geodetically estimated location and geometry of the fault plane involved in the 2018 Hokkaido Eastern Iburi earthquake. Earth Planets Space 71, 62. doi:10.1186/s40623-019-1042-6
Marumo, K., Longstaffe, F. J., and Matsubaya, O. (1995). Stable isotope geochemistry of clay minerals from fossil and active hydrothermal systems, southwestern Hokkaido, Japan. Geochem. Cosmochim. Acta 59, 2545–2559. doi:10.1016/0016-7037(95)00149-2
Nakagawa, M., Miyasaka, M., Miura, D., and Uesa, S. (2018). Tephrostratigraphy in Ishikari Lowland, southwestern Hokkaido. J. Geol. Soc. Japan 124, 473–489. doi:10.5575/geosoc.2018.0038
Nicol, A., Carne, R., Gerstenberger, M., and Christophersen, A. (2011). Induced seismicity and its implications for CO2 storage risk. Energy Procedia 4, 3699–3706. doi:10.1016/j.egypro.2011.02.302
Nitta, M., and Inoue, A. (2011). Carbon and oxygen isotope compositions of calcite and rhodochrosite from geothermal exploratory drills TH-4 and TH-6 near the Toyoha deposit, Hokkaido, Japan. Resour. Geol. 61, 159–173. doi:10.1111/j.1751-3928.2011.00156.x
Ohzono, M., Takahashi, H., and Ito, C. (2019). Spatiotemporal crustal strain distribution around the Ishikari-Teichi-Toen fault zone estimated from global navigation satellite system data. Earth Planets Space 71, 50. doi:10.1186/s40623-019-1024-8
Onda, S., Sano, Y., Takahata, N., Kagoshima, T., Miyajima, T., Shibata, T., et al. (2018). Groundwater oxygen isotope anomaly before the M6.6 Tottori earthquake in Southwest Japan. Sci. Rep. 8, 4800. doi:10.1038/s41598-018-23303-8
Sano, Y., and Fischer, T. P. (2013). “The analysis and interpretation of noble gases in modern hydrothermal systems,” in The noble gases as geochemical tracers. Editor P. Burnard (Berlin, Heidelberg, Germany: Springer), 249–317.
Sano, Y., Gamo, T., Notsu, K., and Wakita, H. (1995). Secular variations of carbon and helium isotopes at Izu-Oshima Volcano, Japan. J. Volcanol. Geoth. Res. 64, 83–94. doi:10.1016/0377-0273(94)00041-e
Sano, Y., Hara, T., Takahata, N., Kawagucci, S., Honda, M., Nishio, Y., et al. (2014). Helium anomalies suggest a fluid pathway from mantle to trench during the 2011 Tohoku-Oki earthquake. Nat. Commun. 5, 3084. doi:10.1038/ncomms4084
Sano, Y., and Marty, B. (1995). Origin of carbon in fumarolic gas from island arcs. Chem. Geol. 119, 265–274. doi:10.1016/0009-2541(94)00097-r
Sano, Y., Nakamura, Y., Notsu, K., and Wakita, H. (1988). Influence of volcanic eruptions on helium isotope ratios in hydrothermal systems induced by volcanic eruptions. Geochem. Cosmochim. Acta 52, 1305–1308. doi:10.1016/0016-7037(88)90284-0
Sano, Y., Tokutake, T., and Takahata, N. (2008). Accurate measurement of atmospheric helium isotopes. Anal. Sci. 24, 521–525. doi:10.2116/analsci.24.521
Sawada, Y., Tanaka, J., Suzuki, C., Tanase, D., and Tanaka, Y. (2018). Tomakomai CCS demonstration project of Japan, CO2 injection in progress. Energy Procedia 154, 3–8. doi:10.1016/j.egypro.2018.11.002
Shibasaki, T. (1981). Fluid dynamics in a deep sedimentary basin. (Tokyo, Japan: Tokai University Press), 356.
Tanaka, Y., Abe, M., Sawada, Y., Tanase, D., Ito, T., and Kasukawa, T. (2014). Tomakomai CCS demonstration project in Japan, 2014 Update. Energy Procedia 63, 6111–6119. doi:10.1016/j.egypro.2014.11.643
Tanaka, Y., Sawada, Y., Tanase, D., Tanaka, J., Shiomi, S., and Kasukawa, T. (2017). Tomakomai CCS demonstration project of Japan, CO2 injection in process. Energy Procedia 114, 5836–5846. doi:10.1016/j.egypro.2017.03.1721
Tsunogai, U., and Wakita, H. (1995). Precursory chemical changes in ground water: Kobe earthquake, Japan. Science 269, 61–63. doi:10.1126/science.269.5220.61
Yamanouchi, Y., Higashinaka, M., Yoshii, T., and Todaka, N. (2011). Study of geological storage for a candidate CCS demonstration Project in Tomakomai, Hokkaido, Japan. Energy Procedia 4, 5677–5684. doi:10.1016/j.egypro.2011.02.561
Yokokura, T., Okada, S., and Yamaguchi, K. (2014). “Subsurface geological structure revealed by seismic reflection surveys around the southern part of the Eastern Boundary Fault Zone of the Ishikari Lowland, Hokkaido, Japan,” in Sea-land seamless geological map, Ishikari-Teichi South Coast. (Warrendale, PA: AIST).
Zhao, D., Kanamori, H., Negishi, H., and Wiens, D. (1996). Tomography of the source area of the 1995 Kobe earthquake: evidence for fluids at the hypocenter?. Science 274, 1891–1894. doi:10.1126/science.274.5294.1891
Zhao, D., Liu, X., and Hua, Y. (2018). Tottori earthquakes and Daisen volcano: effects of fluids, slab melting and hot mantle upwelling. Earth Planet Sci. Lett. 485, 121–129. doi:10.1016/j.epsl.2017.12.040
Zhao, L., Zuykov, M., Tanaka, K., Shirai, K., Anderson, J., McKindsey, C. W., et al. (2019). New insight into light-enhanced calcification in mytilid mussels, Mytilus sp., infected with photosynthetic algae Coccomyxa sp.: δ13C value and metabolic carbon record in shells. J. Exp. Mar. Biol. Ecol. 520, 151211. doi:10.1016/j.jembe.2019.151211
Keywords: Hokkaido earthquake, carbon capture and storage-CO2 injection, groundwater, carbon isotopes, radiocarbon
Citation: Sano Y, Kagoshima T, Takahata N, Shirai K, Park J-O, Snyder GT, Shibata T, Yamamoto J, Nishio Y, Chen A-T, Xu S, Zhao D and Pinti DL (2020) Groundwater Anomaly Related to CCS-CO2 Injection and the 2018 Hokkaido Eastern Iburi Earthquake in Japan. Front. Earth Sci. 8:611010. doi: 10.3389/feart.2020.611010
Received: 28 September 2020; Accepted: 09 November 2020;
Published: 10 December 2020.
Edited by:
Giovanni Martinelli, National Institute of Geophysics and Volcanology, ItalyReviewed by:
Tiziano Boschetti, University of Parma, ItalyWalter D’Alessandro, National Institute of Geophysics and Volcanology, Italy
Copyright © 2020 Sano, Kagoshima, Takahata, Shirai, Park, Snyder, Shibata, Yamamoto, Nishio, Chen, Xu, Zhao and Pinti. This is an open-access article distributed under the terms of the Creative Commons Attribution License (CC BY). The use, distribution or reproduction in other forums is permitted, provided the original author(s) and the copyright owner(s) are credited and that the original publication in this journal is cited, in accordance with accepted academic practice. No use, distribution or reproduction is permitted which does not comply with these terms.
*Correspondence: Yuji Sano, eXVqaXNhbm8xMjhAZy5lY2MudS10b2t5by5hYy5qcA==
 Yuji Sano
 Takanori Kagoshima
 Naoto Takahata1
 Yoshiro Nishio
 Daniele L. Pinti