 Yao Chen1,2
 Si Gao
 Xun Li
94% of researchers rate our articles as excellent or good
Learn more about the work of our research integrity team to safeguard the quality of each article we publish.
Find out more
ORIGINAL RESEARCH article
Front. Earth Sci., 29 January 2021
Sec. Atmospheric Science
Volume 8 - 2020 | https://doi.org/10.3389/feart.2020.609727
This article is part of the Research TopicCompound Climate Extremes in the Present and Future Climates: Machine Learning, Statistical Methods and Dynamical ModellingView all 16 articles
Forecasting rapid intensification (RI) of the South China Sea (SCS) tropical cyclones (TCs) remains an operational challenge, mainly owing to the incomplete understanding of its physical mechanisms. Based on TC best-track data, atmospheric analysis data, and sea surface temperature data, this study compares temporal evolution characteristics of environmental conditions from the previous 24 h to the onset time for RI and non-RI TCs in the SCS during 2000–2018, and then identifies key factors for RI of the SCS TCs using the box difference index and stepwise regression. A combination of strong divergence in the upper troposphere and strong convergence in the boundary layer, weak deep-layer vertical wind shear, fast storm translation speed, and high TC intensification potential (i.e., maximum potential intensity minus current intensity) north of the storm center at the previous 24 h are favorable for RI of the SCS TCs, and their importance for RI is in descending order. The results may shed light on operational forecasting of rapid intensification of the SCS TCs.
The South China Sea (SCS) is the largest semi-closed sea in the tropical western Pacific. Its basin is small and is surrounded by densely populated Asian countries. The SCS tropical cyclones (TCs) include the TCs generated in the SCS and the TCs moving into SCS from the sea to the east of the Philippines. They are usually featured by short duration and variable path and intensity. The SCS TCs often make landfall in the coastal areas of South China and Vietnam and then bring severe rainfalls, gales and storm surges, often leading to serious losses of life and property near the landing sites. For example, super typhoon Rammasun (1409) made landfall in Wenchang, Hainan Province, causing direct economic losses of nearly 27 billion yuan in the three provinces of South China. Rammasun experienced rapid intensification (RI) twice when it was near shore, which caused large errors in the TC intensity forecast, seriously affecting the strategy making on preventing typhoons and reducing disasters. Therefore, the in-depth research on the influencing factors of TC RI in the SCS has great practical significance for improving the operational forecast of TC intensity and reducing the typhoon disaster losses.
The evolution of TC intensity involves complex physical processes, and the factors affecting TC intensity change are mainly from three aspects. The first is the influence of the underlying surface, such as the ocean. The ocean heat is the dominant factor affecting the formation and development of TCs, which can be expressed by two related factors: ocean heat content and sea surface temperature (SST). The SST, which can affect the latent heat, sensible heat and water vapor fluxes transported from the ocean into TCs (e.g., Emanuel, 1986; Holland, 1997; Gao and Chiu, 2010; Gao et al., 2016), is a key factor determining the maximum potential intensity (MPI; Emanuel, 1988) of TCs. Large ocean heat content can provide the energy for TC development and offset the cooling effect of ocean upwelling (e.g., Shay et al., 2000). The second aspect is the internal dynamics of TCs. For example, the asymmetry of the TC inner core can limit the development of TCs (Yang et al., 2007). When the TC eyewall starts to replace, the intensity would usually increase; later, when the inner-core structure becomes a concentric ring, the intensity would decrease; when the wind speed of the outer eyewall exceeds that of the inner eyewall, the TC would intensify again and could often reach its maximum intensity in its lift cycle (Sitkowski et al., 2011), and meanwhile the radius of maximum wind significantly decreases (Yang et al., 2017). The third aspect is the effect of the large-scale environment field, such as the upper-level trough. When the warm outflow of TC is close to the cold trough, the increase of the temperature gradient leads to the strengthening of the upper-level jet. If the TC center is exactly located at the right of the jet entrance, the secondary circulation related to this jet is conducive to the development of the ascending motion and TC (Hanley et al., 2001). The environmental vertical wind shear (VWS) could also affect the TC intensity. The weak VWS is often considered to be conducive to TC RI (e.g., Merrill, 1988; Zeng et al., 2007; Bai and Wang, 2016), but the mechanisms are different, mainly including the theory of ventilation flow (Gray, 1968), the secondary circulation effect (Tuleya and Kurihara, 1981), the tilt and stability effect (Demaria, 1996), and the Rossby penetration theory (Jone, 1995), and so on.
Previous studies on the RI of the SCS TCs show that RI occurs further south, and is associated with weaker VWS, weaker easterly wind at 200 hPa, and smaller radius of 15.4 m s−1 winds compared to non-RI TCs (Li et al., 2011). The VWS and low-level water vapor convergence are the main factors affecting TC RI in the SCS (Hu and Duan, 2016). TC RI in the SCS mostly occurs after the monsoon season when the middle-latitude trough invades the SCS and the southwesterly wind in the southern SCS is still strong (Chen et al., 2015). The anomalous warmer SST, the stronger low-level jet, the stronger cross-equatorial air flow, the weaker environmental VWS and the stronger upper-level outflow play important roles in RI of the super typhoon Ramason (Cheng et al., 2017). The specific location and timing of the nearshore RI of TCs in the SCS are related to the adjustment of the East Asian summer monsoon when the Meiyu period in the Yangtze River Basin ends. The adjustment of the East Asian summer monsoon can not only strengthen the interactions between TCs and the upper-level trough, but also make the water vapor flux accompanied by the monsoon surge enter the TC circulation, preventing the dry air accompanied by the western Pacific subtropical high (WPSH) from intruding into the TC circulation. Thus, it is conducive to the occurrence of the nearshore RI of the SCS TCs (Qiu et al., 2020).
The above researches on RI of the SCS TCs only list some favorable environmental factors, and fail to comprehensively compare the importance of those factors and to analyze the evolution of the factors before the onset of RI. In this paper, we investigate the temporal evolution characteristics of potential environmental factors during a 24 h period before the onset of TC RI in the SCS, so as to find the indicative precursors and the key influence areas of significant factors by composite analyses. Furthermore, based on the box difference index (BDI; Fu et al., 2012) of each factor calculated in the key influence area, the key environmental factors for RI of the SCS TCs will be identified. This research is expected to provide some references for the operational intensity prediction of the SCS TCs.
The TC information at a 6 h interval (latitude and longitude of the TC center and the maximum sustained wind speed) is obtained from the TC best-track dataset (Ying et al., 2014) released by the Shanghai Typhoon Institute of the China Meteorological Administration (CMA). The atmospheric environment fields are obtained from the FNL data released by the United States National Centers for Environmental Prediction (NCEP), with an interval of 6 h and a spatial resolution of 1°. The daily SST data (OISST V2; Reynolds et al., 2007) is released by the United States National Oceanic and Atmospheric Administration (NOAA), with a spatial resolution of 0.25°. We use the above datasets during our study period 2000–2018.
To exclude the influence of land, the TCs located over the SCS (5–22°N, 105–120°E) are selected as the research objects. The tracks of the SCS TCs from 2000 to 2018 are shown in Figure 1. In previous studies, the 95th percentile of all the samples of 24-h changes in maximum sustained wind speed (∆V24 = V+24h − V0h) for TCs in an ocean basin was often used as the threshold to define RI (e.g., Kaplan and DeMaria, 2003). In this paper the 95th percentile of all ∆V24 samples of TCs in the SCS during the study period is 12 m s−1 (Supplementary Figure S1), so ∆V24 ≥ 12 m s−1 is defined as an RI event, and ∆V24 < 12 m s−1 is defined as a non-RI event.
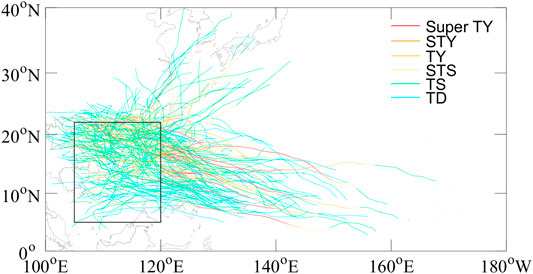
FIGURE 1. Tracks of the SCS TCs during 2000–2018. Black box denotes the SCS region defined in this study. Colors of the track represents different TC intensity (TD, tropical depression; TS, tropical storm; STS, severe tropical storm; TY, typhoon; STY, severe typhoon; Super TY, super typhoon).
The RI/non-RI onset time is recorded as 0, 12, and 24 h before the onset are recorded as −12 and −24 h, respectively. For the horizontal two-dimensional physical quantity field, an area of 20° × 20° outside the TC center is used as the analysis area. For the three-dimensional physical quantity field, a longitude/latitude-height cross section with a horizontal span of 20° is used, and composite analyses are performed for the RI and non-RI events of the SCS TCs at three times (i.e., −12, −24, and 0 h), and the Student’s t test is used to judge the significance of the difference in physical quantity between the two groups of samples at the same time. There are 34 RI samples and 463 non-RI samples at −24 h. For −12 and 0 h, the numbers of RI samples are both 37, and the numbers of non-RI samples are both 511.
The environmental divergence, relative vorticity, VWS and relative humidity are all obtained from the large-scale environmental field in which the TC vortexes have been filtered from the original field. This vortex-removing algorithm (Kurihara et al., 1993) can completely eliminate the disturbances with the wavelength less than 1,000 km. The 850-hPa wind field at 0000 UTC on August 9, 2000 is used as an example to verify the vortex-removing algorithm (Figure 2). At that time there were two TCs (Figure 2A) in the western North Pacific (WNP), and the algorithm can completely remove the two TC vortexes (Figure 2C). The large-scale monsoon gyre still exists (Figure 2B) after the vortex removal, indicating good performance of the algorithm.
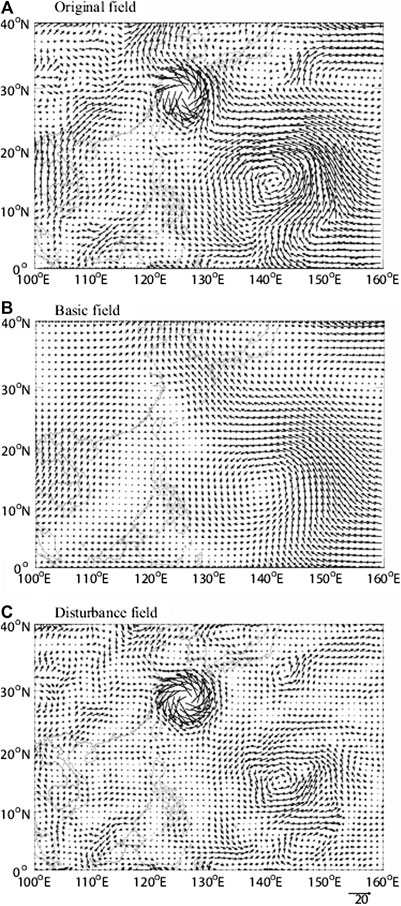
FIGURE 2. (A) Original total wind (m s−1) field, and the corresponding (B) environmental wind field and (C) disturbance wind field at 850 hPa at 0000 UTC August 9, 2000.
Following Wang et al. (2015), the environmental VWS is defined as the difference in environmental wind vector between each level and 850 hPa:
where u and v are the zonal and meridional wind speed after removing the vortexes, respectively, and the subscript represents the level.
The area with significant difference between RI and non-RI events for each factor is identified, and the areal average is calculated. Following Fu et al. (2012), the BDI is then calculated as
where MRI and σRI (MnonRI and σnonRI) represent the average and standard deviation of the physical quantity for the RI (non-RI) samples, respectively.
The temporal evolutions of the meridional cross sections of environmental relative vorticity are shown in Figure 3. At −24 h, there is a broad region of positive relative vorticity near the RI TC center at the middle and lower levels, and the negative relative vorticity is dominant at the upper levels. The relative vorticity to the north of the TC center is smaller than that to the south, and the vorticity distribution of non-RI TCs is similar. At −12 h, the middle- and lower-level relative vorticity of RI and non-RI TCs increases significantly, and the maximum positive vorticity at lower troposphere reaches 2 × 10⁻⁵ s−1. From −12 to 0 h, the relative vorticity variations of the two TC types are small. The temporal evolutions of the zonal cross sections of the relative vorticity are similar to those of the meridional cross sections, except that the zonal distribution is more symmetrical (figure not shown). The relative vorticity at the three times (−24, −12, and 0 h) near the RI TC center is larger than that near the non-RI TC center, and the difference is the most significant at the middle and lower levels (1,000–300 hPa) at −24 h, which has certain indicative meaning for RI. The larger relative vorticity at lower levels usually corresponds to a stronger Ekman pumping, that is, the stronger lower-level convergent inflow, which is conducive to the maintenance and development of the TC vorticity (Xu et al., 2017). The strong cumulus convection near the TC center transports the lower-level positive vorticity upward, thus there is also large cyclonic vorticity at middle levels.
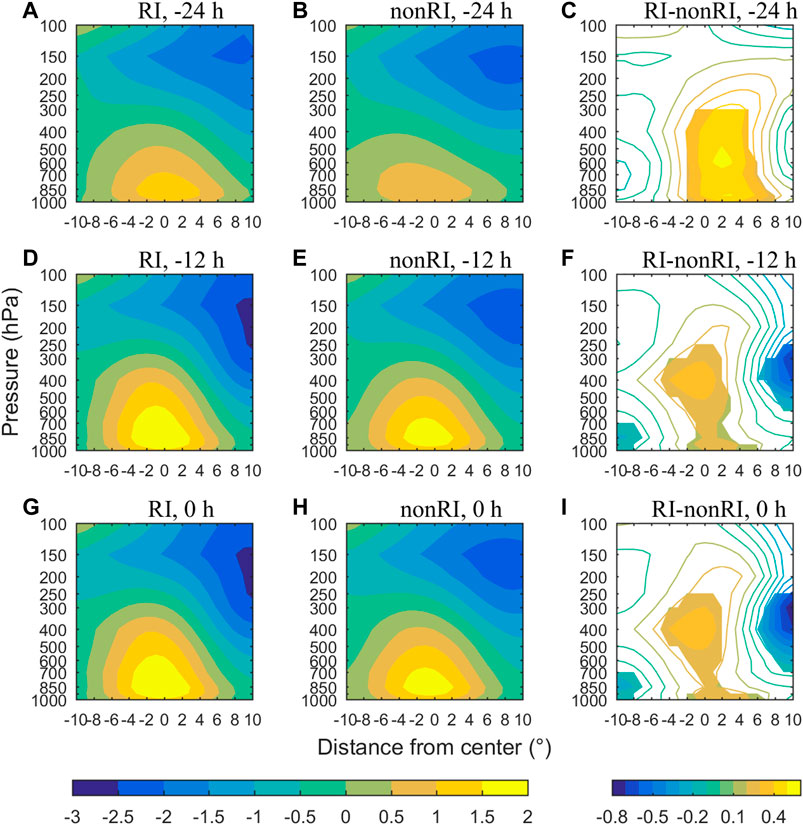
FIGURE 3. Meridional cross sections of environmental relative vorticity (10−5 s−1). (A,D,G) are the composites for RI TCs at −24, −12, and 0 h, respectively; (B,C,H) are the composites for non-RI TCs at −24, −12, and 0 h, respectively; (C,F,I) are the differences between RI and non-RI TCs at −24, −12, and 0 h, respectively, shadings denote significant differences above the 90% confidence level.
Figure 4 shows the temporal evolutions of the meridional cross sections of environmental divergence. At −24 h, there is strong divergence at 200–150 hPa near the RI TC center, and weak convergence in the boundary layer. Non-RI TCs have a similar configuration, but the upper-level divergence and boundary-layer convergence of RI TCs are both significantly stronger than those of non-RI TCs, which can be used as a precursory signal for RI. At −12 h, the upper-level divergence and boundary-layer convergence near the RI TC center significantly enhance, and the evolution for non-RI TCs is similar. At 0 h, the upper-level divergent area of RI TCs expands, with the maximum divergence exceeding 1.4 × 10⁻⁵ s−1, while the upper-level divergence of non-RI TCs weakens slightly. The temporal evolutions of the zonal cross sections of divergence are similar (figure not shown). The upper-level divergence and boundary-layer convergence of RI TCs at the three times (−24, −12, 0 h) are significantly stronger than those of non-RI TCs. The strong upper-level divergent environment provides a favorable “pumping” effect. Together with the convergence in the boundary layer, the “pumping” effect is reinforced, which is conducive to the occurrence of TC RI (Mei and Yu, 2016).
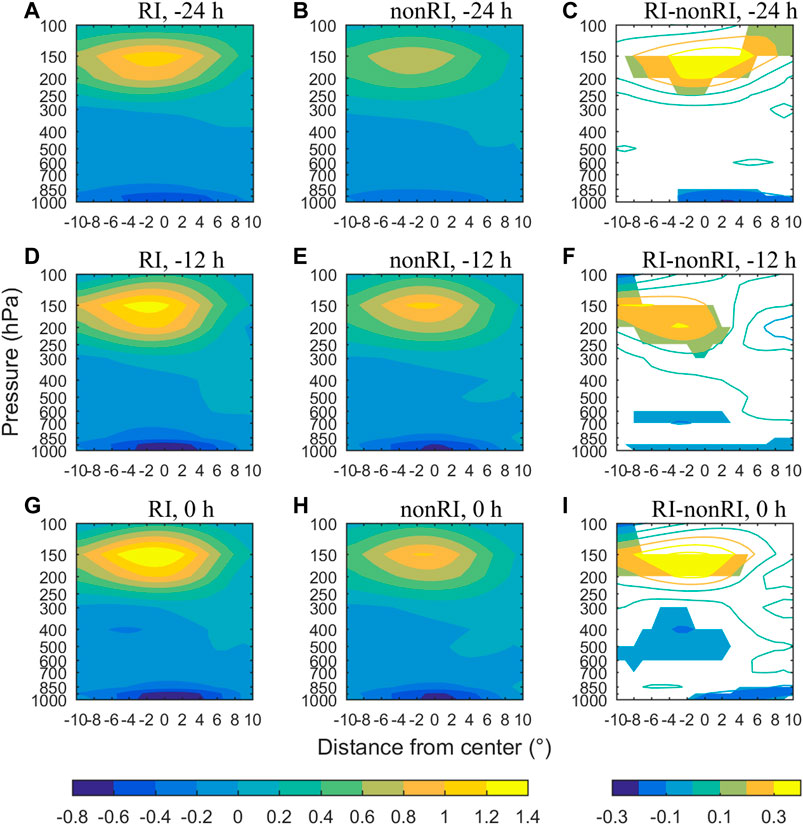
FIGURE 4. Same as Figure 3, but for environmental divergence (10−5 s−1).
The composite environmental wind fields at upper, middle and low levels are plotted to analyze the synoptic patterns for the two types of SCS TCs. Figure 5 shows the composite environmental wind fields at 850 hPa. The common feature of the low-level wind fields for RI and non-RI TCs is that, the easterly airflow southwest of the WPSH and the southwest monsoon from the Bay of Bengal merge into a cyclonic gyre near the TC center. At −24 h, the cyclonic wind field near the RI TC center is significantly stronger than that near the non-RI TC center, which is consistent with the stronger boundary-layer convergence for RI TCs. From −12 to 0 h, the anomalous easterly wind of RI TCs is stronger than that of non-RI TCs. There are westerly troughs on the northeast side of RI TCs at the three times, which is consistent with Chen et al. (2015).
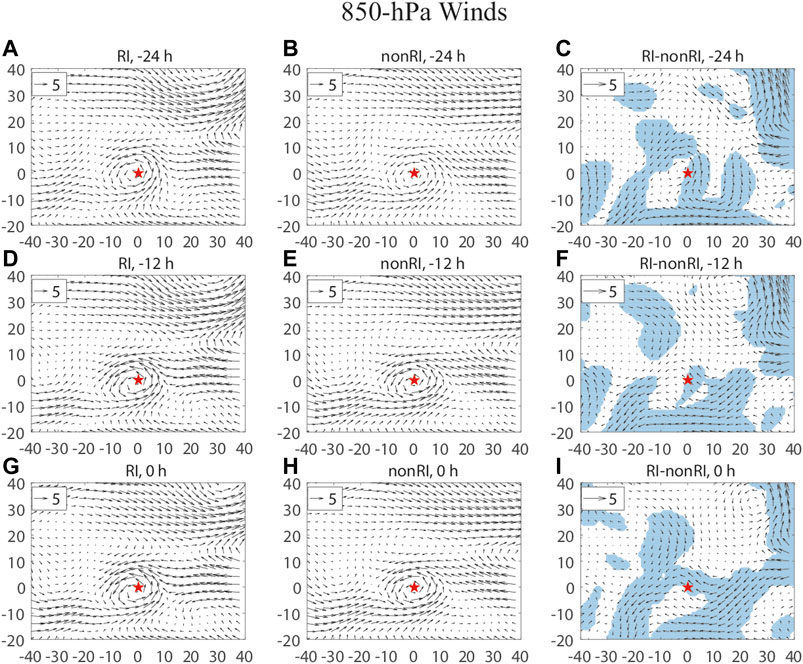
FIGURE 5. Composite 850-hPa environmental wind fields (m s−1) for RI and non-RI TCs and their differences. (A,D,G) are the composites for RI TCs at –24, –12, and 0 h, respectively; (B,C,H) are the composites for non-RI TCs at –24, –12, and 0 h, respectively; Shadings in (C,F,I) denote significant differences above the 90% confidence level.
The composite environmental wind field at 500 hPa is shown in Supplementary Figure S2. The westerly trough is located to the north, the continental high is located to the west, and the WPSH is located to the east of the two types of TCs. These systems for RI TCs are significantly stronger at the three times (−24, −12, 0 h) than those for non-RI TCs. The cold air mass behind the westerly trough invades southward into the TC, and triggers baroclinic deep convection and produces potential vorticity (PV) anomalies outside the TC inner-core area. The inward transport of PV anomalies and the subsequent symmetrization of the TC circulation are conducive to RI of TCs (May and Holland, 1999; Moller and Montgomery, 2000; Nolan et al., 2007). Besides, the continental high accompanied by the westerly trough can strengthen the cyclonic horizontal shear and convergence, which is also conducive to TC intensification (Chen et al., 2015).
Figure 6 shows the composite environmental wind field at 200 hPa. Both types of TCs are located to the south of the upper-level westerly jet. RI TCs are located in the easterly flow on the equator side of the upper-level anticyclonic ridge. The southwestward outflow in the south and the northeastward outflow in the northeast are significantly stronger than those associated with non-RI TCs, which is consistent with the stronger upper-level divergence of RI TCs mentioned above. The more favorable upper-level outflow channels of RI TCs can strengthen the TC secondary circulation, which is conducive to the spin-up of the TC primary circulation.
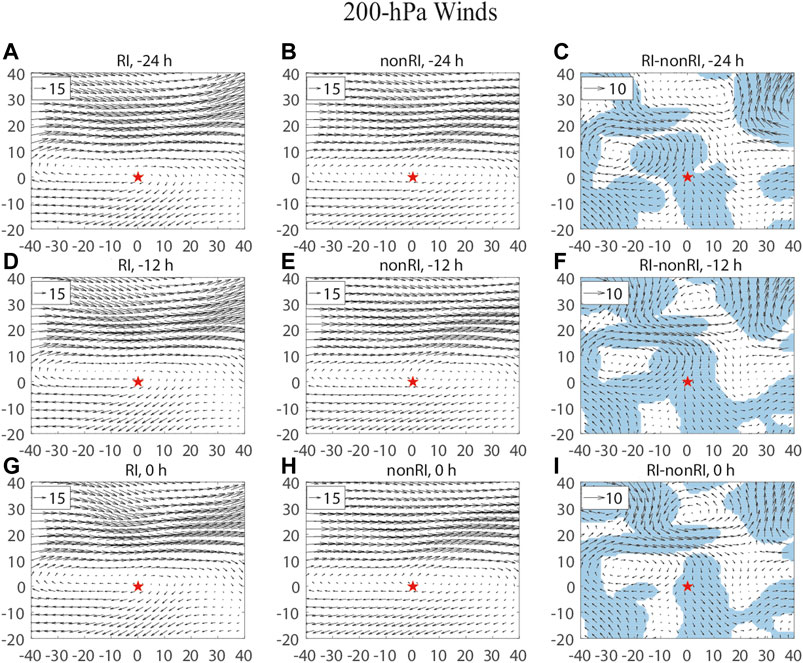
FIGURE 6. Same as Figure 5, but for the composite 200-hPa environmental wind fields (m s−1).
The temporal evolutions of the meridional and zonal cross sections of environmental VWS are shown in Figures 7, 8, respectively. The spatial distributions of VWS for the RI and non-RI TCs are similar. The VWS gradually increases from the lower to upper troposphere. The VWS near the TC center is notably weaker than that north and south of the center, and the VWS to the north is stronger than that to the south. However, the zonal distribution of VWS is more uniform. The VWS evolutions of the two types of events are somewhat different. During the 24-h period, the VWS around the RI TC center shows a decreasing tendency while the VWS of non-RI TCs changes little; the VuWS of RI TCs are always weaker than that of non-RI TCs, and the deep-layer shear between the upper levels and 850 hPa around the RI TC center is always less than 10 m s−1. The deep-layer shear northwest of the TC center at 0 h shows the most significant difference between RI and non-RI TCs (Figures 7, 8). However, Wang et al. (2015) pointed out that the low-level shear between 850 and 1,000 hPa was more negatively correlated with intensity change of the WNP TCs than deep-layer shear. This inconsistency suggests that the relative importance of VWS in different layers for TC intensity change may depend on large-scale circulations over the specific ocean basin.
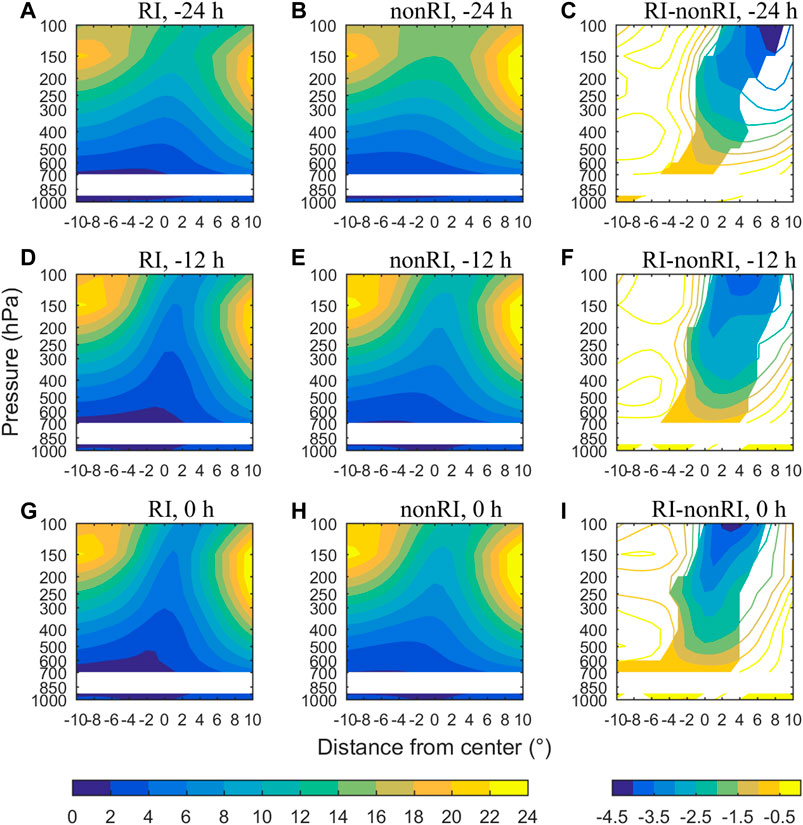
FIGURE 7. Same as Figure 3, but for environmental VWS (m s−1).

FIGURE 8. Same as Figure 7, but for zonal cross sections.
The temporal evolutions of the meridional and zonal cross sections of environmental relative humidity are indicated in Figures 9, 10, respectively. At the three times (−24, −12, and 0 h), the spatial distributions of relative humidity of RI and non-RI TCs are similar, featuring wet upper and lower troposphere and dry middle troposphere, with the driest middle-level air located northwest of the TC center. At −24 h, there is a significant difference in relative humidity southeast of the TC center at the middle and upper levels, which can be used as a precursor to RI. Over time, the middle- and upper-level air southeast of the TC center humidifies to a certain extent, and the significant difference in relative humidity southeast of the TC center at the middle and upper levels is still maintained. This may be related to the continuous water vapor transport by the southeasterly wind southwest of the WPSH.
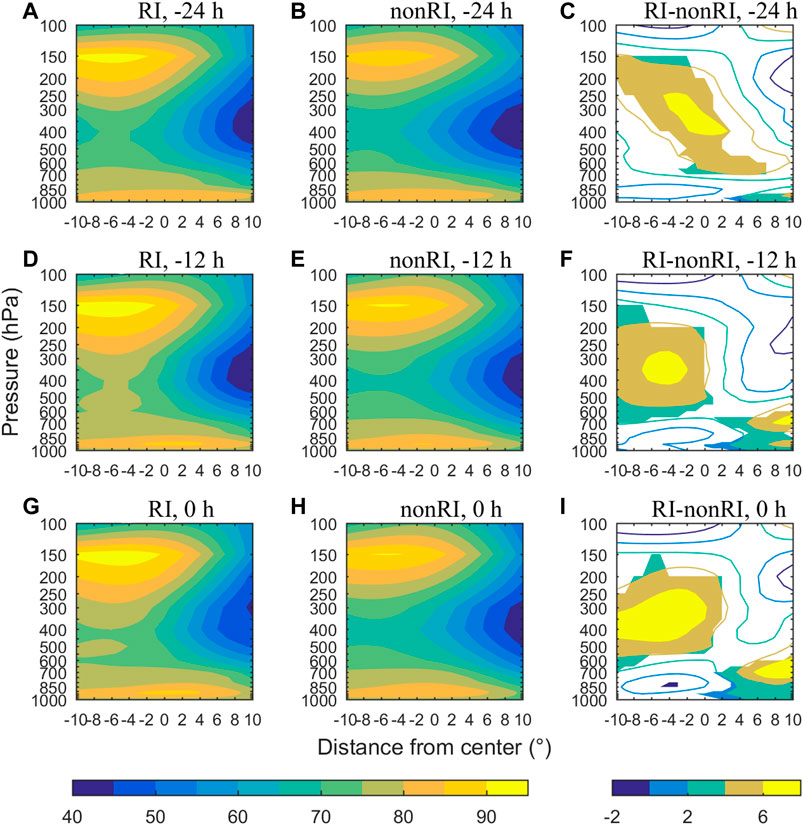
FIGURE 9. Same as Figure 3, but for environmental relative humidity (%).
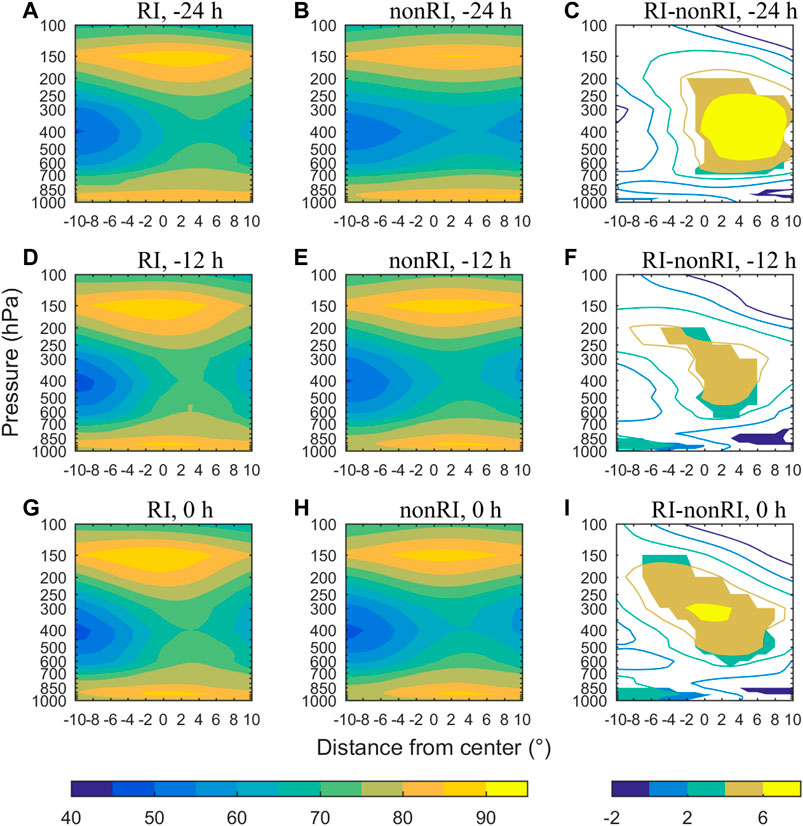
FIGURE 10. Same as Figure 9, but for zonal cross sections.
The intrusion of middle-level dry air from the northwest to the TC inner core can suppress the development of cumulus convection and the release of latent heat of condensation, which is not conducive to TC intensification (Braun et al., 2012; Ge et al., 2013). We notice that the middle-level humidity near the RI TC center is significantly higher than that of non-RI TCs, so it can effectively resist the intrusion of middle-level dry air from the northwest (Gao et al., 2017). In addition, moist air is transported from the southeast to the inner core of RI TCs. Both are conducive to the development of moist convection, thus leading to TC RI.
The temporal evolution of the composite SST is shown in Figure 11. The spatial patterns for two types of TCs are both characterized by cold SST in the north and warm SST in the south, and SST near the TC center exceeds 28°C, which meets the necessary SST condition for RI (Holliday and Thompson, 1979). SST of RI TCs around the storm center is significantly higher than that of non-RI TCs at the three times. This result is consistent with previous studies (e.g., Wang et al., 2015; Gao et al., 2016). TCs tend to intensify at a higher rate under higher SST because of a larger supply of surface latent and sensible heat fluxes (e.g., Emanuel, 1986; Gao and Chiu, 2010). The meridional SST gradient does not show meaningful differences between RI and non-RI SCS TCs (figure not shown).
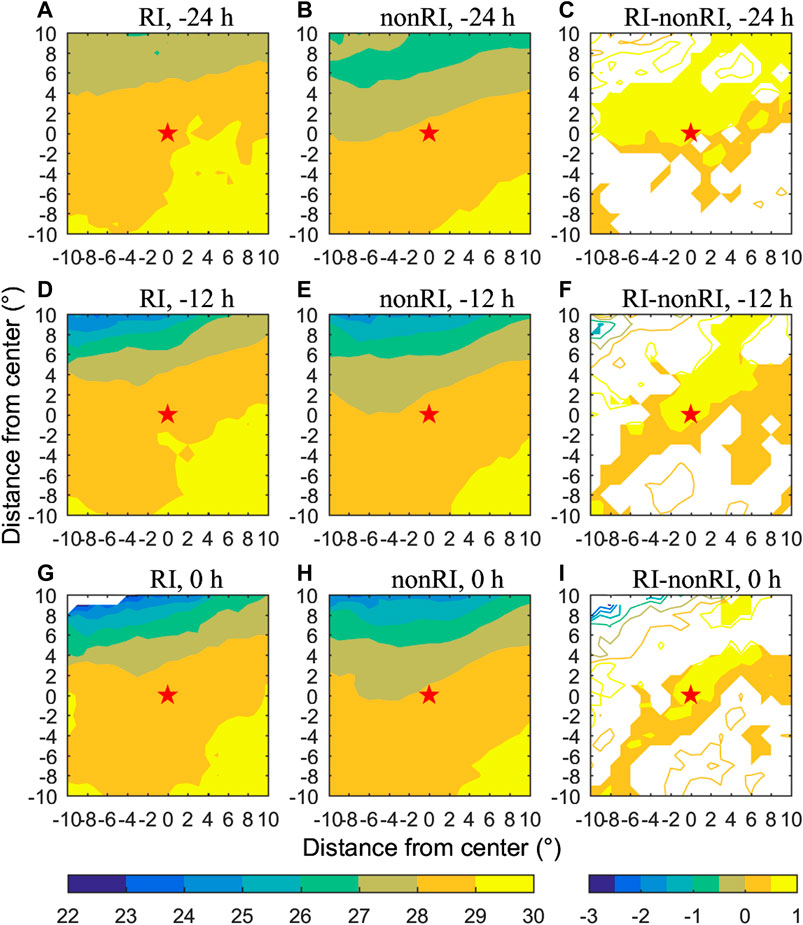
FIGURE 11. Same as Figure 5, but for SST (°C) in 20° × 20° areas around the TC center.
MPI is the theoretically-estimated maximum intensity that a TC can achieve under current atmospheric and ocean conditions (Emanuel, 1988). POT is the difference between MPI and current intensity, representing the intensification potential of TCs. The temporal evolution of the composite POT is shown in Figure 12. The POT of RI and non-RI TCs decreases from the south to the north, and gradually reduces with time. At −24 h, the POT west and north of RI TCs is significantly greater than that of non-RI TCs. Since most of TCs move westward or northward (dsl), the POT over 40 m s−1 in the west and north at −24 h is conducive to the occurrence of RI. Therefore, the POT north of TCs in the SCS at −24 h has a good predictive significance for RI.
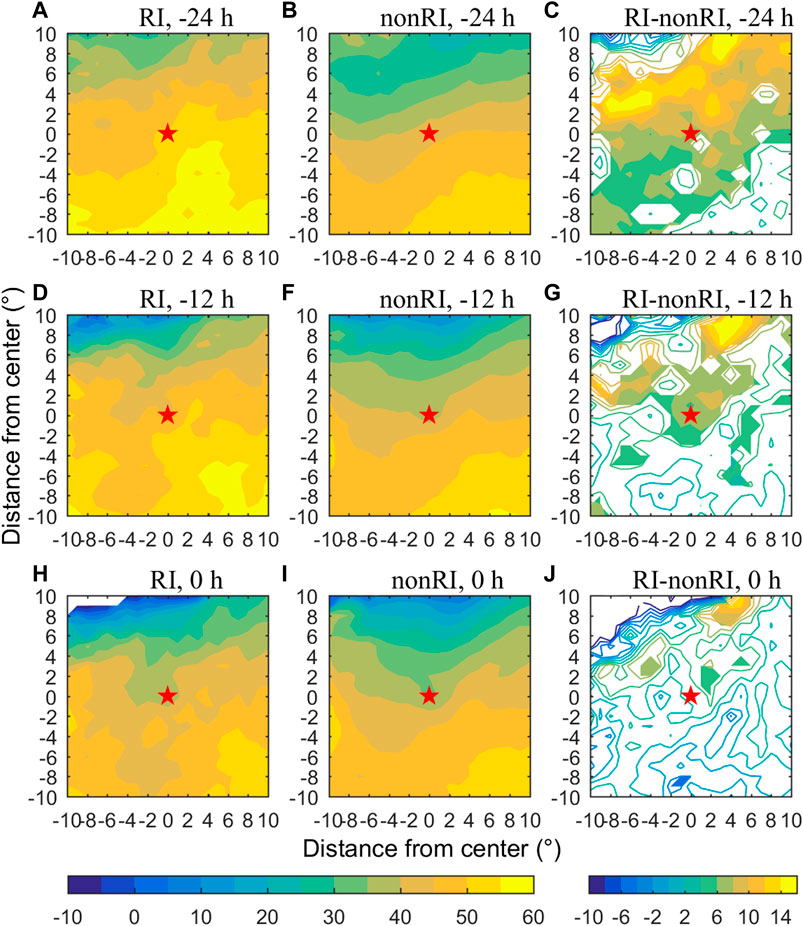
FIGURE 12. Same as Figure 11, but for POT (m s−1).
According to the above composite results, the time with the most significant difference in each factor between RI and non-RI TCs and the area with significant difference are given in Table 1, and the corresponding areal average for each factor is calculated. Figure 13 shows the BDI values of their areal averages and TC translation speed as well as the t-test results. The difference in environmental divergence between the upper and lower levels at −24 h, the deep-layer environmental VWS at 0 h, SST around the TC center, the POT north of the TC center at −24 h, the middle- and upper-level environmental relative humidity southeast of the TC center at −24 h, and TC translation speed from 0 to 24 h pass the significance test at the 95% confidence level, indicating that they are important factors for RI of the SCS TCs.
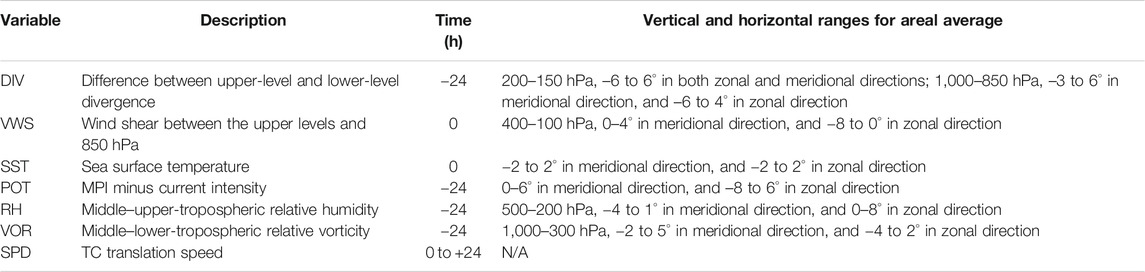
TABLE 1. The selected time and range for calculating the areal average of each environmental factor.
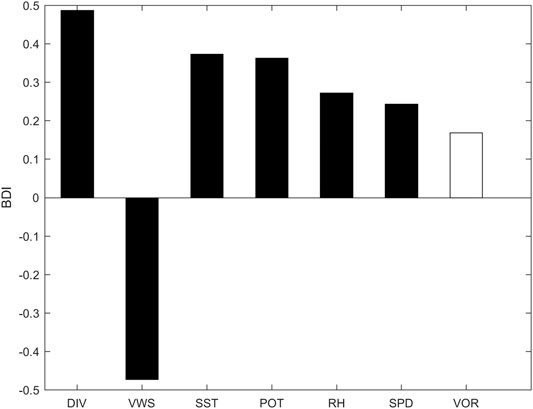
FIGURE 13. BDI values of the environmental factors listed in Table 1. Filled boxes denote those factors significant above the 95% confidence level.
To further clarify the importance of different factors for RI, stepwise regression is applied on the normalized variables including the predictand ∆V24 and the potential predictors listed in Table 1. The regression equation trained with the 95% confidence level is
The regression equation confirms that the difference in environmental divergence between the upper and lower levels at −24 h, the deep-layer environmental VWS at 0 h, TC translation speed from 0 to 24 h, and the POT north of the TC center at −24 h are key factors for RI of the SCS TCs. Their decreasing absolute values of regression coefficients suggest their importance in that order.
Figure 14 shows the boxplots for six factors of RI and non-RI TCs. The RI samples are more concentrated than the non-RI samples. Although all factors passing the 95% significance test, the boxes of RI and non-RI TCs partly overlap. Therefore, it is difficult to forecast RI by using an individual factor. In general, such conditions, including strong divergence in the upper troposphere and strong convergence in the lower troposphere, weak deep-layer VWS, large POT north of the TC center at −24 h, and fast TC translation speed, are favorable for RI of the SCS TCs.
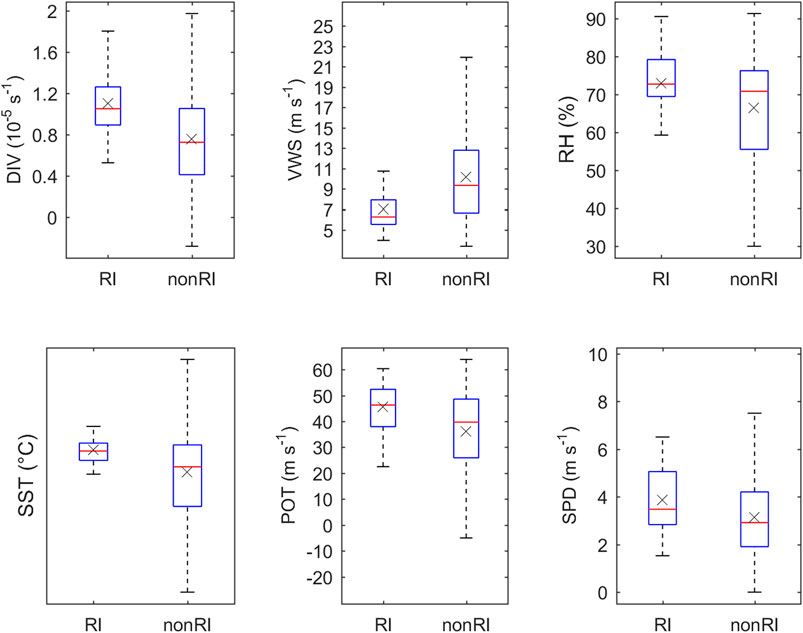
FIGURE 14. Boxplots of the environmental factors for RI and non-RI TCs. The top (bottom) of each dashed line corresponds to the maximum (minimum) value. The upper (lower) boundary of each box denotes the 75th (25th) percentile, and the red line (black cross sign) inside the box denotes the median (mean).
The temporal evolution characteristics of the environmental fields of RI and non-RI TCs in the SCS during 2000–2018 have been compared in this paper, and the following characteristics of RI TCs have been found. From −24 to 0 h, the positive vorticity at 1,000–300 hPa, the divergence at 200–150 hPa, and boundary-layer convergence continues to increase. The deep-layer shear between the upper levels and 850 hPa around the TC center is always less than 10 m s−1. The environmental moist layer is thick. The underlying SST is high. The POT north of the TC center is larger than 40 m s−1 at −24 h. Then, the average environmental factors are calculated over the areas with significant difference between the two types of TCs. Combined with the BDI and t-test method as well as stepwise regression, it has been found that the configuration of strong upper-level divergence and strong boundary-layer convergence, weak deep-layer VWS, fast TC translation speed, and large POT north of the TC center are the key factors for RI of the SCS TCs, and their importance to the RI decreases in that order.
Compared with TCs in the entire WNP basin, the environmental fields conducive to the occurrence of TC RI in the SCS are somewhat different. First, RI TCs in the SCS are accompanied by higher environmental relative humidity at middle and upper levels, while RI TCs in the WNP is accompanied by higher low-level relative humidity (Shu et al., 2012). Secondly, RI TCs in the SCS have weaker deep-layer VWS, while RI TCs in the WNP have weaker low-level VWS (Wang et al., 2015). Thirdly, RI TCs move significantly faster than non-RI TCs in the SCS, while there is no significant difference in translation speed between RI and non-RI TCs in the WNP (Shu et al., 2012). In addition, the areas with significant differences in these key factors are also quite different from the areas for calculation of the related predictors in operational statistical intensity prediction schemes of the WNP TCs (e.g., Knaff et al., 2005; Gao and Chiu, 2012), indicating that the environmental factors affecting intensity change of TCs in the SCS and WNP are somewhat different. Thus, we should deal with the predictors separately when establishing the statistical intensity prediction models for the SCS TCs.
In this study, some key environmental factors for RI of the SCS TCs have been identified through statistical methods. However, some samples of these factors overlap in the boxplots of RI and non-RI TCs, hence it is difficult to effectively forecast RI by using an individual factor. In the near future, combined with a variety of techniques, we will use these key factors to establish TC intensity prediction models, aiming to make more accurate forecasts for RI of the SCS TCs. Due to the limitation of data availability, some factors such as ocean heat content and mixed layer depth, which could also contribute to RI, are not analyzed in this study. The importance of these factors in intensity change of the SCS TCs would be examined when the data over a long period of time are available.
The TC best track dataset is provided by the CMA Shanghai Typhoon Institute at http://tcdata.typhoon.org.cn/en/. The NCEP FNL analysis data are provided by the U.S. NCAR Research Data Archive at https://rda.ucar.edu/datasets/ds083.2. The OISST V2 data are provided by the NOAA/OAR/ESRL PSL, Boulder, Colorado, USA, from their Web site at https://psl.noaa.gov/.
SG designed the research. YC performed data analyses and prepared the figures. YC and SG wrote the manuscript. XL and XS discussed the results and commented on the manuscript.
This work was supported by the National Natural Science Foundation of China (Grant Nos. 41930967 and 41975054), the Strategic Priority Research Program of the Chinese Academy of Sciences (Grant No. XDA20100304), and Key Laboratory of South China Sea Meteorological Disaster Prevention and Mitigation of Hainan Province (Grant No. SCSF201901).
The authors declare that the research was conducted in the absence of any commercial or financial relationships that could be construed as a potential conflict of interest.
The Supplementary Material for this article can be found online at: https://www.frontiersin.org/articles/10.3389/feart.2020.609727/full#supplementary-material.
Bai, L., and Wang, Y. (2016). Effects of vertical wind shear on tropical cyclone intensity change. J. Trop. Meteorol. 22, 11–18. doi:10.16555/j.1006-8775.2016.01.002
Braun, S. A., Sippel, J. A., and Nolan, D. S. (2012). The impact of dry midlevel air on hurricane intensity in idealized simulations with no mean flow. J. Atmos. Sci. 69, 236–257. doi:10.1175/jas-d-10-05007.1
Chen, X., Wang, Y., and Zhao, K. (2015). Synoptic flow patterns and large-scale characteristics associated with rapidly intensifying tropical cyclones in the South China Sea. Mon. Weather Rev. 143, 64–87. doi:10.1175/mwr-d-13-00338.1
Cheng, Z., Lin, L., Yang, G., and Sha, T. (2017). Rapid intensification and associated large-scale circulation of super typhoon Rammasun in 2014. J. Appl. Meteorol. Sci. 28, 318–326 [in Chinese, with English abstract]. doi:10.11898/1001-7313.20170306
Demaria, M. (1996). The effect of vertical shear on tropical cyclone intensity change. J. Atmos. Sci. 53, 2076–2088. doi:10.1175/1520-0469(1996)053<2076:teovso>2.0.co;2
Emanuel, K. A. (1986). An air-Sea interaction theory for tropical cyclones. Part I: steady-state maintenance. J. Atmos. Sci. 43, 585–605. doi:10.1175/1520-0469(1986)043<0585:aasitf>2.0.co;2
Emanuel, K. A. (1988). The maximum intensity of hurricanes. J. Atmos. Sci. 45, 1143–1155. doi:10.1175/1520-0469(1988)045<1143:tmioh>2.0.co;2
Fu, B., Peng, M. S., Li, T., and Stevens, D. E. (2012). Developing versus nondeveloping disturbances for tropical cyclone formation. Part II: Western North Pacific. Mon. Weather Rev. 140, 1067–1080. doi:10.1175/2011mwr3618.1
Gao, S., and Chiu, L. S. (2010). Surface latent heat flux and rainfall associated with rapidly intensifying tropical cyclones over the western North Pacific. Int. J. Rem. Sens. 31, 4699–4710. doi:10.1080/01431161.2010.485149
Gao, S., and Chiu, L. S. (2012). Development of statistical typhoon intensity prediction: application to satellite-observed surface evaporation and rain rate (STIPER). Weather Forecast 27, 240–250. doi:10.1175/waf-d-11-00034.1
Gao, S., Zhai, S., Chen, B., and Li, T. (2017). Water budget and intensity change of tropical cyclones over the western North Pacific. Mon. Weather Rev. 145, 3009–3023. doi:10.1175/mwr-d-17-0033.1
Gao, S., Zhai, S., Chiu, L. S., and Xia, D. (2016). Satellite air-sea enthalpy flux and intensity change of tropical cyclones over the western North Pacific. J. Appl. Meteorol. Clim. 55, 425–444. doi:10.1175/jamc-d-15-0171.1
Ge, X., Li, T., and Peng, M. (2013). Effects of vertical shears and midlevel dry air on tropical cyclone developments*. J. Atmos. Sci. 70, 3859–3875. doi:10.1175/jas-d-13-066.1
Gray, W. M. (1968). Global view of the origin of tropical disturbances and storms. Mon. Weather Rev. 96, 669–700. doi:10.1175/1520-0493(1968)096<0669:gvotoo>2.0.co;2
Hanley, D., Molinari, J., and Keyser, D. (2001). A composite study of the interactions between tropical cyclones and upper-tropospheric troughs. Mon. Weather Rev. 129, 2570–2584. doi:10.1175/1520-0493(2001)129<2570:acsoti>2.0.co;2
Holland, G. J. (1997). The maximum potential intensity of tropical cyclones. J. Atmos. Sci. 54, 2519–2541. doi:10.1175/1520-0469(1997)054<2519:tmpiot>2.0.co;2
Holliday, C. R., and Thompson, A. H. (1979). Climatological characteristics of rapidly intensifying typhoons. Mon. Weather Rev. 107, 1022–1034. doi:10.1175/1520-0493(1979)107<1022:ccorit>2.0.co;2
Hu, H., and Duan, Y. (2016). Analysis of environmental variables of rapidly intensifying tropical cyclones in the South China Sea. J. Trop. Meteorol. 32, 299–310 [in Chinese, with English abstract]. doi:10.16032/j.issn.1004-4965.2016.03.002
Jone, S. C. (1995). The evolution of vortices in vertical shear. I: initially barotropic vortices. Q. J. Roy. Meteorol. Soc. 121, 821–851. doi:10.1002/qj.49712152406
Kaplan, J., and DeMaria, M. (2003). Large-scale characteristics of rapidly intensifying tropical cyclones in the North Atlantic basin. Weather Forecast. 18, 1093–1108. doi:10.1175/1520-0434(2003)018<1093:lcorit>2.0.co;2
Knaff, J. A., Sampson, C. R., and DeMaria, M. (2005). An operational statistical typhoon intensity prediction scheme for the Western North Pacific. Weather Forecast 20, 688–699. doi:10.1175/waf863.1
Kurihara, Y., Bender, M. A., and Ross, R. J. (1993). An initialization scheme of hurricane models by vortex specification. Mon. Weather Rev. 121, 2030–2045. doi:10.1175/1520-0493(1993)121<2030:aisohm>2.0.co;2
Li, X., Zhao, S., Li, Z., Li, Y., and Wang, Y. (2011). Characteristics of intensity change in tropical cyclones affecting the South China Sea from 1977 to 2007. J. Trop. Meteorol. 17, 156–165 [in Chinese, with English abstract]. doi:10.3969/j.issn.1006-8775.2011.02.008
May, P. T., and Holland, G. J. (1999). The role of potential vorticity generation in tropical cyclone rainbands. J. Atmos. Sci. 56, 1224–1228. doi:10.1175/1520-0469(1999)056<1224:tropvg>2.0.co;2
Mei, Y., and Yu, J. (2016). Effect of environment field on rapid intensification process of tropical cyclones over the western North Pacific. J. Appl. Meteorol. Sci. 36, 770–778 [in Chinese, with English abstract]. doi:10.3969/2016jms.0006
Merrill, R. T. (1988). Environmental influences on hurricane intensification. J. Atmos. Sci. 45, 1678–1687. doi:10.1175/1520-0469(1988)045<1678:eiohi>2.0.co;2
Möller, J. D., and Montgomery, M. T. (2000). Tropical cyclone evolution via potential vorticity anomalies in a three-dimensional balance model. J. Atmos. Sci. 57, 3366–3387. doi:10.1175/1520-0469(2000)057<3366:tcevpv>2.0.co;2
Nolan, D. S., Moon, Y., and Stern, D. P. (2007). Tropical cyclone intensification from asymmetric convection: energetics and efficiency. J. Atmos. Sci. 64, 3377–3405. doi:10.1175/jas3988.1
Qiu, W., Wu, L., and Ren, F. (2020). Monsoonal influences on offshore rapid intensification of landfalling typhoons in a sheared environment over the South China Sea. Weather Forecast 35, 623–634. doi:10.1175/waf-d-19-0134.1
Reynolds, R. W., Smith, T. M., Liu, C., Chelton, D. B., Casey, K. S., and Schlax, M. G. (2007). Daily high-resolution-blended analyses for sea surface temperature. J. Clim. 20, 5473–5496. doi:10.1175/2007jcli1824.1
Shay, L. K., Goni, G. J., and Black, P. G. (2000). Effects of a warm oceanic feature on Hurricane Opal. Mon. Weather Rev. 128, 1366–1383. doi:10.1175/1520-0493(2000)128<1366:eoawof>2.0.co;2
Shu, S., Ming, J., and Chi, P. (2012). Large-scale characteristics and probability of rapidly intensifying tropical cyclones in the western North Pacific Basin. Weather Forecast 27, 411–423. doi:10.1175/waf-d-11-00042.1
Sitkowski, M., Kossin, J. P., and Rozoff, C. M. (2011). Intensity and structure changes during hurricane eyewall replacement cycles. Mon. Weather Rev. 139, 3829–3847. doi:10.1175/mwr-d-11-00034.1
Tuleya, R. E., and Kurihara, Y. (1981). A numerical study on the effects of environmental flow on tropical storm genesis. Mon. Weather Rev. 109, 2487–2506. doi:10.1175/1520-0493(1981)109<2487:ansote>2.0.co;2
Wang, Y., Rao, Y., Tan, Z.-M., and Schönemann, D. (2015). A statistical analysis of the effects of vertical wind shear on tropical cyclone intensity change over the western North Pacific. Mon. Weather Rev. 143, 3434–3453. doi:10.1175/mwr-d-15-0049.1
Xu, W., Zhou, S., Ge, X., and Ma, Y. (2017). Wind speed distribution features of rapidly intensifying tropical cyclones in Northwest Pacific. J. Trop. Meteorol. 33, 259–266 [in Chinese, with English abstract]. doi:10.16032/j.issn.1004-4965.2017.02.012
Yang, B., Wang, Y., and Wang, B. (2007). The effect of internally generated inner-core asymmetries on tropical cyclone potential intensity*. J. Atmos. Sci. 64, 1165–1188. doi:10.1175/jas3971.1
Yang, S., Li, Y., and Chen, L. (2017). The characteristics of tropical cyclone intensity change in western North Pacific. J. Trop. Meteorol. 33, 666–674 [in Chinese, with English abstract]. doi:10.16032/j.issn.1004-4965.2017.05.010
Ying, M., Zhang, W., Yu, H., Lu, X., Feng, J., Fan, Y., et al. (2014). An overview of the China Meteorological Administration tropical cyclone database. J. Atmos. Ocean. Technol. 31, 287–301. doi:10.1175/jtech-d-12-00119.1
Keywords: tropical cyclone, South China Sea, rapid intensification, environmental factors, box difference index
Citation: Chen Y, Gao S, Li X and Shen X (2021) Key Environmental Factors for Rapid Intensification of the South China Sea Tropical Cyclones. Front. Earth Sci. 8:609727. doi: 10.3389/feart.2020.609727
Received: 24 September 2020; Accepted: 22 December 2020;
Published: 29 January 2021.
Edited by:
Hiroyuki Murakami, University Corporation for Atmospheric Research (UCAR), United StatesReviewed by:
Jiuwei Zhao, Pohang University of Science and Technology, South KoreaCopyright © 2021 Chen, Gao, Li and Shen. This is an open-access article distributed under the terms of the Creative Commons Attribution License (CC BY). The use, distribution or reproduction in other forums is permitted, provided the original author(s) and the copyright owner(s) are credited and that the original publication in this journal is cited, in accordance with accepted academic practice. No use, distribution or reproduction is permitted which does not comply with these terms.
*Correspondence: Si Gao, Z2Fvc2k1QG1haWwuc3lzdS5lZHUuY24=; Xinyong Shen, c2hlbnh5QG51aXN0LmVkdS5jbg==
Disclaimer: All claims expressed in this article are solely those of the authors and do not necessarily represent those of their affiliated organizations, or those of the publisher, the editors and the reviewers. Any product that may be evaluated in this article or claim that may be made by its manufacturer is not guaranteed or endorsed by the publisher.
Research integrity at Frontiers
Learn more about the work of our research integrity team to safeguard the quality of each article we publish.