 Hiroyuki Matsumoto
 Eiichiro Araki
95% of researchers rate our articles as excellent or good
Learn more about the work of our research integrity team to safeguard the quality of each article we publish.
Find out more
ORIGINAL RESEARCH article
Front. Earth Sci. , 12 January 2021
Sec. Solid Earth Geophysics
Volume 8 - 2020 | https://doi.org/10.3389/feart.2020.600966
This article is part of the Research Topic Frontiers in Seafloor Geodesy View all 21 articles
DONET, the dense ocean-floor network system for earthquakes and tsunamis, began operations in the Nankai Trough, SW Japan, in 2010. The present study focuses on pressure sensors that are being used as tsunami meters to measure changes in hydraulic pressure. Pressure sensors typically show a drift in their readings over their operational lifespan. DONET pressure sensors can act as geodetic sensors measuring vertical crustal deformation change over time if the sensor drift can be accurately corrected. Monitoring crustal deformation before the occurrence of megathrust earthquakes is performed by discriminating between the vertical crustal deformation and the sensor drift of the pressure sensors. Therefore, in this study, we evaluated the sensor drift shown by the DONET pressure sensors since their deployment into the deep-sea, by removing the tidal component and confirming the occurrence of sensor drift. We evaluated the initial behavior of pressure sensors before deep-sea deployment using our own high-accuracy pressure standard. Our experiment involved 20-MPa pressurization for the pressure sensors under an ambient temperature of 2°C for a duration of 1 month. Some sensor drifts in our experiment correspond in rate and direction to those from the in-situ measurements determined to be in the initial stage. Our experiment suggests that the pre-deployment pressurization of pressure sensors can be an effective procedure to determine the sensor drift after sensor deployment into the deep-sea.
The Japan Agency for Marine-Earth Science and Technology (JAMSTEC) began developing a new dense seafloor observation network linked by submarine cables in 2006, located off the Kii Peninsula, SW Japan, where the last megathrust earthquake, that is, the Tonankai earthquake, occurred in 1944 (Kaneda et al., 2015; Kawaguchi et al., 2015). This observation network is named the “Dense Ocean-floor Network System for Earthquakes and Tsunamis” (DONET). It was first launched in 2011 with 20 observation stations, each with a three-component broadband seismometer, a three-component accelerometer, a tsunami meter, and other geophysical sensors. The same observation network was deployed in the western region of the first DONET where the last Nankai earthquake occurred in 1946. The first and second DONETs are referred to as DONET1 and DONET2, respectively. These stations cover the anticipated Tonankai and Nankai earthquake source regions and aim to monitor both long-term seismic activity and the geophysical characteristics of megathrust earthquakes and tsunamis. The data from DONET are intended to be used for high-precision earthquake prediction modeling, to detect precursory movements before a megathrust earthquake, and contribute to mitigating disasters caused by earthquakes and tsunamis by providing critical alert information (Takahashi et al., 2017).
The DONET1 observatories were installed and became operational between 2010 and 2011, while the DONET2 observatories were installed and became operational between 2014 and 2016. The DONET observatory operation was transferred to the National Research Institute for Earth Science and Disaster Resilience (NIED) following its installation. The 51 observatories are now fully operational, and real-time measurements are being sent to the landing stations. Figure 1 shows the locations of the DONET observatories. The observatories were deployed in an area approaching the Nankai Trough at water depths between 1,300 and 4,500 m. A backbone cable approximately 300 km long connects five science nodes for DONET1, a 400 km backbone cable connects seven science nodes for DONET2, and an extension cable connects each science node to four or five observatories. In combination, these are capable of real-time transmission of collected data from the seafloor to the landing station. DONET has an advantage over other systems in that the dense observatory network can be operated in the same way as inland networks.
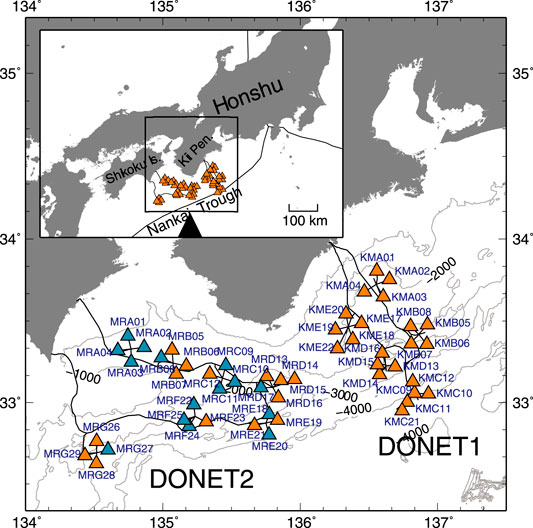
FIGURE 1. Observatories and submarine cable layout of DONET denoted by triangles and solid lines, respectively. The blue triangles represent the specific stations in which pressure sensors were installed after the present experiments.
The present study focuses on pressure sensors that are employed as tsunami meters to detect hydraulic pressure changes. Pressure sensors specify their standard performance in terms of both hysteresis and repeatability; however, no details of the sensors’ long-term stability have yet been explicitly defined. It was long assumed that drift in a pressure sensor’s readings cannot be avoided during long-term measurements. This sensor drift has been studied through in-situ measurements since the 1980s (Chiswell and Lukas, 1989; Watts and Kontoyiannis, 1990; Eble and González, 1991; Fujimoto et al., 2003; Polster et al., 2009), although corresponding laboratory experiments have been scarce (Wearn and Larson, 1982; Kobata, 2005; Kajikawa and Kobata, 2019). For example, Watts and Kontoyiannis (1990) used in-situ measurements to compare the sensor drift between bellows-type and Bourdon-type pressure sensors and used the data to identify an exponential decay over time. Polster et al. (2009) evaluated sensor drift variations from the in-situ pressure data derived from the Deep Ocean Assessment and Reporting of Tsunamis (DART), Leibniz Institute of Marine Sciences (IFM-GEOMAR), Logatchev Long-term Environmental Monitoring (LOLEM), and Circulation Obviation Retrofit Kits (CORK) stations, using datasets spanning between 2 months and 9 years. Their results suggest that sensor drift increases with increasing deployment depth. In contrast to these in-situ studies, researchers have encountered difficulties in accurately controlling continuous pressure loading in laboratory experiments. Wearn and Larson (1982) conducted an experiment in which 0.6 MPa of continuous pressure was applied to pressure sensors for a duration of approximately 160 days with one release lasting 1.5 days in the middle of the experimental period. Their results indicated that even if pressure was released once and then applied again, the sensor drift continued to follow the predicted drift curve. Through the works described here, it can be seen that sensor drift has been closely examined since the first use of pressure data in geophysical research. Sensor drift is not considered a major issue for tsunami detection because tsunamis are a short-term phenomenon. However, fully understanding the rate and extent of sensor drift is critical when pressure sensors are used as geodetic instruments. One of the objectives of DONET is to detect crustal deformation before the occurrence of megathrust earthquakes (Ariyoshi et al., 2014). Hence, we should aim to understand the characteristics of sensor drift in this situation before we can quantitatively estimate crustal deformation using these pressure sensors.
In the present study, we examined the data from DONET pressure sensors for a period when JAMSTEC was responsible for the DONET dataset (i.e., before the end of March 2016), and carried out a specialized laboratory experiment to answer the following questions: 1) Can we predict the initial behavior of a pressure sensor in the deep-sea before its deployment? 2) Can the sensor drift be mitigated by pressure loading preconditioning before its deployment? An associated study was published in which the sensor drift was estimated by differentiation between the initial and the last obtained data within the experimental period (Matsumoto et al., 2018), suggesting that the sensor drift rate from the experiment was overestimated. Therefore, we process the experimental data by extrapolating the drift model to estimate the long-term drift rate of the DONET pressure sensors. We analyze the DONET data of the pressure sensors after deployment and compare them with the experimental results obtained from sensors pressurized prior to deployment into the deep-sea.
Absolute quartz oscillation pressure sensors (Paroscientific Inc., Digiquartz® Depth Sensor, model: 8B7000-2-005, pressure range: 0–68.95 MPa) are used as tsunami meters in DONET. Generally, pressure sensor mechanisms employ either bellows or Bourdon tubes as high pressure-to-load generators. In DONET, the pressure sensors are of the Bourdon tube-type. Two sets of frequency output signals are sent from each pressure sensor. The pressure applied to the Bourdon tube generates an uncoiling force, which applies tension to the quartz crystal to increase its resonant frequency. A temperature-sensitive crystal was used for thermal correction (Figure 2). Thus, the pressure sensor measures quartz oscillations that are representative of both pressure and temperature. It has been reported that pressure sensors with a Bourdon tube have a smaller mechanical drift than those with a bellows tube (Watts and Kontoyiannis, 1990). In general, sensor drift is a very slow phenomenon driven by the release of internal stress, which may be attributed to the assembly of the sensor or the aging of mechanical or electronic components (Polster et al., 2009; Paros and Kobayashi, 2016).
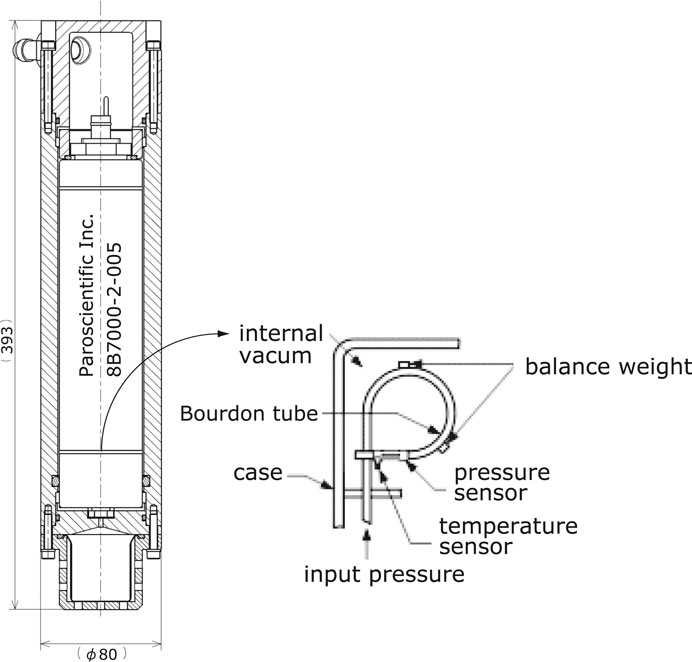
FIGURE 2. Schematics of the oil filled pressure sensor (left) designed for DONET and internal mechanism (right), courtesy of Paroscientific, Inc.
The first DONET observatory was deployed at the KMA03 location in the center of the Kumano Trough in March 2010, followed by the other observatories (Figure 1). The construction of DONET observatories requires a two-step operation by a remotely-operated vehicle (ROV); step 1 is to install a sensor unit and step 2 is to connect it with a science node located approximately 10 km away. This two-step operation creates a time gap between the installation and boot-up of a pressure sensor. Additionally, an initial quality control operation was sometimes required for some observatories. Therefore, it should be noted that data availability does not always correspond to the deployment date of a pressure sensor.
The final output of the DONET is 10 Hz pressure data derived from the processing of two sets of pressure and temperature frequencies. As these pressure sensors are intended to provide information about vertical crustal deformation, the tidal component, which makes up the majority of the observed pressure change, must be removed to detect such small-scale geodetic phenomena and sensor drift. For this reason, we examine the acquired data to produce de-tided pressure data using tide coefficient analysis in terms of harmonics. In this way, the recorded data can be used to evaluate long-term sensor drift in DONET pressure sensors.
Short-term pressure data were used as a trial for our data processing procedure before full-scale analysis. After validation of our data processing, the technique can be applied to all other observatories in the network. For the harmonic analysis in this study, the Baytap08 program based on the Baytap-G program (Tamura et al., 1991) was applied to the acquired pressure data and the results were divided into periodic tide and trend components; the latter reflects the sensor drift. Before applying Baytap08 to the data for the entire period, we processed the pressure data obtained at KMA01 for a duration of 100 days, spanning from May 5 to August 12, 2010, using the following procedure:
(1) Pressure data are converted to water depth using the hydrostatic formulation recommended by UNESCO (UNESCO, 1983).
(2) The water depth measured by the conductivity-temperature-depth (CTD) sensor installed on the ROV used during the observatory construction was subtracted.
(3) The original pressure data are resampled from 10 Hz to 1-hourly data so that Baytap08 can be applied.
The processed observational data, as well as the periodic tide and aperiodic components derived by Baytap08, are shown in Figure 3A, in which each tick on the vertical axis represents 50 cm water depth, equivalent to 50 hPa in pressure change. It is clear that the measurements from the in-situ pressure sensors are dominated by the periodic tide; however, other aperiodic pressure changes are identifiable, as shown in the trend plot in Figure 3A. These aperiodic pressure changes include sensor drift, sensor noise, local environmental pressure, and vertical deformation of the seafloor; these vary in amplitude up to ±3.2 cm standard deviation (SD) over the approximately 100-days analytical period.
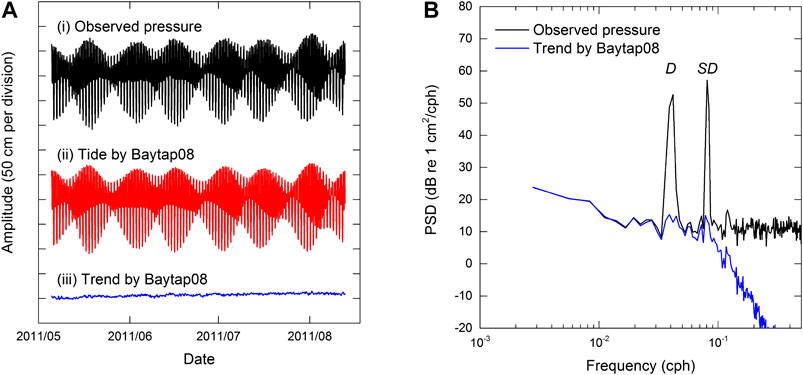
FIGURE 3. (A) Example of pressure waveforms recorded at KMA01: i) original observed waveform, ii) tide component analyzed by Baytap08, and iii) trend component. (B) Spectrum of the observed pressure and trend component analyzed by Baytap08. D and SD represent the diurnal and semi-diurnal tide components, respectively.
To validate the tide removal analyzed by Baytap08, we compared the observed data with the trend component solved by Baytap08 in the frequency domain. The observed pressure (water depth) change and trend components from Baytap08 are compared in Figure 3B in terms of frequency. In this figure, the four major tidal signals with relatively large amplitudes represent the semi-diurnal tide components,
Here, we examine the pressure sensor drift occurring at the DONET observatories, assuming that the non-tidal component determined by the above-described process corresponds to sensor drift. The tidal component of the in-situ pressure measurements was removed by the analysis of Baytap08. Figure 4 represents the de-tided pressures of the DONET1 observation by order of the science node (i.e., KMA thorough KME) for the entire period up to April 2016. The DONET1 observatories were deployed in 2010 and 2011, except for two observatories, KMC21 and KME22, which were deployed in 2016. Figure 5 shows the de-tided pressures of the DONET2 observation with the same form as Figure 4. The DONET2 observatories were deployed for a period between 2014 and 2016; therefore, the plots begin in 2014. For all pressure sensors, seasonal sea surface fluctuations are commonly recorded, as they cannot be predicted by Baytap08. Although further processing can be applied to remove such low-frequency aperiodic components, we consider sensor drift to be a more long-term phenomenon. It should be noted that unexpected or unexplained small pressure steps (less than a few tens of cm) were observed in a small number of pressure sensors.
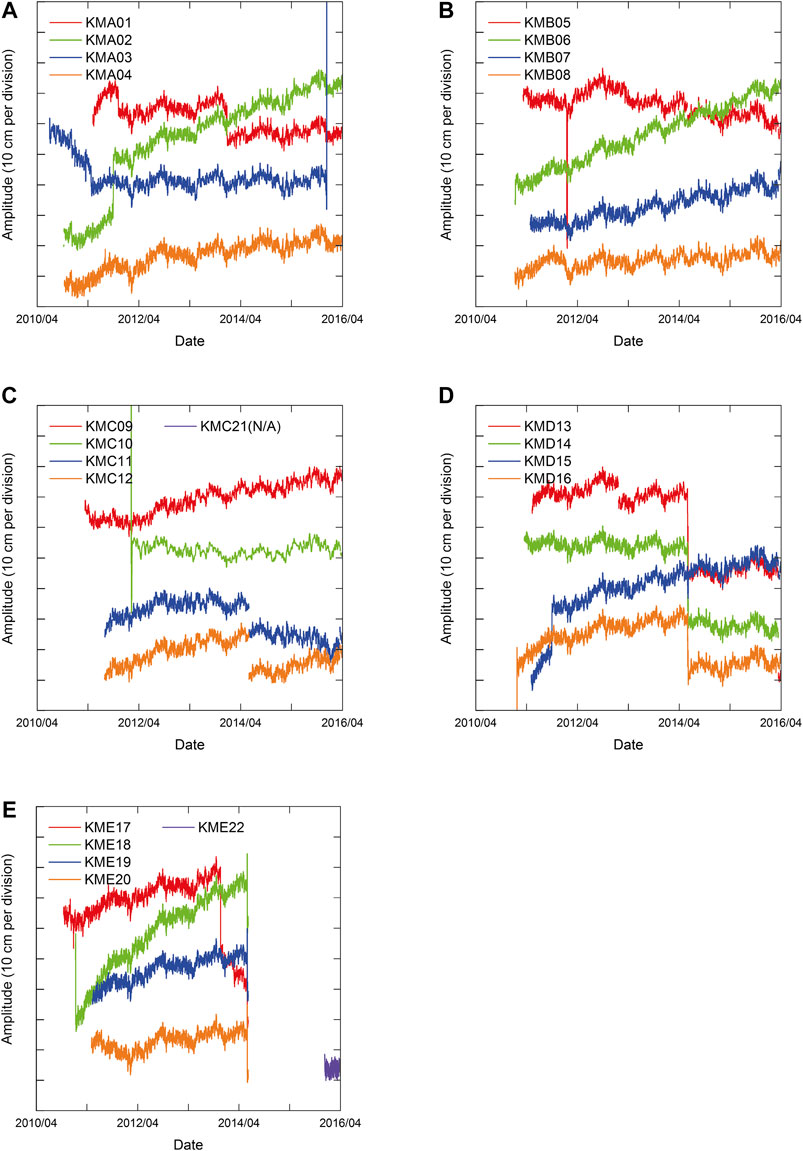
FIGURE 4. (A) Trend component of pressure sensors analyzed by Baytap08 of KMA observatories. Each tick on the vertical axis represents 10 cm water depth change. (B) KMB, (C) KMC, (D) KMD, and (E) KME observatories are presented in the same form as (A).
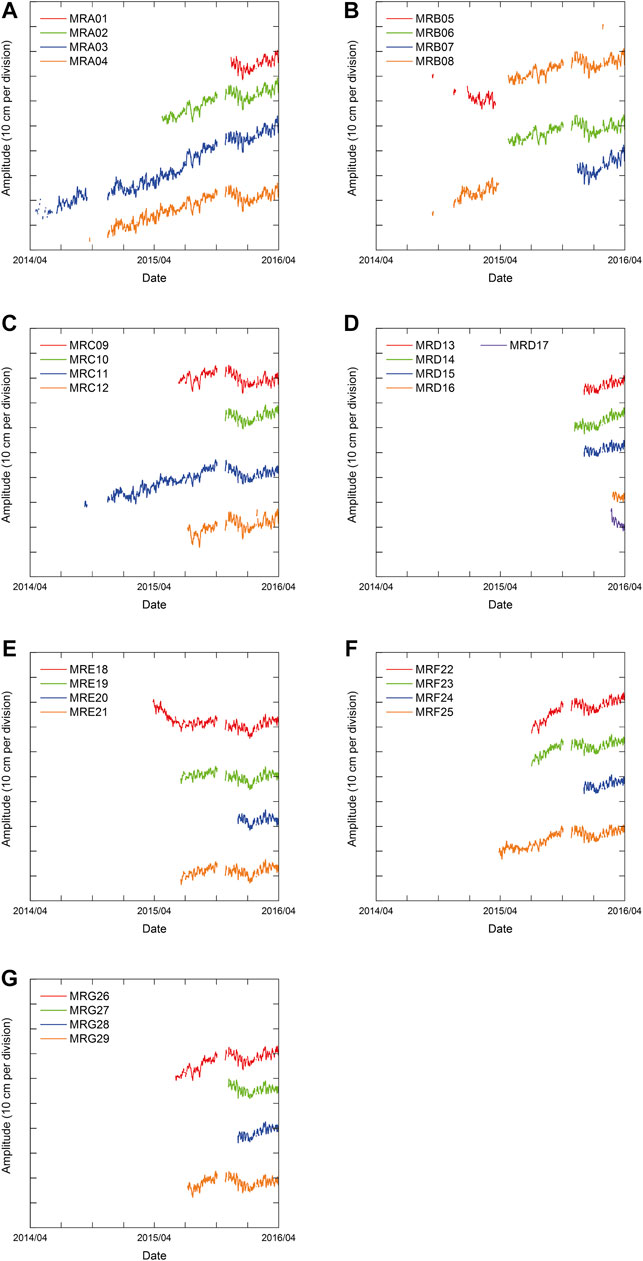
FIGURE 5. (A) Trend component of pressure sensors analyzed by Baytap08 of MRA observatories. Each tick on the vertical axis represents 10 cm water depth change. (B) MRB, (C) MRC, (D) MRD, (E) MRE, (F) MRF, and (G) MRG observatories are presented in the same form as (A).
As for the DONET1 observations shown in Figure 4, more than 5-years pressurization was achieved for many pressure sensors up to April 2016. Large data gaps were observed in some pressure sensors in June 2014 due to the maintenance (replacement) of the science node. Pressure sensors of KME17 through KME20 have been available since March 2015 after the replacement of the science node; however, the baselines of pressure drift have been shifted out of the panel. The other large pressure step (offset) observed at KMA03 in December 2015 is attributed to the replacement of the sensor unit itself. In general, sensor drift is characterized by a monotonic increase, except in an initial response (Polster et al., 2009). Some pressure sensors indicate that the trend changes are identified between the initial and the latter stages. For example, KMA03, which was the first DONET observatory deployed, shows a relatively large negative drift, amounting to a reduction of 20 cm over the 11 months before the first major pressure step. Additional pressure steps were identified in the records of KMA01, KMA02, KMA03, KMD15, and KME17; in each case, the drift rate or the direction changes after the steps. Following their corresponding steps, the trends of KMA01, KMA03, and KMD15 became gentler, whereas the trend of KME17 became negative. The drift of KMC09 and KME20 showed initially negative trends for the first ten months before becoming positive. For all pressure sensors, weak exponential behavior followed by a strong linear trend can be identified. The largest drift is seen at KME18, with a change of approximately 45 cm water depth, over 3.5 years, resulting in an average drift rate of 13 cm of water depth per year. In contrast, a relatively small drift of less than 10 cm of water depth was observed at KMB05, KMB08, and KMD14 over the entire period of in-situ measurement.
As for the DONET2 observations shown in Figure 5, the data acquisition period is relatively short compared to DONET1. The second half of the installation of the main submarine cable of DONET2 was conducted between September and October 2015; all the in-situ data of DONET2 were not available during this period. The first observatory of DONET2 is MRA03, which was installed in March 2014, and the in-situ data are available from April 2014. As such, some interruptions were present at the beginning of the processed data. The overall long-term trend of the DONET2 pressure sensors tended to be in a positive direction. MRA02, MRA03, and MRA04 showed a larger sensor drift rate (approximately 20 cm/year) in the positive direction than the others. MRD16 and MRD17, which were deployed in February 2016, show a negative trend, which is a typical initial response of the Paroscientific Bourdon-tube type pressure sensor. More long-term trends based on the in-situ measurements of DONET2 pressure sensors have been discussed elsewhere (Matsumoto et al., 2018). The long-term trend of DONET pressure sensors varies with time and is comparable to that of other in-situ observations performed with the same type of mechanical pressure sensors (Polster et al., 2009).
The pressure sensors used in DONET specify their hysteresis and repeatability as less than ±0.005% of the full-scale pressure range, corresponding to ±34.5 hPa, which is equivalent to a water depth of ±34.5 cm. However, as there are currently no estimations of their long-term stability, we conducted a long-term pressurization test by designing and implementing a laboratory experiment. Our main objective for this experiment was to determine whether the pressure sensor drift rate can be predicted before deployment, thus quantifying the reproducibility of a sensor’s after-deployment characteristics and understanding how sensor drift can be released by pre-deployment pressurization.
A pressure standard (i.e., a dead weight pressure calibrator) and a temperature-controlled oil chamber were used as the primary laboratory equipment (Figure 6A). This equipment consists of a high-accuracy pressure standard comprising a dead weight and piston gauge (DH Instruments Inc., PG7302), pressure calibrator/controller (DH Instruments Inc., PPCH), and pressure monitor (DH Instruments Inc., RPM4), as well as an additional temperature-controlled oil chamber, where the pressure sensors would be set. A schematic block diagram of the experimental setup is shown in Figure 6B. Static hydraulic pressure can be continuously applied to pressure sensors under a constant temperature that is similar to the environment of the deep-sea. A manifold upon which a maximum of 13 pressure sensors can be mounted is also prepared, allowing the same pressure to be simultaneously applied to all pressure sensors. The output frequencies for both temperature and pressure were measured every 5 s using two frequency counters for each pressure sensor, linked sequentially by a multiplexer. Hence, the sample rate for each pressure sensor was approximately 1 min. This style of continuous pressurization was first examined in 2009, although some operational difficulties were encountered at an early stage (Matsumoto et al., 2018). Hence, we discuss the results examined for 15 pressure sensors to be deployed into the DONET2 observatories in this paper.
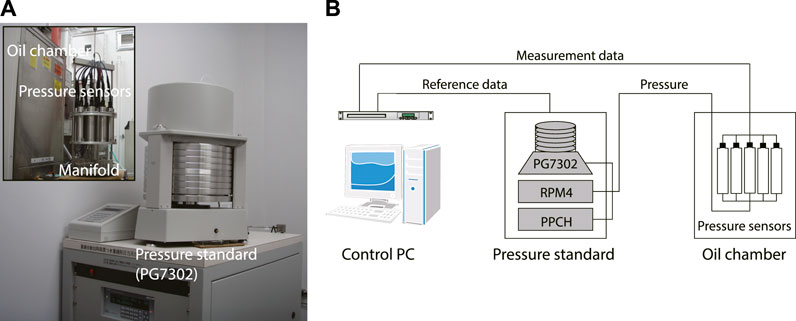
FIGURE 6. (A) Pressure standard and the temperature-controlled oil chamber (inset) used in the present study. (B) Schematic block diagram of the experimental setup.
In the long-term pressurization test, we selected a common configuration of 20 MPa and 2°C for the applied pressure and the oil chamber, respectively, which replicates the deep-sea environment at a water depth of 2,000 m; this is consistent with the typical conditions of the DONET observatories. The duration of static pressure loading was approximately one month (Figure 7). As the sensitivity for barometric pressure is 1 Pa/Pa in all devices, the barometric pressure change is not negligible for long-term measurements. The barometric pressure was measured by the barometer installed on the PG7302 and compensated as the piston gauge’s contribution to the pressure sensor drift.
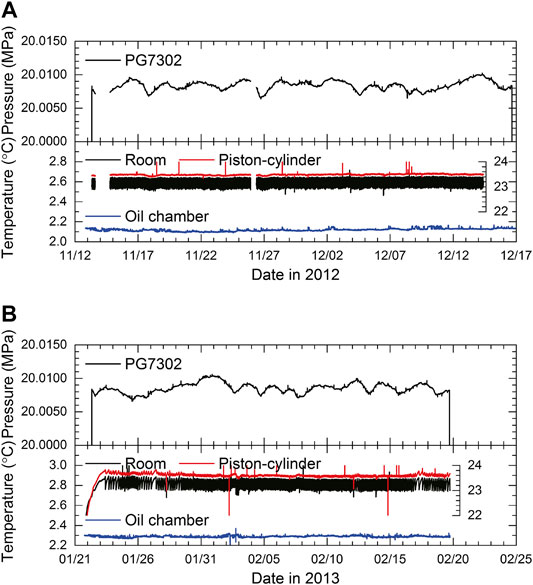
FIGURE 7. (A) Applied pressure and ambient temperatures (a different scale is used for room and piston-cylinder) during the experiment conducted in 2012. (B) The experiment in 2013 is presented in the same form as (A).
Ambient temperature change is one of the most significant factors affecting long-term constant pressurization. The pressurization test was performed under thermal conditions where the variation in the ambient temperature of the pressure sensors, referred to as the temperature-controlled oil chamber, was less than 0.1°C. Although the temperature of the laboratory room is automatically controlled by air conditioners, any change in ambient temperature directly affects the piston-cylinder effective area and the 1/4-inch high-pressure pipe connecting the pressure standard and oil chamber. Ambient temperature fluctuations, measured on the PG7302, were less than 0.5°C during the experimental period (Figure 7). The temperature change of the piston-cylinder inside the PG7302, however, was measured to be less than 0.05°C. The PG7302’s piston-cylinder temperature coefficient is 10 ppm/°C, so an error of 0.1 ppm can be expected. The PG7302 calculates the calibrated pressure value (i.e., the reference pressure) taking into account ambient temperature and humidity, which, respectively, contribute to the effective area of the piston-cylinder and buoyancy of the dead weight.
Two experiments were conducted for 15 pressure sensors in total; the first and second pressurization tests were started in November 2012 and January 2013, respectively. The pressurization durations for the first and second tests were 34 and 29 days, respectively. Five pressure sensors were examined repeatedly to ensure the reproducibility of the sensor drift behavior.
The pressure deviation of each pressure sensor from PG7302 (i.e., the reference pressure) is plotted in Figure 8 for the two pressurization tests. Black dots and red lines respectively represent the measurements and the fitted curves by an equation combining exponential and linear components (Polster et al., 2009).
Here, P is an approximated function regarding the pressure deviation and t is the elapsed time from the pressurization. Coefficient
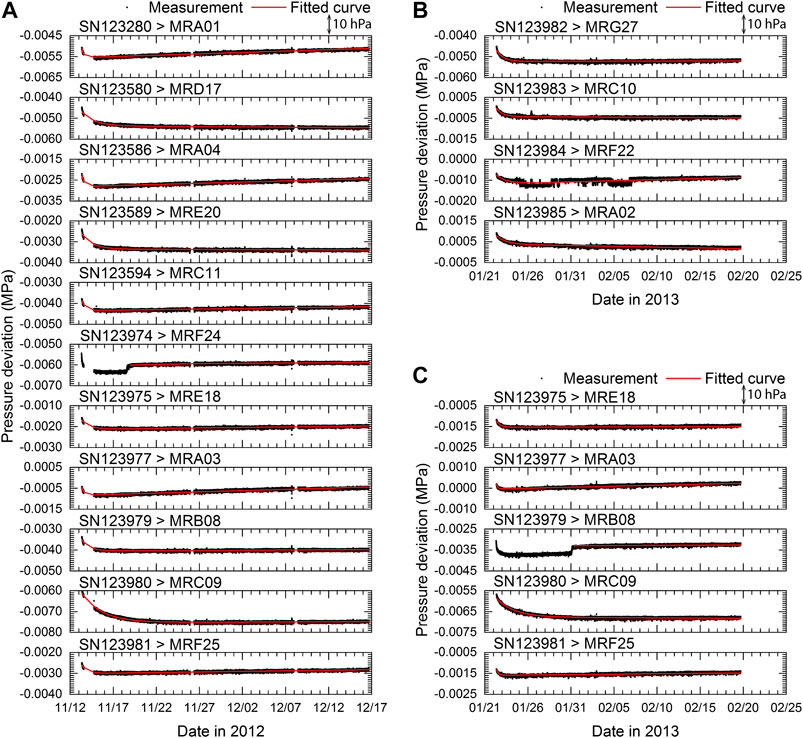
FIGURE 8. Deviation from the pressure standard (i.e., the reference pressure) during the experiment. The serial numbers of a pressure sensor and the observatory names to be deployed into the DONET observatories are shown in each panel. The vertical axis represents the absolute pressure deviation in mega-Pascal. The fitted curves derived from Eq. 1 are also plotted as red lines. Experiments were conducted in (A) November 2012 and (B, C) January 2013. (C) Five pressure sensors were repeatedly pressurized.
In the first test conducted in November 2012, the reference pressure was not available for one day at the early stage of pressurization; however, exponential decay was identified for all pressure sensors. An exponential trend was diminished in a few days, except for one pressure sensor (SN123980), which lasted for more than 10 days. Then, a linear trend follows but the direction of the sensor drift varies. An unexpected pressure step in a few hecto-Pascal with a duration of a few hours was observed in one pressure sensor (SN123974) during pressurization; thus, the fitted function, that is, Eq. 1, begins after disappearance of this effect.
In the second test conducted in January 2013, five pressure sensors, SN123975, SN123977, SN123979, SN123980, and SN123981 were pressurized again for one month. The time gap between the first and the second tests was more than one month, suggesting that the hysteresis effect induced by the first test did not appear in the second test (Kajikawa and Kobata, 2019). Comparing the two pressurization tests, +5 to +10 hPa offsets of pressure deviation from the reference were identified, which might be attributed to the difference in the ambient temperature of the pressure sensors (Figure 7). A pressure step was observed on SN123979; however, this phenomenon was not observed in the first test. The starting time for the evaluation of sensor drift for SN123979 was set after the pressure step. The pressure sensor SN123980 showed a slow exponential decrease in pressure, as was observed in the first test. Although the pressure sensor SN123984 showed some pressure steps in the first half of pressurization, it appeared that this unstable behavior was not observed in the second half of pressurization.
One of the objectives of the present study is to determine whether the sensor drift can be characterized before deployment. The information of some DONET2 observatories and corresponding pressure sensors examined in the present experiments are summarized in Table 1. The in-situ observation of MRA03 is discussed first because MRA03 is not only the first DONET2 observatory but also a repeatedly pressurized sensor in the experiment. The de-tided trend of MRA03 analyzed by Baytap08 is shown in Figure 9, in which the fitted curve derived by Eq. 1 is also plotted. The starting time of the fitted curve is set to as March 16, 2014 (Table 1), although in-situ data are available after April 2014 because of the initial quality control. The pressure deviation increases with time, but the initial exponential trend cannot be recognized. Coefficient

TABLE 1. Information of DONET pressure sensors and installed/connected date to the observatories.
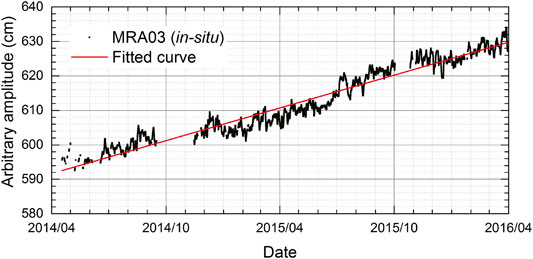
FIGURE 9. In-situ measurement after tidal correction of MRA03. The fitted curve derived from Eq. 1 is plotted as a red line.
Our experiment is relatively short compared to the in-situ measurements. According to previous studies regarding the in-situ measurements of pressure sensors, it is suggested that sensor drift is dominated by a linear trend (Watts and Kontoyiannis, 1990; Polster et al., 2009). Therefore, we focus on the variation of coefficient
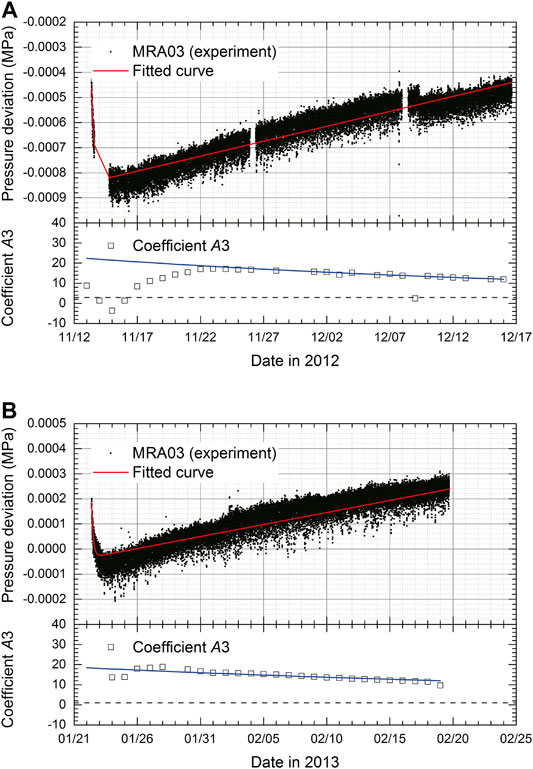
FIGURE 10. (A) Deviation from the pressure standard (reference pressure) of the MRA03 pressure sensor (top) and variation of coefficient
Another instance in which the duration of pressurization is close to that in the experiment is presented. The pressure sensor of MRD17 was installed on February 8, 2016 and connected to the DONET on February 18, 2016 (Table 1), suggesting that the initial behavior can be investigated more than that of MRA03. The variation in the pressure deviation of MRD17 (SN123580) is shown in Figure 11, in the same form as Figure 9. The drift rate (coefficient
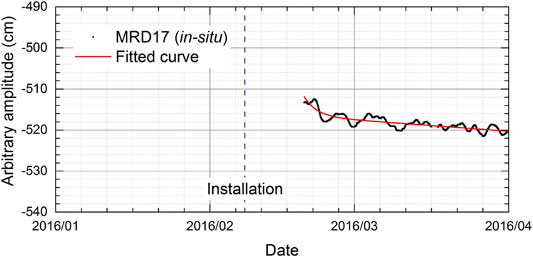
FIGURE 11. In-situ measurement after tidal correction of MRD17. The fitted curve derived from Eq. 1 is plotted as a red line. The installation date of the pressure sensor is indicated by the purple dashed line.
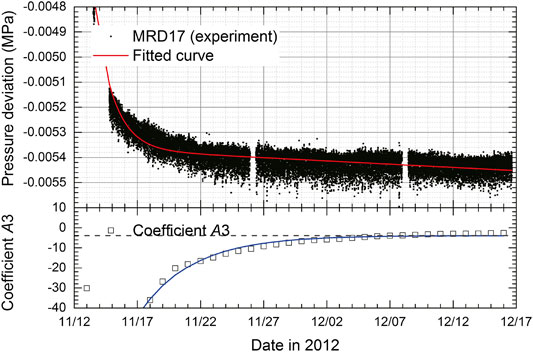
FIGURE 12. Deviation from the pressure standard (reference pressure) of the MRD17 pressure sensor and variation of coefficient
The distribution of drift rate of 15 pressure sensors from the in-situ measurements and the experiments are plotted in Figure 13, in which some significant pressure sensors and repeatedly pressurized sensors are indicated by DONET observatory names. Each plot is classified by different colors according to the deployment depth. Five pressure sensors were examined (pressurized) repeatedly; therefore, in total, 20 datasets were available. Overall, the drift rate of the in-situ measurement can be predicted by the experiment for many pressure sensors. However, the averaged error for all pressure sensors is +0.0036 hPa/day (i.e., +1.32 cm/year) with a ±0.039 hPa/day (i.e., ±14.33 cm/year) standard deviation (SD). Three pressure sensors deployed at MRA02 (SN123985), MRC09 (SN123980), and MRE20 (SN123589) showed different directions of sensor drift between the in-situ measurements and the experiments. The pressure sensors of MRA02 and MRE20 showed a positive drift rate in the in-situ measurement, while the experiment suggested a negative direction. These two pressure sensors did not show a positive linear component drift during the experiment (Figure 8), suggesting that the initial decreasing drift was dominated by the exponential component. On the other hand, the in-situ pressure data examined were for five to seven months after deployment (Table 1); therefore, we might evaluate the sensor drift using the linear component in the in-situ measurement. This is one possible reason why the directions of sensor drift were opposite, and much longer pressurization than one month might result in the positive sensor drift in the experiment, as observed in the in-situ measurement. The pressure sensor of MRC09 may be unique. The in-situ measurement of MRC09 suggests that the drift rate based on the fitted curve is negative, but the drift rate is very small (Figure 5). Two experiments regarding the pressure sensor of MRC09 resulted in different directions of the sensor drift, suggesting that one-month pressurization may not be sufficient for this pressure sensor because the pressure sensor indicated a very long initial exponential trend (Figure 8). This result suggests that pressure sensors may require a longer duration of continuous pressurization to better characterize and explain any differences in the direction of sensor drift between the lab pressurizations and the in-situ measurements to evaluate the true sensor drift rate. This also highlights that the behavior of sensor drift is unique to individual sensors.
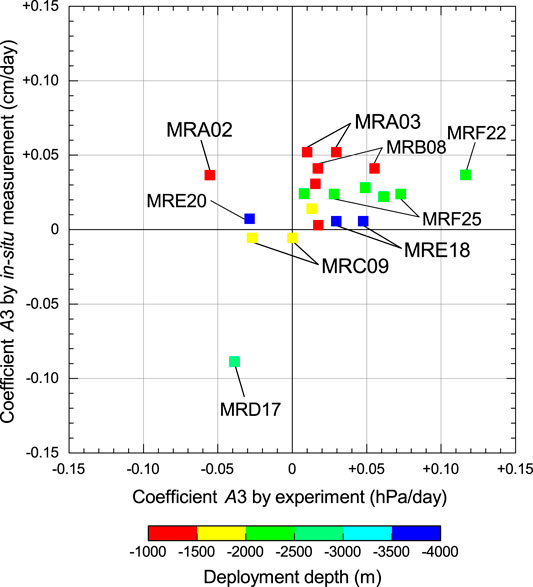
FIGURE 13. Sensor drift rate from the in-situ measurements plotted against values from the experiments. Observatory names are indicated for some significant results and repeatedly examined sensors. Colors represent the deployment depth of each sensor.
The experiments of two pressure sensors are over- and under-estimated; MRF22 (SN123984) shows a large drift rate compared to the in-situ measurement. On the other hand, MRD17 (SN123580) shows a small drift rate compared to the in-situ measurement, although the directions of the sensor drift correspond to the in-situ and the experimental measurements. Both pressure sensors yielded a linear trend virtually in the experiment. As such, we cannot explain the reason for observation of large discrepancies in drift rates, although the difference in the pressurization period may be a primary cause.
The pressure sensors showing relatively large drift rates were deployed at depths shallower than 1,500 m, although the period of data analyzed was different for each station and the number of pressure sensors analyzed was only 15, making statistical interpretations difficult. All plots of five pressure sensors deployed between 2,000 and 2,500 m are distributed in the middle drift rate range, particularly after deployment; however, these sensor drift rates that are pressurized by the equivalent pressure of deployment depth do not always correlate with the experimental drift rates. Our laboratory experiment can predict the sensor drift rate within a certain range but the quantitative prediction of drift rate has not yet been achieved; perhaps, this is due to the short pressurization period.
The present study provides insights into the interpretation of observations from DONET pressure sensors, from the point of view of crustal deformation monitoring. The contribution of the inter-plate coupling to the vertical crustal deformation superposing the in-situ pressure measurements is expected to be less than 1 cm/year (i.e., approximately 0.003 cm/day) around the Nankai Trough based on on-land GNSS measurements (Sagiya et al., 2000). Thus, the pressure sensors employed in the DONET are capable of detecting such small pressure changes sufficiently with respect to the sensor resolution. On the other hand, the in-situ measurement indicates that the sensor drift is dominant over these timescales, ranging from a few to a few tens of centimeters per year. Our laboratory experiment also supports that sensor drift cannot be negligible if pressure sensors are used for the long-term monitoring of crustal deformation. According to Figure 13, the errors in the drift rate derived from the experiments of the repeatedly pressurized sensors vary from 0.018 (MRE18) to 0.045 hPa/day (MRF25), suggesting that uncertainties of our drift rate estimation based on the experiments are 6–16 hPa/year. These uncertainties exceed the expected vertical crustal deformation in the Nankai Trough.
One of the difficulties in sensor drift correction is that the drift varies from sensor to sensor. For example, the sensor drift behavior is dominated by an exponential trend followed by a linear trend commonly; however, its transition timeline is not identical between the pressure sensors. We conducted the pressurization test repeatedly for some pressure sensors, noting that the pressure sensors readings are repeatable for the sensor’s specifications (Figure 8). This suggests that the present experiment may help to predict the duration of the exponential trend after deployment in the deep-sea. If the observation period is limited by pressure sensors, for example, a pop-up (campaign)-type pressure observation system, this procedure is useful for selecting pressure sensors in which an exponential trend diminishes early following deployment and pressurization.
Some of the DONET pressure sensors recorded unexpected pressure steps with offsets of more than a few tens of centimeters in their long-term operation (Figure 4). Changes in the direction and rate of sensor drift were identified at the pressure steps. We did not observe apparent pressure steps (offsets >10 cm) causing significant drift rate and direction changes in the experiments, as observed in the DONET1 pressure sensors after the deployment. On the other hand, small pressure steps (offsets <1 hPa) were identified, which did not appear to affect sensor drift behavior. The mechanism of pressure steps may be different between the experimental and in-situ measurements. We could not constrain the origin of the pressure steps because it is difficult to predict when this unexpected phenomenon occurs even in laboratory experiments. We do not anticipate such pressure steps (offsets) in the evaluation of sensor drift rate; in other words, our approach can be applied to pressure sensors showing a monotonic drift only to a certain degree.
As for the direction of sensor drift, our study shows that 18 of 20 dataset sensors correspond to each other. As the total number of examined pressure sensors is limited (15 sensors), a statistical investigation may be difficult; further, the direction of sensor drift can be predicted by the pre-pressurization. As mentioned earlier, the outliers (i.e., pressure sensors of MRA02 and MRE20) from the predictions are interpreted by the difference between the analytical time windows after pressurization, suggesting that an appropriate pressurization period should be sought. However, it is acknowledged that the comparison of the drift rate between the experimental and in-situ measurements do not always show adequate correlations with each other. One possible reason for this is attributed to the difference in the pressurization period. The duration of pressurization in the experiment is 1 month, suggesting that it is too short to evaluate long-term sensor drift over a year. As errors in the drift rate between the experimental and the in-situ measurements are larger than the expected crustal deformation, the experimental results cannot be applied to correct the sensor drift directly. Further investigation is needed to calibrate the DONET pressure sensor using the current experimental results. Alternatively, our team has developed a mobile pressure calibrator (i.e., a campaign-type pressure calibration system) carrying the pre-calibrated pressure to the seafloor by an ROV and using this to calibrate the in-situ pressure sensors, which may improve our ability to evaluate smaller crustal deformation signals (Machida et al., 2020).
Accurate measurement of crustal deformation is crucial for monitoring active submarine volcanoes because it allows us to detect eruption-related magma movement. Sensor drift correction of the in-situ pressure measurements contributed to predicting an episodic series of submarine volcanic eruptions of the axial seamount over time (Nooner and Chadwick, 2016). During the eruption series of the Axial Seamount, continuous 60-cm uplift was detected by self-calibrated pressure recorders for a period of 17 months in 2013 through 2015 (Sasagawa et al., 2016). Our approach to estimating the drift rate before deployment may be applicable to such large deformations (>a few tens of centimeters per year) effectively. ROV operation is usually required for the campaign-style in-situ calibration; however, active submarine volcanoes sometimes prevent ROV from accessing spots of interest; consequently, in-situ calibration operation cannot be performed. We have assessed some pressure sensors using the present procedure before assembling the campaign-type pressure observation system to be deployed near Izu-Oshima Island, an active volcanic island of Japan, to detect seafloor deformation induced by the magma movement. The results of this experiment and related surveys will be reported in the future.
In the 2010s, 51 pressure sensors were deployed into the deep-sea, at depths between 1,300 and 4,500 m, to form part of the DONET observatories. The present study focuses on the sensor drift of the DONET pressure sensors during the initial period operated by JAMSTEC.
We obtained the in-situ measurement dataset from DONET for a period of up to 6 years. The in-situ data were processed to remove the tidal component. Although the seasonal sea surface changes, local current effects and other unpredictable aperiodic fluctuations are represented in the tidally-corrected data, and the sensor drift of pressure sensors is determined. Considering the long-term characteristics, sensor drift continued after deployment, even after similar pressurization for 1 month before deployment. Assuming that the initial behavior of sensor drift is dominated by an exponential trend, we fitted the sensor drift to a combination of exponential and linear functions over time.
We conducted a laboratory experiment, wherein continuous pressurization of 20 MPa was applied for 1 month at an ambient temperature of 2°C, to the pressure sensors to be deployed into the deep-sea. Comparing the sensor drift from the experiment with the in-situ measurements, it was found that they correlate with each other in terms of the rate and direction of drift. For some pressure sensors, however, the experimental sensor drift was found to be in the opposite direction to that derived from the in-situ measurements. This may be attributed to the comparatively short pressurization time of the pressure sensor considering a longer than normal exponential decay for some sensors. It is suggested that according to the drift rate, the present experiment overestimated +1.32 ± 14.33 cm/year standard deviation (SD). We conclude that continuous pressurization should be applied until the first appearance of the transition between an exponential and a linear trend to evaluate the drift rate of pressure sensors in the laboratory because a linear trend is typically used to determine the long-term sensor drift.
Our experiment indicates that there remain uncertainties in our approach toward prediction by pre-pressurization for correction of sensor drift of in-situ measurements. Recently, a new procedure for estimating sensor drift by means of an in-situ calibration has been proposed (Sasagawa and Zumberge, 2013; Machida et al., 2019). These methods recommend that calibrated pressure obtained at the seafloor be used to correct sensor drift. In any situation, some calibration of the in-situ pressure sensors, such as the self-calibration technique or an in-situ reference pressure sensor, is required to correct sensor drift, which may be difficult to distinguish from crustal deformation.
The original contributions presented in the study are included in the article/Supplementary Material, further inquiries can be directed to the corresponding author.
HM is the main author of the manuscript. HM and EA are the main contributors to the data processing and analysis.
This work was partially supported by the Japan Society for the Promotion of Science (JSPS), Grant-in-Aid for Scientific Research (KAKENHI), JP19H02411.
The authors declare that the research was conducted in the absence of any commercial or financial relationships that could be construed as a potential conflict of interest.
The handling editor declared a past co-authorship with one of the authors EA.
DONET has been developed and constructed as a project supported by the Ministry of Education, Culture, Sports, Science and Technology (MEXT) in Japan. We are grateful to LW and two reviewers, whose comments allowed us to improve the quality of the manuscript. Technical support and discussions with Tetsuya Ishizuka and Masaki Kobayashi were helpful for the development of the laboratory experiment.
Ariyoshi, K., Nakata, R., Matsuzawa, T., Hino, R., Hori, T., Hasegawa, A., et al. (2014). The detectability of shallow slow earthquakes by the Dense Oceanfloor Network system for Earthquakes and Tsunamis (DONET) in Tonankai district, Japan. Mar. Geophys. Res. 35, 295–310. doi:10.1007/s11001-013-9192-6
Chiswell, S. M., and Lukas, R. (1989). The low-frequency drift of Paroscientific pressure transducers. J. Atmos. Ocean. Technol. 6, 389–395. doi:10.1175/1520-0426(1989)006<0389:TLFDOP>2.0.CO;2
Eble, M. C., and González, F. I. (1991). Deep-ocean bottom pressure measurements in the northern Pacific. J. Atmos. Ocean. Technol. 8, 221–233. doi:10.1175/1520-0426(1991)008<0221:DOBPMI>2
Fujimoto, H., Mochizuki, M., Mitsuzawa, K., Tamaki, T., and Sato, T. (2003). Ocean bottom pressure variations in the southeastern Pacific following the 1997-98 El Nino event. Geophys. Res. Lett. 30, 1456. doi:10.1029/2002GL016677
Kajikawa, H., and Kobata, T. (2019). Evaluation and correction for long-term drift of hydraulic pressure gauges monitoring stable and constant pressures. Measurement 134, 33–39. doi:10.1016/j.measurement.2018.10.051
Kaneda, Y., Kawaguchi, K., Araki, E., Matsumoto, H., Nakamura, T., Kamiya, S., et al. (2015). “Development and application of an advanced ocean floor network system for megathrust earthquakes and tsunamis,” in Seafloor observatories. (Berlin, Heidelberg, Germany: Springer), 643–662. doi:10.1007/978-3-642-11374-1_25
Kawaguchi, K., Kaneko, S., Nishida, T., and Komine, T. (2015). “Construction of the DONET real-time seafloor observatory for earthquakes and tsunami monitoring,” in Seafloor observatories. (Berlin, Heidelberg, Germany: Springer), 221–228. doi:10.1007/978-3-642-11374-1_10
Kobata, T. (2005). Characterization of quartz Bourdon-type high-pressure transducers. Metrologia 42, S235–S238. doi:10.1088/0026-1394/42/6/S20
Machida, Y., Araki, E., Nishida, S., Kimura, T., and Matsumoto, H. (2019). On the accuracy of quartz pressure sensor in the seafloor affected by transport condition. IEEE J. Ocean. Eng. 44, 1049–1057. doi:10.1109/JOE.2018.2855478
Machida, Y., Nishida, S., Kimura, T., and Araki, E. (2020). Mobile pressure calibrator for the development of submarine geodetic monitoring systems. J. Geophys. Res. Solid Earth 125, e2020JB020284. doi:10.1029/2020JB020284
Matsumoto, H., Araki, E., and Kawaguchi, K. (2018). Experimental evaluation of initial characteristics of DONET pressure sensors. Mar. Technol. Soc. J. 52 (3), 109–119. doi:10.4031/MTSJ.52.3.3
Nagano, A., Hasegawa, T., Matsumoto, H., and Ariyoshi, K. (2018). Bottom pressure change associated with the 2004-2005 large meander of the Kuroshio south of Japan. Ocean Dynam. 68, 847–865. doi:10.1007/s10236-018-1169-1
Nooner, S. L., and Chadwick, W. W. (2016). Inflation-predictable behavior and co-eruption deformation at axial seamount. Science 354, 1399–1403. doi:10.1126/science.aah4666
Paros, J. M., and Kobayashi, T. (2016). Root causes of quartz sensor drift. Proscientific, Inc., Technical Note Doc. No. G8101, Rev. A.
Polster, A., Fabian, M., and Villinger, H. (2009). Effective resolution and drift of paroscientific pressure sensors derived from long-term seafloor measurements. Geochem. Geophys. Geosyst. 10, Q08008. doi:10.1029/2009GC002532
Sagiya, T., Miyazaki, S., and Tada, T. (2000). Continuous GPS array and present-day crustal deformation of Japan. Pure Appl. Geophys. 157, 2302–2322. doi:10.1007/PL00022507
Sasagawa, G., Cook, M. J., and Zumberge, M. A. (2016). Drift-corrected seafloor pressure observations of vertical deformation at Axial seamount 2013-2014. Earth Space Sci. 3, 381–385. doi:10.1002/2016EA000190
Sasagawa, G., and Zumberge, M. A. (2013). A self-calibrating pressure recorder for detecting seafloor hight change. IEEE J. Ocean. Eng. 38, 447–454. doi:10.1109/JOE.2012.2233312
Takahashi, N., Imai, K., Ishibashi, M., Sueki, K., Obayashi, R., Tanabe, T., et al. (2017). Real-time tsunami prediction system using DONET. J. Disaster Res. 12, 766–774. doi:10.20965/jdr.2017.p0766
Tamura, Y., Sato, T., Ooe, M., and Ishiguro, M. (1991). A procedure for tidal analysis with a Bayesian information criterion. Geophys. J. Int. 104, 507–516. doi:10.1111/j.1365-246X.1991.tb05697.x
UNESCO (1983). Algorithms for computation of fundamental properties of seawater. UNESCO, UNESCO Technical Papers in Marine Sciences 44, 54.
Watts, D. R., and Kontoyiannis, H. (1990). Deep-ocean bottom pressure measurement: drift removal and performance. J. Atmos. Ocean. Technol. 7, 296–306. doi:10.1175/1520-0426(1990)007<0296:DOBPMD>2.0.CO;2
Keywords: DONET, pressure sensor, sensor drift, in-situ measurement, experiment, pressure standard
Citation: Matsumoto H and Araki E (2021) Drift Characteristics of DONET Pressure Sensors Determined From In-Situ and Experimental Measurements. Front. Earth Sci. 8:600966. doi: 10.3389/feart.2020.600966
Received: 31 August 2020; Accepted: 16 November 2020;
Published: 12 January 2021.
Edited by:
Laura Wallace, University of Texas at Austin, United StatesReviewed by:
Katherine Woods, Victoria University of Wellington, New ZealandCopyright © 2021 Matsumoto and Araki. This is an open-access article distributed under the terms of the Creative Commons Attribution License (CC BY). The use, distribution or reproduction in other forums is permitted, provided the original author(s) and the copyright owner(s) are credited and that the original publication in this journal is cited, in accordance with accepted academic practice. No use, distribution or reproduction is permitted which does not comply with these terms.
*Correspondence: Hiroyuki Matsumoto, aG1hdHN1bW90b0BqYW1zdGVjLmdvLmpw
Disclaimer: All claims expressed in this article are solely those of the authors and do not necessarily represent those of their affiliated organizations, or those of the publisher, the editors and the reviewers. Any product that may be evaluated in this article or claim that may be made by its manufacturer is not guaranteed or endorsed by the publisher.
Research integrity at Frontiers
Learn more about the work of our research integrity team to safeguard the quality of each article we publish.