- 1Earthquake Research Institute, The University of Tokyo, Tokyo, Japan
- 2Research Institute for Marine Geodynamics, Japan Agency for Marine-Earth Science and Technology, Yokosuka, Japan
- 3Kobe Ocean-Bottom Exploration Center, Kobe University, Kobe, Japan
- 4Graduate School of Science, Chiba University, Chiba, Japan
We have developed a broadband ocean bottom seismometer (BBOBS) and its new generation (BBOBS-NX) with the penetrator sensor system since 1999. With them, we performed many practical observations to create a new research category of ocean bottom broadband seismology. As the next step in seafloor geophysical observation, the BBOBS and the BBOBS-NX can be a breakthrough in realizing a geodetic observation network on the seafloor. Although vertical displacement observation by the absolute pressure gauge has been widely conducted in recent years, other geodetic observations are rarely performed. A few trials to measure the seafloor tilt were performed, but those looked inadequate for practical observations. Note that the broadband sensor in our BBOBSs has a mass position signal output, which can be used to measure the tilt change. As the horizontal component noise level of the BBOBS-NX is good at a long period range, we expected it to be adequate for the tilt measurement. At the first evaluation, we performed a comparison with a water-tube tiltmeter. The result was comparable with a resolution of better than 1 µ radian. A practical observation at the south of Boso Peninsula (KAP3 site) was conducted as the in-situ study from April, 2013. In January, 2014, a slow slip event (SSE) occurred near this site. The tilt data were processed by removing steps, mechanical relaxation, and tides. The results show a clear peak started from late December 2013. Two more 2 year-long tilt observations began in 2015: one was at the KAP3 site and another was off the Miyagi Prefecture at the slope to the Japan Trench. The latter was recovered in 2017 with about 1.5 years of data, which indicate a large continuous tilt up to several tens of µ radian. This amount of tilt can be explained by a similar already estimated SSE. Mobile tilt measurement at the seafloor can be a powerful tool to study SSEs, as they can be located above the source area and also possible to build an observation array for a practical study because of its low cost and ease of deployment compared with a seafloor borehole site.
Introduction
To understand the Earth from a geophysical point of view, observations on the seafloor are very important due to the fact that the seafloor encompasses a large percentage of the Earth’s surface, as well as several phenomena in the oceanic area, such as seafloor spreading at the oceanic ridge and oceanic slab subduction at the trench, which cause earthquakes and magma source production by water and chemical cycling. Slow slip events (SSEs) have been found from land networks (e.g., Hirose et al., 1999; Obara, 2002), which are also key to understanding usual earthquakes (Ide et al., 2007). Most SSE sources are beneath the land area, but some shallow SSEs occur between the trench and the coast, below the seafloor (e.g. Sugioka et al., 2012; Ozawa, 2014).
Several kinds of geophysical observations at the seafloor have been attempted since the 1960s. After the 1990s, seismic studies using ocean bottom seismometers (OBS) became common for temporal observations (Shinohara et al., 2012), as well as those using a cable system for real-time monitoring (e.g. Kaneda et al., 2015). For researchers in this field, it is natural to try to expand the observation coverage in many aspects and also to adopt the same kind of observations performed on the land, for a better understanding of the natural phenomena through seafloor observations. A broadband seismic observation at the seafloor was attempted by Suyehiro et al. (1995), and it has already become a common tool in several countries as the broadband ocean bottom seismometer (BBOBS), which is explained in Suetsugu and Shiobara (2014). With the BBOBS, shallow very low frequency seismic activity near the trench was revealed clearly by Sugioka et al. (2012), and a non-volcanic SSE was recently found around the ridge off Chile (Sáez et al., 2019) by Japanese OBS array data.
To achieve more coverage in longer, geodetic periods, as shown in this special issue, the GNSS (GPS)/Acoustic method has become a common tool to measure horizontal displacements at the seafloor after the success by Spiess et al. (1998). In addition, absolute pressure observation to measure the vertical displacement of the seafloor (e.g. Hino et al., 2009; Ito et al., 2013) has been widely performed with several technical improvements (e.g. Kajikawa and Kobota, 2014). However, other geodetic observation methods at the seafloor have not become common yet.
Tilt observation at the seafloor has been tried since the 1980s in an effort to investigate the ridge center volcanism or subduction dynamics. Sakata and Shimada (1984) developed an ocean bottom tiltmeter (OBT) that was tested in shallow water in offshore Japan, as it was of an on-line cabled type. Shimamura and Kanazawa (1988) seemed the first off-line OBT observation. Two OBTs were deployed at the top of the Erimo seamount (3,930 m depth) in the Kuril Trench using the manned French submersible vessel, Nautile. This OBT system was considered well, but was designed with too advanced specifications as there was no precise positioning system (such as GPS) at that time, which was important for data recovery by the acoustic link within a short distance. Other OBT developments were of the free-fall and self pop-up type (Tolstoy et al., 1998; Sato and Kasahara, 1999). Another type of OBT, a long-baseline OBT (LBT), was also tried at the Juan de Fuca ridge by Anderson et al. (1997). In the same project, several short-baseline OBTs (Tolstoy et al., 1998) were also used, which were based on Scripp’s OBS with a bubble tilt sensor (Westphal et al., 1983). The LBT had a length of 100 m, which was deployed with the dynamic deployment technique by Webb et al. (1985), like a deep-tow system, not by using a remotely operated vehicle (ROV). Fabian and Villinger (2007, 2008) made the first long-term tilt observation with their original OBT which was operated with a ROV at the Mid-Atlantic Ridge. Although those OBTs were designed to be deployed on the seafloor, there were some tilt observations in seafloor boreholes even in the 1980s, when the geophone was used as a seismic sensor. Duennebier et al. (1987) obtained continuous tilt data in a seafloor borehole in the northwestern Pacific for 64 days. Sacks et al. (2000) deployed two seafloor borehole geophysical observatories on the deep-sea terrace of the Japan Trench, and the data obtained were examined by Araki et al. (2004). Those were stand-alone systems, but recently, an online borehole observatory with a tilt sensor near the Nankai Trough has begun operation (Araki, 2017).
This paper introduces our new approach of the simultaneous broadband seismic and tilt observation by Japanese BBOBSs, not only regarding the instrumentation, but also offering some results of the feasibility long-term observations at the landside slope of the Japan Trench.
Materials and Methods
Base of the Instrumentation
Broadband Ocean Bottom Seismometer
The BBOBS in Japan has been developed since 1999 (e.g. Suetsugu and Shiobara, 2014). This BBOBS (Figure 1) contains all necessary components in its titanium alloy sphere housing of 650 mm in diameter, which was designed as a free-fall and self pop-up type. The CMG-3T of 360 s (Guralp systems, United Kingdom) was chosen as the broadband sensor with special orders for its weight and power consumption. This sensor was installed on our original leveling unit to keep it in level within ±0.2°, during the observation. During more than 170 deployments of the BBOBS, we obtained noise models (Incorporated Research Institutions for Seismology (IRIS), 1994) that show the averaged noise spectrum without known earthquakes in short, for almost all sites. An example is shown in Figure 2A, with the new high noise model (NHNM) and the new low noise model (NLNM) by Peterson (1993). Because of the low gravity center and the rigid connection between the sphere housing and the anchor, the noise level of the vertical component (Z) is between the NHNM and the NLNM, which means it is comparable to land seismic sites. However, those of the horizontal components (H1 and H2) are around or above the NHNM, due to the effect of the bottom current with the housing above the seafloor. Even with this situation, the lowest noise level of the horizontal component would be near the NLNM (Figure 2B), probably when the bottom current is weak.
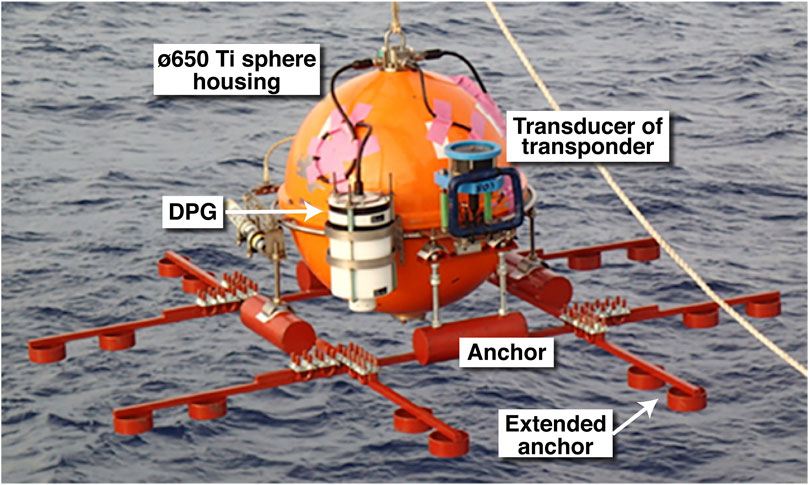
FIGURE 1. Japanese broadband ocean bottom seismometer (BBOBS). The most recent design of the Japanese BBOBS originally developed in 1999. The broadband sensor inside is the CMG-3T (360 s) mounted on the original leveling system. The anchor base size was 1 m × 1 m. To achieve more stable coupling to the sediment, the “extended anchor” is attached to a 2 m × 2 m base. The DPG (differential pressure gauge) is now standard equipment. The maximum observation period is now 2 years, and it can be deployed at up to 6,000 m.
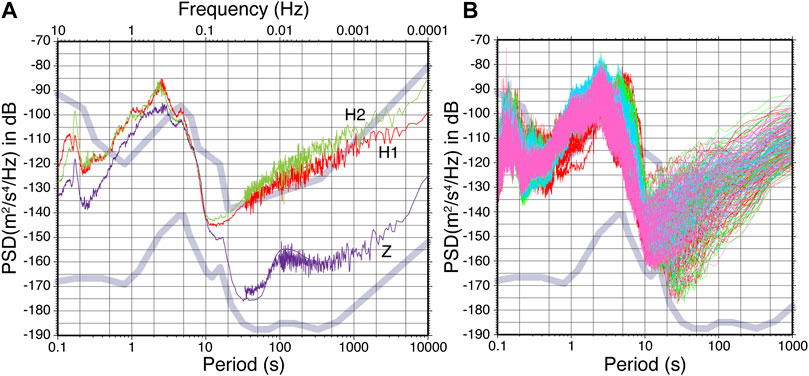
FIGURE 2. Noise model of the BBOBS. (A) One example of the noise model (NM) of the BBOBS using the IRIS standard procedure, which indicates the observation performance of the site including the instrument. The vertical component NM (Z) is usually between the NHNM and the NLNM (thick curves), but horizontal ones (H1 and H2) are around or above the NHNM in the long period range, more than 30 s. (B) Stack of the noise spectra used to calculate the H1 component NM in Figure 2A. Colors indicate four seasons: cyan (January-March), pink (April-June), red (July-September), and green (October-December). Although the H1’s NM is high, the lowest noise level could be near the NLNM in a 10–30 s period.
New Generation BBOBS With a Penetrator Sensor
To improve the noise level of the horizontal components, a burial sensor system seems effective as land seismic stations and at the seafloor, which was well demonstrated in Collins et al. (2001). We started the development of a BBOBS with a penetrator sensor unit in 2003, based on an original CMG-3T equivalent broadband sensor and our BBOBS system. The first-generation system, BBOBS-NX, was used at an in-situ test in 2009, which was operated by a ROV (Shiobara et al., 2013). The broadband sensor is separated into three component units without the leveling mechanism to minimize the height and diameter of the pressure case for each component, which makes it easier to penetrate into the sediment layer using gravity (Figures 3A,B). The noise model of the test showed more than 20 dB of noise reduction in the horizontal components (Figure 3C). This effect was obvious in more than 10 s periods, which reflects the fact that a smaller part of the sensor was exposed to the bottom current (Shiobara et al., 2013).
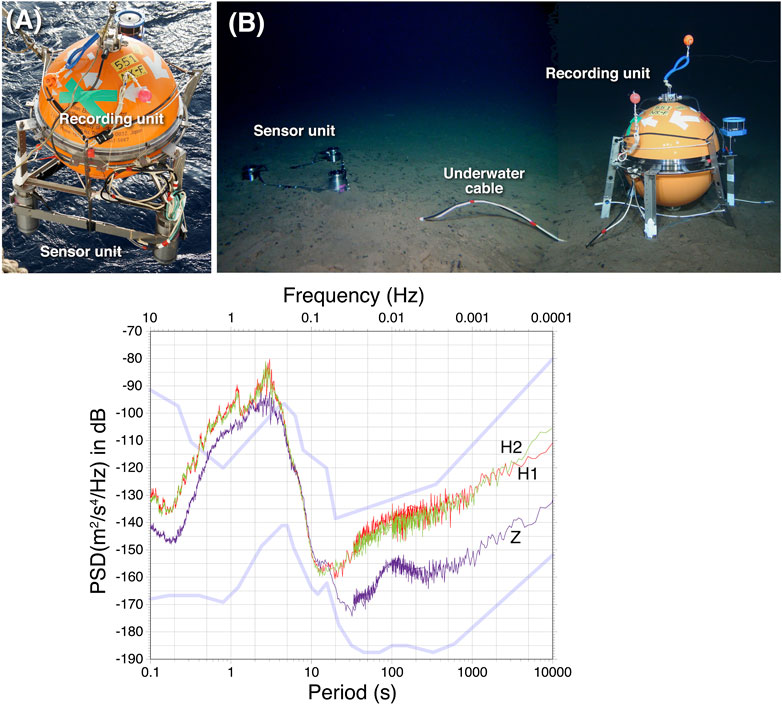
FIGURE 3. The BBOBS-NX. The BBOBS with the penetrator sensor system using gravity. ROV operation is required in deployment and recovery. The broadband sensor has the same performance of the BBOBS. (A) The sensor unit and the recording unit are temporally attached, and free-fallen from the sea surface. Descending speed is about 1.5 m/s. (B) They are detached and the recording unit is moved a few meters away from the sensor unit by the ROV. The observation period can be more than 2 years. (C) An NM example of the BBOBS-NX. Because of the penetration of the sensor unit, all three component NMs are between the NHNM and the NLNM.
The advantage of the penetrator sensor system is apparent, but the necessity of a ROV limits the opportunity of observations because of availability and cost issues. If the data quality of the BBOBS-NX was obtained with a high-mobility operation like our BBOBS, it would be a breakthrough in the broadband seismology at the seafloor. This second-generation system, NX-2G, is now in its final evaluation stage (Shiobara et al., 2019). As shown in Figure 4, it is almost based on the BBOBS-NX, and functions of the NX-2G’s operation were tested on the deep seafloor in 2017 and 2018.
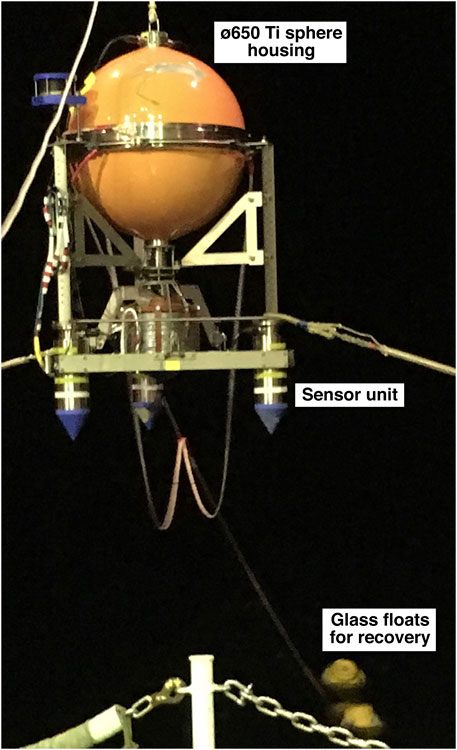
FIGURE 4. The NX-2G, autonomous type of the BBOBS-NX. To achieve the same performance of the BBOBS-NX without aid of submersibles, the autonomous type is in the final feasibility test.
Method for Simultaneous Broadband Seismic and Tilt Measurement
The broadband sensor equipped in the BBOBS and the BBOBS-NX has a mass position signal output, which are the low-pass filtered (cut-off at 360 s of the eigen period) acceleration data, which can be used to measure the tilt change in time after the mass centering (and the mass unlocking) operation from the two horizontal components data. This is because these mass position signals indicate the fraction of the gravitational acceleration according to the tilt change of the BBOBS or the sensor unit of the BBOBS-NX at the seafloor. As the horizontal component noise level of the BBOBS-NX is more than 10 times better than the BBOBS in a long period range (more than 10 s), and because the penetrator sensor system has good coupling to the sediment layer and is influenced less by bottom currents, we expected the BBOBS-NX to be adequate for tilt measurement. Here, we refer to the BBOBS-NX with the tilt measurement function as the BBOBST-NX. This additional tilt measurement requires a small modification in the system (new wiring and two more input channels of the data recorder). Even for the BBOBS deployed on the seafloor, this tilt measurement is possible with a limitation of the noise level, which relates with conditions of the site, such as the bottom current.
The largest advantage of the tilt observation at the seafloor by the BBOBST-NX (or the BBOBS) exists at the location above or close to the source area of the event with a short horizontal distance. Because tilt is a spatial differentiate of vertical displacement, we can expect large tilt change around the source area. In addition, with these mobile observation instruments, it is possible to build a dense array to cover the target area, because of its low cost and ease of deployment compared with a seafloor borehole site.
Results
Test at the Land Vault
As the first evaluation test of this method, we performed a comparison test in 2010 between the sensor unit of the BBOBST-NX and the water-tube tiltmeter (WTT) at the land vault (at Nokogiri-yama, Chiba Prefecture) near Tokyo Bay (Ishii et al., 1992), about 600 m from the shore. The tilt data were resampled in 1 min intervals at first to match with the WTT data, and were high-pass-filtered with 100,000 s of the cut-off period to remove longer fluctuations than those of 1-day length. The result (Figure 5) shows tilt changes comparable to that of the WTT with a resolution of better than 1 µ radian, which shows clear signals by tides. Our sensor was placed inside the seismometer room in the vault, but several tests were ongoing simultaneously with some human operation (performed on May 6 and 9) during our test. As the WTT is located in the tunnel of the same vault separated by two doors from the seismometer room, no human noise was recognized. One problem was a large drift (a few µ radian per day) in the raw tilt data, which is the same as that often seen in our BBOBS as several automatic mass centering operations occurred soon after the deployment lasting for a few weeks. Usually, this kind of drift in our BBOBS becomes smaller, and only a few times of the mass centering operation were observed during the 1 year-long observation period after 1 month of the mass unlocking operation of the broadband sensor. Thus, it was necessary to investigate the mass position stability of the broadband sensor at the seafloor environment in terms of whether it is adequate for tilt measurement.
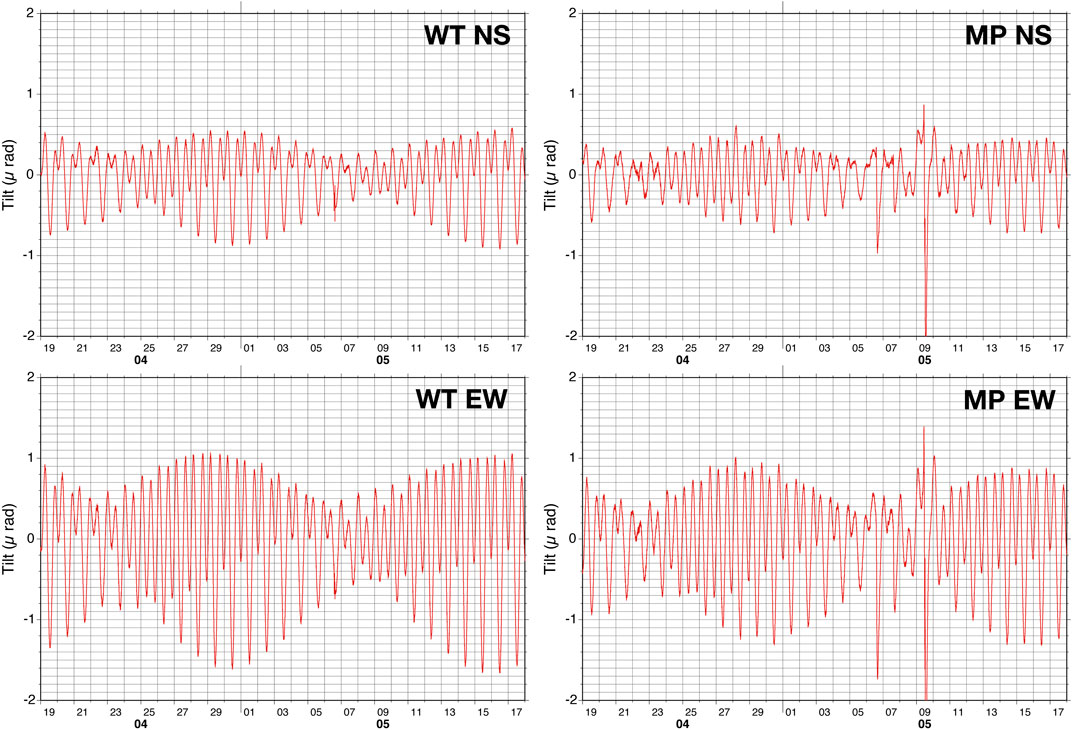
FIGURE 5. The land vault test of this method. A 2 month test of the broadband sensor for the BBOBST-NX (MP) compared with the water tube tilt-meter (WT) in the same vault. The two large disturbances on May 6 and 9 were due to other human works in the same seismometer room that we used.
Here, it is worth mentioning the difference of mass centering function of the broadband sensor used in the BBOBS and the BBOBS-NX. The CMG-3T in the BBOBS has a fixed threshold level to start the mass centering at about 10% to the full-scale (FS), when the mass centering command is received by the sensor’s controller. But the original broadband sensor for the BBOBS-NX, based on the borehole type of the CMG-3T, has a user definable threshold level (0–100% FS) by a command. Therefore, we can set a large value (such as 50%) to expect continuous mass position (tilt) change with a trade-off of an adequate operation condition as the seismic sensor because, as mentioned above, it is better to keep a small mass position value like that of the BBOBS.
First Test Observation at the Seafloor
Before the application of the BBOBST-NX for a practical observation, such as SSE monitoring, we performed a test to measure the resolution and instrumental noise level in this tilt observation at an empirically known quiet site (T08) that was previously used for tests of the BBOBS-NX, at the Shikoku Basin (4,930 m depth) of the Philippine Sea Plate (Figure 6A), in 2012–2013 for about 2 months. As this test also aimed to undertake preparation experiments of the NX-2G development, the large Ti sphere housing (recording unit) and the gray colored tube were located close to the sensor unit (Figure 6B), unlike in Figure 3B. This was done to examine the effect of objects closely located to the sensor unit on the long period noise level. Same as for the BBOBS-NX, the deployment of the BBOBST-NX was performed by free falling from the sea surface, then the ROV (KAIKO 7000II, JAMSTEC) was used to untie the connection between the sensor unit and the recording unit, and to move the recording unit beside the sensor unit without any mechanical connection except the underwater cable. The recovery was also done by the same ROV. In this observation, an ocean bottom Doppler current profiler (OBDC), which is based on our long-term OBS, was also deployed with a distance of 100 m.
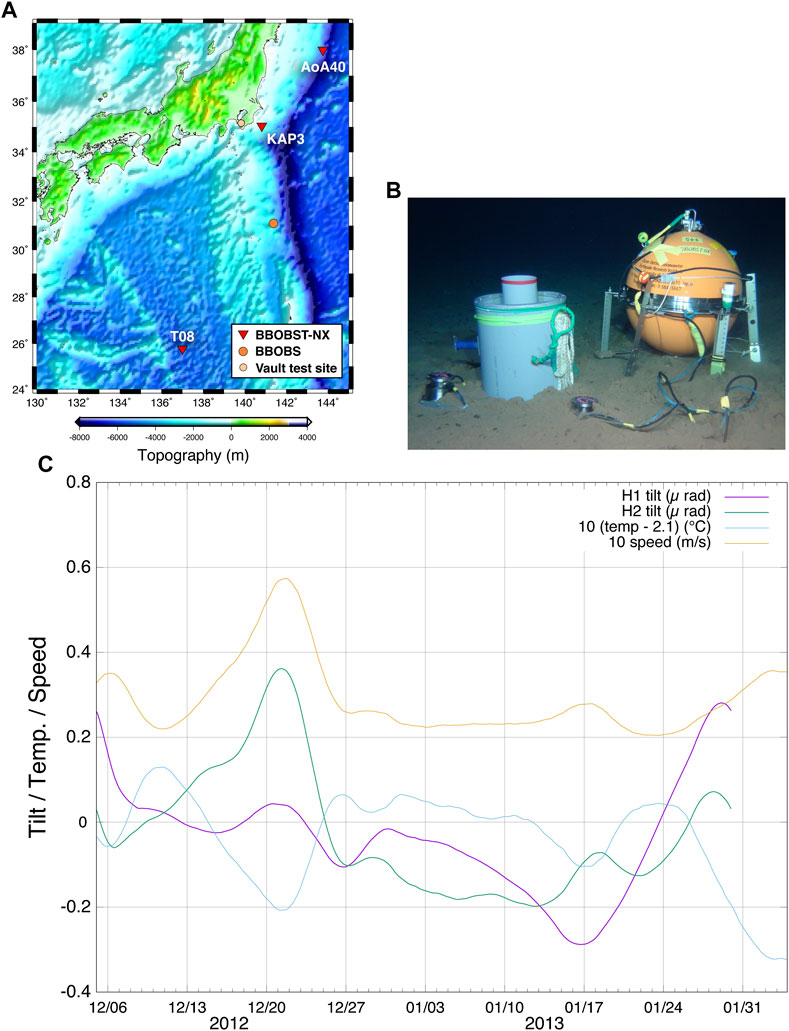
FIGURE 6. The first seafloor test of the BBOBST-NX. (A) The map shows all five sites mentioned in this paper. At the T08 site, where we have performed several observations, the first test was conducted. (B) The recording unit and a large gray tube were located close to the sensor unit for the preparation of NX-2G development, to examine influence on the data by these objects. The tube was originally designed as the base for the recording unit, but we failed to place the unit on the tube. The OBDC was also deployed at a 100 m distance. (C) Results of the tilt change for 2 months by the BBOBST-NX and water temperature and bottom current speed by the OBDC. All data were resampled with 1 h intervals and moving-averaged (1 week). The tilt data were processed using the Baytap08 program.
The tilt data were resampled in 1 h intervals at first, and were processed to remove the large drift that is considered as the mechanical relaxation effect. This effect is assumed to be empirically expressed by a combination of logarithmic function and linear trend, so that the best-fit parameters were searched using a curve fitting function built-in the gnuplot program, and these parameters were used to substitute the drift from the tilt data. Finally, the Baytap08 program (Tamura et al., 1991) was applied to remove tidal components, and a moving averaging of 7 days window length was also applied to observe stability in long periods. The result (Figure 6C) indicates a small tilt fluctuation at about 0.6 µ radian peak-to-peak throughout the observation period. The bottom current speed and seawater temperature obtained by the OBDC are shown too. As we cannot control the azimuth of the OBS landing, two horizontal components are expressed as H1 and H2, which are the NS and EW outputs of the broadband sensor, respectively.
Feasibility Observations
Next, more practical observation at the seafloor south of Boso Peninsula (close to the KAP3 site, 1,370 m depth) was performed as an in-situ feasibility study from April 2013 for 1 year. In this observation, the BBOBST-NX was deployed and recovered using the ROV (Hyper DOLPHIN, JAMSTEC). As this site is near the Kuroshio current axis, the OBDC was deployed near the BBOBST-NX (Figures 7A,B) to monitor the environment condition. Between December 28, 2013 and January 4, 2014, a slow slip event (SSE) occurred near this site (Ozawa, 2014), which is indicated as a yellow rectangle in Figure 7C. The tilt data were resampled in 1 h intervals at first, then several steps in the mass centering operations were removed. Other processes were the same as mentioned in First Test Observation at the Seafloor. The result shows a clear peak of about 6 µ radian in the H2 components, which started from late December 2013, but the tilt did not persist after the SSE ended. In the H1 component, it is difficult to recognize the existence of the similar peak, due to a large disturbance in the whole observation period. As additional information, the azimuth of the H1 component, the dominant bottom current, and the seafloor topography were almost matched with each other in the NE-SW direction (Figures 7B,D).
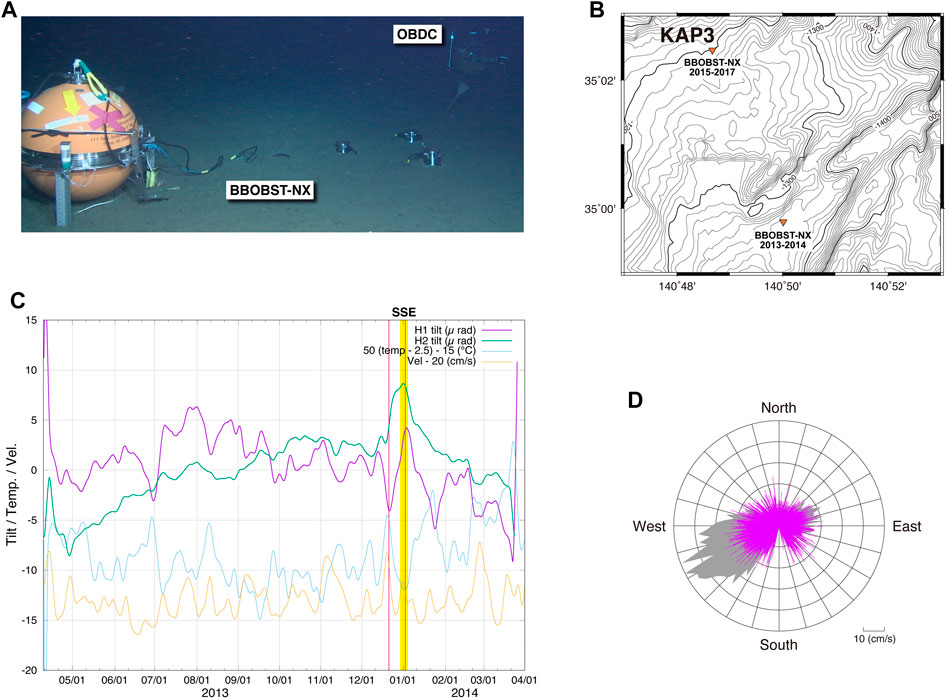
FIGURE 7. The first feasibility test off the Boso Peninsula. The first long-term observation of the BBOBST-NX was performed at the source area of the SSE with 3–4 years intervals. (A) The BBOBST-NX and the OBDC deployed in April 2013 for 1 years-long observation. (B) The location map of two sites in 2013–2014 and 2015–2017 (recovered in October 2020). The former site was near the cliff with an NE-SW strike. (C) Results of this test observation. In December 28, 2013–January 4, 2014 (yellow rectangle), the SSE was detected (Ozawa, 2014). The data were processed as in Figure 6C, after removing the steps at mass centering operations. Two purple vertical lines show two earthquakes mentioned in SSE Estimations(D) The rose histogram (normalized) of the bottom current direction (gray shade) and the current velocity (purple) from the 1 h averaged OBDC data. In spite of the surface current by Kuroshio, the dominant current direction was toward N245°E, similar to the seafloor topography trend.
As the 1 year-long data were thought to be too short to examine the tilt data of the BBOSBT-NX, which seemed to contain an annual fluctuation, two more tilt observations were started from 2015 for 2 year-long observations. One was at the KAP3 site, which is shallower and has no special topography, from July and another one was east off Miyagi Prefecture at the slope to the Japan Trench (AoA40 site, 5,430 m depth) from September, as shown in Figures 7B, 8A. They were deployed by the ROVs, Hyper DOLPHIN and KAIKO 7000II, respectively. The latter was recovered in April 2017 with about 1.5 years worth of data, because of the ship schedule. The raw data were processed with the same method used for the 2013 data near the KAP3 site. The result indicates large continuous tilt changes up to several tens of µ radian in both components from the middle of the observation period, which started around June 10 and October 20, 2016, respectively (two purple thick lines in Figure 8B). From our experiences of the same type of broadband sensors in BBOBSs, this is not due to an internal sensor problem, because the mass position is usually more stable. It is difficult to judge whether gradual changes in both the components for 7 months before the start of the large and sudden change are annual or not. Another BBOBST-NX at the KAP3 site was recovered in October 2020 by SHINKAI 6500, because of no ROV dive being performed in 2017 and 2019 due to a strong surface sea current and bad sea conditions, respectively. This newly obtained full 2 years worth of data are still being initially processed.
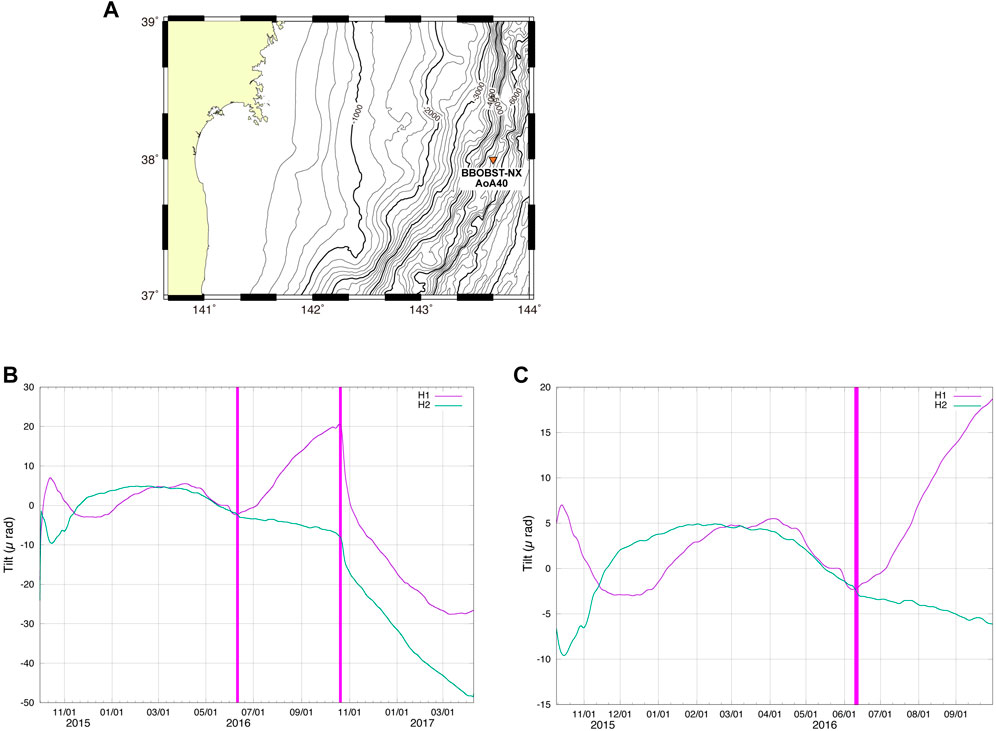
FIGURE 8. The long-term test off the Miyagi Prefecture. For more detail validation of the BBOBST-NX, a test lasting more than 1 years was conducted at the landward terrace near the Japan trench. (A) The location map of the site, AoA40, 5,430 m depth. No bottom current observation was conducted in this time. (B) Results of whole observation period of 18 months (earlier recovery due to the ship schedule). The data processing was the same as in Figure 7C. The H1 component had a similar direction matched with the maximum gradient (6°) of the seafloor. Two thick purple lines show the starting points of the large tilt change mentioned in Feasibility Observations(C) Same as (B) but re-scaled in both axes as in Figure 7C for easier comparison.
Tilt Data Using the BBOBS on the Seafloor
We also tried to perform tilt observations using the (standard) BBOBS, free-fall and self-popup type, with mass position data recording on the seafloor, four times at three sites. Compared with the tilt data obtained by the BBOBST-NX using the penetrator sensor system, the effective resolution was generally larger at more than 10 µ radian, which should correspond to the horizontal noise level difference between the BBOBS and the BBOBS-NX as show in Shiobara et al. (2013). However, one case of the BBOBS deployed near the Izu-Ogasawara Trench (5,430 m depth) showed stable and high signal to noise ratio tilt data (Figure 9), especially in the H1 component with less mass centering operations. Figure 9A shows a kind of a “RAW” tilt data without any process that effects the waveform. Several jumps after July 2015 reflected mass centering operations, when the tilt value exceeded about ±10 µ radian. From the relatively stable period between September 2015 and March 2016, the tilt data were applied to the Baytap08 program and were moving-averaged. The result is in Figure 9B, which shows a similar result to that of the BBOBST-NX in Figure 6C. So, the possibility of tilt measurement even using the BBOBS exists, if the ambient noise at the site is low enough in the long period range that we want to use for analyses. Nevertheless, there is a limitation in the continuity of the tilt data due to the narrow range of the mass position, as mentioned in Test at the Land Vault.
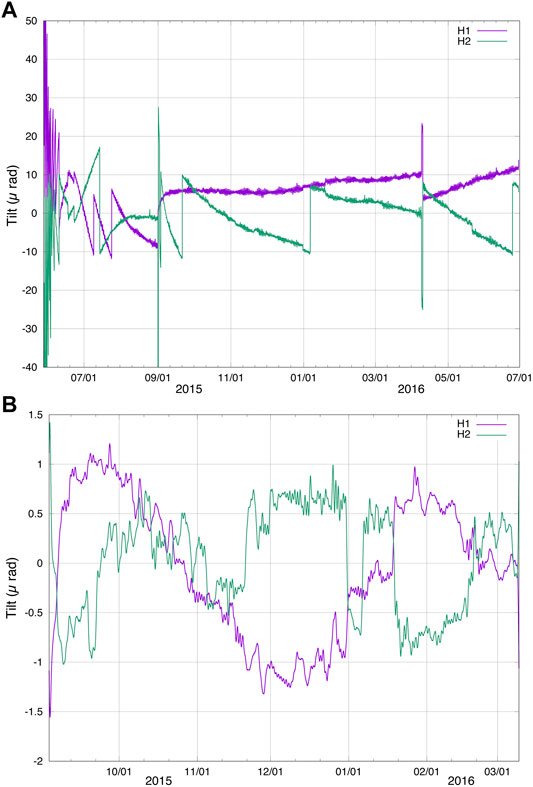
FIGURE 9. An example of the tilt measurement using the BBOBS. The BBOBS may be used for tilt measurement in the same method as the BBOBST-NX. One example is shown here, which was obtained by the BBOBS deployed near the Izu-Ogasawara trench (Figure 6A). (A) The whole “RAW” tilt data were only converted from the mass position data, which includes several mass centering steps. However, the H1 component in the middle part seemed stable for 7 months. (B) The stable period mentioned above was processed with the same method as in Figure 6C. Except for a few parts of mass centering operations in the H2 component, usual tilt fluctuation remained smaller than 1 µ radian.
Discussion and Conclusion
Effective Resolution of This Method
The tilt fluctuation shown in Figure 6C is about 1 µ radian through the observation period for 2 months, and more stable in a shorter time window. The speed of bottom currents and water temperature measured by the OBDC are also indicated in Figure 6C. It shows a clear relation between the speed of bottom currents and the tilt, and also between the temperature and the tilt, which show opposite relation patterns. As the temperature change seems to be caused mainly by the movement of the water block, it would be a secondary indicator by bottom currents, the first importance in the tilt should be the speed of the bottom current. From the tidal deformation model calculation by GOTIC2 (Matsumoto et al., 2001), the tilt change by the Earth tide that includes the oceanic tide loading at this site is less than 0.1 µ radian and mostly contain M2, S2, K1, and O1 tidal components which occur in approximate 12 or 24 h cycles. Thus, we assumed that a fluctuation of about 1 µ radian at this site was mainly due to the bottom current and the mechanical instability of the broadband sensor.
Although, in the first feasibility test near the KAP3 site, the H1 component of the tilt data showed a fluctuation of a few µ radian order after the tide reduction process by the Baytap08 program as shown in Figure 7C. And, as this fluctuation only occurred in the H1 component, this indicates a clear relation with the temperature change that occurred about 30 h offset of the advance, but not always with the speed of the bottom current, in contrast to that in Figure 6C. This H1 component had an azimuth of NE-SW (N63°E) determined by the video picture and the magnetic compass value of the ROV superimposed at the seafloor, which is matched with the dominant bottom current direction (N245°E, SW going current) as shown in Figure 7D and the seafloor topography trend (Figure 7B). If the temperature affected the broadband sensor, it seems difficult to explain why there was no large fluctuation in the H2 component like that of the H1 component. This means that the temperature change should indicate the move of the water block like in Figure 6C, and affected the tilt measurement less. To make it clear, we deployed the next BBOBST-NX in 2015 near the site of the 2013–2014 observation at the KAP3 site with a relatively flat topography (Figure 7A). So, it is better to wait for this new data that were recovered in October 2020 for a detailed discussion, but if the SSE may cause a tilt change of more than a few µ radian within a few days, it seems that the BBOBST-NX can resolve it. This detection level looked similar to the case at the AoA40 site (Figure 8B). For an easier comparison, this graph is re-scaled with the same range of Figure 6C in both axes (Figure 8C). Generally, except for the H1 component of Figure 7C which had a large (almost monthly) fluctuation, they showed a similar long-term change of a few µ radian per month. If the tilt event is in a short time and the background noise level is low enough, we may resolve the tilt change well less than 1 µ radian as shown in Figure 9B even at the seafloor by the BBOBS, but it is better to measure below the seafloor as results of the BBOBST-NX demonstrated.
From these results, the effective resolution of this method is a few µ radian per week or smaller under better conditions of the observation site. If the tilt change is in a shorter time span, it becomes easier to detect. These values look large compared with a tiltmeter on the land, but this method has an inherent advantage in the tilt signal level because of the short distance between the source and the site. To perform better tilt signal detection from the noisy data, the analysis technique in Sato et al. (2017) will be useful. In addition, if the NX-2G with the same broadband sensor of the BBOBST-NX is available, we can deploy the dense array without the use of a submersible vessel near the source area of the SSE in the near future. As mentioned already, tilt measurement in a seafloor borehole is ideal to obtain precise data of a nano radian order, but it requires high cost and drilling ship availability. Instead, this method has high mobility and a lower cost. Therefore, a combination of both the tilt measurement types will be a good solution to achieve the best quality and quantity data for our scientific goals.
SSE Estimations
As SSE observation is the first target of this method, we examined the tilt observed at two sites, whether these tilt values were adequate with that estimated by a ground deformation model. Here, we used an interactive tool, Coulomb3.3 (Toda et al., 2011) based on Okada (1992), and also the method of Sato et al. (2017) for one case, to estimate the tilt from the elevation output of the tool and the method.
In the case of the near KAP3 site (Figure 7), the SSE in January 2014 was detected by land sites and ocean bottom pressure gauges (OBPs), and the slip distributions were already analyzed (Sato et al., 2017). For the tilt calculation, the fault plane geometry and slip parameters were almost adjusted to that of Sato et al. (2017) for the Coulomb3.3. The shape of the fault plane was simplified into a rectangle (60 km × 60 km) to cover the main slip region of Sato et al. (2017), and the maximum slip was set as 6.5 cm at the center and gradually decreased toward the edge of the rectangle as shown in Figure 10A. The shallowest depth, the dip, and rake angle of the reverse fault plane were assumed as 9.3 km (bsf), 12.0° toward northwest (N315°), and 90°, respectively. The position of the BBOBST-NX was at the origin, and the calculated tilt values were rotated to the H2 component direction (N153°E) (Figure 10A). The color shows the vertical displacement distribution obtained by the tool. As this result reflects the tilt when the SSE had ended, the tilt at the site was −2.4 µ radian and the maximum was +3 µ radian in the calculated area, which was about half of the peak value observed in the H2 component (Figure 7C). And, we also obtained the calculated H2 tilt value as −0.43 µ radian by the method and the slip distribution of Sato et al. (2017), which was about one sixth smaller than that in Figure 10A. Reasons for this difference probably come from the roughness of slip distributions applied for the tool and the method, and also a small difference in the BBOBST-NX position in both models, which were located near the ridge / peak of the elevation distribution (Figure 10A). If the tilt observation was far from the source area, the tilt record was a simple increase or decrease pattern. However, above the source area, the polarity of the tilt may change according to the slip propagation, as we observed in Figure 7C. As for the seismic activity obtained at the same site and the broadband sensor, even around the time period of the SSE detected (December 28, 2013-January 4, 2014), no significant continuous change was seen in signal strength in the longer period range of 400–10 s for the CMG-3T sensor (Figure 10B). There was an intensity change in higher frequency (2–40 Hz) on about December 21, 2013, which was related the earthquake (MJMA 5.5) and its aftershocks occurred at the northwestern edge of this SSE source area. On January 2, 2014, three earthquakes, the largest one of MJMA 5.0, occurred at the western edge, too. These two earthquakes are indicated as purple lines in Figure 7C and also as purple arrows in Figure 10B. The high intensity at the microseism range (around 0.2 Hz) and longer period on about December 21 were due to high wave height by the low pressure from the meteorological record.
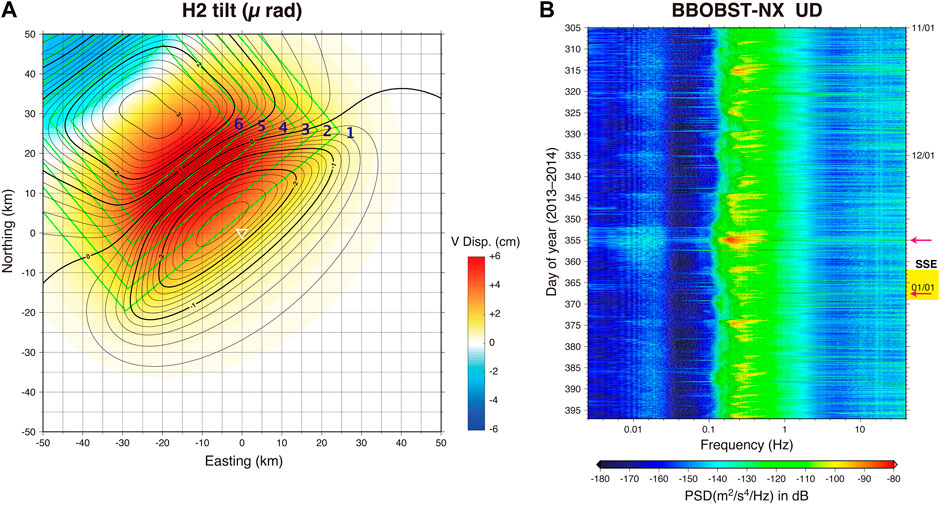
FIGURE 10. The SSE in 2013–2014 off Boso Peninsula. (A) Calculated result of H2 tilt (contour lines in µ radian) based on the fault parameters by Sato et al. (2017). The red-blue color scale shows the vertical displacement by the tool, Coulomb3.3 (Toda et al., 2011). The outline size of the fault plane rectangle is 60 km × 60 km, and it is divided as 6 gradually shrinking rectangles (green, 1–6) with different slip values, 2.0, 2.5, 3.0, 4.5, 5.5, and 6.5 cm, respectively. The inverted triangle (white) shows the BBOBST-NX position, which is at the H2 tilt of −2.4 µ radian. (B) The running spectrum of the vertical (UD) component of the broadband sensor’s ground velocity signal, before and after the SSE (December 28, 2013–January 4, 2014; indicated as a yellow rectangle). The time (vertical axis) resolution is 1 h. There was no significant change in signal level in the <0.1 Hz frequency range during the SSE. Some earthquakes around the SSE source area occurred, as shown in the >2 Hz frequency range. Two purple arrows indicate the two earthquakes mentioned in SSE Estimations.
In another case of the AoA40 site, no SSE was detected by other observations at land sites. However, this area is far from any land observatories, more than 130 km, Ito et al. (2013) suggested the possible SSE in 2008 (Mw 6.8), which was based on analysis of the OBPs and the volumetric strain meter data on land. The fault plane was close to the AoA40 site, less than 10 km from its eastern edge. For the tilt calculation, we used similar fault parameters estimated by Ito et al. (2013), as 100 km length in N-S, 40 km width in E-W, and 1 m slip toward east as a reverse fault (rake angle = 90°). The depth and the dip were determined as 5.1 km to the top of the fault plane and 7.0°, respectively, based on the result of the crustal structure study (Miura et al., 2005) nearby. As shown in Figure 11A, the range of the tilt was between several tens of µ radian of plus and minus, which was a same order of the tilt observed, but the location of the AoA40 site was unknown relative to this assumed fault and the tilt was only estimated when the fault slip had ended. Seafloor pressure gauges of the S-net (Uehira et al., 2018) in this area did also not show large change. One explanation for this large tilt change may be an event in the shallow sediment, such as a land slide. The azimuth of the H1 component (N140°E) was close to the maximum gradient of the seafloor (6°) from the fine topography data. Regarding the positions of the BBOBST-NX in deployment and recovery, there were no clear differences, and the condition of the instrument and the seafloor in the recovery ROV dive had no remarkable change. So that, it was still difficult to find a reason for the large tilt change observed. In the seismic data of the BBOBST-NX, there were no significant change in the signal strength in the whole frequency range according to two tilt changes around June 10 and October 20, 2016 (Figure 11B), as in Figure 10B, except for aftershocks mostly of the 2011 off-Tohoku earthquake shown in higher frequency (2–20 Hz).
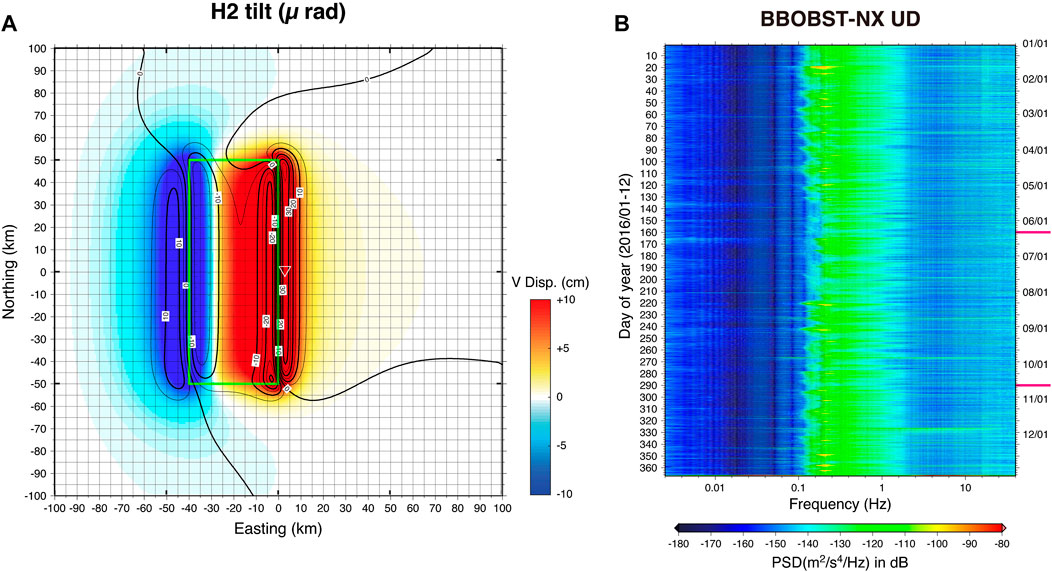
FIGURE 11. A possible SSE for the large tilt change at the AoA40 site. (A) Similar result of Figure 10A, but for the assumed SSE based on Ito et al. (2013). The green rectangle shows the fault plane (100 km × 40 km), and the slip amount is 1 m. In this case, the position of the BBOBST-NX is unknown. However, the calculated tilt range is between −20 and +30 in µ radian. (B) The running spectrum of the vertical (UD) component is the same as in Figure 10B, but for the AoA40 site in 2016, including two starting points of the large tilt change at about June 10 and October 20, which are shown as two thick purple lines.
In both cases, the necessity of the tilt array observation and a dynamic analysis of tilt source modelling became essential to further study of the SSE process. And, it is highly recommended that the tilt and absolute pressure are simultaneously observed as a geodetic measurement site on the seafloor.
Data Availability Statement
The datasets used in Figures 2, 3, 5–11 can be found in the OHP-DMC (http://ohpdmc.eri.u-tokyo.ac.jp) and in a cloud data folder (https://www.icloud.com/iclouddrive/0MlBeQ0auaB6Yng6bnfbY5GIw#Frontiers_in_Seafloor_Geodesy).
Author Contributions
HSH and MS initiated the concept of the method. HSH, AI, and HSU performed several test observations. HSH, HSU and TS analyzed the data. All the authors wrote the manuscript and contributed to the interpretation of results.
Funding
This research was supported by JSPS (Japan Society for the Promotion of Science) KAKENHI, Grant-in-Aid for Scientific Research (B) of JP19340121 for the BBOBS-NX and (C) of JP23540489 for the BBOBST-NX. It was also partly supported by the Ministry of Education, Culture, Sports, Science, and Technology (MEXT) of Japan, under its The Second Earthquake and Volcano Hazards Observation and Research Program (Earthquake and Volcano Hazard Reduction Research).
Conflict of Interest
The authors declare that the research was conducted in the absence of any commercial or financial relationships that could be construed as a potential conflict of interest.
Acknowledgments
The authors thank the captains, crews, ROV operation teams, and land support staff of the Japan Agency for Marine-Earth Science and Technology and Nippon Marine Enterprises Ltd. for their great help in several research cruises for this study. Drs. R. Hino and T. Isse and technical staff T. Yagi, helped us in several tests on land and during cruises. We also express our appreciation to the editor and two reviewers for their comments which were valuable for improving this manuscript.
References
Anderson, G., Constable, S., Staudigel, H., and Wyatt, F. K. (1997). A seafloor long-baseline tiltmeter. J. Geophys. Res. 102 (B9), 20269–20285. doi:10.1029/97JB01586
Araki, E. (2017). Long-term seafloor borehole observation in the Nankai Trough. Report of the Coordinating Committee for Earthquake Prediction, Japan 98, 12–19, 502–506. [in Japanese].
Araki, E., Shinohara, M., Sacks, S., Linde, A., Kanazawa, T., Shiobara, H., et al. (2004). Improvement of seismic observation in the ocean by use of seafloor boreholes. Bull. Seism. Soc. Am. 94, 678–690. doi:10.1785/0120020088
Collins, J. A., Vernon, F. L., Orcutt, J. A., Stephen, R. A., Peal, K. R., Wooding, F. B., et al. (2001). Broadband seismology in the oceans: lessons from the ocean seismic network pilot experiment. Geophys. Res. Lett. 28, 49–52. doi:10.1029/2000GL011638
Duennebier, F. K., Cessaro, R. K., and Harris, D. (1987). Temperature and tilt variation measured for 64 Days in hole 581C. Init. Repts. 88, 161–166. doi:10.2973/DSDP.PROC.88.112.1987
Fabian, M., and Villinger, H. (2008). Long-term tilt and acceleration data from the logatchev hydrothermal vent field, mid-atlantic ridge, measured by the bremen ocean bottom tiltmeter. Geochem. Geophys. Geosyst. 9, Q07016. doi:10.1029/2007GC001917
Fabian, M., and Villinger, H. (2007). The Bremen ocean bottom tiltmeter (OBT) – a technical article on a new instrument to monitor deep sea floor deformation and seismicity level. Mar. Geophys. Res. 28, 13–26. doi:10.1007/s11001-006-9011-4
Hino, R., Ii, S., Iinuma, T., and Fujimoto, H. (2009). Continuous long-term seafloor pressure observation for detecting slow-slip interplate events in Miyagi-Oki on the landward Japan Trench Slope. J. Disaster Res. 4, 72–82. doi:10.20965/jdr.2009.p0072
Hirose, H., Hirahara, K., Kimata, F., Fujii, N., and Miyazaki, S. (1999). A slow thrust slip event following the two 1996 Hyuganada earthquakes beneath the Bungo Channel, southwest Japan. Geophys. Res. Lett. 26 (21), 3237–3240. doi:10.1029/1999GL010999
Ide, S., Beroza, G. C., Shelly, D. R., and Uchide, T. (2007). A scaling law for slow earthquakes. Nature 447, 76–79. doi:10.1038/nature05780 |
Incorporated Research Institutions for Seismology (IRIS). (1994). Estimation of seismic noise,” in federation of digital seismograph networks: station book. Washington, DC: IRIS data management system.
Ishii, H., Matsumoto, S., Suzuki, K., Hitara, Y., Takahashi, T., Wakasugi, T., et al. (1992). Development of a new water-tube tiltmeter (ERI-90 type): float type without mechanical suspension. Bull. Eartq. Res. Inst. Univ. Tokyo 67, 79–87.
Ito, Y., Hino, R., Kido, M., Fujimoto, H., Osada, Y., Inazu, D., et al. (2013). Episodic slow slip events in the Japan subduction zone before the 2011 Tohoku-Oki earthquake. Tectonophys 600, 14–26. doi:10.1016/j.tecto.2012.08.022
Kajikawa, H., and Kobata, T. (2014). Reproducibility of calibration results by 0-A-0 pressurization procedures for hydraulic pressure transducers. Meas. Sci. Technol. 25, 1. doi:10.1088/0957-0233/25/1/015008
Kaneda, Y., Kawaguchi, K., Araki, E., Matsumoto, H., Nakamura, T., Kamiya, S., et al. (2015). Development and application of an advanced ocean floor network system for megathrust earthquakes and tsunamis, seafloor observatories. Springer Praxis Books 643–662. doi:10.1007/978-3-642-11374-1_25
Matsumoto, K., Takanezawa, T., and Ooe, M. (2001). GOTIC2: a program for computation of oceanic tidal loading effect. J. Geod. Soc. Japan 47, 243–248. doi:10.11366/sokuchi1954.47.243
Miura, S., Takahashi, N., Nakanishi, A., Tsuru, T., Kodaira, S., and Kaneda, Y. (2005). Structural characteristics off Miyagi forearc region, the Japan Trench seismogenic zone, deduced from a wide-angle reflection and refraction study. Tectonophysics 407, 165–188. doi:10.1016/j.tecto.2005.08.001
Obara, K. (2002). Nonvolcanic deep tremor associated with subduction in southwest Japan. Science 296, 1679–1681. doi:10.1126/science.1070378 |
Okada, Y. (1992). Internal deformation due to shear and tensile faults in a half-space. Bull. Seismol. Soc. Am. 82, 1018–1040.
Ozawa, S. (2014). Shortening of recurrence interval of Boso slow slip events in Japan. Geophys. Res. Lett. 41, 2762–2768. doi:10.1002/2017GL060072
Peterson, J. (1993). Observations and modeling of seismic background noise. Reston, VA: USGS Open File Report, 93–322.
Sacks, I. S., Suyehiro, K., Acton, G. D., et al. (2000). Proc. ODP, Initial Reports. 186: College Station, TX (Ocean Drilling Program). doi:10.2973/odp.proc.ir.186.2000
Sakata, S., and Shimada, S. (1984). Development of the ocean bottom tiltmeter (2). J. Geodetic Soc. Japan. 30 (1), 50–58 [in Japanese].
Sato, T., Hasegawa, S., Kono, A., Shiobara, H., Yagi, T., Yamada, T., et al. (2017). Detection of vertical motion during a Boso slow-slip event by ocean-bottom pressure gauges. Geophys. Res. Lett. 44, 2710–2715. doi:10.1002/2017GL072838
Sato, T., and Kasahara, J. (1999). Development of free-fall and pop-up ocean bottom tiltmeters. Abstract of jpgu.
Sáez, M., Ruiz, S., Ide, S., and Sugioka, H. (2019). Shallow nonvolcanic tremor activity and potential repeating earthquakes in the Chile triple junction: seismic evidence of the subduction of the active nazca–antarctic spreading center. Seis. Res. Lett. 90, 5. doi:10.1785/0220180394
Shimamura, H., and Kanazawa, T. (1988). Ocean bottom tiltmeter with acoustic data retrieval system implanted by a submersible. Marine Geophys. Res. 9, 237–254.
Shinohara, M., Suyehiro, K., and Shiobara, H. (2012). “CHAPTER 7.5 Marine seismic observation,” in New manual of seismological observatory practice (NMSOP-2). Editor P. Bormann, Potsdam: IASPEI, GFZ German Research Centre for Geosciences. doi:10.2312/GFZ.NMSOP-2_ch7
Shiobara, H., Ito, A., Sugioka, H., and Shinohara, M. (2019). New era of ocean bottom broadband seismology with penetrator system of the autonomous BBOBS-NX (NX-2G). Abstract of IUGG2019MONTREAL, JUL. 16, S05A, IUGG19-0453.
Shiobara, H., Kanazawa, T., and Isse, T. (2013). New step for broadband seismic observation on the sea floor: BBOBS-NX. IEEE-JOE. 38. 2, 396–405. doi:10.1109/JOE.2012.2222792
Spiess, F. N., Chadwell, C. D., Hildebrand, J. A., Young, L. E., Purcell, G. H., and Dragert, H. (1998). Precise GPS/Acoustic positioning of seafloor reference points for tectonic studies. Phys. Earth Planet. Int. 108, 101–112. doi:10.1016/S0031-9201(98)00089-2
Suetsugu, D., and Shiobara, H. (2014). broadband ocean bottom seismology. Annu. Rev. Earth Planet Sci. 42, 27–43. doi:10.1146/annurev-earth-060313-054818
Sugioka, H., Okamoto, T., Nakamura, T., Ishihara, Y., Ito, A., Obana, K., et al. (2012). Tsunamigenic potential of the shallow subduction plate boundary inferred from slow seismic slip, Nature Geosci. 5 (6), 414–418. doi:10.1038/ngeo1466
Suyehiro, K., Kanazawa, T., Hirata, N., and Shinohara, M. (1995). Ocean downhole seismic project. J. Phys. Earth 43, 599–618.
Tamura, Y., Sato, T., Ooe, M., and Ishiguro, M. (1991). A procedure for tidal analysis with a Bayesian information criterion. Geophys. J. Internat. 104, 507–516. doi:10.1111/j.1365-246X.1991.tb05697.x
Toda, S., Stein, R. S., Sevilgen, V., and Lin, J. (2011). Open-File Report 2011–1060. Coulomb 3.3 Graphic-rich deformation and stress-change software for earthquake, tectonic, and volcano research and teaching—user guide: U.S. Geological Survey, 63. Available at https://pubs.usgs.gov/of/2011/1060/
Tolstoy, M., Constable, S., Orcutt, J., Staudigel, H., Wyatt, F. K., and Anderson, G. (1998). Short and long baseline tiltmeter measurements on axial seamount, Juan de Fuca Ridge. Phys. Earth Planet. Int. 108, 129–141.
Uehira, K., Kunugi, T., Shiomi, K., Aoi, S., Takahashi, N., Chikasada, N. Y., et al. (2018). Ground motion noises observed by Seafloor observation network for earthquakes and tsunamis along the Japan Trench (S-net). American Geophysical Union, Fall Meeting 2018, OS21E-1612.
Webb, S. C., Constable, S. C., Cox, C. S., and Deaton, T. K. (1985). A seafloor electric field instrument. J. Geornagn. Geoelectr. 37, 1115–1130. doi:10.5636/jgg.37.1115
Keywords: geodesy, ocean bottom seismometer, tilt observation, broadband seismometer, earth tide, bottom current, slow slip event
Citation: Shiobara H, Ito A, Sugioka H, Shinohara M and Sato T (2021) Tilt Observations at the Seafloor by Mobile Ocean Bottom Seismometers. Front. Earth Sci. 8:599810. doi: 10.3389/feart.2020.599810
Received: 28 August 2020; Accepted: 28 December 2020;
Published: 17 March 2021.
Edited by:
Ryota Hino, Tohoku University, JapanReviewed by:
Tolulope Morayo Olugboji, University of Rochester, United StatesHiromi Fujimoto, Tohoku University, Japan
Copyright © 2021 Shiobara, Ito, Sugioka, Shinohara and Sato. This is an open-access article distributed under the terms of the Creative Commons Attribution License (CC BY). The use, distribution or reproduction in other forums is permitted, provided the original author(s) and the copyright owner(s) are credited and that the original publication in this journal is cited, in accordance with accepted academic practice. No use, distribution or reproduction is permitted which does not comply with these terms.
*Correspondence: Hajime Shiobara, c2hpb0BlcmkudS10b2t5by5hYy5qcA==
 Hajime Shiobara
 Aki Ito2
 Masanao Shinohara