 Raimundo Brahm1*
 Georg F. Zellmer1
 Takeshi Kuritani2
 Daniel Coulthard Jr.1
 Mitsuhiro Nakagawa2
 Naoya Sakamoto3
 Hisayoshi Yurimoto3
 Eiichi Sato4
- 1School of Agriculture and Environment, Massey University, Palmerston North, New Zealand
- 2Graduate School of Science, Hokkaido University, Sapporo, Japan
- 3Isotope Imaging Laboratory, Creative Research Institution, Hokkaido University, Sapporo, Japan
- 4Earth Science Laboratory, Hokkaido University of Education, Asahikawa, Japan
Olivine-hosted melt inclusions (MIs) are widely used as a tool to study the early stages of magmatic evolution. There are a series of processes that affect MI compositions after trapping, including post-entrapment crystallization (PEC) of the host mineral at the MI boundaries, exsolution of volatile phases into a “shrinkage bubble” and diffusive exchange between a MI and its host. Classical correction schemes applied to olivine-hosted MIs include PEC correction through addition of olivine back to the melt until it reaches equilibrium with the host composition and “Fe-loss” correction due to Fe-Mg diffusive exchange. These corrections rely on the assumption that the original host composition is preserved. However, for many volcanic samples the crystal cargo is thought to be antecrystic, and the olivine composition may thus have been completely re-equilibrated during long crystal storage times. Here, we develop a novel MI correction scheme that is applicable when the original host crystal composition has not been preserved and the initial MI composition variability can be represented by simple fractional crystallization (FC). The new scheme allows correction of MI compositions in antecrystic hosts with long and varied temperature histories. The correction fits a set of MI compositions to modelled liquid lines of descent generated by FC. A MATLAB® script (called MushPEC) iterates FC simulations using the rhyolite-MELTS algorithm. In addition to obtaining the corrected MI compositions, the application of this methodology provides estimations of magmatic conditions during MI entrapment. A set of MIs hosted in olivine crystals of homogeneous composition (Fo77–78) from a basaltic tephra of Akita-Komagatake volcano was used to test the methodology. The tephra sample shows evidence of re-equilibration of the MIs to a narrow Mg# range equivalent to the carrier melt composition. The correction shows that olivine hosts were stored in the upper crust (c. 125 – 150 MPa) at undersaturated H2O contents of c. 1 – 2 wt% H2O).
Introduction
Melt inclusions (MIs) have been widely used in the study of magmatic processes, as they can constitute snapshots of primary to pre-eruptive magmatic conditions (e.g., Lowenstern, 1995; Danyushevsky et al., 2002a; Danyushevsky et al., 2004; Kelley et al., 2006; Kent, 2008; Kelley et al., 2010; Cannatelli et al., 2016). MIs have been the focus of many studies due to the believe that they can retain the volatile content of the melt that would otherwise be exsolved during eruption (e.g., Johnson et al., 1996; Blundy and Cashman, 2001; Hauri, 2002; Sours-Page et al., 2002; Métrich and Wallace, 2008; Reubi and Blundy, 2009; Blundy et al., 2010; Vigouroux et al., 2012; Rose-Koga et al., 2014; Donovan et al., 2018) and that glassy MIs closely represent the melt composition at a particular stage of magmatic evolution, without contamination by the crystal cargo of the magma, which can affect the whole rock composition by phenocryst (± antecryst ± xenocryst) accumulation. Nonetheless, MIs are subjected to a series of post-entrapment processes that affect their compositions, and careful assessment is required to identify and correct for these processes. Olivine-hosted MIs are especially valuable for the study of primary magma compositions. This mineral phase is usually the first to crystallize from mafic melts, and the post-entrapment processes are well understood. These processes are easy to correct for because of the simplicity of the olivine structure and because relevant diffusion of major elements is reduced to Fe-Mg exchange (Danyushevsky et al., 2000). The use of these MIs for studies of primary magmas has typically been restricted to primitive olivine compositions (Fo > 80) where the original olivine composition is thought to be preserved and MI compositions are close to that of the primary magma.
A detailed summary of the post-entrapment processes suffered by MIs can be found in Kent (2008). The processes that can change the compositions of MIs after trapping in olivine crystals can be summarized as:
Crystallization of olivine at the host-inclusion interface during cooling/decompression of the system. This process is commonly known as post-entrapment crystallization (PEC) of the host mineral.
PEC of other daughter mineral phases from the MI volume.
Volatile loss to the shrinkage bubble formed inside the MI (e.g., Wallace et al., 2015).
Volatile loss by exsolution and inclusion rupture (decrepitation; e.g., Maclennan, 2017).
Diffusive exchange of elements (re-equilibration) between inclusion and host.
The focus of this study is on glassy MIs, so the formation of daughter minerals is not considered here. It has been demonstrated that the main volatile exsolved to the shrinkage bubble in MIs trapped at elevated pressures is CO2, and there are methods available to measure or to estimate the CO2 content of the bubble (e.g., Fall et al., 2011; Hartley et al., 2014; Moore et al., 2015; Aster et al., 2016; Moore et al., 2018). Nonetheless, significant amounts of H2O (and S) have been detected in shrinkage bubbles of MIs trapped at upper crust pressures (e.g., Robidoux et al., 2018). The most important diffusion reactions occurring during olivine re-equilibration are H+ diffusion between inclusion and magma through the olivine walls (Roedder, 1979; Demouchy and Mackwell, 2006) and the “Fe-loss” process (Danyushevsky et al., 2000), which involves an interplay between PEC and Fe-Mg interdiffusion. High H+ diffusivity in olivine implies high water permeability. Usually, the H2O contents of MIs are expected to be lower than their initial concentrations, due to outward H+ diffusion caused by H2O vapor exsolution during magma ascent (Hartley et al., 2015; Turner et al., 2017). It has also been shown that H+ may diffuse into the MI when H2O is concentrated in the magma (Hartley et al., 2017). Regarding magma H2O contents, the permeable nature of olivine to H+ means that inferences made from olivine-hosted MI analysis are not straightforward. Compositional changes in the MI due to PEC or diffusive exchange can produce compositional heterogeneities in the MI glass when not enough time is available for melt diffusive re-equilibration (e.g., Danyushevsky et al., 2000; Newcombe et al., 2014). Zonation of major and trace elements generated by diffusion with the depleted boundary layer in the MI wall is likely to occur during post entrapment processes triggered during ascent and eruption, when there is not enough time for diffusive re-equilibration within the MI.
Here, we consider the processes that change the major element composition of the MI through olivine crystallization and Fe-Mg diffusion. In the rest of the text, PEC will be used to refer only to the post-entrapment crystallization of the host mineral in the MI rims. The classical view on how these processes affect olivine-hosted MI compositions after trapping and how to correct for them are described in detail by Danyushevsky et al. (2000), and the correction calculations can be performed using the software Petrolog (Danyushevsky and Plechov, 2011). During entrapment, the MI composition should be in equilibrium with its host olivine crystal. PEC occurs on the wall of the MI, where the newly formed olivine is progressively more Fe-rich as melt Fe/Mg increases by olivine fractionation. By knowing the host crystal composition and the final melt composition, the original major element composition can be backtracked by stepwise addition of equilibrium olivine to the MI until it reaches equilibrium with the host crystal. Danyushevsky et al. (2000) showed that the PEC corrected MI total FeO (FeOt) contents for a set of MIs were usually lower than the trend defined by the whole rock data. This is thought to be caused by Fe-Mg diffusion between the host olivine and the newly formed olivine during PEC. If the rate of PEC is slow enough, the newly formed olivine that is higher in Fe will lose Fe and gain Mg through diffusion with the host olivine and Mg will also diffuse into (and Fe out of) the MIs. This exchange increases the olivine liquidus temperature of the MI, triggering additional olivine crystallization. The process is known as “Fe-loss, and Danyushevsky et al. (2000) designed a methodology for correcting its effect on the MI composition, which are incorporated in the Petrolog software. If total re-equilibration of the MI with the host has not been achieved, the original MI composition can be reconstructed from the shape of the diffusion profile of the MI (Danyushevsky et al., 2002b), or in case that no profiles are available or no clear profile is distinguishable in the MI, the original MI composition can be calculated by assigning an estimated original FeOt content to the MI before PEC and Fe-loss. These methodologies are usually applied assuming that the olivine host composition is preserved and that the corrected MI composition is an estimation of the original composition during entrapment. If the olivine-hosts have been stored in steady state conditions for enough time, their compositions and the compositions of their hosted MIs will have reached an equilibrium composition with the carrier melt. Then, later post-entrapment processes displace the MIs from equilibrium during remobilization and eruption, and when applying the PEC and Fe-loss corrections, the corrected MI compositions would be an estimation of the storage conditions, not necessarily equivalent to the composition at entrapment. This would mainly affect the MgO and FeO estimation of the melt and give erroneous estimations of parental magma compositions.
In this paper, we develop a novel approach for PEC and Fe-Mg diffusion correction of olivine-hosted glassy MIs, which can be applied to a genetically related population of MIs that have been entrapped during co-crystallization of other mineral phases (e.g., pyroxene, plagioclase) and that have suffered widespread Fe-Mg diffusive re-equilibration. The methodology relies on fitting the MI trend to fractional crystallization (FC) models iteratively generated using the rhyolite-MELTS algorithm (Ghiorso and Sack, 1995; Asimow and Ghiorso, 1998; Gualda et al., 2012) via the alphaMELTS2 front end (Smith and Asimow, 2005). A MATLAB® script (called MushPEC) was written to automate FC model generation and PEC correction calculations. We then use the MushPEC script to correct a population of olivine-hosted MIs from a volcanic sample derived from the NE Japan arc (Akita-Komagatake volcano) as a worked example.
Post-Entrapment Processes for Antecrystic Olivine-Hosts
In many cases it has been proposed that much of the crystal cargo observed in volcanic samples is antecrystic (e.g., Jerram and Martin, 2008; Zellmer et al., 2014; Zellmer et al., 2016). This means many crystals that are stored at depth in highly crystalline magmatic mushes get remobilized and picked up by newly intruded magma batches, which carry the crystals to the surface. During long residence times at elevated temperatures, olivine crystals and their hosted MIs may thus be re-equilibrated to the Fe/Mg ratio of the surrounding interstitial melt, where the “Fe-loss” suffered by the MI is overprinted by total re-equilibration during storage. Gaetani and Watson (2000) have previously discussed the possibility of diffusion re-equilibration affecting FeO and MgO systematics in olivine-hosted MIs subjected to slow cooling rates. Thomson and Maclennan (2013) performed a statistical model of olivine compositions in Icelandic basalts and picrites. They explain the homogeneous olivine populations, which are more magnesian than the ones in equilibrium with their carrier melts, to be stored for long times and re-equilibrated in mush piles before being picked-up and erupted. Long storage time of olivine mush piles have also been identified in the Kilauea volcano plumbing system (Wieser et al., 2019).
With remobilization of the stored olivine crystals, a second stage of PEC can occur before eruption. As the original host composition and the “Fe-loss” signal of the MI have been overwritten, any constraints needed to apply the classical correction scheme of Danyushevsky et al. (2000) to recover the original melt compositions at the moment of entrapment are lost. Using this methodology would recover the storage conditions just before ascent and eruption. The processes of PEC and Fe-Mg interdiffusion can be differentiated from each other by studying the MI compositions in mol% instead of wt%. This way, the concentrations of every element but MgO and FeOt are affected only by olivine fractionation and not by Fe-Mg exchange. The total MgO + FeOt is also not affected by Fe-Mg exchange or olivine composition.
Figure 1 shows an example of the processes that MIs in antecrystic olivine hosts may have suffered and how this affects the FeOt vs. MgO trends in comparison to simple PEC and Fe-loss for quickly extruded phenocrysts. These compositions were generated by modelling the post-entrapment processes on a set of melt compositions produced by a FC model using rhyolite-MELTS. This forward model of post-entrapment processes is based on the calculations of Danyushevsky et al. (2000) and a detailed explanation of these equations are found in the Supplementary Material. The model is divided into three phases. In phase 1 (P1), PEC and Fe-loss processes occur as MIs are trapped and the magma is slowly cooling, and FC is progressing in the melt. As cooling is slow, the Fe-loss process is expected to be near its maximum, maintaining the MI equilibrium with the olivine host composition. P1 ends at a temperature 10 °C below that of entrapment of the most differentiated MI (Tstore in Figure 1A). During phase 2 (P2) the olivine hosts are stored in steady state conditions at constant Tstore and Mg# of the interstitial melt. As Fe-Mg re-equilibration of the olivine reaches the MI vicinity, Fe is incorporated into the MI and Mg is lost to the olivine. The Fe increase decreases the liquidus temperature of olivine, triggering melting of olivine in the MI walls. This process continues until the MI reaches Fe-Mg equilibrium with the new olivine and the interstitial melt compositions. As diffusivities in melts are faster than in olivine, a flat zonation profile in olivine cores means that the olivine-hosted MI should have been completely re-equilibrated to the same Fe-Mg conditions during storage. At this stage, all MIs have the same Mg# (Mg#store in Figure 1A). These equilibrium conditions are disrupted during remobilization and eruption, and the final MI MgO/FeOt ratios are affected by a second stage of post-entrapment processes occurring just before eruption (P3). During P3, variable amounts of PEC and Fe-loss are expected as observed in natural samples. Figure 1C shows a schematic illustration of the variation of composition and texture of a single olivine and its hosted MI during these processes. For glassy MIs trapped in olivine antecrysts it can still be assumed that the only processes changing the major element composition of the MI after trapping are olivine subtraction via crystallization (or addition via melting in some particular cases) and Fe-Mg exchange through diffusion from the outside melt, through the crystal and into the MI. This is clearly evidenced by the forward model in Figure 1B. All compositional changes suffered by each MI during the modelled post-entrapment processes follow a single path of olivine fractionation and addition, which is observable in variation diagrams (in mol%) of all major elements with the exception of FeO and MgO.
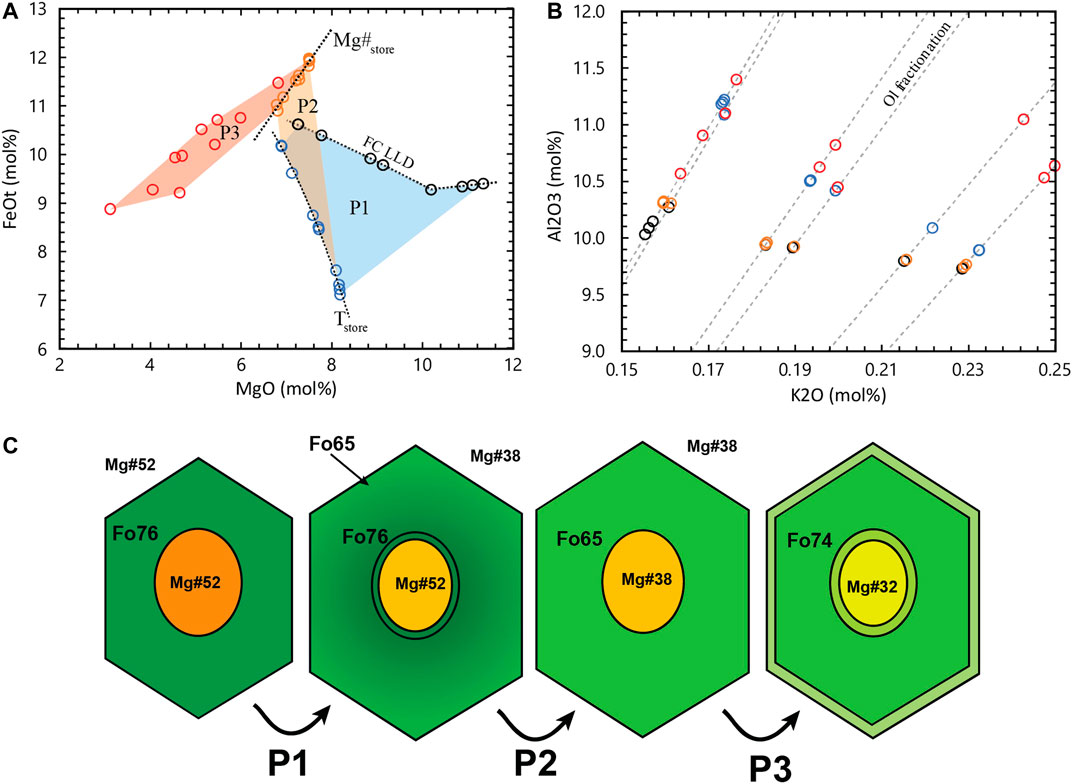
FIGURE 1. Forward model of post-entrapment compositional changes in long stored MIs. (A) MgO vs FeOt variation diagram. Black circles are the original MI compositions trapped during fractional crystallization of a magma batch. Blue circles are the composition of the MIs after P1 (PEC and Fe-loss during slow cooling) before reaching storage temperature Tstore. Orange circles are the MI compositions after P2 (re-equilibration to Mg#store) and red circles are the final MI compositions after P3 (PEC and Fe-loss during ascent and eruption). (B) K2O vs Al2O3 variation diagram. Grey hashed lines indicate the olivine addition/subtraction trend of the MIs. Symbol colors are the same as in (A). (C) Schematic cartoon of the evolution of one of the MIs with each phase of the post-entrapment history.
Geologic Background
To develop and test the novel PEC-correction methodology, olivine-hosted MIs collected from Akita-Komagatake (AK) volcano were analyzed. AK is an arc-front volcano in the Tohoku region of the NE Japan arc. The volcano is situated on the Okhotsk Plate. In the east, the Pacific Plate is subducted beneath the Okhotsk Plate (7–11 cm/yr; Northrup et al., 1995; Bird, 2003), at the Japan trench. Arc volcanism in NE Honshu has been located in the same position since c. 5 Ma (Martin, 2011; Yoshida et al., 2014). Caldera-dominated felsic volcanism related to NE-SW oriented compression shifted at c. 2 Ma to stratovolcano-dominated basaltic to andesitic volcanism associated with a change to the current ENE – WSW- oriented compression in NE Honshu (Acocella et al., 2008). The activity of AK began c. 74 ± 15 ka (Itaya et al., 1984), and its eruptive history can be divided into three main stages (Sutō and Ishii, 1987): 1) stratocone formation stage, 2) syn-caldera stage and 3) post-caldera stage. The compositions of AK products range from basaltic to andesitic (Nakagawa, 1985; Sutō and Ishii, 1987; Fujinawa et al., 2004; Ueki and Iwamori, 2017).
The AK sample investigated here corresponds to tephra fragments from the Hokubu 2nd pyroclastic cone deposits, believed to be associated with the c. 7 ka “AK-6” tephra layer (Wachi and Koshiya, 1997; Fujinawa et al., 2004; Kuritani et al., 2019). This unit has the highest MgO content found in this volcano (c. 6.6 wt% MgO; Fujinawa et al., 2004; Kuritani et al., 2019).
Methods
Analytical Methods
Whole Rock Major Element Composition
A glass bead was prepared from whole rock powder of the sample to perform XRF analysis. The sample was first cleaned in an ultrasonic bath with distilled water and dried in an oven at 100 °C for at least 2 h. The sample was then powdered in a tungsten grinding machine and kept in the oven at 100 °C for at least 2 h. Loss on ignition (LOI) was determined by weighting c. 2 g of powder before and after heating in an oven at c. 900 °C for 3 h. After heating, c. 0.8 g of the powdered sample was mixed with c. 8.0 g of lithium metaborate : lithium tetraborate (12 : 22) flux mixture, followed by fusion to produce a glass disc using a XRFuse2 electric fusion apparatus.
Major element concentrations were measured with a 1 kW Bruker Tiger S8 Series II XRF spectrometer at Massey University in Palmerston North, New Zealand. Interference-corrected spectra intensities were converted to oxide concentrations using calibration curves consisting of natural standards, closely approximating the mafic matrix of our samples. The long-term reproducibility of Oreas 24c standard reference material is better than ± 1% relative (1σ) for all elements except MnO, for which it is better than ± 1.5% relative.
Mineral and Melt Inclusion Glass Major Element Compositions
BSE imaging was used to assess textural features, e.g., formation of daughter crystals in the MI, Fe-rich olivine rims around the MI and Fe-Mg zonation of the olivine host. BSE images of the exposed MIs were obtained using a JEOL JSM-7000F field-emission scanning electron microscope (FE-SEM) at Hokkaido University, Japan. An acceleration voltage of 15 kV was used, with a beam current of 10 nA. The BSE images and greyscale profile of olivine crystals and their hosted MIs can be found in the Supplementary Material.
Mineral compositions were analyzed with a JXA-8230 SuperProbe Electron Probe Microanalyser (EPMA) at Victoria University, New Zealand. Plagioclase crystals were analyzed using a defocused beam of 10 µm diameter with an acceleration potential of 15 kV and an electron beam current of 12 nA. Pyroxene crystals were analyzed using a focused beam with an acceleration potential of 20 keV and an electron beam current of 30 nA. Counting times were 40 s on peak and 15 s on background for all elements in both mineral phases. Na was analyzed first to avoid Na migration. Precision and accuracy evaluation for these two mineral phases can be found in the Supplementary Material.
For olivine crystals, analysis spots were chosen in the vicinity of the MIs to better constrain equilibrium conditions, even though most olivine crystals showed homogeneous cores with narrow rims of higher Fe content in the BSE images (see Supplementary Material). A focused beam with acceleration potential of 20 keV was used with an electron beam current of 30 nA for Si, Fe, Mg, Mn and Ti, and 100 nA for Al, Ni, Ca and Cr. Counting times were 40 s on peak and 15 s on background for all elements but Ca, with 400 s on peak and 20 s on background. Accuracy and reproducibility of the analyses were constrained by alternated analysis of USNM2566 and JK3 olivine secondary standards during the session. Concentrations are accurate to <4% for major elements, < 35% for Mn, < 24% for Ni and <89% for Cr. Accuracy of Ca was usually <4% with a couple of analyses with c. 7%. Ti and Al values are usually below the detection limits for both standards. Reproducibility estimates (as 1σ) were <2% for major elements, c. 3% for Ni and Ca, c. 5% for Mn and c. 27% for Cr.
MI and interstitial glass compositions (Si, Ti, Al, Fe, Mn, Mg, Ca, Na, K, and P or Cr) were analyzed with an accelerating potential of 15 keV and an electron beam current of 8 nA. A defocused beam of 5–10 µm diameter was used and Na was analyzed first to avoid Na migration. Basaltic glass secondary standards (VGA99 and BHVO-2G) were analyzed periodically throughout the session to test for instrumental drift and to constrain accuracy and reproducibility of the analyses. Reproducibility estimates (1σ) are <1% for SiO2, Al2O3 and CaO, c. 2% for FeO and MgO, c. 3% for Na2O and K2O, c. 10% for TiO2, MnO and P2O5. Accuracies uncertainties are <1% for most SiO2 and Al2O3 secondary standard analyses, < 2% for most Al2O3, FeO, MgO and CaO analyses, < 3% for most K2O analyses, < 10% for most Na2O and TiO2 analyses and <20% for most P2O5 analyses.
Development of the MushPEC Algorithm
In the following sections, a group of MIs from a sample thought to be genetically related will be referred to as a MI set. The original (corrected) MI compositions within a set are expected to follow the same liquid line of decent (LLD) representative of the melt differentiation path.
The new PEC correction scheme relies on fitting the compositions of a MI set to LLDs generated by crystallization models. The script allows for the selection of fractional crystallization (FC) or equilibrium crystallization (EC) models. In this study we applied the FC model as it better represents the fractionation behavior of plagioclase, which is the main phase being crystallized during the magmatic differentiation of the studied sample (see below). This is due to the coupled NaSi – CaAl substitution, which hampers diffusive re-equilibration of plagioclase composition. However, we note that the effect of choosing EC instead of FC modeling on the resulting LLD compositions is very small for the level of differentiation along the tested differentiation trend.
Iterative FC simulations are modelled using the alphaMELTS2 front end (Smith and Asimow, 2005), which implements the rhyolite-MELTS algorithm version 1.2.0 (Ghiorso and Sack, 1995; Asimow and Ghiorso, 1998; Gualda et al., 2012). For each simulation, the MI compositions are adjusted by olivine addition in an attempt to get their composition as close as possible to the LLD of the FC model. The corrected MI compositions for each simulation are then compared and the best fit solutions are identified. This methodology has the advantage of not only providing corrected MI compositions, but also an estimation of the conditions of the fractional crystallization process (P, T,
To automate the alphaMELTS2 runs and the output analysis, a MATLAB® script called MushPEC was developed. The methodology typically involves the production of a few thousand FC simulations, which can be time consuming. The script includes the application of machine learning techniques to reduce the number of FC iterations needed by running FC models in cycles to make predictions of the behavior of the system.
In the Supplementary Material, the rhyolite-MELTS model is compared to crystallization experiments of a low-alkali tholeiitic basalt of similar composition to the MIs analyzed in this study (Takagi et al., 2005). This comparison shows that the rhyolite-MELTS model is remarkably accurate in reproducing the cotectic crystallization behavior of hydrous tholeiitic basalts at upper to middle crustal pressures.
Initial Parameters Selection
Modified compositions of the most primitive MI in a set are selected as starting compositions for the FC simulations. The most primitive composition corresponds to the MI for which the olivine fractionation trend is located the furthest to the left in a variation diagram with SiO2 or K2O in the abscissa. This MI has suffered the same post-entrapment processes than the rest of the MIs in the set and for each iteration its composition is modified to simulate different degrees of PEC and Fe-Mg redistribution suffered by the initial MI. All FC simulations are derived using a 5-dimensional grid of initial parameter combinations. Three of the parameters are related to the initial composition of the most primitive MI. The first parameter is the olivine addition (in mol%) to the initial MI, within a range of estimated amounts of PEC suffered by this MI. The second parameter corresponds to a value within an estimated range of the MgO/FeOt ratio of the initial MI, prior to PEC and Fe-Mg diffusion processes. The last compositional parameter is the H2O content of the initial MI composition. H2O concentration in the melt has a major effect on the crystallization path of the melt, especially on the liquidus temperature and composition of plagioclase. As explained above, MIs are susceptible to important changes of H2O concentrations (exsolution and diffusive exchange), making concentrations measured in the MI unreliable as a record of magmatic H2O contents. To make the initial H2O parameter independent of the olivine addition and initial MgO/FeOt parameters, the H2O concentration is set in mol% to the uncorrected MI composition. This way, the initial H2O parameter is comparable between models of different degrees of PEC and Fe-Mg diffusion of the initial MI. The other two parameters are pressure (P) and oxygen fugacity
FC Model Evaluation
After each FC model run, the output is used to calculate a best fit PEC correction solution for the MI set. This is done by finding the amount of olivine addition/subtraction required to bring each MI composition as close as possible to the modelled LLD (i.e. find the minimum compositional distance between the FC trend and the olivine addition trend for each MI in the set).
The definition of the Aitchison distance (Aitchison, 1986) is used for a D-dimensional compositional space or simplex
where
The clr transformation converts a composition from
To find the minimum distance between the two compositional trends, the sub-composition defined by the SiO2, Al2O3, CaO, K2O and (FeOt + MgO) components measured in mol% units is used. As explained earlier, the changes of FeOt and MgO contents of the MIs due to Fe-Mg exchange are not yet constrained, but it is known that the sum of both oxides is only dependent on the amount of PEC. The term PEC is used here to define total olivine crystallization/melting that occurs due to post-entrapment processes, including extra amounts due to liquidus temperature changes triggered by Fe-Mg exchange. These major elements are selected as they (with the exception of K2O) are the stochiometric components of the mineral phases crystallized from basaltic melts and their compositions are better modelled with rhyolite-MELTS. K2O is chosen as its high incompatibility makes its concentration representative of the mass subtraction during the FC process. MnO and P2O5 are minor oxides and not used in the calculation because of their scattered behavior and because of the limitations of modelling their partitioning behavior with rhyolite-MELTS. TiO2 is not used to avoid uncertainties associated with TiO2 incorporation in pyroxenes and the crystallization of Fe-Ti oxides by rhyolite-MELTS. Also, Na2O is omitted because of analysis errors due to possible Na2O migration during EPMA glass analysis and uncertainties generated by Na2O incorporation in pyroxene in rhyolite-MELTS models.
The minimum Aitchison distance from the FC trend to the olivine trend provides the amount of PEC needed by each MI in the set to reproduce the particular FC trend as closely as possible in subcompositional space. The combination of the minimum distances for all the MIs in the set can be used as a goodness of fit measurement to compare how well each trend generated from the FC simulations explains the MI set compositions. The root of the average squared Aitchison distance is taken as measurement of “goodness of fit”, GoF:
Here,
Figure 2 illustrates an example of the process of PEC correction for the AK MI set to a particular FC model. The 5-dimensional sub-compositions are represented with four variation diagrams of the main four components against K2O. The diagrams show the raw and corrected compositions of each MI connected through the olivine addition trends. The position of the corrected composition for each MI correspond to the closest point of the olivine addition trend to the FC model trend in 5-dimensional space.
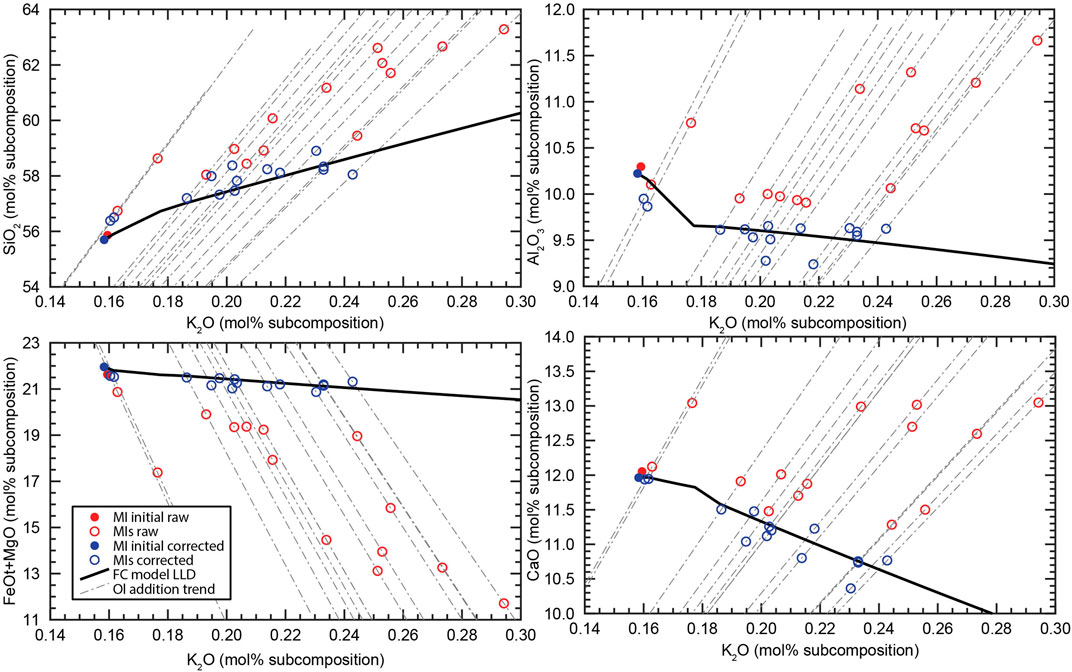
FIGURE 2. Variation diagrams (in mol%) as an example of potential PEC correction for one FC simulation. Components are re-normalized to the sub-composition defined by SiO2, Al2O3, FeOt + MgO, CaO and K2O. Red circles represent the raw MI compositions, and blue circles are the PEC corrected MI compositions. Filled circles indicate the composition of the MI used as initial composition of the FC model. Dashed grey lines indicates the trend of olivine addition-subtraction, and the black line is the LLD of one of the FC simulations generated in the rhyolite-MELTS iterations. The corrected compositions correspond to the closest point of each olivine addition trend to the FC model LLD, which is measured as the smallest Aitchison distance between the two compositional trends.
MushPEC automatically identifies initially water-saturated models and for models with the same combination of initial parameters besides H2O content, identifies the first time that initial water-saturation is reached and its solubility. All consecutive models with the same combination of parameters and water contents higher than the melt solubility are discarded to avoid redundancies. After correction, each model output is evaluated with a series of filters, to discriminate the possible solutions from discarded models. The first filter excludes all FC simulations that do not crystallize any olivine during fractionation. The second filter excludes models that need amounts of post-entrapment melting (PEM) during correction that are higher than a limit defined by the user. PEM is represented by negative values of PEC in the output. A third filter excludes model trends that evolve outside the area defined by the 2σ limits of the linear regression of the MI set trend in a CaO/K2O vs Al2O3/K2O variation diagram, in which the differentiation trend observed is not affected by olivine fractionation (see below). A fourth filter excludes models that start crystallizing plagioclase or pyroxene at the beginning of the model in absence of olivine. Models that are equivalent after reaching the cotectic crystallization, for example of olivine + plagioclase can be reproduced by different initial compositions that start from plagioclase-only or olivine-only crystallization, but it is known that for natural basalts in arc systems, olivine is the first phase to crystallize. Only models that pass all of these filters are taken as possible solutions.
Finally, the complete composition of the corrected MI is obtained by adding the corresponding mol% of olivine to the original MI composition and then adjusting the MgO and FeOt content by getting the MgO/FeOt from the closest point of the FC model LLD to the corrected MI composition. Olivine composition is taken as an ideal Fe-Mg solid solution, not including any minor or trace elements (e.g., Ca, Mn).
Machine Learning Algorithms
Machine Learning algorithms were implemented in MushPEC in order to optimize the number and density of FC simulations. To apply these algorithms, the models are run in grouped iterations or grids of initial parameters to make predictions after each group. First, minimum and maximum values for each of the five parameters (olivine addition, MgO/FeOt initial ratio,
Each FC model has two values that indicate its probability of being a possible positive result: (1) binary output of success or failing in passing the three filters described in the previous section and (2) the GoF value calculated from the distances of the corrected MIs to the FC model. These results are used as the response of the models during the training stage of the machine learning algorithms to predict the results of the next iteration of models.
First, a logistic regression method is employed. A logistic regression uses a logistic function to model a binary dependent variable. Figure 3A illustrates how a logistic regression fits the logistic function for the simple case of one independent variable (input parameter) with a binary dependent variable (0 or 1). Using the first grid as the training set, where the five initial parameters are taken as the input parameters and the binary output of the filters is used as the response (true or false). To avoid most of the false negatives, the cutoff or limit of the logistic regression for positive predictions (the model is predicted to pass all filters) is set to a probability of 5%.
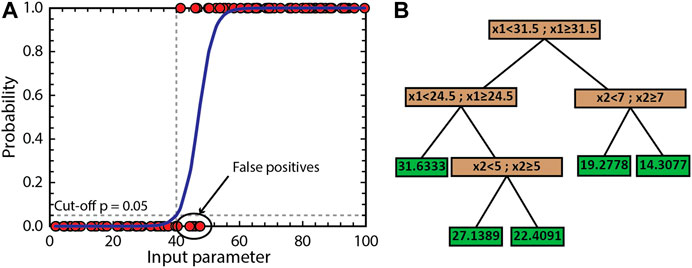
FIGURE 3. Schematic examples of the machine learning methods used in MushPEC. (A) Logistic regression of a simple one-variable system. Filled red circles correspond to the observations used as training set. Blue line is the logistic function modelled to explain the data. The cut-off probability is set to 0.05 to minimize false negatives, which in turn maximizes false positives. (B) Example of regression tree modified from MathWorks documentation for a system with 2 variables (x1 and x2). Brown boxes correspond to the branches that define the partitioning conditions, and the green boxes correspond to the leaves or nodes that assign the response value.
In a second step, the models of the first grid that pass all filters are selected to train a regression tree model. A regression tree is trained to predict the behavior of a system that contains a single numerical output variable (response) and multiple numerical or categorical input variables (predictors). The construction of a regression tree uses a binary recursive partitioning method applied to a training data set. The training data set is split into branches until the last partition reaches a minimum size defined by the user or when the sum of squared deviations from the mean is zero. The last branches with no partitions are known as nodes or leaves. The leaf size is the number of elements in the training set that belong to the particular leaf. Figure 3B illustrates a simple example of a regression tree. In MushPEC, the GoF values for the previous iterations are used as the response or output variable, with the aim to predict the GoF values of the next iteration. As with the logistic regression, the five input parameters are used as the input variables to train the regression tree. A fine tree is used, with a minimum leaf size of 4. There are no overfitting issues with the application of the regression tree algorithm for this particular use as the compared outputs are all generated by the same modelling algorithm (rhyolite-MELTS).
After both machine learning models are trained, the second grid is evaluated with both models to predict models that pass the filters and have low GoF values. Only the models that are predicted to pass the filters and that are predicted to have GoF values between a percentage of the lowest values of the grid are run. After each grid is completed, the percentage of lowest GoF values is reduced as models converge towards the best solutions. After the second iteration the logistic regression and the regression tree models are updated by adding the new results. The models from the second grid that did not pass the predictions in the previous iterations are re-evaluated with the updated models and models that are now predicted to pass the filters are run. This process is repeated until no more models of the second grid are predicted to pass the filters. The process is repeated for each grid until the final grid is completely evaluated. The first grids, which have less nodes and wider steps, have a higher probability to define models far away from the solution, which may cause a low number of models pass the filters, producing few to no models predicted by the machine learning algorithms. To avoid this, the filter evaluation is deactivated when more than 95% of the run models of a grid fail the filtering process.
Testing MushPEC in a Synthetic MI Set
Before using the MushPEC algorithm on a natural MI set, the method was tested on the modelled MI set of Figure 1. The resulting MI compositions after phase P3 were loaded into the MushPEC script to test if the methodology could successfully recover the original compositions of the MI set under ideal conditions (i.e. it was known that the MI set represented a perfect FC LLD reproducible with rhyolite-MELTS, and there was no scatter in the compositional data). The initial compositions of the MIs and the conditions of the FC model are listed in Table 1. A first run was tested using a wide grid of initial parameters (0 to 8 mol% olivine addition, 0.8 to 1.6 MgO/FeOt ratio, 0 to 400 MPa, −2 to 2 ΔQFM and 2 to 10 mol% H2O). A second finer grid was run around the conditions that showed the best fits (2 to 4 mol% olivine addition, 0.9 to 1.22 MgO/FeOt, QFM to QFM -2, 50 to 250 MPa and 5.4 to 8.6 mol% H2O).
Figures 4(a) and 4(b) show the minimum GoF behavior as a function of P and H2O and as a function of olivine addition and MgO/FeOt ratio, respectively, and Figure 4C shows the LLD and corrected MI compositions for the best fit models. The results show that MushPEC can accurately find the FC models that provide the best fits to the corrected MI data. Convergence of P, H2O and
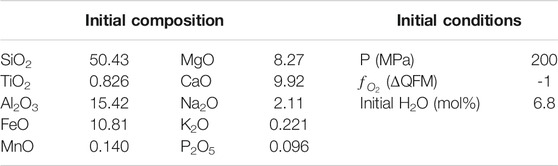
TABLE 1. Initial composition (wt%) and conditions of the FC rhyolite-MELTS model used as test for the MushPEC algorithm.
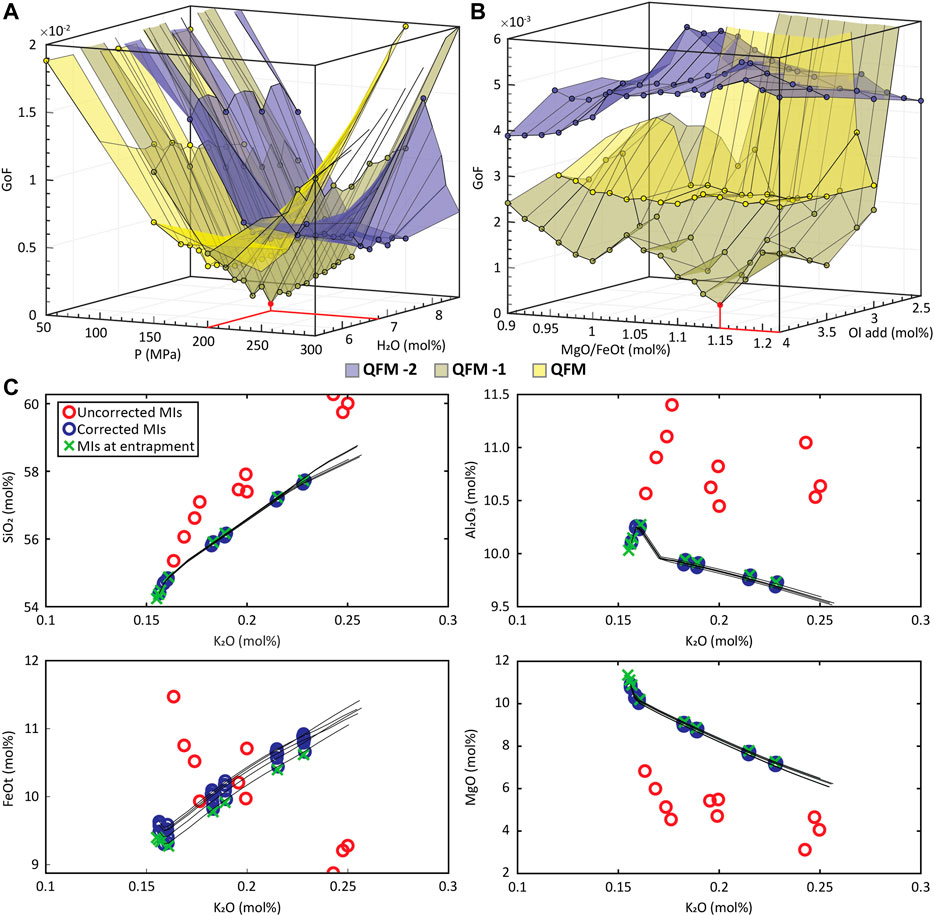
FIGURE 4. MushPEC output of the test on the synthetic MI set of Figure 1 of the main text. (A) Minimum GoF behavior with changes in P and H2O content. Each colored surface corresponds to a condition as indicated in the figure. Minimum GoF is marked in red, and it is found at 200 MPa and 6.8 H2O in the QFM -1 surface. (B) Minimum GoF behavior with changes in olivine addition and MgO/FeOt ratio. Minimum GoF is marked in red, and it is found at 4 mol% olivine addition and 1.15 MgO/FeOt in the QFM -1 surface. (C) Variation diagrams of the 5 best fit models found. Red circles are the uncorrected MIs loaded into the MushPEC script, and blue circles are the corrected compositions for each of the 5 bet fit models. Black lines are the LLD's of the best fit FC models and the green crosses are the original MI compositions before modification by the forward post-entrapment model.
Results
AK Sample Petrography and Geochemistry
The tephra sample has a vesicularity of c. 52 vol% (Figures 5A,B). The rest of the sample constitutes of c. 75 vol% groundmass and c. 25 vol% crystals. Plagioclase is the most abundant mineral phase (c. 87 vol% of crystals), followed by olivine (c. 12 vol%) and scarce clinopyroxene. Plagioclase compositions are within An69–92, olivine compositions have a very narrow range of Fo77–79 and clinopyroxene compositions are En51–55Fe10–14Wo32–39 (detailed results of the mineral chemistry can be found in the Supplementary Material). The groundmass is glass-rich with microlites of plagioclase, olivine, and a lesser amount of pyroxene. Groundmass glass analyses show compositions of similar degree of differentiation (SiO2 and K2O concentrations) to some of the analyzed olivine-hosted and the plagioclase-hosted MIs. However, FeOt contents of the groundmass glass are higher.
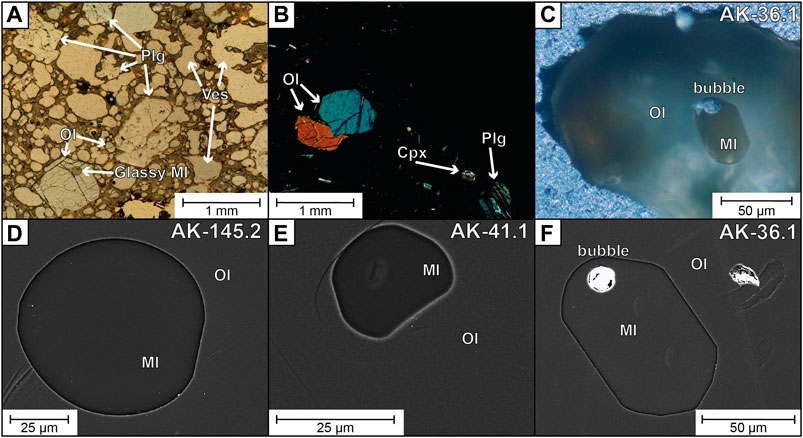
FIGURE 5. Photographs of the AK sample. (A) Thin section parallel polarized light microphotograph. (B) Thin section cross-polarized light microphotograph. (C) Oblique light microphotograph of olivine-hosted MI. (D) to (G) BSE images of olivine-hosted MIs. (C) and (G) correspond to the MI used as initial composition during modelling, and (D) and (F) are MIs with evidence for low and high PEC, respectively (see text). Plg = plagioclase, Ol = olivine, Cpx = clinopyroxene, MI = melt inclusion, Ves = vesicle.
Olivine crystals are euhedral to subhedral, with unzoned cores and narrow Fe-rich rims likely generated during ascent and eruption. Olivine-hosted MIs are glassy, some with shrinkage bubbles that comprise <6 vol% of the MI (Figures 5C–F). MI diameters range from c. 15 to 150 µm. Some plagioclase-hosted MIs were also analyzed from the thin section of sample AK, hosted in plagioclases of An80–90 (see Supplementary Material). Olivine-hosted MI, sample whole rock and estimated melt fraction compositions are shown in Table 2 in wt%, whereas the compositions are plotted in mol% in the variation diagrams of Figures 6 and 7. The composition of the melt fraction of the sample was estimated by subtracting the composition of the crystal cargo from the whole rock composition, using the measured volume abundances and average compositions and densities of the mineral phases.
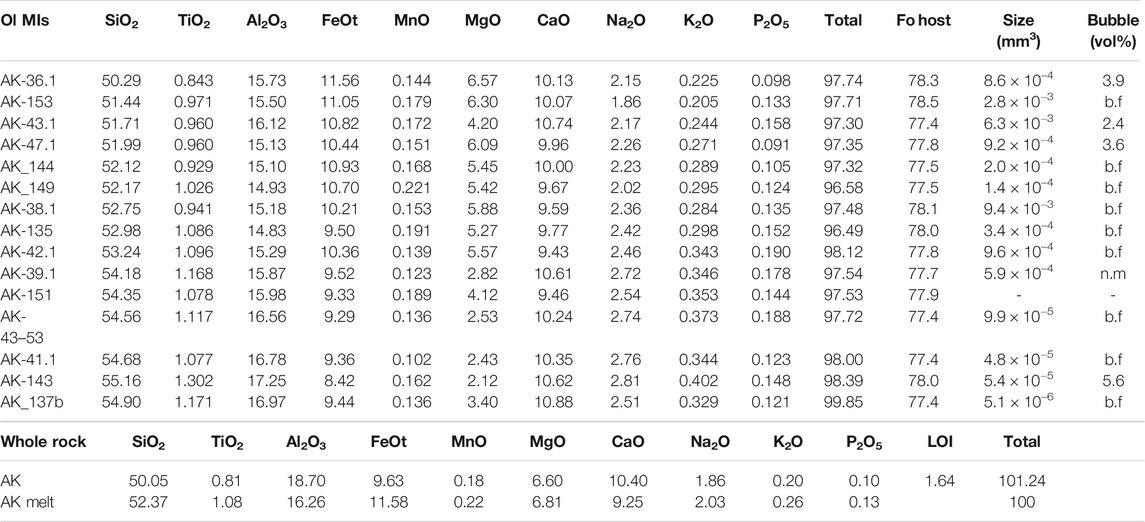
TABLE 2. Uncorrected MI major element compositions from EPMA and major element whole rock compositions from the AK sample in wt%. AK melt fraction was calculated with mass balance, using the mineral compositions and abundances measured in the thin section. Forsterite composition of olivine-hosts calculated from the EPMA olivine analyses. MI and bubble sizes were estimated by using the measured diameters.
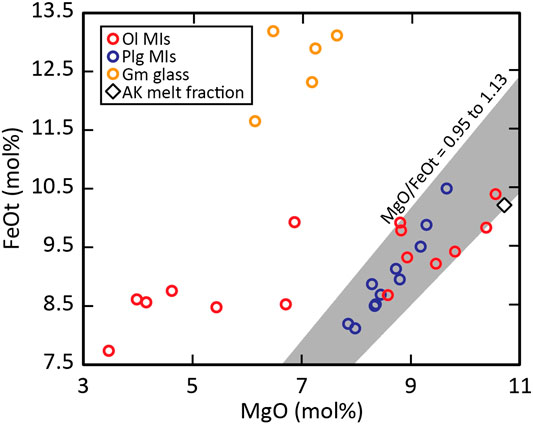
FIGURE 6. MgO vs FeOt variation diagram of all glass analyses of the AK sample. The red circles are the uncorrected olivine-hosted MIs, the blue circles are the plagioclase-hosted MIs, the yellow circles are the groundmass glass analyses and the less PEC affected olivine-hosted MIs, the plagioclase-hosted MIs and the estimated AK melt fraction composition follows a path of narrow MgO/FeOt ratios between 0.95 and 1.13, marked by the grey area.
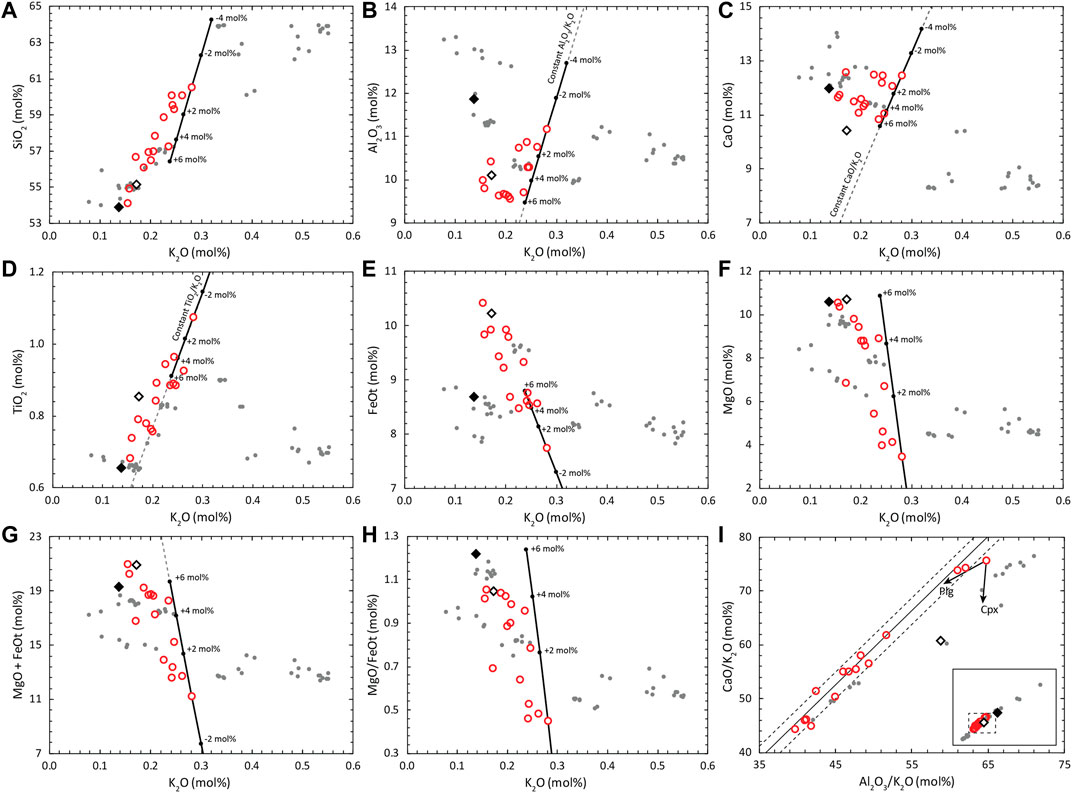
FIGURE 7. Variation diagrams of major element components (in mol%) of the MIs of the AK sample. Red Circles are the uncorrected MI compositions, the filled black diamond indicates the whole rock composition of the sample from which the MIs were collected, the hollow diamond corresponds to the AK melt fraction composition estimated through mass balance, and the grey dots are whole rock data of the AK volcanic system from the compilation found in Kuritani et al. (2019). The black line with circles is the trend of olivine addition for one of the MIs, where proportions of addition are indicated for -4, -2, 2, 4 and 6 mol%. The composition of the olivine has no effect in the olivine addition trend for (A) to (D) and (G), whereas an olivine composition of Fo78 was used to calculate the trends in (E) and (F). Fractional crystallization trends in (I) are unaffected by olivine fractionation, i.e. they do not change with PEC of olivine in the MI rims. Grey continuous line in (I) is the linear regression of the MI data, and the dashed lines mark the standard deviation (±1σ). Arrows in (I) indicate approximated trends of fractionation of plagioclase and clinopyroxene. Dashed grey lines indicate constant ratios of conservative elements during olivine addition/subtraction.
Application of MushPEC to the AK Sample
Pre-Assessment of the MI Set
We used the AK MI set to test MushPEC, but first the set needed to be evaluated to identify the antecrystic origin of the hosts. The main geochemical evidence for the antecrystic nature of these host olivine crystals and their re-equilibration of Fe-Mg is:
All MIs in the set are more differentiated than the estimated melt fraction of the whole rock sample (higher SiO2 and K2O contents; Figure 7A). In addition, even though the melt fraction composition is similar to the most primitive MIs, the lower CaO contents of the melt fraction indicates that this melt is not equivalent to the one that produced the MIs.
All olivine crystals have flat zonation patterns, and their compositions fall between a narrow range (Fo77.4–78.5), whereas the silica range of their hosted MIs is wide (51.5–56.1 wt% SiO2).
TiO2 increase and FeOt decrease with differentiation in the MIs (Figures 7D,E). The TiO2 trend indicates absence of Fe-Ti oxides fractionation. For a basaltic melt that does not fractionate Fe-Ti oxides, FeOt is expected to increase with fractionation of an olivine + pyroxene + plagioclase assemblage. As this is accompanied by MgO decrease, re-equilibration to a fixed Fe/Mg ratio will produce a decreasing trend of FeOt without affecting TiO2.
Half of the MI compositions have FeOt concentrations higher than the whole rock tephra sample. The classical model of trapping followed by quick transport and eruption of MIs should only produce a decrease in FeOt concentrations, resulting in a MI trend of depleted FeOt compared to the whole rock trend.
Plagioclase-hosted MIs form a clear trend in the MgO vs FeOt variation diagram (Figure 6) with narrow MgO/FeOt range, which overlaps the MgO/FeOt ratios of the olivine-hosted MIs less affected by PEC and the estimated AK melt fraction composition. Fe and Mg diffusion in plagioclase have been shown to be fast enough to affect MI compositions (Costa et al., 2003; Drignon et al., 2019), and as MgO/FeOt ratios in the plagioclase MIs are not affected by PEC, plagioclase-hosted MIs should preserve their MgO/FeOt ratios during storage. This suggests that olivine- and plagioclase-hosted MIs were re-equilibrated to a constant MgO/FeOt ratio; with interstitial melt, comparable in composition to the estimated melt composition of the AK sample, prior to ascent and eruption. The groundmass glass composition has a similar degree of differentiation indicated by its SiO2 and K2O contents, and most major element contents overlap with the olivine-hosted MI compositions with the exception of FeOt. The groundmass glass is enriched in FeO for MgO concentrations similar to those in the olivine-hosted MIs indicating a crystallization path consistent with the absence of Fe-Ti oxides and the presence of FeO-rich olivine rims.
In Figure 7, the effects of PEC on some of the MIs that displace them from the differentiation trend of the melt can be identified. Black lines with circles in the variation diagrams indicate the compositional change produced by olivine addition (in mol%) to one of the MIs. As stated above, this trend is independent of olivine composition for all components except for MgO, FeOt and MgO/FeOt (Figures 7E,F,H). To show the approximate behavior of olivine addition for those two components and their ratios, the trend was calculated using a Mg olivine-host composition of Fo78.
Al2O3 and CaO variation diagrams show that higher PEC results in higher concentrations of these incompatible components in the MI. The MI set can be divided in two groups of high- and low-PEC on basis of their Al2O3 and CaO concentrations. This separation is also consistent with the MgO + FeOt plot (Figure 7G) and the SEM images of the MIs (Figure 5 and Supplementary Material) where low Al2O3 MIs have less bright olivine rims indicative of low PEC. The division of both groups is less clear in the SiO2, TiO2 and Na2O diagrams (the latter not shown), as olivine fractionation trends in these diagrams are less oblique relative to the MI set (subparallel for TiO2).
The trend followed by the low-PEC group might approximate the original differentiation trend of the magma batch before PEC effects if the PEC of those MIs are negligible, but it may also be affected by different degrees of PEC within the low-PEC group generating a “pseudo-LLD”. One way to study the LLD of the MI set without the effect of PEC (olivine fractionation) is to analyze trends of ratios of components that are conservative during olivine fractionation against a conservative element for the whole system. Figure 7I shows CaO/K2O plotted against Al2O3/K2O. Here, the trends are not affected by olivine (and orthopyroxene) fractionation, but are affected by plagioclase, clinopyroxene and spinel. From the TiO2 variation diagram it is clear that spinel is not part of the crystallization assemblage for the MI set considered, so it can safely be assumed that the trend is caused by the combination of plagioclase and clinopyroxene fractionation. The TiO2 trend break indicative of the start of Fe-Ti oxide fractionation occurs at around 0.3 K2O wt% in the whole rock data, which are placed at more evolved compositions than the MI set. Arrows in Figure 7I indicate the approximate direction of evolution during fractionation of these phases, which are shifted slightly with anorthite composition (for high An contents expected in basaltic magmas) and Ca and Al contents in clinopyroxene. From this plot, it can be hypothesized that the trend formed by the four most primitive MIs indicates that plagioclase crystallization starts before clinopyroxene.
As the correction scheme relies on fitting a differentiation trend and not just one MI composition, it is crucial to select a proper MI set, where the MIs can successfully represent the LLD of the melt they were formed in. Extensive PEC and Fe-Mg diffusion can obscure a clear LLD for the MI set. A linear relationship of highly incompatible elements that approximate a line that crosses through the origin is a good indication that the MIs are associated with the same parental magma. Using K2O concentrations and available trace or volatile elements like F and Cl are very useful for this purpose, as F, Cl and K2O are highly incompatible in basalts and are expected to behave conservatively in MIs, meaning that their concentrations during differentiation vary in the same way and are inversely proportional to mass fractionated during crystallization. Due to the lack of trace element and volatile data, the conservative element comparison is here done only with major elements. As mentioned above, the clear and steady increase of TiO2 with increasing K2O is indicative of the absence of Fe-Ti oxides during the FC process, and TiO2 should behave almost conservatively, with small amounts being incorporated in pyroxene. In Figure 7D, a linear regression forced through the origin in the TiO2 vs K2O plot for the MI data, has an R-squared (R2) value of 0.99. P2O5 should also have a conservative behavior if there is no evidence of apatite fractionation, but scatter may obscure the trends. The clear break of the behavior of TiO2 at K2O contents >0.3 mol% for the whole rock data from the literature is consistent with the idea that the main process of differentiation for the Akita-Komagatake volcanic system is fractional crystallization. Other processes like magma mixing or boundary layer fractionation (Nielsen and DeLong, 1992; Kuritani, 2009) should produce straight mixing lines or smoothed curves in variation diagrams of oxides affected by changes in the fractionated phases during differentiation.
Initial Parameter Selection
The AK-36.1 MI is used as the initial composition of the set as it corresponds to the most primitive MI in the set (Figure 5). A first run of MushPEC was used to find the initial parameter space where the solutions could be found. In this run pressures of 0.1 to 400 MPa, initial H2O contents from 0 to 8 mol%, and
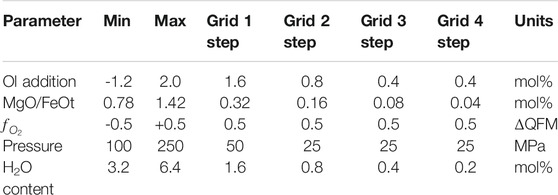
TABLE 3. Values used to define the grids of initial parameters.
Solution Convergence and Sensitivity Analysis
Figure 8 shows the convergence behavior of GoF with respect to the initial parameters for the AK MI set. The different colors correspond to surfaces that show the behavior of minimum GoF values for each particular
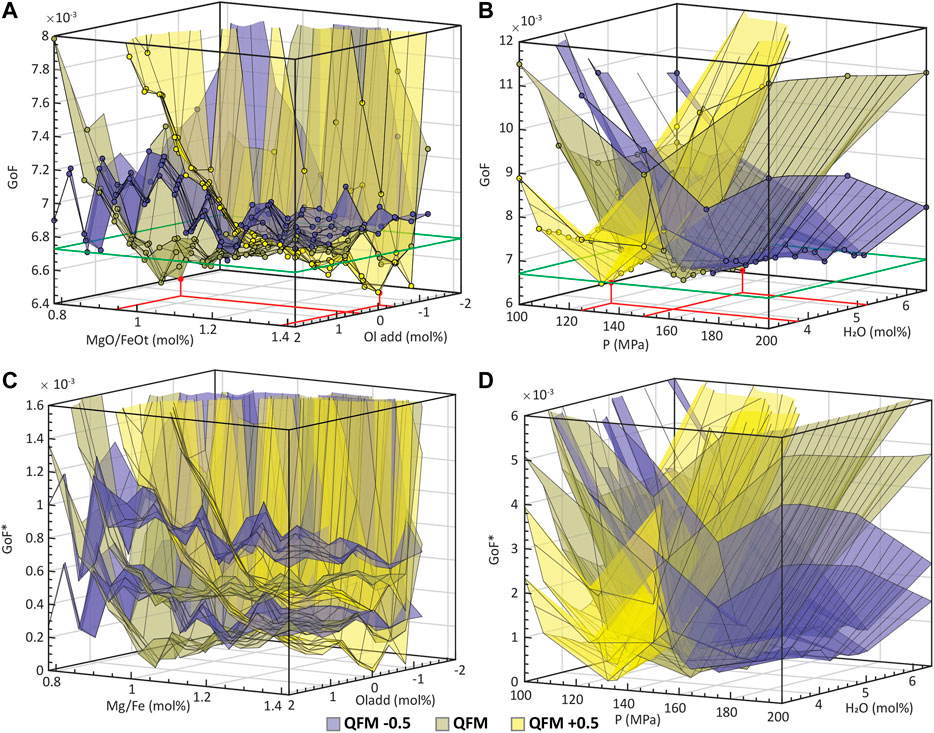
FIGURE 8. (A) and (B) show the convergence behavior of the GoF parameter with respect to the initial parameters of the MushPEC run for the AK MI set. Each colored surface represents the minimum GoF values for a fixed
The GoF value is a lot less sensitive to changes in the MgO/FeOt ratio and olivine addition parameters (Figure 8B). In agreement with Figure 8A, the minimum GoF values are generally lower at the QFM buffer (at 0.4 mol% olivine addition and 0.88 MgO/FeOt ratio), slightly higher at more reduced conditions (QFM -0.5) and converging to similar minimum at QFM +0.5 (at -0.4 mol% olivine addition and 1.38 MgO/FeOt ratio). The steep increase in GoF values towards negative PEC and low MgO/FeOt values is related to the filtering of models reaching the cotectic from the plagioclase-only crystallization side as discussed in the test results of the synthetic MI set. Along the high PEC and high MgO/FeOt corner, GoF values are stable and similar between the three
The main problem of using the Aitchison distance as a measure of compositional similarity is that the significance of the difference in GoF values between FC models cannot be easily interpreted. What is the smallest difference in GoF between two models that can be interpreted as one model yielding a significantly better fit than the other? This is of main importance to identify if the small “valleys” observed in the olivine addition vs MgO/FeOt plot are significantly better fits than the other conditions. The main source of uncertainty on the GoF value is attributable to the arbitrariness of the MI set used in the fitting process. The natural scatter of geochemical data has an effect on the final GoF values obtained by the method and is dependent on the quality and quantity of the MI data used. To analyze how the relative values of GoF can vary with the use of different MI sets, the correction method was applied to random subgroups of the MI set, and statistical analysis of the same surfaces of minimum GoFs was used to estimate uncertainties, which in turn helped to assign a minimum GoF difference that may be interpreted as a significant difference in GoF. The correction scheme was applied to 200 randomly generated subgroups (with no repetitions) of the 14 MIs in the set (without counting the initial composition) using a total of 7 to 13 MIs. To compare the relative differences between GoF values of the different subgroups, a relative GoF (GoF*) was calculated by setting the minimum GoF obtained for each subgroup to GoF* = 0. Histograms with all the GoF* values for each point in each surface of minimum GoF* were constructed and the 68.2% confidence interval around the median (equivalent to the confidence interval of 1σ in a normal distribution) was identified for each histogram. The two planes that define the confidence interval were plotted as the uncertainties of the GoF* values (Figures 8C,D). There is an overlap of uncertainties of the three oxygen buffers. The distance from the median to the upper uncertainty limit of the minimum GoF point is 2.5 × 10⁻⁴, which defines the range of possible solutions above the minimum GoF. The green line around the boxes of Figures 8A,B indicate the uncertainty limit for probable solutions.
Discussion
Initial Limitations
As MushPEC relies on FC simulations using the alphaMELTS2 front end, it has the same limitations of the rhyolite-MELTS algorithm. Rhyolite-MELTS is unable to model some hydrous phases (e.g., amphibole, biotite), but for most basaltic MI sets it is expected that such phases are not present. The success of modelling the crystallization and composition of Fe-Ti oxides is uncertain, and any evidence of fractionation of these minerals in the MI set (e.g. TiO2 fractionation) would indicate that the validity of the model output will have to be carefully considered. Fe-Ti oxides are absent in the AK sample and the incompatible behavior of TiO2 shown by the increasing TiO2 with differentiation indicates that Fe-Ti oxides are not involved during fractionation and MI entrapment. The whole rock trend from the literature indicates that Fe-Ti oxide fractionation starts at c. 0.3 wt% K2O.
Another limitation of this methodology is that cotectic crystallization of olivine with another mineral phase is required. The algorithm relies on finding the closest point between two compositional trends (the LLD of the FC model and the olivine addition trend of a MI), and both trends must be oblique to each other. This means that the crystallizing phase assemblage of the FC simulation must include mineral phases like plagioclase or pyroxene, in addition to olivine. This makes the methodology applicable to high silica basaltic and basaltic andesitic MI glass compositions, where olivine is not the only phase being fractionated at the time of MI trapping.
External Constraints on MgO/FeOt and Magmatic Implications for the AK Sample
The weak convergence of the GoF values with respect to MgO/FeOt ratios and the strong dependence of this parameter on the
Even though a genetic relationship between the carrier melt and the MIs is unlikely due to discrepancies in their CaO contents (see above), the compositional similarity of the other oxides makes it probable that the FeOt and MgO contents are close to the original MI contents at the moment of entrapment. The probable solutions found in the previous section were filtered so that the probable model LLDs fall close to the carrier melt composition in the FeOt vs K2O variation diagram. Figure 9 shows variation diagrams with the filtered solution LLDs and corrected MI compositions. As predicted by the variation diagrams of the uncorrected MIs, low Al2O3 MIs are almost unaffected by PEC, but their FeOt concentrations are corrected towards an ascending trend with differentiation, in agreement with what is seen for the groundmass glass compositions and with what is expected for tholeiitic basalts that have not started fractionating Fe-Ti oxides. Table 4 shows the range of compositions and PEC predicted by MushPEC. All estimated compositions can be found in the Supplementary Material. PEC corrected values were also calculated using Petrolog (see Supplementary Material). Results show similar amounts of PEC in mol% of olivine at the QFM oxygen buffer, but consistently higher in c. 0.3 to 1.3 mol% of olivine in the Petrolog results. As olivine compositions are very similar and no detailed compositional profiles were produced for the MIs in this study, the FeOt value for the correction was set to the highest FeOt in the set (11.56 wt% for AK-36.1). This generated a horizontal trend for MgO and FeOt in the variation diagrams, contrasting with the increasing and decreasing trends estimated with MushPEC for FeOt and MgO, respectively. This result suggests that complete re-equilibration during storage had little effect on the amount of total PEC before ascent and eruption; similar to what its shown by the model in Figure 1, where PEC suffered during slow cooling is compensated by PEM, which is triggered by re-equilibration during storage.
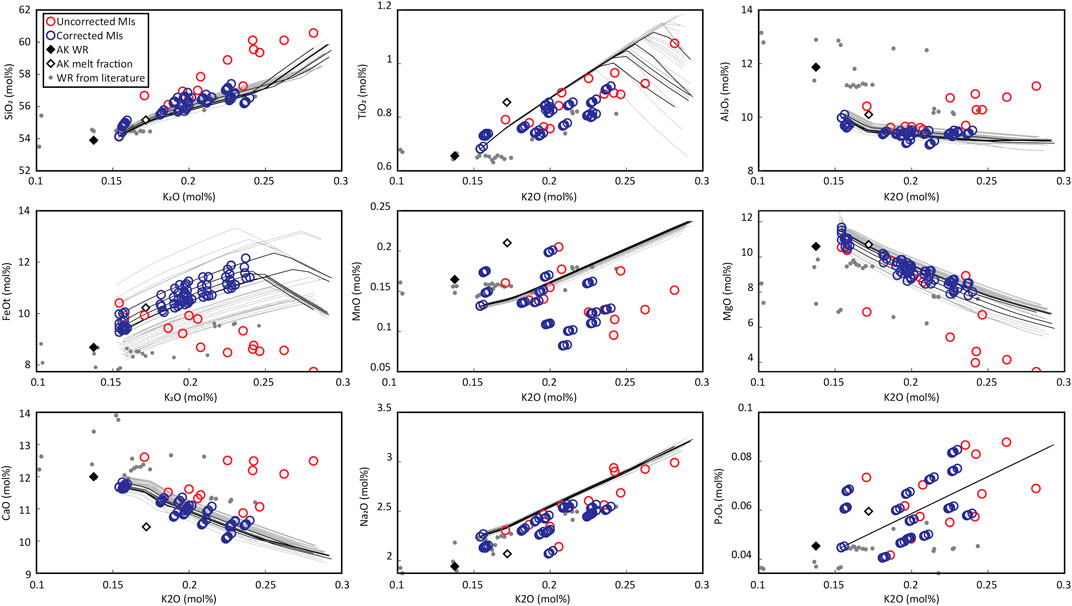
FIGURE 9. Variation diagrams of the corrected MIs. Red circles are the uncorrected MI compositions. The grey lines indicate the FC models that are below the GoF 1σ limit of Figure 8. Black lines are the FC models filtered by their intersection with the estimated melt fraction composition (white diamond). Blue circles are the corrected MI compositions for each of the models defined by the black lines.

TABLE 4. Compositional range of corrected MIs from AK using the MushPEC algorithm.
Water contents and temperatures at entrapment of the most primitive MI in the set (at c. 51 wt% SiO2) predicted by MushPEC are c. 1.2 wt% H2O and c. 1150 °C, reaching c. 1.8 wt% H2O and c. 1100 °C at the most differentiated MIs (c. 52.3 wt% SiO2). However, the presence of some plagioclase compositions greater than An90, significantly higher than those predicted by MELTS (up to An84), suggests that some plagioclase antecrysts are grown at higher H2O contents and greater pressures levels within the Akita-Komagatake plumbing system, as envisaged by Kuritani et al. (2019). They predicted considerably higher H2O contents and lower temperatures for the same Akita-Komagatake unit using MIs trapped in high-Ca plagioclase (c. An90), estimating c. 4.4 wt% H2O and c. 990 °C at c. 52.8 wt% SiO2. These anorthitic plagioclases could have been carried up to the shallow mush storage region where the MIs we modelled were entrapped. Therefore, the water contents of the magmas estimated by Kuritani et al. (2019) may represent those at deeper levels before the equilibration at the shallow levels at c. 120-150 MPa.
The mineral assemblage fractionated during crystallization of the melt can be estimated from the mineral assemblage fractionated in the FC models. Figure 10 shows the behavior of the GoF with respect to the mineral assemblage fractionated from the most primitive to the most differentiated MI in the set. The best fit solutions are found at c. 50–55 wt% plagioclase, with c. 30–40 wt% clinopyroxene and c. 10 to 20 wt% olivine, without any orthopyroxene or Fe-Ti oxides. The mineral phases present in the AK sample are the same as the phases appearing in the model, but the low clinopyroxene : olivine ratio of the AK sample contrasts with the high abundance of clinopyroxene over olivine in the modelled mineral assemblage. This discrepancy could be generated by different magmatic processes. For example, preferential clinopyroxene melting during infiltration of the accumulated crystals by the new magma batch can deplete the crystal cargo of clinopyroxene. The FC models show that plagioclase crystallization starts before clinopyroxene suggesting that during magma recharge, clinopyroxene would be the most unstable mineral phase. Other explanations include mush zone phase assemblage heterogeneity or preferential uptake of plagioclase and olivine during remobilization and ascent.
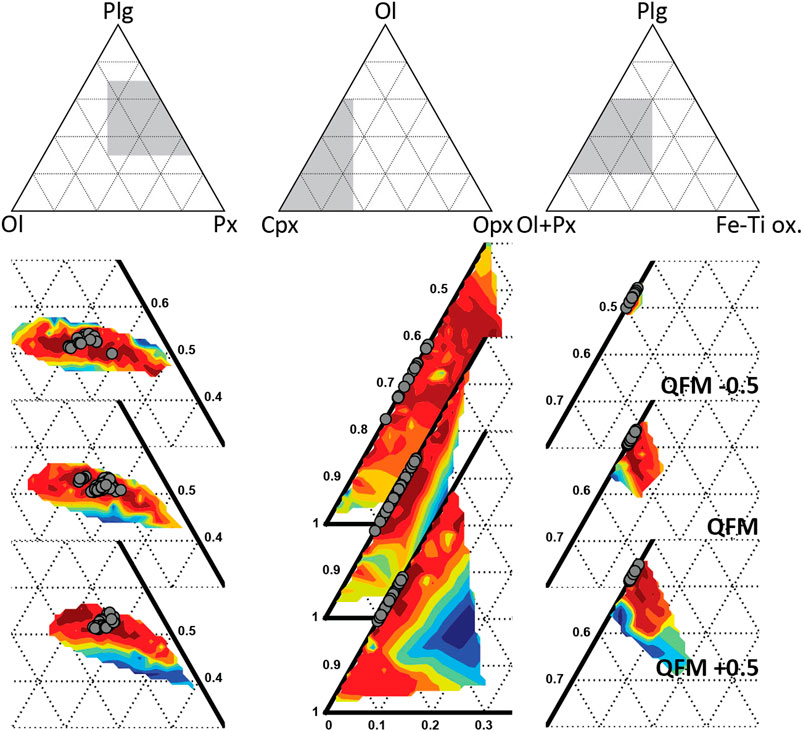
FIGURE 10. Proportions of fractionated phases of the FC models at different
Conclusion
MushPEC can be used to successfully estimate PEC-corrected MI compositions from a set of genetically related MIs hosted in antecrystic olivine by fitting the MI compositions to FC models. A major implication of the development of this methodology is that it expands the universe of MI data that can be used for studying the compositions of primary magmas and their volatile contents.
The strong dependency of the MgO/FeOt of the corrected MI compositions on small changes in
MushPEC takes advantage of the rhyolite-MELTS algorithm to estimate crystallization conditions of the magma batch that fractionated the studied antecrysts, including pressure, H2O content and
The olivine-hosted MIs from the AK sample were trapped during a fractional crystallization process at shallow depths (c. 125–150 MPa), low water contents (c. 1–2 wt% H2O) and
MushPEC is limited in its applicability to natural systems. It is applicable to magmatic systems where FC is the dominant differentiation process, where its crystallization conditions can be reproduced with the rhyolite-MELTS algorithm and where external constrains on the MgO/FeOt ratio or
Data Availability Statement
The original contributions presented in the study are included in the article/Supplementary Material, further inquiries can be directed to the corresponding author.
Author Contributions
RB developed the MushPEC code and wrote the manuscript. GZ provided key input and discussion for the development of the code and the manuscript. TK provided access to sample material, laboratory access and assistance at Hokkaido University, as well as significant input and discussion for the manuscript. DC provided helpful discussion for the statistical analysis of compositional data tools used by the MushPEC algorithm. MN provided access to sample material and access to sample preparation facilities at Hokkaido University. HY and NS provided access to laboratories at Hokkaido University and assisted with SEM analysis, respectively. ES provided sample material used in this study.
Funding
This research and the PhD scholarship to RB were funded by the Royal Society of New Zealand through the Marsden Fund (grant MAU1704 to GFZ).
Conflict of Interest
The authors declare that the research was conducted in the absence of any commercial or financial relationships that could be construed as a potential conflict of interest.
Acknowledgments
Many thanks to Ian Schipper for the help with the EPMA work at Victoria University, to Vadim Kamenetsky for important insights into olivine-hosted melt inclusions, to Eduardo Morgado for helpful discussion about diffusion processes in olivine and to Paul Asimow and Paula Antoshechkina for their comments regarding the rhyolite-MELTS algorithm and alphaMELTS2 use.
Supplementary Material
The Supplementary Material for this article can be found online at: https://www.frontiersin.org/articles/10.3389/feart.2020.599726/full#supplementary-material.
References
Acocella, V., Yoshida, T., Yamada, R., and Funiciello, F. (2008). Structural control on late Miocene to Quaternary volcanism in the NE Honshu arc, Japan. Tectonics. 27 (5), TC5008. doi:10.1029/2008TC002296
Aitchison, J. (1986). The statistical analysis of compositional data. London, United Kingdom: Chapman and Hall.
Asimow, P. D., and Ghiorso, M. S. (1998). Algorithmic modifications extending MELTS to calculate subsolidus phase relations. Am. Mineral. 83 (9), 1127–1132. doi:10.2138/am-1998-9-1022
Aster, E. M., Wallace, P. J., Moore, L. R., Watkins, J., Gazel, E., and Bodnar, R. J. (2016). Reconstructing CO2 concentrations in basaltic melt inclusions using Raman analysis of vapor bubbles. J. Volcanol. Geoth. Res. 323, 148–162. doi:10.1016/j.jvolgeores.2016.04.028
Bird, P. (2003). An updated digital model of plate boundaries. Geochem. Geophys. Geosyst. 4 (3). doi:10.1029/2001GC000252
Blundy, J., and Cashman, K. (2001). Ascent-driven crystallisation of dacite magmas at mount St Helens, 1980–1986. Contrib. Mineral. Petrol. 140 (6), 631–650. doi:10.1007/s004100000219
Blundy, J., Cashman, K. V., Rust, A., and Witham, F. (2010). A case for CO2-rich arc magmas. Earth Planet Sci. Lett. 290 (3–4), 289–301. doi:10.1016/j.epsl.2009.12.013
Cannatelli, C., Doherty, A. L., Esposito, R., Lima, A., and De Vivo, B. (2016). Understanding a volcano through a droplet: a melt inclusion approach. J. Geochem. Explor. 171, 4–19. doi:10.1016/j.gexplo.2015.10.003
Costa, F., Chackraborty, S., and Dohmen, R. (2003). Diffusion coupling between trace and major elements and a model for calculation of magma residence times using plagioclase. Geochem. Cosmochim. Acta. 67 (12), 2189–2200. doi:10.1016/S0016-7037(02)01345-5
Danyushevsky, L. V., Della-Pasqua, F. N., and Sokolov, S. (2000). Re-equilibration of melt inclusions trapped by magnesian olivine phenocrysts from subduction-related magmas: petrological implications. Contrib. Mineral. Petrol. 138 (1), 68–83. doi:10.1007/PL00007664
Danyushevsky, L. V., Leslie, R. A. J., Crawford, A. J., and Durance, P. (2004). Melt inclusions in primitive olivine phenocrysts: the role of localized reaction processes in the origin of anomalous compositions. J. Petrol. 45 (12), 2531–2553. doi:10.1093/petrology/egh080
Danyushevsky, L. V., McNeill, A. W., and Sobolev, A. V. (2002a). Experimental and petrological studies of melt inclusions in phenocrysts from mantle-derived magmas: an overview of techniques, advantages and complications. Chem. Geol. 183 (1-4), 5–24. doi:10.1016/S0009-2541(01)00369-2
Danyushevsky, L. V., and Plechov, P. (2011). Petrolog3: integrated software for modeling crystallization processes. Geochem. Geophys. Geosyst. 12 (7). doi:10.1029/2011GC003516
Danyushevsky, L. V., Sokolov, S., and Falloon, T. J. (2002b). Melt inclusions in Olivine Phenocrysts: using diffusive re-equilibration to determine the cooling history of a crystal, with implications for the origin of Olivine-phyric volcanic rocks. J. Petrol. 43 (9), 1651–1671. doi:10.1093/petrology/43.9.1651
Demouchy, S., and Mackwell, S. (2006). Mechanisms of hydrogen incorporation and diffusion in iron-bearing olivine. Phys. Chem. Miner. 33 (5), 347–355. doi:10.1007/s00269-006-0081-2
Donovan, A., Blundy, J., Oppenheimer, C., and Buisman, I. (2018). The 2011 eruption of Nabro volcano, Eritrea: perspectives on magmatic processes from melt inclusions. Contrib. Mineral. Petrol. 173 (1), 1. doi:10.1007/s00410-017-1425-2
Drignon, M. J., Nielsen, R. L., Tepley, F. J., and Bodnar, R. J. (2019). Reequilibration processes occurring in plagioclase-hosted melt inclusions from plagioclase ultraphyric basalts. Geochem. Geophys. Geosyst. 20 (1), 109–119. doi:10.1029/2018GC007795
Fall, A., Tattitch, B., and Bodnar, R. J. (2011). Combined microthermometric and Raman spectroscopic technique to determine the salinity of H2O–CO2–NaCl fluid inclusions based on clathrate melting. Geochem. Cosmochim. Acta. 75 (4), 951–964. doi:10.1016/j.gca.2010.11.021
Fujinawa, A., Iwasaki, M., Honda, K., Nagao, A., Wachi, T., and Hayashi, S. (2004). Eruption history in the post-caldera stage of Akita-Komagatake Volcano, Northeastern Japan Arc: correlation between eruptives constituting volcanic edifices and air-fall tephra layers. Bull. Volcanol. Soc. Jpn. 49 (6), 333–354. doi:10.18940/kazan.49.6_333
Gaetani, G. A., and Watson, E. B. (2000). Open system behavior of olivine-hosted melt inclusions. Earth Planet Sci. Lett. 183 (1–2), 27–41. doi:10.1016/S0012-821X(00)00260-0
Ghiorso, M. S., and Sack, R. O. (1995). Chemical mass transfer in magmatic processes IV. A revised and internally consistent thermodynamic model for the interpolation and extrapolation of liquid-solid equilibria in magmatic systems at elevated temperatures and pressures. Contrib. Mineral. Petrol. 119, 197–212. doi:10.1007/bf00307281
Gualda, G. A. R., Ghiorso, M. S., Lemons, R. V., and Carley, T. L. (2012). Rhyolite-MELTS: a modified calibration of MELTS optimized for silica-rich, fluid-bearing magmatic systems. J. Petrol. 53 (5), 875–890. doi:10.1093/petrology/egr080
Hartley, M. E., Maclennan, J., Edmonds, M., and Thordarson, T. (2014). Reconstructing the deep CO2 degassing behaviour of large basaltic fissure eruptions. Earth Planet Sci. Lett. 393, 120–131. doi:10.1016/j.epsl.2014.02.031
Hartley, M. E., Neave, D. A., Maclennan, J., Edmonds, M., and Thordarson, T. (2015). Diffusive over-hydration of olivine-hosted melt inclusions. Earth Planet Sci. Lett. 425, 168–178. doi:10.1016/j.epsl.2015.06.008
Hartley, M. E., Shorttle, O., Maclennan, J., Moussallam, Y., and Edmonds, M. (2017). Olivine-hosted melt inclusions as an archive of redox heterogeneity in magmatic systems. Earth Planet Sci. Lett. 479, 192–205. doi:10.1016/j.epsl.2017.09.029
Hauri, E. (2002). SIMS analysis of volatiles in silicate glasses, 2: isotopes and abundances in Hawaiian melt inclusions. Chem. Geol. 183 (1–4), 115–141. doi:10.1016/S0009-2541(01)00374-6
Itaya, T., Nagao, K., Nishido, H., and Ogata, K. (1984). K-Ar age determination of late pleistocene volcanic rocks. J. Geol. Soc. Jpn. 90 (12), 899–909. doi:10.5575/geosoc.90.899
Jerram, D. A., and Martin, V. M. (2008). Understanding crystal populations and their significance through the magma plumbing system. Geol. Soc. Spec. Publ. 304 (1), 133. doi:10.1144/SP304.7
Johnson, J., Nielsen, R. L., and Fisk, M. R. (1996). Plagioclase-hosted melt inclusions in the Steens Basalt, southeastern Oregon. Petrology. 4 (3), 247–254.
Kelley, K. A., Plank, T., Grove, T. L., Stolper, E. M., Newman, S., and Hauri, E. (2006). Mantle melting as a function of water content beneath back-arc basins. J. Geophys. Res. Solid Earth. 111 (9), B09208. doi:10.1029/2005JB003732
Kelley, K. A., Plank, T., Newman, S., Stolper, E. M., Grove, T. L., Parman, S., et al. (2010). Mantle melting as a function of water content beneath the Mariana arc. J. Petrol. 51 (8), 1711–1738. doi:10.1093/petrology/egq036
Kent, A. J. R. (2008). Met inclusions in basaltic and related volcanic rocks,” in Reviews in mineralogy and geochemistry. Editors Putirka K.D. Tepley I. F.J
Kuritani, T., Kanai, C., Yamashita, S., and Nakagawa, M. (2019). Magma generation conditions at the Akita-Komagatake volcano, Northeast Japan arc: implications of across-arc variations in mantle melting parameters. Lithos. 348–349, 105197. doi:10.1016/j.lithos.2019.105197
Kuritani, T. (2009). The relative roles of boundary layer fractionation and homogeneous fractionation in cooling basaltic magma chambers. Lithos. 110 (1–4), 247–261. doi:10.1016/j.lithos.2008.12.012
Lange, R. A., Frey, H. M., and Hector, J. (2009). A thermodynamic model for the plagioclase-liquid hygrometer/thermometer. Am. Mineral. 94 (4), 494–506. doi:10.2138/am.2009.3011
Lowenstern, J. B. (1995). Applications of silicate-melt inclusions to the study of magmatic volatiles,” in Magmas, fluids, and ore deposits. 23, 71–99.
Maclennan, J. (2017). Bubble formation and decrepitation control the CO2 content of olivine-hosted melt inclusions. Geochem. Geophys. Geosyst. 18 (2), 597–616. doi:10.1002/2016GC006633
Martin, A. K. (2011). Double saloon door tectonics in the Japan Sea, fossa Magna, and the Japanese island arc. Tectonophysics. 498 (1), 45–65. doi:10.1016/j.tecto.2010.11.016
Métrich, N., and Wallace, P. J. (2008). “Volatile abundances in basaltic magmas and their degassing paths tracked by melt inclusions,” in Reviews in mineralogy and geochemistry. Editors K. D. Putirka, and I. F.J Tepley
Moore, L. R., Gazel, E., Tuohy, R., Lloyd, A. S., Esposito, R., Steele-MacInnis, M., et al. (2015). Bubbles matter: an assessment of the contribution of vapor bubbles to melt inclusion volatile budgets. Am. Mineral. 100 (4), 806–823. doi:10.2138/am-2015-5036
Moore, L. R., Mironov, N., Portnyagin, M., Gazel, E., and Bodnar, R. J. (2018). Volatile contents of primitive bubble-bearing melt inclusions from Klyuchevskoy volcano, Kamchatka: comparison of volatile contents determined by mass-balance versus experimental homogenization. J. Volcanol. Geotherm. Res. 358, 124–131. doi:10.1016/j.jvolgeores.2018.03.007
Müller, T., Dohmen, R., Becker, H. W., ter Heege, J. H., and Chakraborty, S. (2013). Fe–Mg interdiffusion rates in clinopyroxene: experimental data and implications for Fe–Mg exchange geothermometers. Contrib. Mineral. Petrol. 166 (6), 1563–1576. doi:10.1007/s00410-013-0941-y
Nakagawa, M. (1985). Geochemical study of lavas from Akita-Komagatake volcano, northeast Japan-Chemical compositional variation of island-arc tholeiitic series. Res. Rep. Lab. Nuc. Sci. Tohoku Univ. 18, 351–365.
Newcombe, M. E., Fabbrizio, A., Zhang, Y., Ma, C., Le Voyer, M., Guan, Y., et al. (2014). Chemical zonation in olivine-hosted melt inclusions. Contrib. Mineral. Petrol. 168 (1), 1030. doi:10.1007/s00410-014-1030-6
Nielsen, R. L., and DeLong, S. E. (1992). A numerical approach to boundary layer fractionation: application to differentiation in natural magma systems. Contrib. Mineral. Petrol. 110 (2), 355–369. doi:10.1007/BF00310750
Northrup, C. J., Royden, L. H., and Burchfie, B. C. (1995). Motion of the Pacific plate relative to Eurasia and its potential relation to Cenozoic extension along the eastern margin of Eurasia. Geology. 23, 719–722. doi:10.1130/0091-7613(1995)023<0719:MOTPPR>2.3
Pawlowsky-Glahn, V., Egozcue, J. J., and Tolosana-Delgado, R. (2015). “Linear models,” in Modelling and analysis of compositional data. Editor V. Barnett (John Wiley & Sons Ltd), 149–171.
Reubi, O., and Blundy, J. (2009). A dearth of intermediate melts at subduction zone volcanoes and the petrogenesis of arc andesites. Nature. 461 (7268), 1269–1273. doi:10.1038/nature08510
Robidoux, P., Frezzotti, M. L., Hauri, E. H., and Aiuppa, A. (2018). Shrinkage bubbles: the C–O–H–S magmatic fluid system at san Cristóbal volcano. J. Petrol. 59 (11), 2093–2122. doi:10.1093/petrology/egy092
Roedder, E. (1979). Origin and significance of magmatic inclusions. Bull. Mineral. 102, 487–510. 10.3406/bulmi.1979.7299.
Rose-Koga, E. F., Koga, K. T., Hamada, M., Hélouis, T., Whitehouse, M. J., and Shimizu, N. (2014). Volatile (F and Cl) concentrations in Iwate olivine-hosted melt inclusions indicating low-temperature subduction. Earth Planets Space. 66 (1), 81. doi:10.1186/1880-5981-66-81
Smith, P. M., and Asimow, P. D. (2005). Adiabat-1ph: a new public front-end to the MELTS, pMELTS, and pHMELTS models. Geochem. Geophys. Geosyst. 6 (2), Q02004. doi:10.1029/2004GC000816
Sours-Page, R., Nielsen, R. L., and Batiza, R. (2002). Melt inclusions as indicators of parental magma diversity on the Northern East Pacific Rise. Chem. Geol. 183 (1–4), 237–261. doi:10.1016/S0009-2541(01)00384-9
Sutō, S., and Ishii, T. (1987). Geology of the shizukuishi district. Tsukuba, Japan: Geological Survey of Japan.
Takagi, D., Sato, H., and Nakagawa, M. (2005). Experimental study of a low-alkali tholeiite at 1–5 kbar: optimal condition for the crystallization of high-An plagioclase in hydrous arc tholeiite. Contrib. Mineral. Petrol. 149 (5), 527–540. doi:10.1007/s00410-005-0666-7
Thomson, A., and Maclennan, J. (2013). The distribution of olivine compositions in Icelandic basalts and Picrites. J. Petrol. 54 (4), 745–768. doi:10.1093/petrology/egs083
Turner, M., Turner, S., Mironov, N., Portnyagin, M., and Hoernle, K. (2017). Can magmatic water contents be estimated from clinopyroxene phenocrysts in some lavas? A case study with implications for the origin of the Azores Islands. Chem. Geol. 466, 436–445. doi:10.1016/j.chemgeo.2017.06.032
Ueki, K., and Iwamori, H. (2017). Geochemical differentiation processes for arc magma of the Sengan volcanic cluster, Northeastern Japan, constrained from principal component analysis. Lithos. 290–291, 60–75. doi:10.1016/j.lithos.2017.08.001
Vigouroux, N., Wallace, P. J., Williams-Jones, G., Kelley, K., Kent, A. J. R., and Williams-Jones, A. E. (2012). The sources of volatile and fluid-mobile elements in the Sunda arc: a melt inclusion study from Kawah Ijen and Tambora volcanoes, Indonesia. Geochem. Geophys. Geosyst. 13 (9), Q09015. doi:10.1029/2012GC004192
Wachi, T., and Koshiya, S. (1997). Tephra stratigraphy and eruptive activities of the Akita-Komagatake volcano. Bull. Volcanol. Soc. Jpn. 42 (1), 17–34. doi:10.18940/kazan.42.1_17
Wallace, P. J., Kamenetsky, V. S., and Cervantes, P. (2015). Melt inclusion CO2 contents, pressures of olivine crystallization, and the problem of shrinkage bubbles. Am. Mineral. 100 (4), 787–794. doi:10.2138/am-2015-5029
Waters, L. E., and Lange, R. A. (2015). An updated calibration of the plagioclase-liquid hygrometer-thermometer applicable to basalts through rhyolites. Am. Mineral. 100 (10), 2172–2184. doi:10.2138/am-2015-5232
Wieser, P. E., Edmonds, M., Maclennan, J., Jenner, F. E., and Kunz, B. E. (2019). Crystal scavenging from mush piles recorded by melt inclusions. Nat. Commun. 10 (1), 5797. doi:10.1038/s41467-019-13518-2
Yoshida, T., Kimura, J. I., Yamada, R., Acocella, V., Sato, H., Zhao, D., et al. (2014). Evolution of late cenozoic magmatism and the crust-mantle structure in the NE Japan arc. London, United Kingdom: Geological Society Special Publication.
Zellmer, G. F., Pistone, M., Iizuka, Y., Andrews, B. J., Gomez-Tuena, A., Straub, S. M., et al. (2016). Petrogenesis of antecryst-bearing arc basalts from the Trans-Mexican Volcanic Belt: insights into along-Arc variations in magma-mush ponding depths, H2O contents, and surface heat flux. Am. Mineral. 101 (11), 2405–2422. doi:10.2138/am-2016-5701
Zellmer, G. F., Sakamoto, N., Iizuka, Y., Miyoshi, M., Tamura, Y., Hsieh, H. H., et al. (2014). Crystal uptake into aphyric arc melts: insights from two-pyroxene pseudo-decompression paths, plagioclase hygrometry, and measurement of hydrogen in olivines from mafic volcanics of SW Japan. Geol. Soc. Spec. Publ. 385, 161–184. doi:10.1144/SP385.3
Keywords: post-entrapment crystallization, Fe-Mg diffusion, melt inclusion correction, antecryst equilibration, MELTS modelling, compositional data analysis, aitchison distance minimization, akita-komagatake
Citation: Brahm R, Zellmer GF, Kuritani T, Coulthard D, Nakagawa M, Sakamoto N, Yurimoto H and Sato E (2021) MushPEC: Correcting Post-entrapment Processes Affecting Melt Inclusions Hosted in Olivine Antecrysts. Front. Earth Sci. 8:599726. doi: 10.3389/feart.2020.599726
Received: 28 August 2020; Accepted: 22 December 2020;
Published: 29 January 2021.
Edited by:
Chiara Maria Petrone, Natural History Museum, United KingdomReviewed by:
Leonid Danyushevsky, University of Tasmania, AustraliaMargaret Hartley, The University of Manchester, United Kingdom
Copyright © 2021 Brahm, Zellmer, Kuritani, Coulthard, Nakagawa, Sakamoto, Yurimoto and Sato. This is an open-access article distributed under the terms of the Creative Commons Attribution License (CC BY). The use, distribution or reproduction in other forums is permitted, provided the original author(s) and the copyright owner(s) are credited and that the original publication in this journal is cited, in accordance with accepted academic practice. No use, distribution or reproduction is permitted which does not comply with these terms.
*Correspondence: Raimundo Brahm, ci5icmFobUBtYXNzZXkuYWMubno=