Abstract
The objective of this study is to investigate and understand the source and transportation of water vapour in the western Himalayan region—that is still missing—using water vapour stable isotopologues and air mass trajectory diagnostics. We report the first-time triple oxygen isotopic compositions of water vapour from high altitude western Himalaya (Chhota Shigri, India) and compare them with meteorological conditions at the site of investigation as well as tracked backwards through the Lagrangian air mass trajectory diagnostics. A total of 21 water vapour samples were collected using a quantitative cryogenic method. δ17O and δ18O values show a significant correlation coefficient of 0.999 (p <0.01). The temporal variations of δ17O, δ18O, δD, D-excess and 17O-excess are 1.2, 2.3, 17.3, 11.6 and 39‰ permeg, respectively. δ17O and δ18O exhibit significant (p < 0.05) diurnal variations along with meteorological parameters. Chhota Shigri vapour isotopic results show a clear difference in the 17O-excess value compared to near the south Indian Ocean and the Southern Ocean regions, reflecting the influence of local moisture recycling at the continental site. NCEP/NCAR reanalyses show lower Specific Humidity during the sampling period (September, ending month of the Indian summer monsoon) favouring evaporative conditions which are further corroborated through the Lagrangian moisture diagnostics suggesting frequent moisture uptake and moisture loss in specific regions.
Introduction
Water vapour is an important component of Earth’s climate system that plays a central role in the water budget and is highly relevant for heat transfer. Experimental work carried out in the 19th century reveals that water vapour is a dominant gaseous absorber of infrared radiation and acts like a “blanket” (Tyndall, 1861). Due to its absorbing nature of infrared radiation, water vapour acts as a greenhouse gas (GHG) with a positive feedback to global warming (Deshpande et al., 2010). Rise of temperature with changing climate has brought the attention on water vapour resulting in a growing global concern for water vapour studies to understand its spatiotemporal distribution with changing climate (Dannsgaard, 1953; Rozanski and Sonntag, 1982; Hoffmann and Heimann, 1997; Jouzel et al., 2000; Wang and Yakir, 2000; Bechtel and Zahn, 2003; Angert et al., 2008; Uemura et al., 2008; Yin et al., 2008; Sodemann and Stohl, 2009; Nieto et al., 2010; Uemura et al., 2010; Kurita et al., 2012; Delattre et al., 2015; Klein et al., 2015; Krishan et al., 2015; Galewsky et al., 2016). The isotopic composition of water vapour is becoming an important tool to understand the processes associated with water transport, mixing of different moisture sources, phase changes in the atmosphere and hence, improving the understanding of the paleoclimate proxies (Yu et al., 2015; Galewsky et al., 2016). In water, there are two naturally occurring stable isotopes of hydrogen and three naturally occurring stable isotopes of oxygen. Molecules composed of the different combinations of isotopes are called isotopologue (Galewsky et al., 2016). Therefore, out of nine possible combinations of isotopologue H2(16)O (99.7309%) is the most abundant followed by H2(18)O (0.1999%), H2(17)O (0.0378%) and HD(16)O (0.0314%), respectively. The application of water stable isotopes was primarily highlighted by Dansgaard (1953); Dansgaard (1964) and Craig (1961). The seminal paper by Craig (1961) first time defined the Global Meteoric Water Line (GMWL) and showed that δ18O and δD in precipitation on a global scale are linearly related through the equation δD = 8*δ18O + 10. The addition of a positive intercept in the equation is due to the difference in isotopic fractionation effects of water-vapour equilibrium and vapour diffusion in the air (Gat, 1996; Luz and Barkan, 2010). Due to the lower natural abundance of 17O over 16O and 18O, δ17O was ignored and thought that δ17O carry no additional information to understand the hydrologic cycle (Angert et al., 2004). Recently, a new second-order parameter 17O-excess (Barkan and Luz, 2005) has been introduced in the hydrologic cycle. The advantage of 17O-excess over D-excess is that it is relatively insensitive to the evaporative temperature and mainly dependent on source humidity condition (Barkan and Luz, 2005; Barkan and Luz, 2007). Only, high precision measurements made it possible to measure the triple oxygen isotopic measurements of meteoric water (Barkan and Luz, 2003; Landais et al., 2006; Landais et al., 2008; Luz and Barkan, 2010; Risi et al., 2010; Landais et al., 2012; Winkler et al., 2013) that has led to an evolution of 17O-excess, derived through the logarithmic system: 17O-excess = ln(δ17O + 1) −0.528 × ln(δ18O + 1), where δ is defined as (Xsample/Xstandard−1), and Xsample and Xstandard are isotopic ratios (H217O/H216O or H218O/H216O) of the sample and standard, respectively (Barkan and Luz, 2007; Landais et al., 2008).
The Chhota Shigri (CS) located in Western Himalayan (Himachal Pradesh) uniquely lies in the transition zone that is under the influence of two strong weather systems of Himalaya; i) long-range western disturbances (WD), which is a synoptic weather system that originates from the Mediterranean region and propagates towards south Asia (Madhura et al., 2014), and ii) Indian Summer Monsoon (ISM) that develops due to the movement of the Inter-Tropical Convergence Zone (ITCZ) and thereby separates wind circulation of the northern and southern hemispheres (Gadgil, 2003). Studies show that precipitation from ISM is more isotopically depleted in nature compared to the WD (Jeelani and Deshpande, 2017; Jeelani et al., 2017). For instance, δ18O varies from −9.8 to −2.1 ‰ during WD while −13.4 to −1.1 ‰ during ISM in Himachal Pradesh (Jeelani and Deshpande, 2017). The higher variability of δ18O during WD and ISM at sampling location could be due to the involvement of multiple factors i.e. the origin of moisture under different humidity conditions, range of travel path, interaction with recycled moistures, evaporation and mixing of moisture with different moisture sources etc. (Breitenbach et al., 2010; Jeelani and Deshpande, 2017; Jeelani et al., 2017; Oza et al., 2020). However, how much local climatic settings together with local meteorological conditions would impact the moisture source isotopic compositions in the western Himalayan region from the WD and ISM is still not well understood. In fact, to our knowledge, no work is available reporting about these pervasive influences regarding the source of precipitation and mixing of different sources. Especially, no information is available regarding the isotopic signatures in water vapour and addressing explanations of their underlying processes. Understanding the water isotopic signatures due to local climate are important for precise quantification of moisture source isotopic composition from the WD and ISM to better understand the palaeoclimatic studies of the western Himalayan region through the ice core and lake sediment pore water isotopic records.
This paper presents a baseline study of water vapour isotopic composition of CS, Himachal Pradesh of the western Himalayan region to understand: 1) atmospheric water vapour isotopic variations in the western Himalayan region during attenuated WD and ISM phase, 2) meteorological conditions and its influence on the vapour isotopic compositions and 3) local moisture recycling and its influence on the water vapour isotopic compositions. Therefore, the data were collected in parallel with meteorological data using a transportable weather station. All of these datasets were processed to compare the temporal variation of water vapour isotopologues. Our new sets of results will enable researchers to understand the vapour isotopic signature in the western Himalayas which can be further applied to high altitude water isotopic studies for better understanding of the global water vapour isotopic variation.
Material and Methods
Study Area
All water vapour samples were collected near the base camp (3844 m. above sea level) of Chhota Shigri (CS) glacier. Figure 1 shows the location of Chhota Shigri (32.58°N-77.58°E), a benchmark glacier identified by the World Glacier Monitoring System (WGMS) (Kumar et al., 2018) which lies in the Chandra river basin on the northern ridge of Pir Panjal range of Lahaul-Spiti valley, Himachal Pradesh, India. The eastward side of CS is a Bara Shigri glacier, the largest glacier of Himachal Pradesh having an area of 131 km2 (Dutt, 1961; Gardelle et al., 2012; Singh et al., 2013). The CS glacier covers 15.7 km2 (Wagnon et al., 2007) in which snout is located in a narrow valley at approximately 4055 m altitude from sea level (Azam et al., 2014; Singh et al., 2015). The width of the CS glacier valley is 0.5 km (near the toe) to 2–3 km wide at the accumulation zone and fed by mainly, two tributary glaciers (Ramanathan, 2011). The climatic condition of the Chhota Shigri glacier is mainly characterized by four seasons that is, Winter from Dec-March (mean temperature, –13.4 °C), Pre-monsoon from Apr-May (mean temperature, –5.3 °C) Summer monsoon from Jun-Sep (mean temperature, 2.5 °C) and Post-monsoon from Oct–Nov (mean temperature, -7.8 °C) (Azam et al., 2016). The selected location is influenced by both, Indian summer monsoon during summer from July to September and mid-latitude westerlies during winter from January to April, hence considered to be situated in the monsoon-arid transition zone (Dobhal et al., 1995; Wagnon et al., 2007). In a geological context, CS glacier drains mainly through the Central Crystalline Axis (Saxena, 1971) in which different types of rocks like muscovite-biotite schist, schistose gneiss, augen gneiss, muscovite-quartzite, porphyritic granite, and granite-gneiss are found between the Bara Shigri and CS glaciers (Kumar and Dobhal, 1997).
FIGURE 1

Map showing the location of the study area. Chhota Shigri (CS) lies in the Chandra river basin of Pir Panjal range which is in the transition zone of Westerly and Indian Summer Monsoon. International boundaries are only for representation purpose.
Sampling and Data Collection
Due to harsh conditions, the selection of sampling season is entirely weathered dependent and on the opening of the access route to the sampling location. Access is limited to the month June to October only. Since we had very limited resources of dry ice and gasoline to operate our unit to collect vapour, we followed the following sampling strategy: 1) sampling with the highest temporal resolutions to observe expected abrupt changes in moisture isotopologues due to various factors i.e. local mixing, valley wind effect, sub cloud evaporation. etc., and 2) collect samples that include diurnal variations to see the influence of meteorological parameters, valley effects and, long-range moisture transportation. Following this sampling strategy, twenty-one vapour samples were collected with the highest possible time resolution, except between 72–112 h and 116–156 h due to technical failure in our vapour collection unit. Detail description of the water vapour sample collection using a specially designed vapour trap system (Uemura et al., 2008) are given below. All collected samples were cryogenically trapped to minimize the associated isotopic fractionations for which the vapour trap system was immersed in liquid alcohol with dry ice to maintain the alcohol bath temperature (<–75 °C). Pump with air inflow was maintained with the flow controller at the rate of 5L min–1 (Gat et al., 2003) to minimize isotopic fractionation during the vapour collection process. The vapour sample was collected through the attached tube, through the vapour trap system whose inlet was placed 5 m above the ground surface (3844 m.a.s.l.). The collected vapour was immediately transferred into 2 ml vial (Fischer Scientific PTFE/SIL) after letting it melt at room temperature. Meteorological conditions play a crucial role for the extent of water stable isotopic fractionation; therefore different meteorological parameters (at 30 min. interval) were obtained from Automatic Weather Station (AWS) installed at the altitude of 3844 m. The Hybrid Single-Particle Lagrangian Integrated Trajectory (HYSPLIT) 4.0 model (Draxler and Hess, 1998; Stein et al., 2015) was used to trace the moisture source. One hundred ninety-two hour back trajectory (starting from September 14, 2015 and ending on starting from September 6, 2015) was calculated for three different altitudes given in meters above ground level (500, 1000, and 1000 m a.g.l) to trace the moisture source at the sampling location.
Water Stable Isotopic Measurements
The collected vapour samples transported to the School of Environmental Sciences, Jawaharlal Nehru University, New Delhi for isotopic analysis using state-of-art PICARRO-CRDS (L2140-i) instrument. Six times injections were performed for each sample in which the first two injections were discarded to reduce the memory effect. The obtained precisions for δ17O, δ18O, δD and 17O-excess are ± 0.04‰, ± 0.05‰, ± 0.39‰, and ± 0.010permeg, respectively. For standards, we used Vienna Standard Mean Ocean Water (VSMOW/VSMOW2) and Standard Light Antarctic Precipitation (SLAP/SLAP2) from the International Atomic Energy Agency (IAEA) and internal standards from PICARRO Inc. ( δ18O = –20.6‰ ± 0.2, δD = –159‰ ± 1.3). All standards were measured after 10-15 samples intervals to check the calibration and system performance. All samples were normalized on VSMOW-SLAP scale (Schoenemann et al., 2013).
Trajectory Analysis
Lagrangian trajectory model using the specific humidity (g/kg) is being widely used to understand the air mass path at a specific time (Sodemann and Stohl, 2008; Wang et al., 2017; Lone et al., 2019), moisture uptake and moisture loss from the air parcel along its trajectory. Specific humidity is independent of temperature and pressure, and hence it does not change if an air parcel rises to a lower pressure level without losing or gaining water vapour. The 192 hours (8 days) back trajectory (starting from September 14, 2015, ending on September 6, 2015) was chosen in our study because it was shown that a 8 days time domain is sufficient to determine the source of moisture contributing to precipitation (James et al., 2004). To determine the precipitation source, Hybrid Single-Particle Lagrangian Integrated Trajectory, HYSPLIT, (Draxler and Rolph, 2003) were used and run backwards in time to determine the source of the precipitation event, uptake and precipitations along their trajectory path, information about the moisture source regions as well as transport paths leading to extreme precipitation events.
Results
The unique topography location of our study area enables it to get influenced by the synoptic-scale tropical disturbances like Indian Summer Monsoon depression (ISM), local micro-meteorological effects including valley scale katabatic wind effects or a combination of these effects (Figure 2). Therefore, meteorological parameters such as temperature (hereafter T), relative humidity (hereafter RH), solar radiance (hereafter SR), air pressure (hereafter P), and specific humidity (hereafter SH) were measured during the vapour sampling period (Tables 1 and 2, Figure 3). The mean of P (ranged 643.0–640.3 hPa), SR (ranged from 643 to 0 W/m2), SH (ranged from 7.7 to 3.5 g/kg) are 641.5 (hPa), 304 (W/m2) and 5.7 (g/kg) respectively. The highest to lowest Coefficient of Variation (COV) order, 86.8 <51.7 <44.2 < 0.1 are observed for SR <RH < T <P, respectively. To see the variations of water vapour isotopes with varying T and RH, the lapse rate was calculated. δ17O, δ18O, δD, 17O-excess and D-excess exhibited the slope of −0.098‰/°C and −0.183‰/°C, 0.724‰/°C and −0.944 permeg/°C and 0.743‰/°C, respectively with respect to T while 0.053‰/% , 0.099‰/% , 0.479‰/%, 0.535 permeg/% and −0.313‰/%, respectively with respect to RH.
FIGURE 2
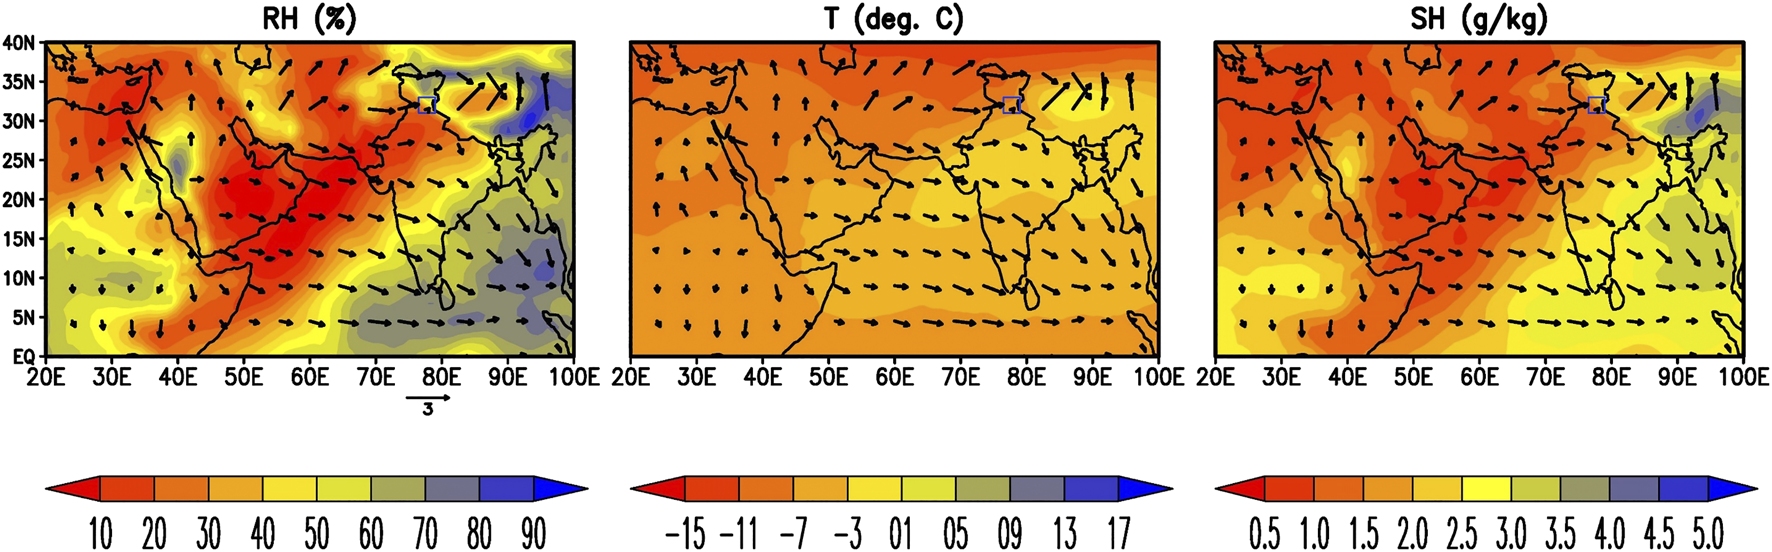
Shows the graphical representation of divergent wind vector field with T, RH and SH. Graph was plotted in GrADS (http://cola.gmu.edu/grads/grads.php) using high resolution (0.75° × 0.75°) NCEP/NCAR reanalysis datasets of September 2015.
TABLE 1
| Serial no | 17O-excess (vsmow-slap) | δ18O (vsmow-slap) | δD (vsmow-slap) | 17O-excess | D-excess | Identifier 1 | Time (hours) | AM (PM) | Air T (⁰C) | RH (%) | P (hpa) | Sol. Rad (W/m2) | Sp. Humidity (g/kg) | Days no |
|---|---|---|---|---|---|---|---|---|---|---|---|---|---|---|
| 1 | −5.515 ± 0.020 | −10.455 ± 0.031 | −55.23 ± 0.159 | 19 ± 0.004 | 28 ± 1.434 | 0,7092015–21 PM | 0 | 21 | 4.99 | 55.88 | 640.86 | 0 | 5.17 | 1 |
| 2 | −6.702 ± 0.016 | −12.779 ± 0.022 | −63.76 ± 0.084 | 66 ± 0.018 | 39 ± 1.194 | 0,8092015–09AM | 12 | 09 | 10.43 | 41.52 | 642.33 | 179.54 | 6.70 | 1 |
| 3 | −7.128 ± 0.006 | −13.504 ± 0.018 | −54.24 ± 0.241 | 26 ± 0.004 | 54 ± 1.131 | 0,8092015–11AM | 14 | 11 | 21.41 | 24.3 | 641.59 | 573.7 | 7.52 | 1 |
| 4 | −7.602 ± 0.036 | −14.456 ± 0.034 | −58.05 ± 0.158 | 58 ± 0.021 | 58 ± 1.500 | 0,8092015–13 PM | 16 | 13 | 25.05 | 16.1 | 641.11 | 641.42 | 5.86 | 1 |
| 5 | −7.602 ± 0.014 | −14.475 ± 0.011 | −54.60 ± 0.028 | 68 ± 0.012 | 61 ± 0.840 | 0,8092015–15 PM | 18 | 15 | 22.91 | 17.86 | 640.63 | 580.76 | 6.10 | 1 |
| 6 | −6.347 ± 0.026 | −11.985 ± 0.049 | −36.40 ± 0.068 | -1 ± 0.006 | 60 ± 1.775 | 0,8092015–17 PM | 20 | 17 | 17.51 | 26.52 | 640.32 | 301.5 | 6.09 | 1 |
| 7 | −6.031 ± 0.027 | −11.527 ± 0.045 | −43.41 ± 0.156 | 72 ± 0.009 | 49 ± 1.721 | 0,8092015–19 PM | 22 | 19 | 8.64 | 46.25 | 640.95 | 9.67 | 5.51 | 1 |
| 8 | −5.564 ± 0.010 | −10.690 ± 0.018 | −26.38 ± 0.065 | 95 ± 0.007 | 59 ± 1.078 | 0,8092015–21 PM | 24 | 21 | 6.03 | 57.12 | 640.83 | 0 | 5.54 | 1 |
| 9 | −7.247 ± 0.007 | −13.833 ± 0.016 | −68.25 ± 0.093 | 81 ± 0.004 | 42 ± 1.021 | 0,9092015–09AM | 36 | 09 | 9.38 | 41.14 | 642.21 | 152.61 | 5.44 | 2 |
| 10 | −10.252 ± 0.012 | −19.429 ± 0.023 | −101.50 ± 0.173 | 54 ± 0.003 | 54 ± 1.243 | 0,9092015–13 PM | 40 | 13 | 22.73 | 10.06 | 641.26 | 642.99 | 3.15 | 2 |
| 11 | −8.136 ± 0.006 | −15.391 ± 0.005 | −76.27 ± 0.047 | 47 ± 0.003 | 46 ± 0.568 | 0,9092015–15 PM | 42 | 15 | 25.8 | 12.58 | 640.84 | 567.15 | 5.58 | 2 |
| 12 | −6.873 ± 0.014 | −13.010 ± 0.011 | −72.85 ± 0.114 | 18 ± 0.013 | 31 ± 0.852 | 0,9092015–17 PM | 44 | 17 | 16.17 | 23.86 | 640.69 | 146.81 | 5.84 | 2 |
| 13 | −6.333 ± 0.009 | −12.189 ± 0.011 | −52.49 ± 0.050 | 122 ± 0.008 | 45 ± 0.842 | 0,9092015–19 PM | 46 | 19 | 10.3 | 40.66 | 641.34 | 4.3 | 5.62 | 2 |
| 14 | −8.969 ± 0.014 | −16.884 ± 0.017 | −81.54 ± 0.081 | −18 ± 0.008 | 54 ± 1.050 | 1,0092015–13 PM | 64 | 13 | 26.46 | 11.34 | 642.97 | 632.64 | 4.27 | 3 |
| 15 | −6.905 ± 0.114 | −13.127 ± 0.216 | −64.17 ± 0.676 | 48 ± 0.002 | 41 ± 4.175 | 1,0092015–15 PM | 66 | 15 | 26.2 | 12.71 | 642.39 | 556.62 | 5.82 | 3 |
| 16 | −6.769 ± 0.067 | −12.845 ± 0.117 | −52.16 ± 1.724 | 35 ± 0.016 | 51 ± 5.709 | 1,0092015–17 PM | 68 | 17 | 16.61 | 26.26 | 641.6 | 91.74 | 6.01 | 3 |
| 17 | −5.708 ± 0.014 | −10.781 ± 0.008 | −51.94 ± 0.079 | −1 ± 0.010 | 34 ± 0.722 | 1,0092015–19 PM | 70 | 19 | 10.89 | 41.79 | 642.05 | 7.52 | 6.14 | 3 |
| 18 | −5.499 ± 0.007 | −10.495 ± 0.007 | −55.41 ± 0.028 | 57 ± 0.004 | 29 ± 0.670 | 1,0092015–21 PM | 72 | 21 | 8.01 | 48.91 | 642.58 | 0 | 5.27 | 3 |
| 19 | −5.948 ± 0.009 | −11.445 ± 0.014 | −29.23 ± 0.085 | 113 ± 0.009 | 62 ± 0.954 | 12092015–13 PM | 112 | 13 | 27.01 | 10.05 | 642.38 | 633.75 | 4.95 | 4 |
| 20 | −5.388 ± 0.024 | −10.265 ± 0.016 | −50.21 ± 0.254 | 45 ± 0.018 | 32 ± 1.076 | 12092015–17 PM | 116 | 17 | 18.71 | 27.03 | 641.1 | 239.55 | 7.23 | 4 |
| 21 | −7.015 ± 0.017 | −13.461 ± 0.043 | −45.77 ± 0.960 | 116 ± 0.008 | 62 ± 2.581 | 1,4092015–09AM | 156 | 09 | 17.65 | 32.59 | 641.96 | 432.91 | 7.36 | 5 |
Triple oxygen isotopes (with uncertainty) and meteorological parameters of vapor samples of Chhota Shigri glacier, western Himalaya. Error estimate for D-excess was calculated based on the uncertainly between δD and δ18O (Froehlich et al., 2002).
TABLE 2
| N = 21 | δ17O (‰) | δ18O (‰) | δD (‰) | 17O-excess (permeg) | D-excess (‰) | Air T (⁰C) | RH (%) | P (hpa) | SR (W/m2) | S H (g/kg) |
|---|---|---|---|---|---|---|---|---|---|---|
| Mean | −6.835 | −13.001 | −56.851 | 52 | 47 | 16.8 | 29.7 | 641.5 | 304.5 | 5.7 |
| Median | −6.769 | −12.845 | −54.596 | 54 | 49 | 17.5 | 26.5 | 641.3 | 239.6 | 5.7 |
| Max | −5.388 | −10.265 | −26.376 | 122 | 62 | 27.0 | 57.1 | 643.0 | 643.0 | 7.7 |
| Min | −10.252 | −19.429 | −101.502 | −18 | 28 | 5.0 | 10.1 | 640.3 | 0.0 | 3.5 |
| Stdev | 1.222 | 2.285 | 17.332 | 39 | 12 | 7.4 | 15.4 | 0.8 | 264.4 | 0.9 |
| COV (%) | 17.87 | 17.58 | 30.49 | 75.91 | 24.55 | 44.26 | 51.73 | 0.12 | 86.83 | 16.45 |
Summary of triple oxygen isotopes and meteorological parameters of entire vapor samples of Chhota Shigri glacier, western Himalaya.
FIGURE 3
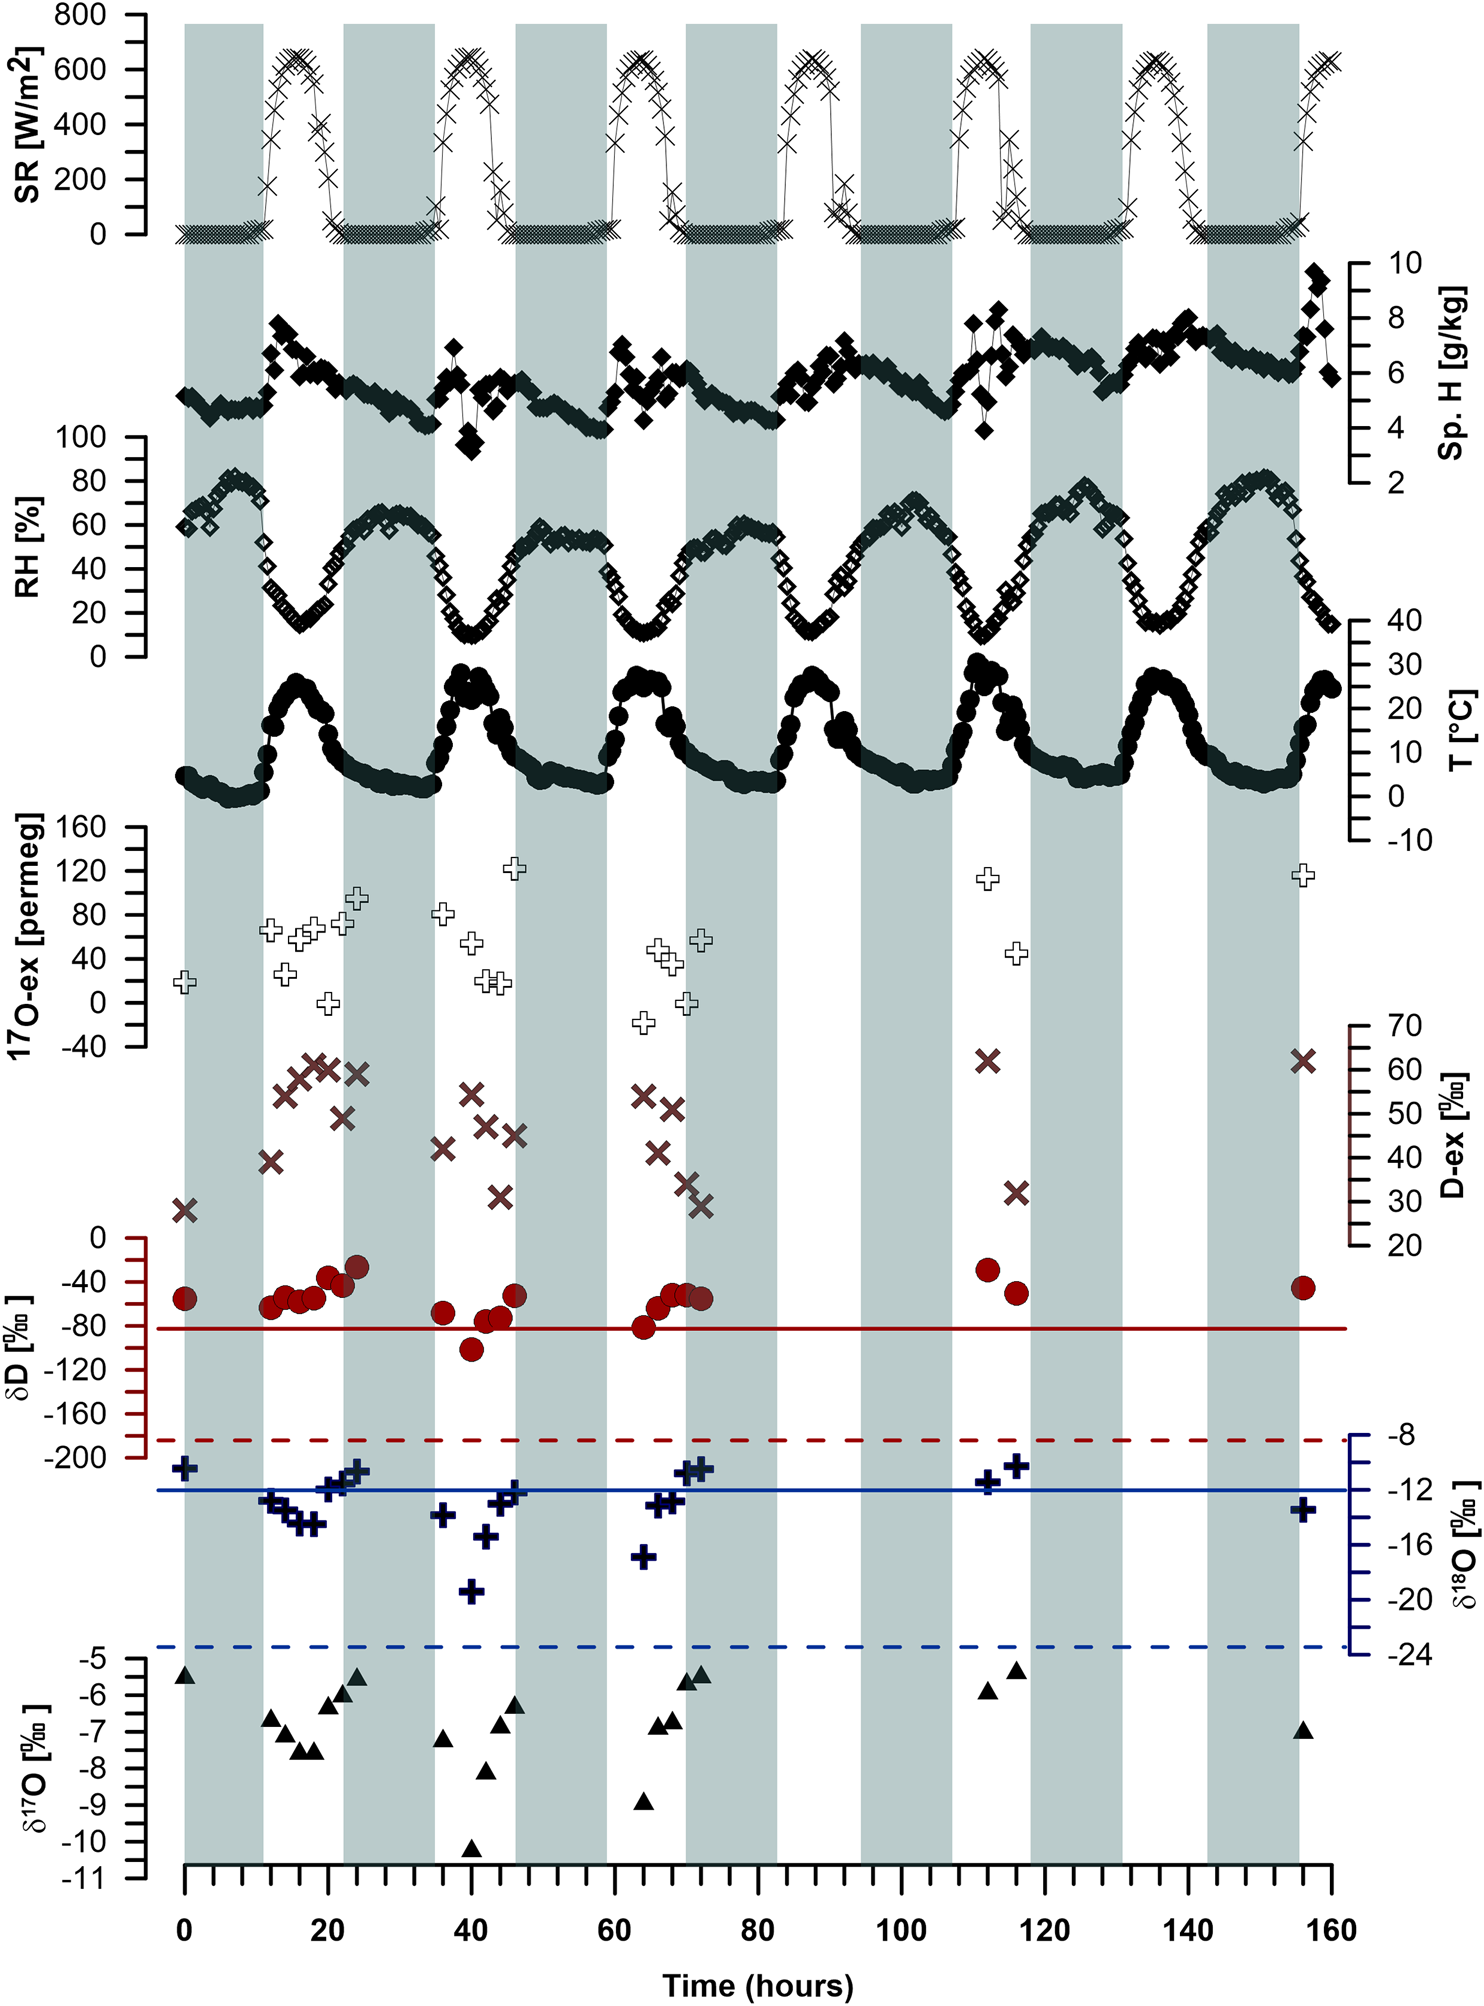
δ17O, δ18O, δD, D-excess, 17O-excess, Temperature (T) and Relative Humidity (RH), Specific Humidity (SH) and Solar Radiation (SR) has been shown in this graph for a continuous run of 156 h. Days (white space) and Night (shaded space) are highlighted. Out of 21 sample 15 samples corresponds to day time and six samples correspond to night time. All meteorological parameter results are recorded at 30 min intervals. The lowest delta values at hour 40 are coinciding with lower SH, T and RH shows a clear anti-correlation. Red solid and red dashed line corresponds to the δD of Ice and Ice vapor, respectively while blue solid and blue dashed line corresponds to δ18O Ice and Ice vapor, respectively.
Detailed information and summary of the total 21 H2O vapour samples have been presented in Tables 1 and 2, respectively. The mean values of δ17O and δ18O were observed to be −6.83 ‰ (ranged from −10.25 to −5.38‰) and −13.0‰ (ranged from −19.42 to −10.26 ‰), respectively. The other three parameters namely δD, 17O-excess and D-excess exhibited the mean value of −56.85‰ (ranged from −101.50 to −26.37‰), 52 permeg (ranged from −18 to 122 permeg) and 47‰ (ranged from 28 to 62 ‰), respectively. Among all isotopic parameters, 17O-excess showed the highest variability. All δ values showed the significant correlation (at p < 0.05) among each other while derived second-order parameter, 17O-excess exhibited an insignificant correlation with δ17O, δ18O, δD and D-excess. For D-excess, only δ17O and δ18O showed a weak correlation of 0.14, (p < 0.10) 0.15, respectively.
At 112 h (Figure 3), D-excess showed a higher value (62.4‰) with the highest T (27.01 °C) and the lowest RH (10.05%) of entire samples. The calculated slope (λ, regression coefficient), which determines the relation between δ17O and δ18O [λ = ln (δ17O + 1)/(ln δ18O + 1) *1000] is 0.530 (by allowing for an offset) which is higher compared to the 0.528 (calculated for VSMOW, GISP, and SLAP) and θeq= 0.529 (θeq is a constant that defines the relationship between δ17O and δ18O during a single equilibrium fractionation process) (Barkan and Luz, 2005) as well as θdiff = 0.518 (θdiff, defines the relationship between δ17O and δ18O during a single kinetic fractionation process) (Barkan and Luz, 2007).
Discussion
Meteorological Conditions
The study area, lying in the monsoon-arid region, is mainly influenced by Northern Hemisphere mid-latitude westerlies during winter (January-April) and Indian summer monsoon (June-September) (Singh et al., 1997; Azam et al., 2012). Since, Indian summer monsoon (ISM) depression is one of the important synoptic-scale tropical disturbances during June to September (Sikka, 1977), it becomes important to investigate the meteorological parameters and its correlation with vapour isotopes to decipher the macro to micro-level effects, i.e., influence of ISM, local micrometeorological influence, valley scale katabatic wind effects, regional-scale synoptic influence or a combination of these. The meteorological parameters like SR and P exhibit the highest and the lowest COV during the sampling period which is obvious due to maximal atmospheric perturbation in the day time with a full sunshine hour compare to the calm and clear sky conditions in the night time (Figure 3). The daily-average trend shows only 0.377 hPa change in P which is most likely due to the presence of relatively lower atmospheric turbulence condition. RH (expressed in %) tell us the ratio of water vapour amount in the air to the water vapor amount needed for saturation at a given T while SH (expressed in g/kg) shows the ratio of water vapor content of the mixture to the total air content on a mass basis that is also independent of air parcel volume (Byers, 1959). SH can be used to directly compare air parcels at different temperatures and pressures (and implicitly, latitude and altitude) (Nguyen and Dockery, 2016) to understand the moisture uptake and moisture loss.
Temporal Variation of Water Vapour Isotopologues
Temporal variation of δ17O, δ18O, δD, 17O-excess and D-excess of H2O vapour together with T, RH, SH, and SR (total sun energy received per unit area, expressed in Wm−2) are shown (Figure 3). The most depleted/minimum (abundant of lighter isotopes) value of δ17O and δ18O are in coincidence with the lowest SH (3.15 g/kg) and RH (10.06%) at 40 hr (at 01 PM on 9th September) where SR reaches its peak value under clear sky condition reflecting the dry atmospheric conditions. This could result in an increase of isotopic fractionation through the addition of lighter isotopes into the vapour phase (Deshpande et al., 2010). The highest values for δ17O and δ18O are within 92 h of sampling period on which T and RH values are 18.71 °C and 27.03%, respectively. The enrichment in vapour possibly due to the exchange of lighter isotopes from the atmosphere through the addition of local moisture mixing carrying heavier isotopes transported from other glacialized regions. This can be further evidenced through the variation of air mass trajectories altitude from the source to the sampling location. δD shows the most negative value of −101.50 ‰ at 40 h accompanied by the lowest SH and RH. This could be due to the dry atmospheric conditions leading to isotopic fractionation through the addition of lighter isotopes into the vapour phase.
The calculated slope between 17O-excess and T infers that the obtained slope of 17O-excess is not primarily a direct T dependence (17O-excess is relatively insensitive to temperature, Barkan and Luz, 2005) but rather a T induced influence on 17O excess i.e., local micrometeorological effects in the valley with changing T, katabatic wind effects induced by T changes and/or regional scale synoptic effects carrying different air mass mixture to the sampling location. This can be further confirmed through the trajectory analysis (Figure 5) where changes in SH and altitude are frequent within the 150 km range from the sampling location. However, further investigations are required by measuring the water vapour stable isotopes at the seasonal scale, which would be helpful to understand the T dependent slope of 17O-excess in the western Himalaya. The D-excess exhibits a dependence on both T and RH, therefore indicates the combined effects of both T and RH.
FIGURE 5

The upper panel shows the 192 h air mass back trajectory analysis at three different altitudes above ground level, i.e., 500, 1,000 and 1,500 m a.g.l. All trajectories with different altitudes are arriving at the target location from the range of 100 km. Large variations in specific humidity (SH) was observed along the trajectories path indicated by the color code. The lower two panels show characteristics (SH, d-excess and altitude changes) along the 192 h air mass back trajectory at these three different altitudes (500, 1,000 and 1,500 m. a.g.l.).
Diurnal Variability of Isotopic Composition
Diurnal variations of H2O vapour isotopologues and meteorological parameters are shown (Figure 4). Since we have collected samples at high temporal resolution different tools are applied to confirm and to understand the diurnal variations in the vapour isotopic composition, such as; i) ANOVA (Analysis of Variance) and t-test. These tests were performed to determine the possibilities of statistically significant differences among all parameters and to statistically differentiate the diurnal variations in all parameters (Table 3 and 4). Lower F-critical value (1.873) compared to the F-value (131.39) with the significance of p < 0.001 suggests that all parameters are significantly different from each other and therefore reject the null hypothesis. Further, t-test (Table 4) results indicate that during the day and night time, δ17O, δ18O and δD (p < 0.10) show significant differences while 17O-excess and D-excess don’t, which could be due to their higher variability in response to changing meteorological conditions. ii) Differences between means of all day and night, respectively amount to ∼20% for δ17O, δ18O and δD. Diurnal variations of meteorological parameters and those of the isotope composition, in particular δ17O and δ18O, suggest that they might be inter-linked (Figure 4). However, during daytime T is rising and RH is decreasing due to the increased solar radiation. Therefore, it is obvious that no precipitation events were observed during the day. Hence phase changes (vapor-liquid) at the site of recordings cannot be responsible for the observed diurnal variations. Since the specific humidity is increasing generally at morning hours followed by a more or less steady decrease, points to an admixture of water vapour. Therefore, we investigated a two component mixing model: iii) the mass balance is used to estimate the contribution of two end-members to explain the measured isotope composition of the sampled vapour. To quantify this, two end members namely, glacier ice vapour and local vapour at the Base camp where the measurements took place were considered. The isotopic value for the vapor at Base camp was taken as the least depleted measured value independently for δ18O and δD, respectively. The selection of glacier ice vapour as one end member is obvious because our sampling location is surrounded with mountain glaciers that could be a potential contributor of a vapour source. To calculate the glacier ice vapour, we used measured isotopic composition of surface firn ice that was available fortunately. These values, corresponding to sampled surface snow from the ablation zone (4650 m.a.s.l.), carries the δ18O and δD of −12.0 and −79 ‰, respectively. Since prevailing temperature at the glacier was not measured, we estimated it. Based on the mean temperature recorded at the Base camp that amounts to 10.8 °C during the measurement campaign and a lapse rate of 0.6 °C per 100 m with a height difference of roughly 800 m between the glacier and the Base camp, we obtained 6 °C. Based on this temperature value, oxygen and hydrogen isotope fractionation factors for liquid-vapour were calculated (Horita and Wesolowski, 1994) which are 1.0111 and 1.1026, respectively. Using these fractionations, the calculated δ18O and δD of glacier ice vapour become −22.72 and −176‰, respectively (Figure 3 and Supplementary Figure S1).
FIGURE 4
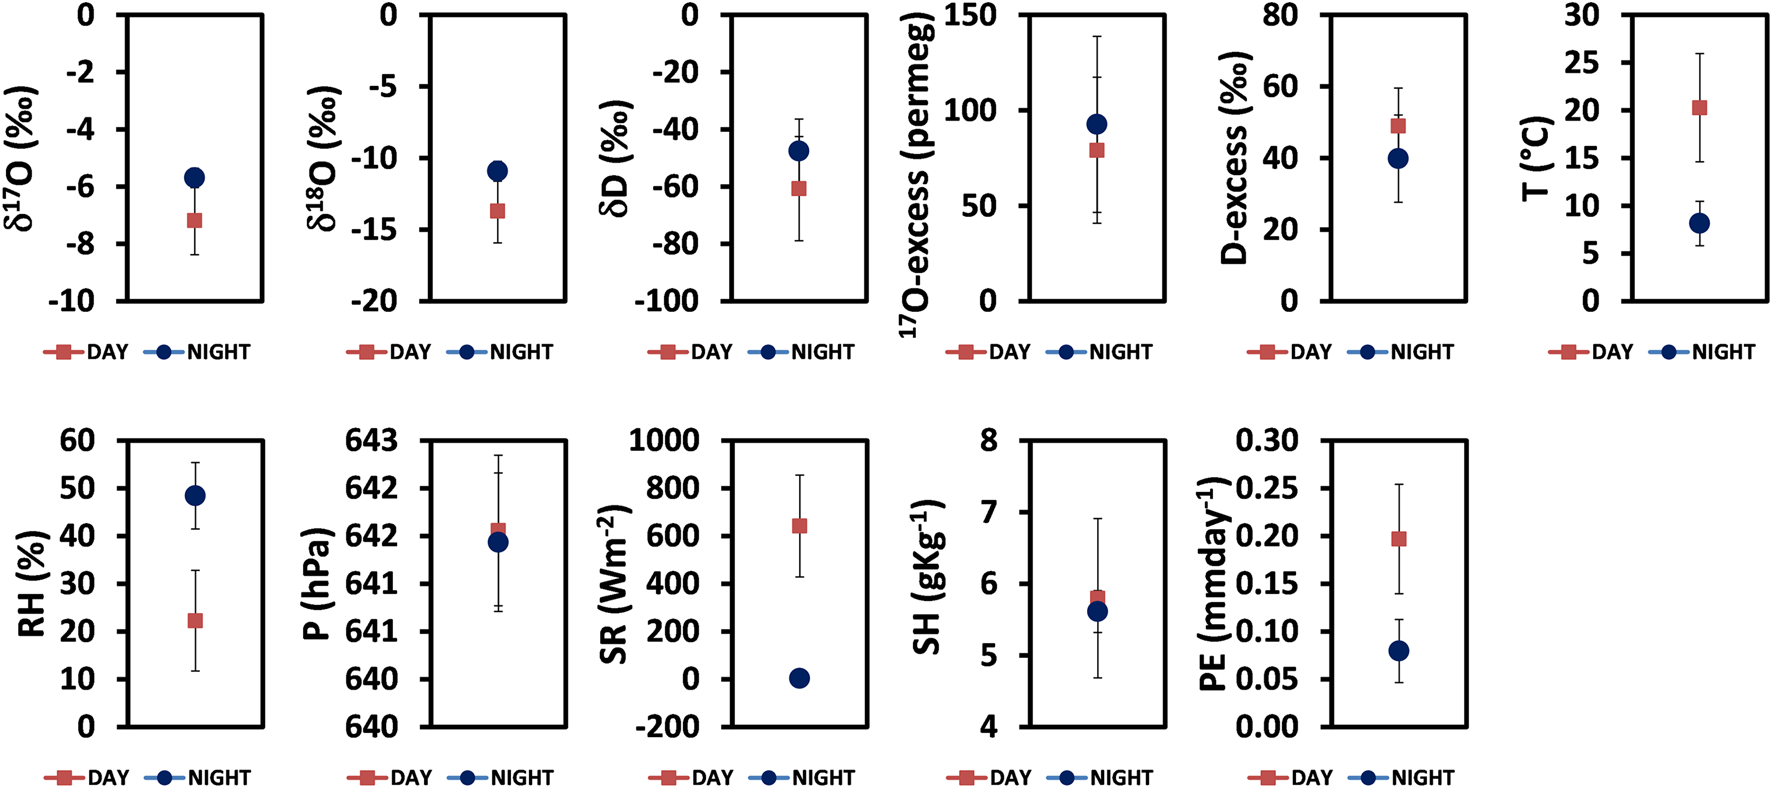
Shows the boxplot of diurnal variations of δ17O (‰), δ18O (‰), δD (‰), 17O-excess (permeg), T (°C), RH (%), P (hPa), SR (W/m2) SH (Specific Humidity g/kg), PE (potential evaporation mm/day). Significant diurnal variations are found in δ17O, δ18O, RH, SR and PE.
TABLE 3
| SS | Df | MS | F | p-value | F criticle | |
|---|---|---|---|---|---|---|
| Between groups | 8649372.481 | 10 | 864,937.2481 | 131.3928865 | 6.10836E-87 | 1.873,922,676 |
| Within groups | 1,448,222.956 | 220 | 6,582.83162 | |||
| Total | 10,097,595.44 | 230 |
Statistical summary of the ANOVA test performed between the parameters (group) to see the statistical difference among them.
SS, sum of squared; df, degree of freedom; MS, mean squared; F, f statistics; p-value, significance test and F critical value.
TABLE 4
| δ17O (‰) | δ18O (‰) | δ<B>D</B> (‰) | 17O-excess (permeg) | D-excess (‰) | T (°C) | RH (%) | P (hpa) | SR (W/m2) | SH (g/kg) | PE (mm/hr) |
|---|---|---|---|---|---|---|---|---|---|---|
| (p < 0.05) | (p < 0.05) | (p < 0.05) | (p < 0.05) | (p < 0.05) | (p < 0.05) | (p < 0.05) | (p < 0.05) | (p < 0.05) | (p < 0.05) | (p < 0.05) |
| 0.0003 | 0.0004 | 0.0639 | 0.5402 | 0.1462 | 0.0000 | 0.0000 | 0.7378 | 0.0000 | 0.5578 | 0.0000 |
Shows statistical t-test results between Day and Night. p values (under 95% confidence limit) between each parameter been displayed in this table
Based on this information’s, percentage contribution, x, from glacier ice vapour and Base camp vapour was obtained according to the above equation. The result indicates that indeed in the night and early morning time, glacier ice vapour contribution is substantially low in comparison to day times. Further, the contribution of end-member varies with time (Supplementary Figure S1) which could be due to the variable meteorological conditions at the temporal scale. Combining all these factors tempted us to conclude that, significant diurnal variation is present in the vapour sample where glacier ice vapour contribution is minimal during the night and early morning time and significant during the day. The fact that the amplitude as well as to a certain part the phase (h130 to 144) of the green sine function curve that helps illustrating the diurnal variations points to a dynamic process of initiation, interruption (h 57.5 and 177) and strength (h 39, 61 and 85) of the local katabatic winds that lead to variable contributions of admixed water vapor sublimed from the nearby glacier (Supplementary Figure S1).
Statistical Analysis
Correlation analysis among all parameters was performed at the 95% confidence limit (p < 0.05) (Table 5) where δ17O and δ18O exhibit the highest correlation. The strong correlation between δ17O and δ18O is due to the mass-dependent isotopic fractionation which follows the power-law relationship (Young et al., 2002) where δ17O relates with approximately half of the δ18O during fractionation process in meteoric water (Young et al., 2002, Barkan and Luz, 2005; Landais et al., 2006). The obtained slope in δ17O and δ18O space at log scale is 0.530 which is slightly higher compared to the slope obtained for GMWL (0.528). The observed correlation shown by 17O excess and D-excess indicates the involvement of multiple processes (e.g. moisture recycling through valley scale katabatic wind effects, an admixture of moisture from glacier surface and glacial meltwater, local micrometeorological effects etc.) in the valley region of western Himalaya rather than the dependency only on relative humidity at the site of evaporation (Barkan and Luz, 2007; Risi et al., 2010; Uemura et al., 2010). D-excess, T, and RH (Table 5) show anti-correlation among each other and further accompanied by δ17O and δ18O. The positive correlation of 0.67 (p < 0.05) between δ17O, δ18O and RH and negative correlation of 0.59 (p < 0.05) between δ17O, δ18O and T is obvious as an increase in T is generally associated with lower RH (according to Clausius-Clapeyron equation, the saturation vapor pressure decreases with decreasing temperature that leads to an increase in RH keeping the partial vapor pressure stays constant while temperature decreases) that promotes the kinetic fractionation and hence enriched lighter isotopes in the vapour phase. Interestingly, Potential Evaporation (PE) is in anti-phase with δ17O, δ18O and RH while in phase with T. This could be due to the fact that an increase in T leads to an increase in evaporation rate resulting in an addition of lighter isotopes into the vapour phase and therefore in lower δ values. The PE and RH relation is well known as an increase of RH lowers the evaporation rate by inhibiting them to enter the atmosphere. Weak correlation between the 17O-excess and T indicates a closely related temperature dependence of δ17O and δ18O during fractionations that cancel each other in the 17O-excess values (Craig, 1961). In case of T, significant (p < 0.05) correlation of r equals −0.97 and 0.93 were found between T and RH and T and GR, respectively.
TABLE 5
| Duration | Parameters | Correlation (r2) | Linear equation | Duration | Parameters | Correlation (r2) | Linear equation |
|---|---|---|---|---|---|---|---|
| All | δ17O-δ18O | 0.9990 | Y = 0.5343x + 0.1113 | Day time | δ17O-δ18O | 0.9991 | Y = 0.5352x + 0.1233 |
| All | δ17O-δD | 0.6355 | Y = 0.0562x−3.6405 | Day time | δ17O-δD | 0.6922 | Y = 0.0544x−3.9619 |
| All | δ17O-T | 0.3590 | Y = −0.0984x−5.1811 | Day time | δ17O-SH | 0.2704 | Y = 0.5568x−10.4867 |
| All | δ17O-RH | 0.4488 | Y = 0.0532x−8.4169 | Day time | δ18O-δD | 0.6836 | Y = 0.1010x−7.6739 |
| All | δ17O-SR | 0.4791 | Y = 0.0032x−5.8611 | Day time | δ18O-SH | 0.2707 | Y = 1.0404x−19.8242 |
| All | δ17O-PE | 0.4010 | Y = −10.4051x−5.1347 | Day time | D-ex-SR | 0.0026 | Y = 0.0090x + 44.6541 |
| All | δ18O-δD | 0.6233 | Y = 0.1041x−7.0833 | Day time | T-RH | 0.8954 | Y = −0.5082x + 31.5827 |
| All | δ18O-T | 0.3563 | Y = −0.1834x−9.9191 | Day time | T-SR | 0.7609 | Y = 0.0232x +10.4304 |
| All | δ18O-RH | 0.4450 | Y = 0.0991x−15.9481 | Day time | T-PE | 0.8896 | Y = 93.1487x +1.9258 |
| All | δ18O-SR | 0.4811 | Y = −0.0060x−11.1758 | Day time | RH-SR | 0.6196 | Y = −0.0389x + 38.7907 |
| All | δ18O-PE | 0.3972 | Y = −19.3747x−9.8356 | Day time | RH-PE | 0.9422 | Y = −178.4897x + 57.4095 |
| All | δD-SH | 0.2201 | Y = 8.6013x−106.2598 | Day time | SR-PE | 0.6386 | Y = 2,973.2774x−160.5851 |
| All | D-ex-T | 0.0317 | Y = −0.9443x + 67.8661 | Night time | δ17O-δ18O | 0.9899 | Y = 0.4863x−0.4146 |
| All | D-ex-SR | 0.0062 | Y = −0.0118x + 55.5854 | Night time | δD-D-ex | 0.1781 | Y = 0.1028x−53.7239 |
| All | T-RH | 0.9493 | Y = −0.4710x + 30.8117 | Night time | T-RH | 0.9416 | Y = −0.3244x + 23.8542 |
| All | T-SR | 0.8703 | Y = 0.0262x + 8.8142 | Night time | T-PE | 0.8750 | Y = 65.5462x + 2.9270 |
| All | T-PE | 0.9445 | Y = 97.2215x + 0.9187 | Night time | RH-PE | 0.7406 | Y = −180.4020x + 62.7920 |
| All | RH-SR | 0.7868 | Y = −0.0516x + 45.4551 | Night time | SH-PE | 0.6888 | Y = 7.3252x + 5.0287 |
| All | SR-PE | 0.0063 | Y = −1.6140x + 1,065.1476 | 24 h | δ17O-δ18O | 0.9987 | Y = 0.5414x + 0.2171 |
| 24 h | δ17O-δd | 0.8238 | Y = 0.0514x−4.1623 | ||||
| 24 h | 17O-excess-RH | 0.7326 | Y = 0.9796x + 28.5419 | ||||
| 24 h | 17O-excess-SH | 0.9630 | Y = 6.3462x + 12.7609 | ||||
| 24 h | D-ex-PE | 0.6885 | Y = −126.1644x + 74.8136 | ||||
| 24 h | T-P | 0.2441 | Y = 2.6015x−1,649.0797 | ||||
| 24 h | RH-SH | 0.6823 | Y = 4.667x−5.171 | ||||
| 24 h | RH-PE | 0.9499 | Y = −129.483x−47.366 |
Shows significant (p < 0.005) correlation among isotopic and meteorological parameters. Correlations are shown during the entire sampling period (All), Day time, Night Time and Integration of Day and Nighttime (24 h).
Correlation table (Table 5) shows that of all parameters, only δ17O and δ18O show significant positive correlation while PE and RH show significant anti-correlation during the day, night and daily (averaged for 24-h) time period. SH and all δ values show significant positive correlation only during the daytime. The strong correlation between δD and D-excess only in night time might be due to the lower T and high RH dependent fractionation with attenuated moisture recycling and valley wind effect contrary to the high T and low RH during days with increased atmospheric perturbation. Interestingly, D-excess and 17O-excess correlation (p < 0.10), observed only at daily (averaged 24-h) time periods, probably indicates the dominance of humidity factor over T for 17O-excess and D-excess. To get a better insight into the detailed involved processes extensive vapour measurements at varying spatiotemporal scale are needed.
Moisture Source Diagnostics
The 192-h back trajectory plot (Figure5) shows the altitudinal difference of trajectories from the source to the target region. The trajectory plot indicates that there has been a downhill movement of air mass before arriving at the sampling site. However, our study area is at high altitude and surrounded with valleys where most likely chances for trajectories to strike on surfaces/mountains at multiple points are obvious, and therefore lesser back hour trajectory calculation can be considered compared to 192 hour back hour trajectory. All trajectories are originating in the range of 100 km south-west (Figure 6) from the sampling location that shows the strong local moisture recycling process and can be further evidenced through the specific humidity (Figure 5) variations along the air mass trajectories.
FIGURE 6
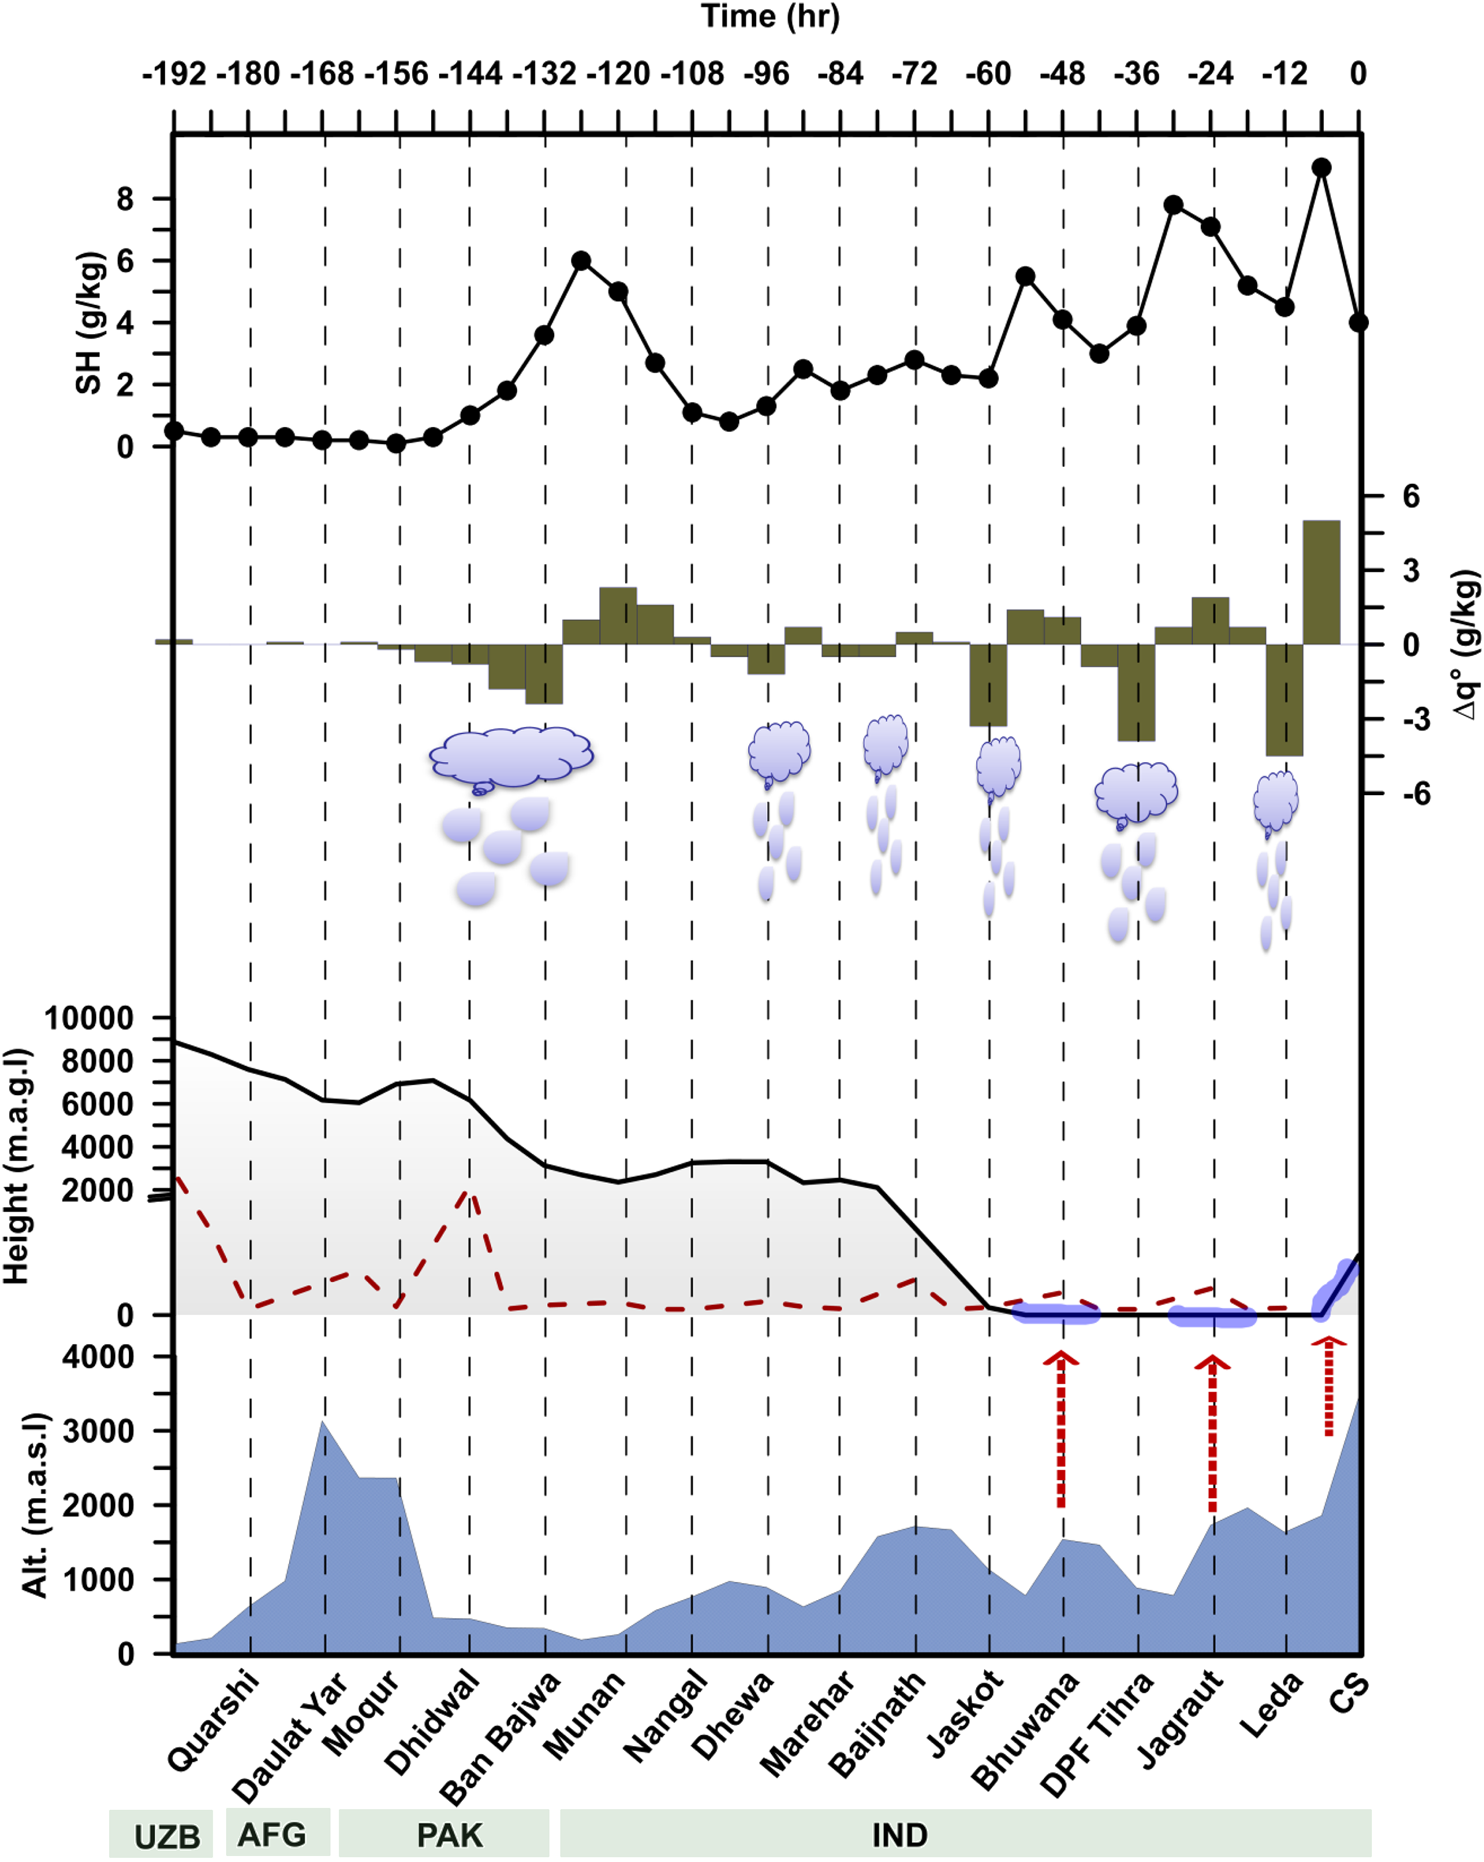
Lagrangian moisture diagnostics sketch using the method of Sodemann et al. (2008) for identifying the moisture uptakes along the backward trajectory path from CS (Chhota Shigri), India to Quarshi (Uzbekistan) (black line). A in total 192 h backward (time in hours at top) model run was performed where SH (back filled circle) represents the specific humidity (g/kg) while ∆q⁰ (bar chart in gray color) represents the difference in SH of an air parcel at 6 h intervals. BLH, boundary layer height (dashed red line) is obtained from the HYSPLIT model. Similar as done by Sodemann (Sodemann et al. (2008)), moisture uptake points (thick blue line on air parcel trajectory) were considered only, if the air parcel trajectory height is lower than the BLH with ∆q⁰ is equal to 0.02 g/kg, while moisture increase (positive ∆q⁰) over the trajectory are the point of moisture decrease.
Furthermore, calculating the differences in SH (Δq) from its previous value at 6 h (Δt) interval enable us to understand the moisture uptake and moisture loss along the trajectory path (Sodemann et al. 2008; Wang et al., 2017). As per Sodemann et al. (2008), Δq/Δt is usually the net result of moisture loss through vaporization (V) into precipitation (P) and it helps to identify the air parcel with evaporative source location. Evaporative condition dominates if SH is higher than 0.2 g/kg at each 6 h interval with lower trajectory air mass height compared to the boundary layer height (BLH) (Sodemann et al. 2008). Figure 6 shows the air mass trajectories with uptake and loss of moisture along its trajectory path. Most of the trajectories are falling within the range of 150 km which could be due to the topographic conditions and local micrometeorological effects. Starting from the initial (at CS, t=0) point to 60 h backwards, higher frequency of moisture uptake and loss were identified that further corroborates the intense recycling of moisture at the time of sampling started in the study region.
Comparison of our Results with Previous Studies
Using the cryogenic trapping method, Uemura et al. (2010) did an extensive survey from South Africa to Antarctica coasts and presented the δ18O and 17O-excess values which range from −11 to 24 permil and −10 to 50 permeg, respectively. In the present study, we have observed the comparable δ18O values (ranging from −10.2‰ to −19.4‰) while 17O-excess values are (−18 permeg to 122 permeg) significantly different compared to those of Uemura et al. (2010) results. The observed isotopic differences between Uemura and present study could be due to various factors including 1) the sampling site with varying latitude 2) change in the altitude 3) significant differences in RH during day and night time (Figure 3), 4) local moisture recycling (as can be seen through the air mass trajectories with varying SH and trajectories altitude from source to a target region), 5) convection and continental recycling (our sampling location is in the Chandra Valley (Western Himalaya) region where a sudden change in wind speed, T, RH is more prevalent and frequent as compared to the coastal regions). No correlation between 17O-excess and δ18O indicates about the mixing of 18O labelled depleted moisture that influences the δ18O, but it does not increase the 17O-excess (Uemura et al., 2010). The observed co-relation between 17O-excess and RH is in contrast to the earlier work (Uemura et al., 2010) but similar to the work done on African monsoon precipitation (Landais et al., 2010b). Eight days back trajectory analysis (Figure 5) shows the lack of coherency between D-excess and SH of moisture along their trajectory path together with varying SH with changing altitude. Therefore, our results indicate that local moisture recycling due to the micrometeorological induced evaporation and secondary evaporation from the nearby valley glaciers, valley wind effect at the regional scale and regional scale synoptic effects are the important players for the isotopic variations in water vapour. Isotopic compositions of rainwater in a recent work carried out by Kumar et al. (2018) shows the large variation in δ18O of precipitation at Chhota Shigri (ranged from −1.08‰ to −25.55‰) with LMWL slope and intercept of 7.9 and 21.4 respectively. The obtained slope in recent work is close to the GMWL slope and possibly due to the collection of rainwater samples mostly during Indian Summer Monsoon (ISM) dominance (June-August) period, which carries potential to attenuate the local micrometeorological conditions and thus isotopic results from the local processes. No precipitation event was recorded during our vapour sampling which was also reported by Kumar et al. (2018). However, if we use a simple Rayleigh distillation model to calculate the precipitation value by putting the vapour mean δ18O of −13.0‰, by assuming that there is no evaporation, no admixture of different moisture and only 20% of vapour condensed into the precipitation, the obtained δ18O of precipitation is −4.93‰ at the first step of progressive depletion and −9.80‰ at the fourth step of progressive depletion, that is closer to first rain event (after September 19, 2015, Kumar et al. 2018) after the vapour sampling period. Further results suggest that moisture recycling, an admixture of moisture from different valley regions compared to the regional scale synoptic events are important players at least during our measurement period. The GMWL (Rozanski et al., 2013), local meteoric water line (LMWL) and water vapour trend line comparison are shown (Figure 7). The LMWL slope of Delhi (Datta et al., 1991) is 6.8‰/‰ compared to GMWL which is due to the semiarid region where the secondary evaporation process is higher as compared to the Kashmir valley region where LMWL slope is 7.76‰/‰. Based on published work, the vapour slope at Nagqu, Tibet region was found to be 6.9‰/‰with a positive intercept of 23.2‰ (He and Richards, 2016). In this study, we present the vapour slope of 5.9‰/‰ with a positive intercept of 20.01‰. As we know that lower slope value compared to the GMWL is a result of evaporation process which occurs after condensation as raindrops fall through a column of dry air (Giustini et al., 2016) adding the kinetic fractionation on the drops themselves (Dansgaard, 1964). Gonfiantini, (1986) mathematically demonstrated such an effect and explained that lower humidity promotes the kinetic fractionation and thereby lowered the slope. The vapour slope of 6.9‰/‰ at Tibet and LMWL slope of 6.8‰/‰ at Delhi are closer but intercept shows substantial differences which reflects the behaviour of D-excess, mainly depending on T and RH. A lower slope with a positive intercept in Chhota Shigri water vapour indicated the dominant role of diffusive fractionation with low RH condition in this region. This can be further explained with the help of 17O-excess, as lowering of RH at the moisture source region would add up the 17O-excess in vapour and therefore, in precipitation but it is likely to be decoupled from local meteorological conditions due to the fact that CS is far from the coastal regions and locked within high mountains, thus prone for receiving recycled moistures. Similar finding were also observed in the mid latitude regions (Li et al. 2015; Tian et al. 2019). Furthermore, the measured vapour δ18O range of −10.26‰ to −19.43 ‰ would give a precipitation value of −0.56‰ to −10.26‰ (simple Rayleigh approach) at the first step of progressive depletion while it will further be depleted to −2.9‰ to −10.90‰ at its second step of progressive depletions. The obtained precipitation values through these steps are close to the available δ18O range from −9.8‰ to −2.1‰ during WD and −13.4‰ to −1.1‰ during ISM in Himachal Pradesh (Jeelani and Deshpande, 2017). It should be noted that our recorded vapour isotopic range are without any precipitation contribution during sampling time. Therefore, this tempted us to conclude that indeed western Himalayan regions bears significant offset values and maintain their own climatic settings that are decoupled from the original moisture source especially during the attenuated WD and ISM period. Therefore, care must be taken to interpret the palaeoclimatic signal in ice cores from these regions. More frequent vapour measurement from different valleys of western Himalayan region during WD and ISM dominance period would be helpful to understand the underlying mechanism in a better way.
FIGURE 7
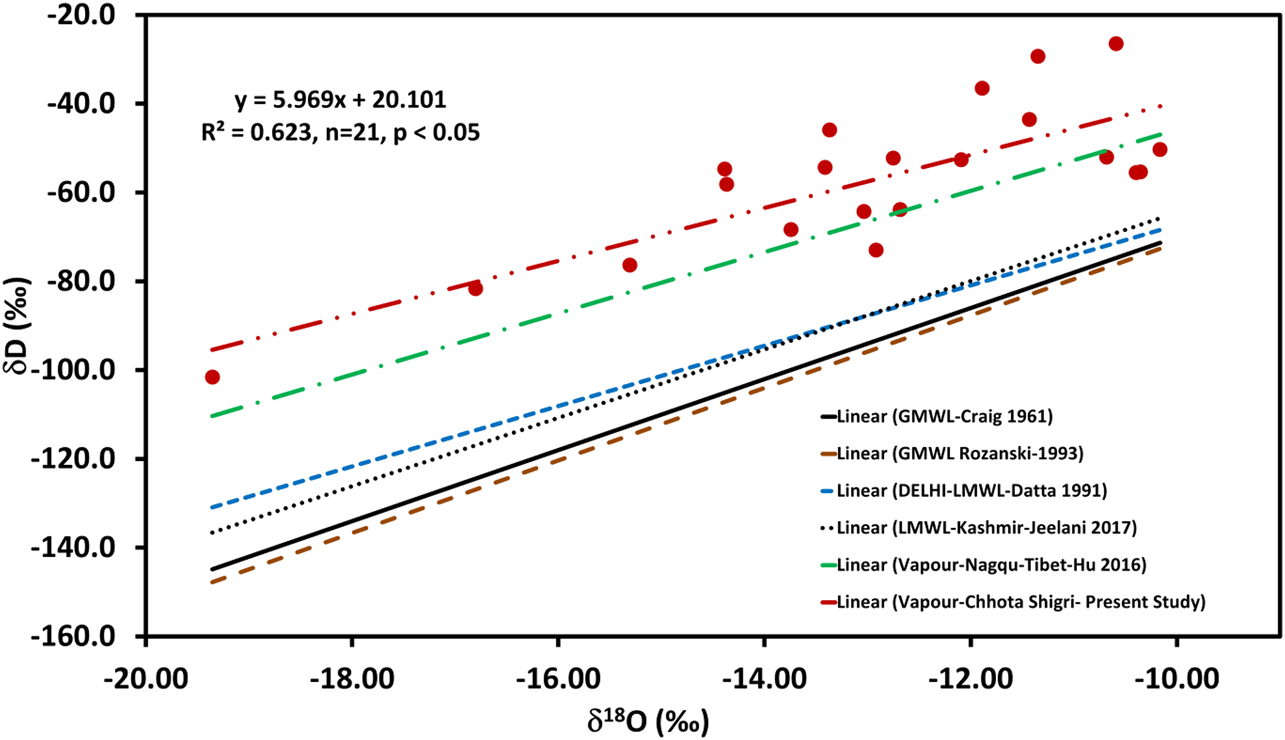
Correlation between δD and δ18O. It exhibits a slope of 5.96‰/‰ which is lower than the vapor at Nagqu, Tibet region (slope, 6.9). The positive intercept of 20.10 is, however, comparable (intercept, 23.2‰) to the Nagqu, Tibetan site.
Conclusion
We measured the water vapour isotopic compositions of Chhota Shigri glacier with the aim to provide for the first time triple oxygen isotopes results of water vapour. Based on the results of this study we conclude the following points:
The amplitude of 17O-excess is higher compared to the study performed on South Indian and Southern Ocean coastal region above the Ocean which could be due to the secondary evaporation imparting kinetic fractionation along with the possibilities of mixing of different valley air masses adjacent to the Chhota Shigri site. This can be further confirmed through the moisture source diagnostics that indicate multiple evaporation (humidity uptake) and condensation (precipitation) cycle before it’s descend at the sampling location. Furthermore, trajectory analysis shows that the majority of the moisture sources are along a 100 km long range mainly from the south-west direction of the sampling location. It indicates the strong local moisture recycling process mainly controlled by orographic conditions as well as local evaporation processes evidenced through the changing specific humidity along the trajectory path. The positive correction between RH and 17O-excess is in contrast to the results obtained from the South Indian Ocean and Southern Ocean region (Uemura et al., 2010) but similar to the work done on African monsoon (Landais et al., 2010a) suggesting the influence of local air masses, mainly from the nearby valley glaciers. The calculated slope between δ18O and δD at Chhota Shigri glacier region shows a large deviation from GMWL but comparable to another high altitude region, Nagqu, Tibet (He and Richards, 2016). This could be possible if local climatic settings with stark changes in T and RH due to orography and complex terrain dominate over direct influence of long range transported signals. Furthermore, higher δ18O variation range −10.26‰ to −19.42‰ within one week of sampling with no encounter of precipitation events (attenuated period of ISM and WD) suggest that western Himalayan region having their own climatic settings where intense moisture mixing, moisture recycling and re-evaporative conditions prevail. Therefore, care must be taken during palaeoclimatic studies i.e. ice core, lake sediment pore water and its data interpretation from these regions.
Despite the high altitude harsh environment and difficulties to perform such kind of experiment, long series data sets especially from the Indian summer monsoon (July-August) and western disturbances (December- January) dominance time period would be needed for better understanding the moisture source quantification to the water vapour of Himalayan region. This will further help to understand the Asian water tower hydrological balance and the role of water vapour on Himalayan glaciers due to climate change. Further intensive vapour sampling at the glacier surface would be helpful too for disentangle the kinetic and equilibrium fractionation impact on water vapour isotopologues in the Himalayan region.
Statements
Data availability statement
The raw data supporting the conclusions of this article will be made available by the authors, without undue reservation.
Author contributions
SR and AR developed the concept for sampling and wrote the manuscript with the help of ML. TK, NK, VS, and MP helped in vapour sampling and writing of the manuscript.
Acknowledgments
The author also would like to thank Chandranath Chatterjee and Adhikari Ji for helping in vapor sampling. Support from DST-YS, BRNS, SAC, DST-UKERI and CSIR-SRA (13-9059-A-2019 Pool) are acknowledged. We thank the Science and Engineering Board (SERB) for funding this project (Project no: SR/FTP/ES-134/2014) and BRNS (2013/35/21/BRNS/0427) for purchasing the PICARRO-CRDS-L2140i for triple oxygen isotope measurement in water.
Conflict of interest
The authors declare that the research was conducted in the absence of any commercial or financial relationships that could be construed as a potential conflict of interest.
Supplementary material
The Supplementary Material for this article can be found online at: https://www.frontiersin.org/articles/10.3389/feart.2020.599632/full#supplementary-material.
References
1
AngertA.CappaC. D.DePaoloD. J. (2004). Kinetic 17O effects in the hydrologic cycle: indirect evidence and implications. Geochem. Cosmochim. Acta68, 3487–3495. 10.1016/j.gca.2004.02.010CrossRef Full Text | Google Scholar
2
AngertA.LeeJ.-E.YakirD. (2008). Seasonal variations in the isotopic composition of near-surface water vapour in the eastern Mediterranean. Tellus B60, 674–684. 10.1111/j.1600-0889.2008.00357.xCrossRef Full Text | Google Scholar
3
AzamM. F.RamanathanA.WagnonP.VincentC.LindaA.BerthierE.et al (2016). Meteorological conditions, seasonal and annual mass balances of Chhota Shigri Glacier, western Himalaya, India. Ann. Glaciol.57, 328–338. 10.3189/2016AoG71A570CrossRef Full Text | Google Scholar
4
AzamM. F.WagnonP.RamanathanA.VincentC.SharmaP.ArnaudY.et al (2012). From balance to imbalance: a shift in the dynamic behaviour of Chhota Shigri glacier, western Himalaya, India. J. Glaciol.58, 315–324. 10.3189/2012JoG11J123CrossRef Full Text | Google Scholar
5
AzamM. F.WagnonP.VincentC.RamanathanA.LindaA.SinghV. B. (2014). Reconstruction of the annual mass balance of Chhota Shigri glacier, western Himalaya, India, since 1969. Ann. Glaciol.55, 69–80. 10.3189/2014AoG66A104CrossRef Full Text | Google Scholar
6
BarkanE.LuzB. (2007). Diffusivity fractionations of H2(16)O/H2(17)O and H2(16)O/H2(18)O in air and their implications for isotope hydrology. Rapid Commun. Mass Spectrom21, 2999–3005. 10.1002/rcm.3180PubMed Abstract | CrossRef Full Text | Google Scholar
7
BarkanE.LuzB. (2005). High precision measurements of 17O/16O and 18O/16O ratios in H2O. Rapid Commun. Mass Spectrom19, 3737–3742. 10.1002/rcm.2250PubMed Abstract | CrossRef Full Text | Google Scholar
8
BarkanE.LuzB. (2003). High-precision measurements of17O/16O and18O/16O of O2 and O2/Ar ratio in air. Rapid Commun. Mass Spectrom17, 2809–2814. 10.1002/rcm.1267PubMed Abstract | CrossRef Full Text | Google Scholar
9
BechtelC.ZahnA. (2003). The isotope composition of water vapour: a powerful tool to study transport and chemistry of middle atmospheric water vapour. Atmos. Chem. Phys. Discuss3, 3991–4036. 10.5194/acpd-3-3991-2003CrossRef Full Text | Google Scholar
10
BreitenbachS. F. M.AdkinsJ. F.MeyerH.MarwanN.KumarK. K.HaugG. H. (2010). Strong influence of water vapor source dynamics on stable isotopes in precipitation observed in Southern Meghalaya, NE India. Earth Planet Sci. Lett.292, 212–220. 10.1016/j.epsl.2010.01.038CrossRef Full Text | Google Scholar
11
ByersH. R. (1959). General meteorology. New York: McGraw-Hill, Vol. 3. CrossRef Full Text | Google Scholar
12
CraigH. (1961). Standard for reporting concentrations of deuterium and oxygen-18 in natural waters. Science133, 1833–1834. 10.1126/science.133.3467.1833PubMed Abstract | CrossRef Full Text | Google Scholar
13
DansgaardW. (1964). Stable isotopes in precipitation. Tellus16, 436–468. 10.3402/tellusa.v16i4.8993CrossRef Full Text | Google Scholar
14
DansgaardW. (1953). The abundance of 18O in atmospheric water and water vapour. Tellus5, 461–469. 10.1111/j.2153-3490.1953.tb01076.xCrossRef Full Text | Google Scholar
15
DansgaardW. (1954). The O18-abundance in fresh water. Geochem. Cosmochim. Acta.6, 241–260. 10.1016/0016-7037(54)90003-4CrossRef Full Text | Google Scholar
16
DattaP. S.TyagiS. K.ChandrasekharanH. (1991). Factors controlling stable isotope composition of rainfall in New Delhi, India. J. Hydrol.128, 223–236. 10.1016/0022-1694(91)90139-9CrossRef Full Text | Google Scholar
17
DelattreH.Vallet-CoulombC.SonzogniC. (2015). Deuterium excess in the atmospheric water vapour of a Mediterranean coastal wetland: regional vs. local signatures. Atmos. Chem. Phys.15, 10167–10181. 10.5194/acp-15-10167-2015CrossRef Full Text | Google Scholar
18
DeshpandeR. D.MauryaA. S.KumarB.SarkarA.GuptaS. K. (2010). Rain-vapor interaction and vapor source identification using stable isotopes from semiarid western India. J. Geophys. Res. Atmos.115, 1–11. 10.1029/2010JD014458CrossRef Full Text | Google Scholar
19
DobhalD. P.KumarS.MundepiA. K. (1995). Morphology and glacier dynamics studies in monsoon-arid transition zone: an example from Chhota Shigri glacier, Himachal-Himalaya, India. Curr. Sci.68, 936–944.. CrossRef Full Text | Google Scholar
20
DraxlerR. R.HessG. D. (1998). An overview of the HYSPLIT_4 modelling system for trajectories, dispersion, and deposition. Aust. Meteorol. Mag.
21
DraxlerR. R.RolphG. D. (2003). HYSPLIT (HYbrid single-particle Lagrangian integrated trajectory). College Park, MD: NOAA Air Resources. LaboratoryAvailable at: https://www.arl.noaa.gov/hysplit/hysplit/ (Accessed 2003). CrossRef Full Text | Google Scholar
22
DuttG. N. (1961). The Bara Shigri glacier, kangra district, east Punjab, India. J. Glaciol.3, 1007–1015. 10.3189/S0022143000017421CrossRef Full Text | Google Scholar
23
FroehlichK.GibsonJ. J.AggarwalP. K. (2002). Deuterium excess in precipitation and its climatological significance. Vienna, Austria: International Atomic Energy Agency (IAEA)Available at: http://inis.iaea.org/search/search.aspx?orig_q=RN:34017972 (Accessed October 2002). CrossRef Full Text | Google Scholar
24
GadgilS. (2003). The Indian monsoon and its variability. Annu. Rev. Earth Planet. Sci.10.1146/annurev.earth.31.100901.141251
25
GalewskyJ.Steen-LarsenH. C.FieldR. D.WordenJ.RisiC.SchneiderM. (2016). Stable isotopes in atmospheric water vapor and applications to the hydrologic cycle. Rev. Geophys.54, 809–865. 10.1002/2015RG000512PubMed Abstract | CrossRef Full Text | Google Scholar
26
GardelleJ.BerthierE.ArnaudY. (2012). Slight mass gain of Karakoram glaciers in the early twenty-first century. Nat. Geosci.5, 322–325. 10.1038/ngeo1450CrossRef Full Text | Google Scholar
27
GatJ. R.KleinB.KushnirY.RoetherW.WernliH.YamR.et al (2003). Isotope composition of air moisture over the Mediterranean Sea: an index of the air-sea interaction pattern. Tellus B55, 953–965. 10.1034/j.1600-0889.2003.00081.xCrossRef Full Text | Google Scholar
28
GatJ. R. (1996). Oxygen and hydrogen isotopes in the hydrological cycle. Annu. Rev. Earth Planet Sci.24, 225–262. 10.1146/annurev.earth.24.1.225CrossRef Full Text | Google Scholar
29
GiustiniF.BrilliM.PateraA. (2016). Mapping oxygen stable isotopes of precipitation in Italy. J. Hydrol. Reg. Stud.8, 162–181. 10.1016/j.ejrh.2016.04.001CrossRef Full Text | Google Scholar
30
GonfiantiniR. (1986). “Environmental isotopes in lake studies,” in The Terrestrial Environment. B. 113–168. 10.1016/B978-0-444-42225-5.50008-5CrossRef Full Text | Google Scholar
31
HeS.RichardsK. (2016). Stable isotopes in monsoon precipitation and water vapour in Nagqu, Tibet, and their implications for monsoon moisture. J. Hydrol.540, 615–622. 10.1016/j.jhydrol.2016.06.046CrossRef Full Text | Google Scholar
32
HoffmannG.HeimannM. (1997). Water isotope modeling in the Asian monsoon region. Quat. Int37, 115–128. 10.1016/1040-6182(96)00004-3CrossRef Full Text | Google Scholar
33
HoritaJ.WesolowskiD. J. (1994). Liquid-vapor fractionation of oxygen and hydrogen isotopes of water from the freezing to the critical temperature. Geochem. Cosmochim. Acta.58, 3425–3437. 10.1016/0016-7037(94)90096-5CrossRef Full Text | Google Scholar
34
JamesP.StohlA.SpichtingerN.EckhardtS.ForsterC. (2004). Climatological aspects of the extreme European rainfall of August 2002 and a trajectory method for estimating the associated evaporative source regions. Nat. Hazards Earth Syst. Sci.4, 733–746. 10.5194/nhess-4-733-2004
35
JeelaniG.DeshpandeR. D.ShahR. A.HassanW. (2017). Influence of southwest monsoons in the Kashmir valley, western Himalayas. Isotopes Environ. Health Health Stud.53, 400–412. 10.1080/10256016.2016.1273224PubMed Abstract | CrossRef Full Text | Google Scholar
36
JeelaniG.DeshpandeR. D. (2017). Isotope fingerprinting of precipitation associated with western disturbances and Indian summer monsoons across the Himalayas. J. Earth Syst. Sci.128, 108. 10.1007/s12040-017-0894-zCrossRef Full Text | Google Scholar
37
JouzelJ.HoffmannG.KosterR. D.MassonV. (2000). Water isotopes in precipitation. Quat. Sci. Rev.19, 363–379. 10.1016/S0277-3791(99)00069-4CrossRef Full Text | Google Scholar
38
KleinE. S.CherryJ. E.YoungJ.NooneD.LefflerA. J.WelkerJ. M. (2015). Arctic cyclone water vapor isotopes support past sea ice retreat recorded in Greenland ice. Sci. Rep.5, 10295. 10.1038/srep10295PubMed Abstract | CrossRef Full Text | Google Scholar
39
KrishanG.RaoM. S.KumarB.KumarC. P. (2015). Possibility of using isotopic composition of ground-level vapour for monitoring arrival and withdrawl of southwest monsoon. Curr. Sci.108, 784–786.. CrossRef Full Text | Google Scholar
40
KumarN.RamanathanA.KeesariT.ChidambaramS.RanjanS.SohebM.et al (2018). Tracer-based estimation of temporal variation of water sources: an insight from supra- and subglacial environments. Hydrol. Sci. J63, 1717–1732. 10.1080/02626667.2018.1526381CrossRef Full Text | Google Scholar
41
KumarS.DobhalD. P. (1997). Climatic effects and bedrock control on rapid fluctuations of Chhota Shigri glacier, northwest Himalaya, India. J. Glaciol.43, 467–472. 10.3189/S0022143000035061CrossRef Full Text | Google Scholar
42
KuritaN.NewmanB. D.Araguas-AraguasL. J.AggarwalP. (2012). Evaluation of continuous water vapor δd and δ18O measurements by off-axis integrated cavity output spectroscopy. Atmos. Meas. Tech.5, 2069–2080. 10.5194/amt-5-2069-2012CrossRef Full Text | Google Scholar
43
LandaisA.BarkanE.LuzB. (2008). Record of δ18O and 17O-excess in ice from Vostok Antarctica during the last 150,000 years. Geophys. Res. Lett35, 1–5. 10.1029/2007GL032096CrossRef Full Text | Google Scholar
44
LandaisA.BarkanE.YakirD.LuzB. (2006). The triple isotopic composition of oxygen in leaf water. Geochem. Cosmochim. Acta.70, 4105–4115. 10.1016/j.gca.2006.06.1545CrossRef Full Text | Google Scholar
45
LandaisA.EkaykinA.BarkanE.WinklerR.LuzB. (2012). Seasonal variations of 17 O-excess and d-excess in snow precipitation at Vostok station, East Antarctica. J. Glaciol.58, 725–733. 10.3189/2012JoG11J237CrossRef Full Text | Google Scholar
46
LandaisA.RisiC.BonyS.VimeuxF.DescroixL.FalourdS.et al (2010a). Combined measurements of 17 O excess and d-excess in African monsoon precipitation : implications for evaluating convective parameterizations. Earth Planet Sci. Lett.298, 104–112. 10.1016/j.epsl.2010.07.033CrossRef Full Text | Google Scholar
47
LandaisA.RisiC.BonyS.VimeuxF.DescroixL.FalourdS.et al (2010b). Combined measurements of 17Oexcess and d-excess in African monsoon precipitation: implications for evaluating convective parameterizations. Earth Planet Sci. Lett.298, 104–112. 10.1016/j.epsl.2010.07.033CrossRef Full Text | Google Scholar
48
LiS.LevinN. E.ChessonL. A. (2015). Continental scale variation in 17O-excess of meteoric waters in the United States. Geochim. Cosmochim. Acta164, 110–126. 10.1016/j.gca.2015.04.047
49
LoneS. A.JeelaniG.DeshpandeR. D.MukherjeeA. (2019). Stable isotope (δ18O and δD) dynamics of precipitation in a high altitude Himalayan cold desert and its surroundings in Indus river basin, Ladakh. Atmos. Res.10.1016/j.atmosres.2019.01.025
50
LuzB.BarkanE. (2010). Variations of 17O/16O and 18O/16O in meteoric waters. Geochem. Cosmochim. Acta.74, 6276–6286. 10.1016/j.gca.2010.08.016CrossRef Full Text | Google Scholar
51
MadhuraR. K.KrishnanR.RevadekarJ. V.MujumdarM.GoswamiB. N. (2014). Changes in western disturbances over the Western Himalayas in a warming environment. Clim. Dynam.44, 1157–1168. 10.1007/s00382-014-2166-9CrossRef Full Text | Google Scholar
52
NguyenJ. L.DockeryD. W. (2016). Daily indoor-to-outdoor temperature and humidity relationships: a sample across seasons and diverse climatic regions. Int. J. Biometeorol60, 221. 10.1007/s00484-015-1019-5PubMed Abstract | CrossRef Full Text | Google Scholar
53
NietoR.Durán-QuesadaA.GimenoL. (2010). Major sources of moisture for Antarctic ice-core sites identified through a Lagrangian approach. Clim. Res.41, 45–49. 10.3354/cr00842CrossRef Full Text | Google Scholar
54
OzaH.GangulyA.PadhyaV.DeshpandeR. D. (2020). Hydrometeorological processes and evaporation from falling rain in Indian sub-continent: insights from stable isotopes and meteorological parameters. J. Hydrol.591, 125601. 10.1016/j.jhydrol.2020.125601CrossRef Full Text | Google Scholar
55
RamanathanA. L. (2011). Status report on Chhota Shigri Glacier (Himachal Pradesh). Department of Science and Technology, Ministry of Science and Technology, New Delhi, Himalayan Glaciology Technical Report Number 1, 88p.
56
RisiC.LandaisA.BonyS.JouzelJ.Masson-DelmotteV.VimeuxF. (2010). Understanding the 17 O excess glacial-interglacial variations in Vostok precipitation. J. Geophys. Res.115, D10112. 10.1029/2008JD011535CrossRef Full Text | Google Scholar
57
RozanskiK.Araguás-AraguásL.GonfiantiniR. (2013). Isotopic patterns in modern global precipitation,” in Climate Change in continental isotopic records. Washington, DC: American Geophysical Union, 78, 1–36. CrossRef Full Text | Google Scholar
58
RozanskiK.SonntagC. (1982). Vertical distribution of deuterium in atmospheric water vapour. Tellus34, 135–141. 10.1111/j.2153-3490.1982.tb01800.xCrossRef Full Text | Google Scholar
59
SaxenaM. N. (1971). The crystalline axis of the Himalaya: the Indian shield and continental drift. Tectonophysics12, 433–447. 10.1016/0040-1951(71)90044-8CrossRef Full Text | Google Scholar
60
SchoenemannS. W.SchauerA. J.SteigE. J. (2013). Measurement of SLAP2 and GISP δ17O and proposed VSMOW-SLAP normalization for δ17O and 17O excess. Rapid Commun. Mass Spectrom27, 582–590. 10.1002/rcm.6486PubMed Abstract | CrossRef Full Text | Google Scholar
61
SikkaD. R. (1977). Some aspects of the life history, structure and movement of monsoon depressions. Pure Appl. Geophys.115, 1501–1529. 10.1007/BF00874421CrossRef Full Text | Google Scholar
62
SinghP.JainS. K.KumarN. (1997). Estimation of snow and glacier-melt contribution to the chenab river, western Himalaya. Mt. Res. Dev.17, 49. 10.2307/3673913CrossRef Full Text | Google Scholar
63
SinghV. B.RamanathanA. L.SharmaP.PottakkalJ. G. (2015). Dissolved ion chemistry and suspended sediment characteristics of meltwater draining from Chhota Shigri Glacier, western Himalaya, India. Arab. J. Geosci.8, 281–293. 10.1007/s12517-013-1176-yCrossRef Full Text | Google Scholar
64
SinghV. B.RamanathanA.PottakkalJ. G.LindaA.SharmaP. (2013). Temporal variation in the major ion chemistry of Chhota Shigri glacier meltwater, Lahaul-Spiti Valley, Himachal Pradesh, India. Natl. Acad. Sci. Lett.36, 335–342. 10.1007/s40009-013-0135-1CrossRef Full Text | Google Scholar
65
SodemannH.SchwierzC.WernliH. (2008). Interannual variability of Greenland winter precipitation sources: Lagrangian moisture diagnostic and North Atlantic Oscillation influence. J. Geophys. Res.113, D03107. 10.1029/2007JD008503
66
SodemannH.StohlA. (2009). Asymmetries in the moisture origin of Antarctic precipitation. Geophys. Res. Lett.36, 1–5. 10.1029/2009GL040242CrossRef Full Text | Google Scholar
67
SteinA. F.DraxlerR. R.RolphG. D.StunderB. J. B.CohenM. D.NganF. (2015). NOAA’s HYSPLIT atmospheric transport and dispersion modeling system. Bull. Am. Meteorol. Soc.96, 2059–2077. 10.1175/BAMS-D-14-00110.1
68
TianC.WangL.TianF.ZhaoS.JiaoW. (2019). Spatial and temporal variations of tap water 17O-excess in China. Geochim. Cosmochim. Acta. 10.1016/j.gca.2019.06.015
69
TyndallJ. (1861). XXIII. On the absorption and radiation of heat by gases and vapours, and on the physical connexion of radiation, absorption, and conduction—The bakerian lecture. Lond. Edinburgh Dublin Philos. Mag. J. Sci.22, 169–194. 10.1080/14786446108643138CrossRef Full Text | Google Scholar
70
UemuraR.BarkanE.AbeO.LuzB. (2010). Triple isotope composition of oxygen in atmospheric water vapor. Geophys. Res. Lett.37, 1–4. 10.1029/2009GL041960CrossRef Full Text | Google Scholar
71
UemuraR.MatsuiY.YoshimuraK.MotoyamaH.YoshidaN. (2008). Evidence of deuterium excess in water vapor as an indicator of ocean surface conditions. J. Geophys. Res. Atmos.113, 1–10. 10.1029/2008JD010209CrossRef Full Text | Google Scholar
72
WagnonP.LindaA.ArnaudY.KumarR.SharmaP.VincentC.et al (2007). Four years of mass balance on Chhota Shigri Glacier, Himachal Pradesh, India, a new benchmark glacier in the western Himalaya. J. Glaciol.53, 603–611. 10.3189/002214307784409306CrossRef Full Text | Google Scholar
73
WangS.ZhangM.CrawfordJ.HughesC. E.DuM.LiuX. (2017). The effect of moisture source and synoptic conditions on precipitation isotopes in arid central Asia. J. Geophys. Res. 10.1002/2015JD024626
74
WangX.-F.YakirD. (2000). Using stable isotopes of water in evapotranspiration studies. Hydrol. Process14, 1407–1421. 10.1002/1099-1085(20000615)14:8<1407::AID-HYP992>3.0.CO;2-KCrossRef Full Text | Google Scholar
75
WinklerR.LandaisA.RisiC.BaroniM.EkaykinA.JouzelJ.et al (2013). Interannual variation of water isotopologues at Vostok indicates a contribution from stratospheric water vapor. Proc. Natl. Acad. Sci. U.S.A.110, 17674–17679. 10.1073/pnas.1215209110PubMed Abstract | CrossRef Full Text | Google Scholar
76
YinC.YaoT.TianL.LiuD.YuW.QuD. (2008). Temporal variations of δ18O of atmospheric water vapor at Delingha. Sci. China Earth Sci.51, 966–975. 10.1007/s11430-008-0076-6CrossRef Full Text | Google Scholar
77
YoungE. D.GalyA.NagaharaH. (2002). Kinetic and equilibrium mass-dependent isotope fractionation laws in nature and their geochemical and cosmochemical significance. Geochim. Cosmochim. Acta66, 1095–1104. 10.1016/S0016-7037(01)00832-8
78
YuW.TianL.MaY.XuB.QuD. (2015). Simultaneous monitoring of stable oxygen isotope composition in water vapour and precipitation over the central Tibetan Plateau. Atmos. Chem. Phys. Discuss15, 14445–14472. 10.5194/acpd-15-14445-2015CrossRef Full Text | Google Scholar
Summary
Keywords
Water vapour, isotopologues, Himalaya, microclimate, moisture source, long range transport
Citation
Ranjan S, Ramanathan AL, Keesari T, Singh VB, Kumar N, Pandey M and Leuenberger MC (2021) Triple Water Vapour–Isotopologues Record from Chhota Shigri, Western Himalaya, India: A Unified Interpretation based on δ17O, δ18O, δD and Comparison to Meteorological Parameters. Front. Earth Sci. 8:599632. doi: 10.3389/feart.2020.599632
Received
27 August 2020
Accepted
30 November 2020
Published
14 January 2021
Volume
8 - 2020
Edited by
Fernando Gazquez, University of Almería, Spain
Reviewed by
Soumita Boral, Indian Institute of Technology Kanpur, India
Haiwei Zhang, Xi'an Jiaotong University, China
Updates
Copyright
© 2021 Ranjan, Ramanathan, Keesari, Singh, Kumar, Pandey and Leuenberger.
This is an open-access article distributed under the terms of the Creative Commons Attribution License (CC BY). The use, distribution or reproduction in other forums is permitted, provided the original author(s) and the copyright owner(s) are credited and that the original publication in this journal is cited, in accordance with accepted academic practice. No use, distribution or reproduction is permitted which does not comply with these terms.
*Correspondence: AL. Ramanathan, alrjnu@gmail.com; Markus C. Leuenberger, markus.leuenberger.climate.unibe.ch
This article was submitted to Geochemistry, a section of the journal Frontiers in Earth Science
Disclaimer
All claims expressed in this article are solely those of the authors and do not necessarily represent those of their affiliated organizations, or those of the publisher, the editors and the reviewers. Any product that may be evaluated in this article or claim that may be made by its manufacturer is not guaranteed or endorsed by the publisher.