 Junli You
 Maoqiu Jian
 Si Gao
 Jingjiu Cai4
- 1School of Atmospheric Sciences, Center for Monsoon and Environment Research and Guangdong Province Key Laboratory for Climate Change and Natural Disaster Studies, Sun Yat-Sen University, Zhuhai, China
- 2Lishui Meteorological Bureau, Lishui, China
- 3Southern Marine Science and Engineering Guangdong Laboratory (Zhuhai), Zhuhai, China
- 4Guangdong Meteorological Observatory, Guangzhou, China
The interdecadal change of the winter-spring tropospheric temperature over Asia and its impact on the South China Sea summer monsoon (SCSSM) onset are investigated in this study. The SCSSM onset experiences a significant advance around the mid-1990s, which is attributed to the positive interdecadal anomaly of meridional temperature gradient in the mid-upper troposphere in May over the South China Sea monsoon region. This positive interdecadal anomaly can be traced back to the previous winter and spring, mainly associated with the mid-upper tropospheric warming in the East Asian subtropics. During the interdecadal anomalous seasonal evolution of the East Asian subtropical mid-upper tropospheric temperature, advection of the warm temperature anomaly by climatological mean wind overtakes the effects of anomalous adiabatic cooling and diabatic cooling, leading to a net interdecadal seasonal warming in winter. In spring, the adiabatic heating caused by the interdecadal anomalous subsidence flow cannot offset the effects of interdecadal anomalous cold advection and diabatic cooling, resulting in a net interdecadal seasonal cooling. However, the interdecadal seasonal cooling in spring is not strong enough to offset the interdecadal seasonal warming in winter, preserving an interdecadal mid-upper tropospheric warming over the subtropical East Asia in late spring. This interdecadal warming provides a favorable condition for the interdecadal advance of the SCSSM onset. Both observational analyses and numerical experiments suggest that the interdecadal change of atmospheric thermodynamic processes in winter−spring is related to the interdecadal warming in the tropical western Pacific. The enhanced convection and condensation heating over the regions from the South China Sea to the Philippines, forced by the tropical western Pacific warming, stimulates an anomalous anticyclone in the upper troposphere and warming in the whole troposphere over the subtropical East Asia.
Introduction
The South China Sea (SCS) is located in the center of the Asian-Australian monsoon system, connecting the Indian Ocean and the Pacific. The SCS summer monsoon (SCSSM) affects not only the local climate, but also other areas through the energy and water cycle, and is closely associated with other monsoon systems (Murakami and Matsumoto, 1994; Wang et al., 2009; Jiang et al., 2018). The onset of SCSSM marks the end of the dry season in East Asia and the northwest Pacific, accompanied by the arrival of the summer rainy season. With the stepwise northward advance of the summer monsoon in East Asia, the monsoon rainband is established in South China, the Yangtze and Yellow River Basins in sequence, and Baiu in Japan and Changma in Korea occur at last (Tao and Chen, 1987; Ding, 1992; Qian et al., 2002; Wang and Lin, 2002; Ding and Chan, 2005). The abnormal onset timing of SCSSM has a great impact on the distribution of precipitation in eastern China, and even causes disasters such as floods and droughts. Some studies suggested that the relationship between the SCSSM onset and the precipitation over eastern China is regulated by the thermal state of the western Pacific warm pool. When the tropical western Pacific warm pool warms up, there is enhanced convection over the region from the Philippines across the SCS to the Indo-China peninsula, resulting in an early onset of SCSSM and more obvious northward jump of the western Pacific subtropical high, and eventually leading to less precipitation in the middle and lower reaches of the Yangtze River and more precipitation in the northern part of China, and vice versa (Huang and Sun, 1994; Huang et al., 2005). He and Zhu (2015) further pointed out that the positive (negative) SST anomaly in the tropical Indian Ocean in spring and summer can excite an anomalous anticyclone (cyclone) over the western Pacific via stimulating the Kelvin wave response, resulting in late (early) SCSSM onset and more (less) precipitation over lower reaches of the Yangtze River and the south of Japan from May to September. Actually, the SCSSM onset shows distinctive interannual and interdecadal variabilities (Wang et al., 2009; Kajikawa et al., 2012; Kajikawa and Wang, 2012; Xiang and Wang, 2013; Yuan and Chen, 2013; Luo and Lin, 2017). Therefore, it is of great significance to better understand the influence factors and physical mechanisms affecting the SCSSM onset.
Li and Yanai (1996) indicated that the Asian summer monsoon is first established in the Bay of Bengal, and then erupts successively in the Indo-China Peninsula and the SCS, and the Indian monsoon breaks out at last. Such sequence of the Asian summer monsoon onset is consistent with the seasonal reversal of the meridional temperature gradient (MTG) in the mid-upper troposphere south of Tibetan Plateau. As for climatological mean state, the SCSSM outbreaks in mid-May with the transition from easterlies to westerlies in the lower troposphere and from westerlies to easterlies in the upper troposphere, and MTG switches from negative to positive over the SCS. The positive mid-upper tropospheric MTG provides a favorable thermal condition for maintaining the circulation background of easterly vertical shear over the SCS and the SCSSM onset (Jian and Luo, 2001; Wu and Wang, 2001). The seasonal reversal of the MTG over the SCS is caused by a faster seasonal rising in the mid-upper tropospheric temperature over the northern SCS and surrounding area, which is primarily contributed by the warm advection process, than over the equatorial region (Jian and Luo, 2001). Mao et al. (2004) also suggested that the Asian summer monsoon onset is closely associated with the MTG overturning in the mid-upper troposphere.
Recently, many studies revealed that the SCSSM onset showed a significant interdecadal advance around 1993/94 (Kajikawa and Wang, 2012; Kajikawa et al., 2012; Xiang and Wang, 2013; Yuan and Chen, 2013; Luo and Lin, 2017). Kajikawa and Wang (2012) suggested the interdecadal warming of the western tropical Pacific accounts for the interdecadal advance of the SCSSM onset. Yuan and Chen (2013) further explained that the interdecadal warming of the tropical western Pacific leads to active convection over there and early eastward retreat of the western Pacific subtropical high, which favors the early onset of the SCSSM. Lin and Zhang (2020) suggested that the interdecadal warming over the western equatorial Pacific modulates the low-level zonal winds around the Kalimantan Island, which affects the subtropical high and the interdecadal advanced SCSSM onset. Xiang and Wang (2013) found more specific results that the early onset of the summer monsoon in the Arabian Sea and the Bay of Bengal is mainly regulated by the zonal sea surface temperature (SST) gradient in the equatorial Pacific, while the early onset of the SCSSM is mainly attributed to the positive SST anomaly near the Philippine Sea.
The previous studies mainly emphasize the influence of SST on the atmospheric circulation and the SCSSM onset, while the influence of the tropospheric temperature in the Asian monsoon region on the interdecadal advanced SCSSM onset around 1993/94 is less explored in terms of internal thermodynamic mechanisms and related external SST forcing. Specifically, the interdecadal change of the tropospheric temperature over the Asian monsoon region from winter to spring and its relationship with the interdecadal advanced SCSSM onset, as well as the responsible thermodynamic mechanisms and the influence of the interdecadal SST warming over the tropical Pacific are still unclear. It should be noted that not only the spring season but also the winter season have been concerned in this study, because the pronounced interdecadal warming in the winter troposphere over the subtropical East Asia plays a pivotal role on the interdecadal advanced SCSSM onset around 1993/94, which has been authenticated in this study. The aim of this study is to address the above issues. This paper is organized as follows. The datasets and methods are described in Datasets and Methods. SCSSM Onset-Related Interdecadal Change of Mid-Upper Tropospheric Temperature over Asia in Winter-Spring illustrates the SCSSM onset-related interdecadal change of the mid-upper tropospheric temperature over the Asian monsoon region in winter and spring. The seasonal evolution and the thermodynamic mechanisms of interdecadal change of the mid-upper tropospheric temperature over the East Asian subtropics are investigated in Mechanisms for Interdecadal Warming over East Asian Subtropics. Then, Interdecadal Change of Tropical Western Pacific SST and its Impacts discusses the effect of the interdecadal change in Indo-Pacific SST on the mid-upper tropospheric warming over the East Asian subtropics in winter and spring, based on diagnostic analyses. Simulation of the Impacts of Diabatic Heating Anomalies Around the SCS and Philippines presents the simulations of the impact of diabatic heating over the SCS-Philippines on the interdecadal advanced SCSSM onset. Finally, a summary and a discussion are presented in Summary and Discussion.
Datasets and Methods
Datasets
The datasets used in this study are the European Center for Medium–Range Weather Forecasts (ECMWF) Interim reanalysis dataset (ERA-Interim; Dee et al., 2011) during the period 1979–2017, including four times daily (00, 06, 12 and 18 UTC) data and monthly mean data of wind, temperature and specific humidity at 18 standard pressure levels from 1,000 hPa to 100 hPa, with a horizontal resolution of 2.5 × 2.5°. In addition, the monthly mean SST data during 1979–2017 are from the Hadley Center (HadISST) with horizontal resolution of 1 × 1° (Rayner et al., 2003).
Definition of the SCSSM Onset Date
According to Lin et al. (2013), the SCSSM onset date is defined to be the first day when the steady westerlies at 850 hPa and easterlies at 250 hPa establish over the SCS region (5°–17.5°N, 110°–120°E) and last for at least 5 days.
Calculation of the Apparent Heat Source
The apparent heat source
where T is air temperature, θ the potential temperature, V the horizontal wind, ω the vertical p-velocity, κ = R/cp, R and cp are the gas constant and the specific heat at constant pressure of dry air, and p0 = 1,000 hPa.
For convenience, let
Then, Eq. 1 can be rewritten as
Where
In addition, since this study will discuss the inter-monthly temperature change, it is necessary to give the thermodynamic expression for determining the monthly mean temperature change between two adjacent months as Eq. 4, and its derivation is shown in Appendix in detail, according to the thermodynamic equation and assuming each month has 30 days.
where Ti,n is the daily mean temperature on the n-th day of the i-th calendar month, F the net effect of all thermal forcing terms on the right side of Eq. 3.
Linear Baroclinic Model
The linear baroclinic model (LBM; Watanabe and Kimoto, 2000) employed in this study is a linearized version of the atmospheric circulation model developed at the Center for Climate System Research, University of Tokyo, and the National Institute for Environmental Studies in Japan. In the numerical experiments, a horizontal resolution of T42 and 20 vertical levels in sigma coordinate system are applied. The climatology of the ERA-Interim data during 1979–2017 is adopted for the basic fields in the LBM simulations in winter and spring. The simulation experiments in this study are run for 30 days, and the mean values of the last 10 days are adopted.
SCSSM Onset-Related Interdecadal Change of Mid-Upper Tropospheric Temperature over Asia in Winter-Spring
Figure 1 presents the time evolution of SCSSM onset date during the past 38 years from 1980 to 2017. It can be noticed that the SCSSM onset date shows a pronounced interdecadal shift around 1993/1994, with later onsets during the first epoch from 1980 to 1993 and earlier onsets during the second epoch from 1994 to 2017. The averaged onset dates are 26 May and 13 May during the two epochs, respectively. The interdecadal shift of SCSSM onset date around 1993/1994 is statistically significant at 95% confidence level according to the Student’s t test, and this result is consistent with other studies (Kajikawa and Wang, 2012; Yuan and Chen, 2013; Lin and Zhang, 2020).
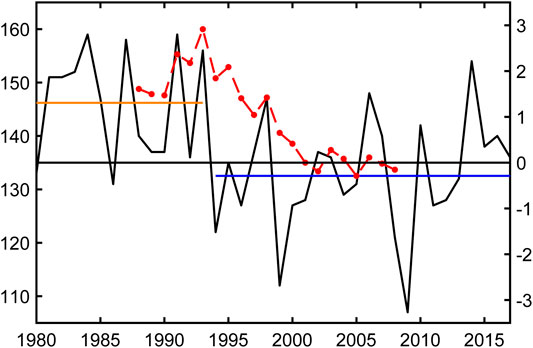
FIGURE 1. Time series of the SCSSM onset date during 1980–2017. The left Y-axis is the sequence number of day for the SCSSM onset date from 1 January (day). Orange and blue lines denote the mean onset date in 1980–1993 and 1994–2017, respectively. Red dashed curve is the 9 years sliding t-test value (right Y-axis).
Climatologically, the reversal of vertical zonal wind shear and the MTG between 500–200 hPa are rapid over the SCS monsoon region during the SCSSM establishment, which can better evaluate the monsoon onset (Wu and Wang, 2001; Mao et al., 2004). Moreover, the seasonal evolution of the mid-upper tropospheric temperature difference between the subtropical continent and tropical ocean is the most striking. To reveal the SCSSM onset-related interdecadal change features of the mid-upper tropospheric (500–200 hPa) temperature change over East Asia, we conducted regression analysis on the 500–200 hPa mean temperature anomalies against the SCSSM onset date over the Asian monsoon region from winter to spring, and the results are shown in Figure 2. The spatial pattern mainly reflects the in-phase temperature variation in the Asian subtropics in winter and spring. In December (Figure 2A), two significant negative centers are located over the western part of Tibetan Plateau and East Asia, respectively. In January and February (Figures 2B,C), the main negative centers are over the East Asian subtropics. In spring (Figures 2D–F), the striking negative zones cover the subtropics of East Asia, with the centers over the eastern Tibetan Plateau. Considering the interdecadal advanced feature of the SCSSM onset, the abovementioned pronounced centers with negative regression coefficients over the East Asian subtropics imply that mid-upper temperature may also experience pronounced interdecadal warming in winter-spring. The SCSSM onset is closely related to the reversal of the MTG in the mid-upper troposphere over the SCS monsoon region. It is suggested that the positive temperature anomaly in the mid-upper troposphere over the East Asian subtropics in previous winter and following spring is conducive to an early seasonal reversal of the MTG over the SCS monsoon region, and then beneficial to the early onset of the SCSSM.
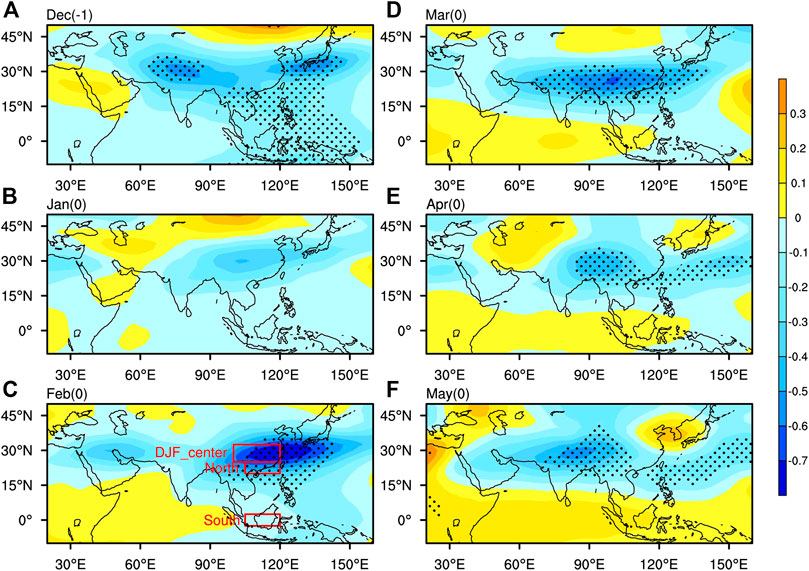
FIGURE 2. Regressions of the monthly 500–200 hPa mean temperature against the SCSSM onset date from previous December to May. The regression coefficients significant at the 95% confidence level are stippled. The “DJF_center” is the demain (25°−32.5°N, 100°−120°E); “North” and “South” denote the northern domain (20°–25°N, 105°–120°E) and the southern domain (2.5°S–2.5°N, 105°–120°E) of the SCS, respectively.
Figure 3 shows the normalized time series of the mid-upper tropospheric temperature in the winter center (25°−32.5°N, 100°−120°E) as shown in Figure 2C. It indeed presents a remarkable interdecadal warming trend. Both 1993 and 1998 were significant interdecadal shift points at 90% confidence level according to the 9 years sliding Student’s t-test. Furthermore, the interdecadal advance of the SCSSM onset occurred around 1993/94, which is also the interdecadal turning point for the mid-upper tropospheric MTG anomalies over the South China Sea monsoon region in May (Figure 4), and the correlation of the MTG with the SCSSM onset date is −0.51 (over the 99% confidence level). These facts demonstrate that there exists an identical interdecadal shift point for the mid-upper tropospheric MTG over the SCS monsoon region and the SCSSM onset date. Therefore, we take 1993/94 as the interdecadal shift point in the following analyses for the two epochs, i.e., 1980–1993 and 1994–2017.
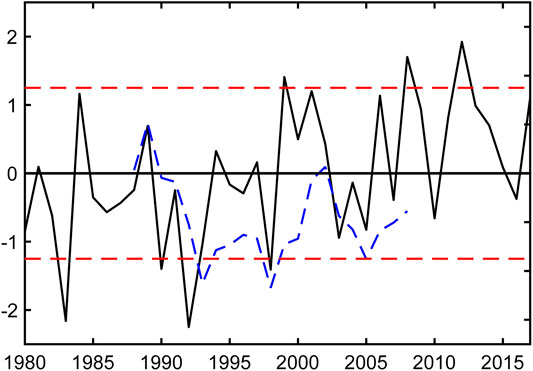
FIGURE 3. Normalized time series (solid line) and its 9 years sliding t-test (blue dashed line) of 500–200 hPa mean temperature averaged in the winter center (25°−32.5°N, 100°−120°E) shown in Figure 1C. The red dashed lines denote the 90% confidence level of t-test.
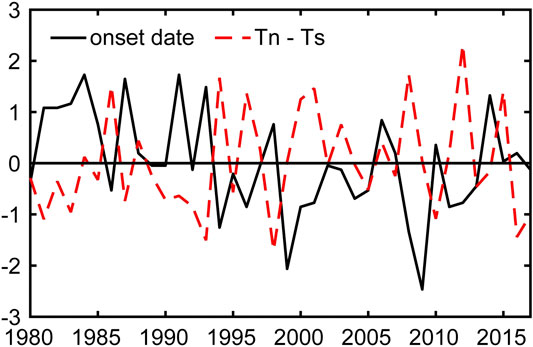
FIGURE 4. Normalized time series of the 500–200 hPa mean MTG (TN–TS, red dashed line) between the northern domain (20°–25°N, 105–120°E) and the southern domain (2.5°S–2.5°N, 105°–120°E) of the SCS (as the boxes named “North” and “South” in Figure 2C, respectively) and the SCSSM onset date (black solid line) during 1980–2017.
Mechanisms for Interdecadal Warming over East Asian Subtropics
Seasonal Evolution of the Interdecadal Change of Mid-upper Tropospheric Temperature
The interdecadal warming of the mid-upper troposphere around 1993/94 over the East Asian monsoon region is observed in all seasons, but the warming magnitudes vary with the seasons, which further leads to the season-dependent interdecadal change of the MTG. In autumn, the interdecadal warming in the mid-upper troposphere is more conspicuous over the tropics than over the subtropics of East Asia, resulting in weak negative MTG anomalies around the SCS monsoon region (Figure 5A). Conversely, the temperature increase is greater in the subtropics of East Asia than in the tropics in winter (Figure 5B), and therefore the interdecadal anomaly of the MTG over the SCS monsoon region turns from negative to positive. By comparing Figures 5A,B, the interdecadal warming magnitude over East Asia is larger in winter than in autumn, especially for southern China (Figure 5D). In spring (Figure 5C), the interdecadal warming pattern over the East Asian monsoon region is rather similar to that in winter, but the warming magnitude is significantly weakened. The seasonal evolution from winter to spring is characterized by relative cooling (Figure 5E). Since the interdecadal cooling of inter-seasonal change from winter to spring in the East Asian subtropics is less than the warming magnitude from autumn to winter, the East Asian subtropics eventually shows interdecadal warming of inter-seasonal change from autumn to spring, while the opposite occurs in the tropics (Figure 5F). Thus, an interdecadal pattern with positive MTG anomalies over the SCS monsoon region starts from winter and persists into spring (Figures 5C,F), which is conducive to the interdecadal advance of the SCSSM onset around 1993/94.
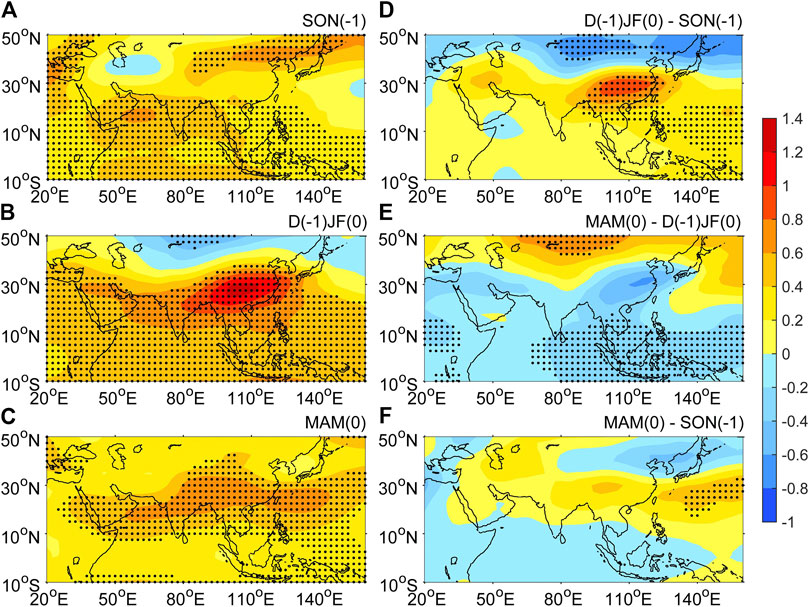
FIGURE 5. Epochal differences (K) of the seasonal mean temperature (left panel) and the inter-seasonal change of temperature (right panel) in the 500–200 hPa layer. Left panel:(A) autumn (SON(−1)), (B) winter (DJF(0)), (C) spring (MAM(0)); right panel:(D) winter minus autumn, (E) spring minus winter, (F) spring minus autumn. Label “−1” denotes (1993–2016) minus (1979–1992), and “0” denotes (1994–2017) minus (1980–1993). The stippled areas denote the differences significant at the 95% confidence level.
Based on Figure 5, it has been identified that the most prominent interdecadal warming in the mid-upper troposphere over the East Asian subtropics occurs in winter, which coincides well with the winter negative center in Figure 1C, and is accompanied by a pronounced interdecadal warming of inter-seasonal change from autumn to winter (Figure 5D). However, by examining the interdecadal temperature change month by month, it is verified that the warming over the East Asian subtropics is primarily attributed to the interdecadal warming of inter-monthly temperature changes from November to December and from January to February (see the red dashed line in Figure 6). On the contrary, an interdecadal cooling of the inter-seasonal temperature change is observed from December to January, and a more pronounced cooling is observed during February–March. The seasonal evolution of the interdecadal temperature change in the northern part of the SCS monsoon region is highly consistent with that in the winter center (Figure 6). Moreover, during July to November (except September), the interdecadal change of the mid-upper tropospheric temperature is larger over the southern part than the northern part of the SCS monsoon region, resulting in negative interdecadal MTG anomalies over the SCS. However, during the period of December to May, the interdecadal warming over the northern part of the SCS monsoon region is more pronounced than that over the southern part, therefore, the interdecadal MTG anomaly turns from negative to positive. The sustained positive interdecadal MTG anomalies over the SCS monsoon region during winter to spring, which is primarily attributed to the prominent interdecadal warming of inter-monthly temperature changes from November to December and from January to February over the East Asian subtropics, is pivotal to the interdecadal advance of the SCSSM onset around 1993/94.
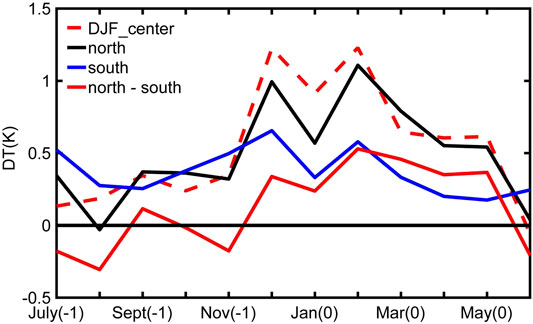
FIGURE 6. Monthly evolution of the area-averaged 500–200 hPa temperature differences (K) between two epochs over the domain (DJF_center, 25°–32.5°N, 100°–120°E, red dashed line), the northern part (north, 20°–25°N, 105°–120°E, black solid line) and the southern part (south, 2.5°S–2.5°N, 105°–120°E, blue solid line) of the SCS monsoon region. The red solid line is epochal difference of the MTG (north–south). Numbers “−1” and “0” in brackets on the abscissa denote (1993–2016) minus (1979–1992) and (1994–2017) minus (1980–1993), respectively.
Thermodynamic Mechanisms of Interdecadal Temperature Changes
The evolution of atmospheric temperature is attributed to various thermodynamic processes (e.g., horizontal temperature advection, vertical adiabatic heating, and diabatic heating) within the atmosphere. According to the relationship between the inter-monthly temperature change and the daily thermal forcing terms expressed as Eq. 4, we can clarify the specific thermodynamic processes and mechanisms responsible for the pronounced interdecadal change of the mid-upper tropospheric temperature over the East Asian subtropics during November to February and February to May.
Figure 7A shows the interdecadal differences of the inter-monthly temperature change rate in the mid-upper troposphere during November to February, and it is noticed that the pronounced warming center is located in the subtropical East Asia–northwestern Pacific. The warming center is formed with a primary contribution from the interdecadal enhancement of the horizontal advective heating (Figure 7B), and a slight positive contribution from the intensified diabatic heating along the East Asian coast and a small negative contribution in most areas within the range of 80°–100°E (Figure 7C). In contrast, the vertical adiabatic term shows a prominent cooling effect over the subtropical East Asia, indicating a negative contribution to the East Asian warming center (Figure 7D). Therefore, the interdecadal warming center of inter-monthly temperature change in winter over the subtropical East Asia–northwestern Pacific is a result of significant abnormal horizontal advective heating, which could not be completely offset by abnormal adiabatic cooling and abnormal diabatic cooling. In addition, the warming over the northern SCS and South China is mainly caused by the interdecadal anomalous warm advection and diabatic heating. The tropical Indian Ocean within 5°–10°N, the SCS to the Philippines, and the Maritime Continent are mainly controlled by diabatic heating and adiabatic cooling associated with interdecadal anomalous ascending motion. The weak interdecadal warming due to inter-monthly temperature increment over the Maritime Continent from November to February is caused by abnormal diabatic heating and warm advection, partly counteracted by abnormal adiabatic cooling.

FIGURE 7. Epochal differences (K) of the thermal forcing terms for the 500–200 h·Pa temperature change during November to February ((1994–2017) minus (1980–1993)). (A) Inter-monthly temperature change rate (Q11). (B) Temperature advection rate (−Q12). (C) Diabatic heating rate (Q1). (D) Adiabatic heating rate (−Q13). The stippled areas denote the difference significant at the 95% confidence level.
Further exploration indicates that the striking abnormal horizontal advective heating in the subtropical East Asia, as shown in Figure 7B, is mainly caused by the coordination of an interdecadal warming center over the eastern Tibetan Plateau and the climatologically prevailing westerlies over the subtropical region of Asia (Figure 8A). In contrast, the climatological mean temperature field together with the interdecadal wind anomalies leads to interdecadal cold advection over the East Asia (Figure 8B).
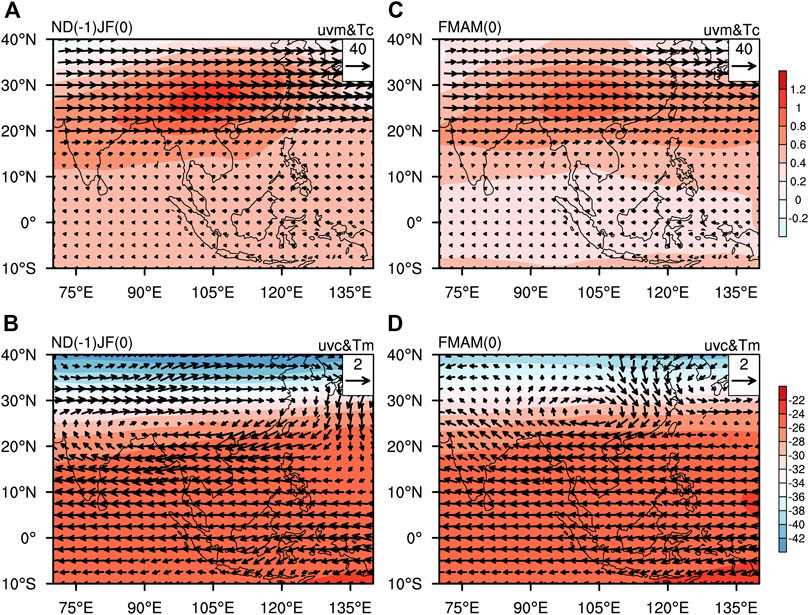
FIGURE 8. (A) Climatologically mean 500–200 hPa wind (arrows, m/s) and the epochal differences of the 500–200 hPa temperature (color shading, K) in November–February. (B) Climatologically mean 500–200 hPa temperature (color shading, K) and the epochal differences of 500–200 hPa wind (arrow, m/s) in November–February. (C) Same as (A), but for February–May. (D) Same as (B), but for February–May. Climate-mean state: “(−1)” and " (0)" denote the mean state of 1979–2016 and 1980–2017, respectively. For the epochal difference, “(−1)” and “(0)” denote (1993–2016) minus (1979–1992), and (1994–2017) minus (1980–1993), respectively.
Figure 9A shows the interdecadal differences of inter-monthly temperature increment in the mid-upper troposphere from February to May. The evident cooling is observed over East Asia and the tropics of Asian-Australian monsoon region, with a cooling center over the East Asia.
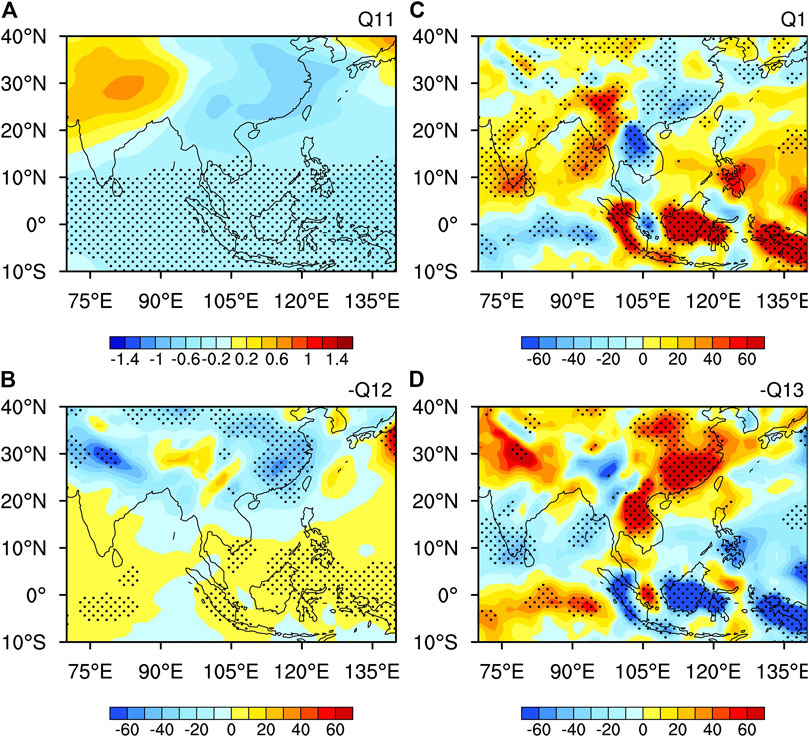
FIGURE 9. As Figure 7, but for february-may.
The interdecadal cooling over East Asia is mainly attributed to a joint effect of anomalous cold advection and diabatic cooling over there (Figures 9B,C). Further examination indicates that the interdecadal cold advection over East Asia is a composite result of strong cold advection, induced by the interdecadal northerly wind and the climatologically negative MTG in the East Asian mid-upper troposphere, and a weak warm advection caused by the negative anomalies of zonal temperature gradient and the climatological westerlies (Figures 8C,D). Moreover, the aforementioned interdecadal diabatic cooling over East Asia is associated with interdecadal anomalous downdraft (Figure 10C). However, the adiabatic heating associated with the abnormal subsidence contributes positively to the warming over East Asia (Figure 9D), and its intensity cannot counteract the effects of diabatic cooling and cold advection, thereby eventually leading to the cooling over East Asia.
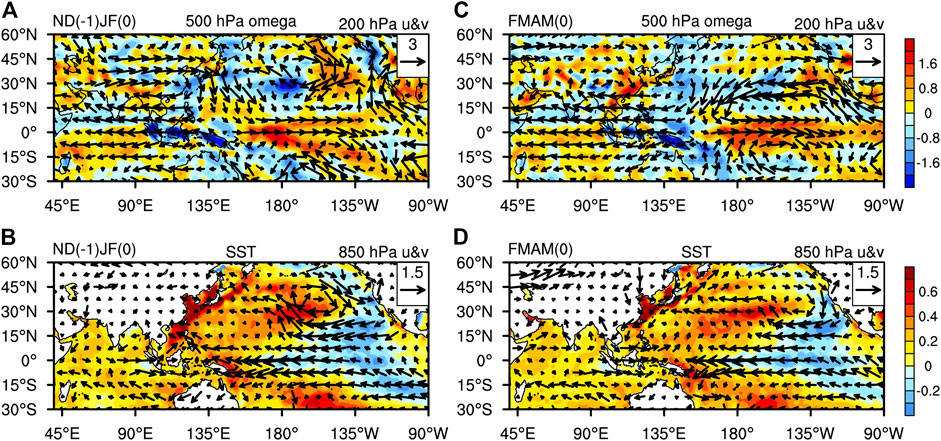
FIGURE 10. Epochal differences of (A) 200 hPa wind (arrows, m/s) with 500 hPa p-velocity (shading, 10–2 Pa/s), and (B) 850 hPa wind (arrows, m/s) with SST (shading, K) for November–February. (C), (D) same as (A), (B) but for February–May. “(1)” denotes (1993–2016) minus (1979–1992), " (0)" denotes (1994–2017) minus (1980–1993).
In the tropics except the equatorial Indian Ocean, interdecadal cooling is mainly caused by the enhanced adiabatic cooling associated with the interdecadal enhancement of ascending motion (Figures 9D, 10C), while the interdecadal cooling over the equatorial Indian Ocean results from the interdecadal weakening of diabatic heating caused by the weakened ascending motion (Figures 9C, 10C).
Interdecadal Change of Tropical Western Pacific SST and its Impacts
In November-February, a horseshoe-shape pronounced interdecadal warming pattern appears in the tropical-subtropical western Pacific and a weak basin-wide warming in the tropical Indian Ocean. Meanwhile, the interdecadal change in the tropical central-eastern Pacific SST presents a wedge-type cooling pattern (Figure 10B). Corresponding to the above interdecadal SST change, interdecadal anomalous low-level cyclonic circulation exists over the SCS and the Bay of Bengal, anomalous low-level westerlies over the equatorial Indian Ocean, and anomalous low-level easterlies over the tropical central-western Pacific. Therefore, obvious interdecadal anomalous low-level convergence and upper-level divergence are observed over the Maritime Continent, the Philippines and nearby areas (Figures 11A,B), accompanied by interdecadal ascending motion (Figure 10A). Meanwhile, the interdecadal ascending motion over the East Asian coast to the Maritime Continent converges and sinks in north of the Bay of Bengal through vertical circulation, leading to vertical adiabatic warming over there. On the other hand, the enhanced convection over the regions from the SCS to the Philippines results in pronounced interdecadal intensified diabatic heating in the troposphere, resembling that shown in Figure 7C. Meanwhile, an interdecadal anomalous upper-level anticyclone is observed over the regions from the southern slope of the Tibetan Plateau to southern China (Figure 10A), which might be a response to the intensified diabatic heating forcing over the regions from the SCS to the Philippines (e.g., Liu et al., 1999); this is further demonstrated by model simulations in Simulation of the Impacts of Diabatic Heating Anomalies Around the SCS and Philippines. The above mentioned interdecadal anomalous upper-level anticyclone is accompanied by an interdecadal warming center in the mid-upper troposphere through hydrostatic balance (Figure 5B).
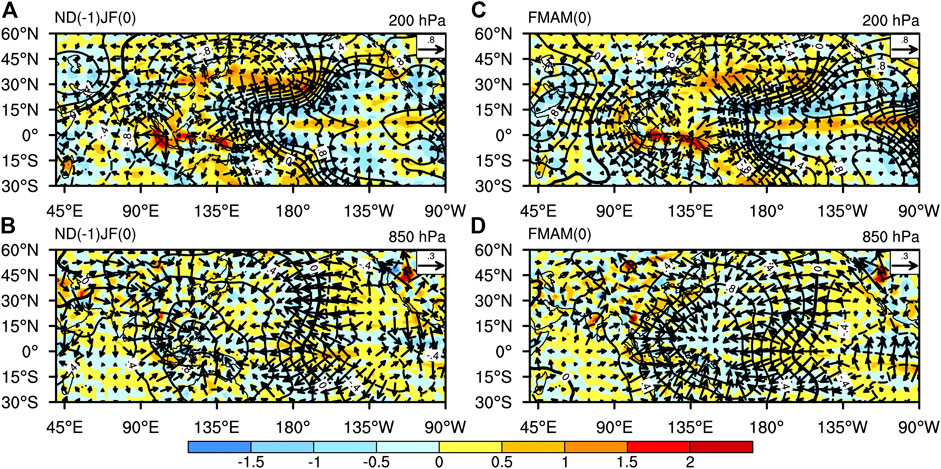
FIGURE 11. (A) Epochal differences of divergent wind (arrows, m/s), divergence (shading, 10–6/s) and velocity potential function (contours, 106 m2/s) at 200 hPa and for November–February. (B) Same as (A), but at 850 hPa and for November–February. (C) Same as (A), but for February–May. (D) Same as (B), but for February–May. “(1)” denotes (1993–2016) minus (1979–1992), and “(0)” denotes (1994–2017) minus (1980–1993).
In February–May, the interdecadal change pattern of the tropical Indian Ocean-Pacific SST resembles that in November-February overall, indicating its long persistence (Figure 10D). However, the interdecadal warming center of the western Pacific SST has changed. Compared with the winter pattern, the positive SST anomalies in the East Asian coast and its adjacent areas weaken or even turn to be negative, and the positive SST anomaly center in the western equatorial Pacific weakens and moves southeastward to the tropical South Pacific Ocean northeast of Australia, and the interdecadal anomalous southwest–northeast-oriented warm center in the northwestern Pacific becomes significantly prominent. The pronounced interdecadal warming regions in the western Pacific induce an anomalous convergence center in the lower troposphere with an anomalous divergence center in the upper troposphere (Figures 11C,D), accompanied by interdecadal ascending motion (Figure 10C). The interdecadal intensified diabatic heating over the southern Philippines and the eastern Maritime Continent is caused by the obvious anomalous ascending motion (Figure 9C), and it stimulates an anomalous low-level cyclone over the SCS and the Philippine Sea through the Rossby-wave response (Gill, 1980). Such anomalous atmospheric circulation is conducive to the weakening and eastward retreat of the subtropical high over the SCS, beneficial to the early onset of the SCSSM. The anomalous updraft over the tropical western Pacific converges and sinks in southern China through vertical circulation (Figure 11C), resulting in adiabatic heating over there. In addition, similar to the situation in winter described above, the enhanced convection with the intensified condensation heating over the western Pacific may excite an anomalous upper-level anticyclone to the northwest side of the heating center, leading to the mid-upper tropospheric warming over this region (Figures 5C, 10C).
The above results demonstrate that in winter and spring, the interdecadal positive SST anomalies in the Maritime Continent-tropical western Pacific force enhanced convection and diabatic heating over there. The heterogeneous diabatic heating plays an important role in exciting an anomalous anticyclone and warming in the mid-upper troposphere over the East Asian subtropics.
Simulation of the Impacts of Diabatic Heating Anomalies Around the SCS and Philippines
A simple baroclinic model (LBM, Watanabe and Kimoto, 2000) is applied to further verify the impacts of the western Pacific SST anomalies on the temperature and circulation change over the subtropical East Asian monsoon region mentioned in the previous section.
In order to achieve a better response of the atmosphere to the SST forcing, the prescribed forcing employs the atmospheric apparent heat source (
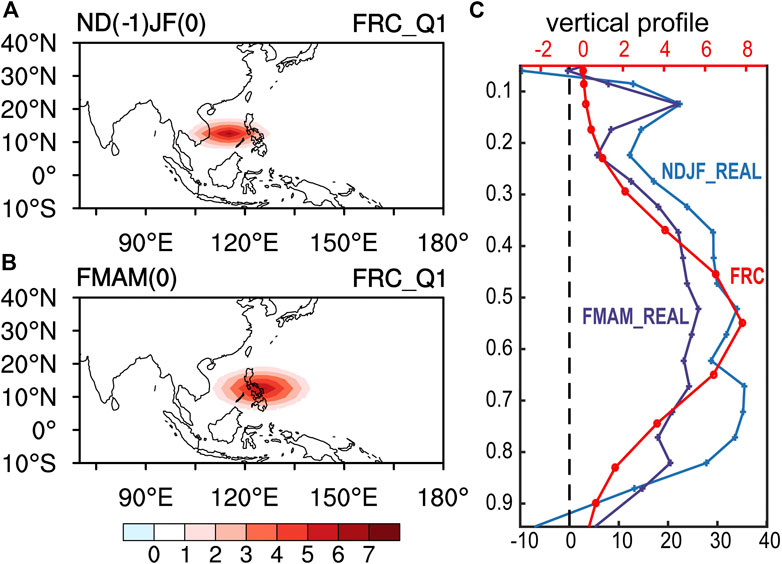
FIGURE 12. Atmospheric heat source settings for the LBM numerical experiments. Horizontal distribution of the specified heat source (K/day) at the 0.55 sigma level in (A) November–February and (B) February–May. (C) Vertical profiles of the epochal differences of the area-averaged heat source observations (K, the lower abscissa) in the respective specified regions of (A) and (B) in November–February (NDJF_REAL, blue line) and February–May (FMAM_REAL, purple line), and the specified heat source at the forcing center (FRC, red line; K/day, the upper abscissa) in sigma coordinate.
Figure 13 shows the response of atmospheric circulation and the mid-upper tropospheric temperature to the atmosphere heating over the SCS-Philippines. Compared with the observations (left panel, Figure 13), the significant mid-upper tropospheric warming and upper-level anticyclone over the subtropical East Asian monsoon region can be well reproduced in both winter and spring (Figures 13E,G), although the simulated warming center in spring shifts slightly southward and the simulated warming magnitude in winter is larger compared to the observation. Especially, the distinct positive MTG anomalies in the mid-upper troposphere over the SCS monsoon region are well simulated qualitatively in winter and spring, with more obvious warming over the subtropical East Asia than over the Maritime Continent, which is beneficial to the interdecadal advance of the SCSSM onset. At low level, the anomalous cyclone near the SCS-Philippines has been also well simulated (Figures 13H,F). In general, the simulation results by the LBM in the East Asian monsoon region are quite similar to the observed interdecadal differences, indicating that the interdecadal SST warming in the tropical western Pacific have great impacts on the subtropical East Asian atmospheric circulation and tropospheric temperature through the convective heating. Here, we only consider the atmospheric heating over the SCS and the Philippines, and the influence of other ocean basins and other external forcings have not been taken into account. This may account for the differences between the simulation and the observation.
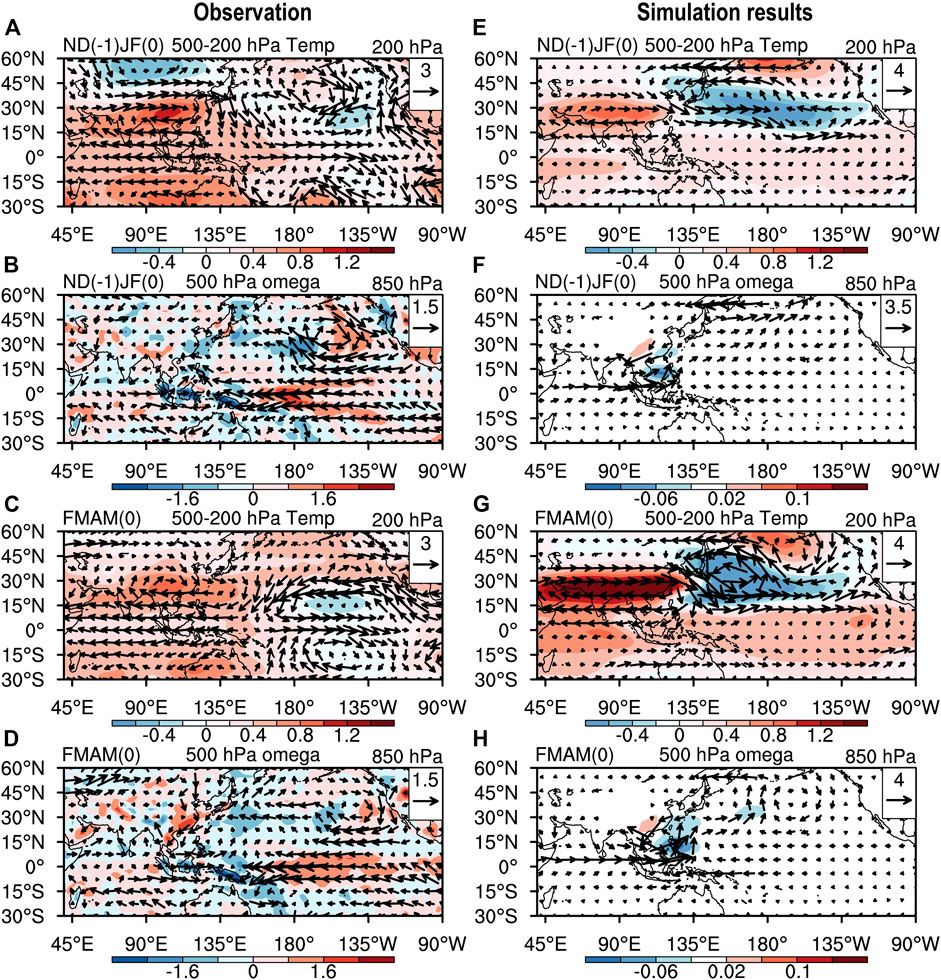
FIGURE 13. Observation (left panel) and simulation (right panel) results of heat source forcing: (A), (E) 200 hPa wind (vector, m/s) and mid-upper tropospheric temperature (shading, K) for November-February; (B), (F) 850 hPa wind (vector, m/s) and 500 hPa p-velocity (shading, 10–2 Pa/s) for November-February. (C), (G) same as (A), (E) but for February–May. (D), (H) same as (B), (F) but for February–May.
Summary and Discussion
This study has examined the interdecadal change of the mid-upper tropospheric temperature over Asian monsoon region during winter and spring and its connection with the interdecadal advance of the SCSSM onset around 1993/94. We have further explored the specific physical processes and influence factors of the temperature change according to the interdecadal change of tropical Indo-Pacific SST and atmosphere circulation.
It is suggested that a significant interdecadal warming in the mid-upper troposphere over the subtropical East Asia in winter and spring is closely associated with the interdecadal advance of the SCSSM onset around 1993/94. The resulting enhanced MTG over the SCS monsoon region in winter and spring after 1994 provides a favorable thermal condition for the interdecadal early onset of the SCSSM.
In the mid-upper troposphere over the subtropical East Asia, there is an interdecadal warming due to the inter-monthly temperature increment during November–February, which is attributed to the striking anomalous horizontal advective heating in the subtropical East Asia caused by the coordination of an interdecadal warming center over the eastern Tibetan Plateau and the climatologically prevailing westerlies. While there is an interdecadal cooling due to the inter-monthly temperature reduction during February–May, which mainly results from the interdecadal anomalous cold advection, induced by the coordination of the interdecadal northerly wind anomalies and the climatologically negative MTG in the East Asian mid-upper troposphere, and diabatic cooling associated with interdecadal downdraft anomalies over East Asia. However, the interdecadal cooling during February–May is not intense enough to offset the interdecadal warming during November–February. Eventually, an interdecadal warming in the mid-upper troposphere remains over the subtropical East Asia at the end of spring, providing a favorable condition for the early onset of the SCSSM.
Furthermore, the interdecadal changes of tropical Indo-Pacific SST in winter and spring have great impacts on the interdecadal warming and atmospheric circulation anomalies over the East Asian subtropics. The interdecadal SST warming in the tropical western Pacific induces intensified convection and condensation heating over the SCS-the Philippine Sea and surrounding areas, exciting an anomalous anticyclone and a warming center in the mid-upper troposphere over the East Asian subtropics. These results are further confirmed by numerical experiments. There are some differences in the distribution of interdecadal tropical Indo-Pacific SST anomalies in winter and spring, leading to some differences in the interdecadal anomalies of atmospheric circulation and thermodynamic heating processes over the East Asian subtropics in two seasons. All the results provide a factual basis for understanding the thermodynamic origin of the interdecadal advance of the SCSSM onset around 1993/1994.
The variation of SST in different ocean basins may be related to each other. In addition to the interdecadal tropical Indo-Pacific warming, there also exists significant interdecadal warming in the North Atlantic. The Atlantic Multidecadal Oscillation (AMO) affects the tropical and regional SST through air-sea coupling (Lyu et al., 2017; Sun et al., 2017). As for interdecadal change, AMO can also influence the tropospheric temperature over Eurasia by adjusting the intensity and frequency of North Atlantic Oscillation (NAO) events (Goswami et al., 2006). This study mainly emphasizes the effects of the interdecadal change in tropical Indo-Pacific SST on the interdecadal warming of the East Asian troposphere, but the influence of the mid-high latitude signals and SST anomalies in other ocean basins on the interdecadal warming of the Asian subtropics in winter and spring remains to be further explored in the future.
It should be mentioned that the interdecadal change of the SCSSM onset around 1993/94 is not the sole turning point in recent 38 years. Another secondary turning point appeared around 1998/99 (Figure 1), which is also shown in the mid-upper temperature in winter over the subtropical East Asia as shown in Figure 3. This late 1990s shift has been detected by Huangfu et al. (2015), and they suggested that the large-scale atmospheric and oceanic change associated with this shift exhibits a more systematically significant interdecadal change signal around 1998/99. It was also emphasized that the late 1990s shift of the SCSSM onset was due to the interdecadal warming over the tropical western Pacific around late 1990s (Huangfu et al., 2015; Hu et al., 2018).
Data Availability Statement
The original contributions presented in the study are included in the article/Supplementary Material, further inquiries can be directed to the corresponding authors.
Author Contributions
JY contributed to analyzing the data, diagnostics and preparing the manuscript. MJ contributed to the conception of the study, interpretation of the results and preparing the manuscript. SG contributed to providing the comments and suggestions in the preparation of the manuscript, and helped edit the manuscript. JC contributed to calculating the apparent heat source data employed in the manuscript.
Funding
This work is jointly supported by the National Key Research and Development Program of China (Grant no. 2016YFA0600601), the National Natural Science Foundation of China (Grant no. 41530530, 41475049), Guangdong Province Key Laboratory for Climate Change and Natural Disaster Studies (Grant 2020B1212060025) and the Jiangsu Collaborative Innovation Center for Climate Change.
Conflict of Interest
The authors declare that the research was conducted in the absence of any commercial or financial relationships that could be construed as a potential conflict of interest.
Appendix
In this appendix, a thermodynamic expression that determines temperature change between two adjacent calendar months is derived. With the aid of Eq. 2 , the thermodynamic energy Eq. 1 can be simple written as
Where F is the forcing term, representing the net effect of all thermal heating processes, i.e. horizontal advection of temperature, vertical adiabatic heating and diabatic heating. Given Ti,n represents the daily mean temperature on the n-th day of the i-th calendar month, and the local temperature change is calculated with the central difference scheme, then Eq. 4 can be rewritten as
Where
Adding the terms on the two sides of the formulas in Eq. A3, respectively, we get
Applying the above procedures to a sliding window of time repeatedly, we obtain
Add the terms on the left and right sides of Eqs A5, A6, respectively, and get
Equation A6 states that the inter-monthly change of monthly mean temperature is given by the sum of the weighted daily thermal forcing terms on the right within the two concerned months. For the convenience of calculation, we specify the number of days in each month as 30 days, and the first day or the last day of the month is omitted before calculation for the months with 31 days. When applying Eq. A6 to January–February or February–March, we add the days in February up to 30 days by including the first two days in March or the last two days in January. Since the days of the calendar months are not all the same as 30 days, there are small biases when using the left side of Eq. A6 to estimate the inter-monthly change of monthly mean temperature. However, the biases are generally very small and thus can be ignored.
References
Dee, D. P., Uppala, S. M., Simmons, A. J., Berrisford, P., Poli, P., Kobayashi, S., et al. (2011). The ERA-interim reanalysis: configuration and performance of the data assimilation system. Q. J. R. Meteorol. Soc 137, 553–597. doi:10.1002/qj.828
Ding, Y., and Chan, J. C. L. (2005). The East Asian summer monsoon: an overview. Meteorol. Atmos. Phys 89, 117–142. doi:10.1007/s00703-005-0125-z
Ding, Y. (1992). Summer monsoon rainfalls in China. J. Meteorol. Soc. Jpn 70, 373–396. doi:10.2151/jmsj1965.70.1B_373
Gill, A. E. (1980). Some simple solutions for heat-induced tropical circulation. Q. J. R. Meteorol. Soc 106, 447–462. doi:10.1002/qj.49710644905
Goswami, B. N., Madhusoodanan, M. S., Neema, C. P., and Sengupta, D. (2006). A physical mechanism for North Atlantic SST influence on the Indian summer monsoon. Geophys. Res. Lett 33, L02706. doi:10.1029/2005GL024803
He, J., and Zhu, Z. (2015). The relation of South China sea monsoon onset with the subsequent rainfall over the subtropical East Asia. Int. J. Climatol 35, 4547–4556. doi:10.1002/joc.4305
Hu, P., Chen, W., Huang, R. H., and Nath, D. (2018). On the weakening relationship between the South China sea summer monsoon onset and cross-equatorial flow after the late 1990s. Int. J. Climatol 38, 3202–3208. doi:10.1002/joc.5472
Huang, R. H., Gu, L., Xu, Y. H., Zhang, Q., Wu, S., and Cao, J. (2005). Characteristics of the interannual variations of onset and advance of the East Asian summer monsoon and their associations with thermal states of the tropical western Pacific. Chin. J. Atmos. Sci 29, 20–36 [in Chinese]. doi:10.3878/j.issn.1006-9895.2005.01.04
Huang, R. H., and Sun, F. Y. (1994). Impact of the thermal state and convective activities over the western Pacific warm pool on summer climate anomalies in East Asia. Chin. J. Atmos. Sci 18, 262–272 [in Chinese]
Huangfu, J., Huang, R. H., and Chen, W. (2015). Influence of tropical western pacific warm pool thermal state on the interdecadal change of the onset of the south China Sea summer monsoon in the late-1990s. Atmos. Oceanic Sci. Lett 8, 95–99. doi:10.1080/16742834.2015.11447244
Jian, M. Q., and Luo, H. B. (2001). Heat sources over Qinghai-xizang Plateau and surrounding areas and their relationships to onset of SCS summer monsoon. Plateau Meteorol 20, 381–387 [in Chinese]
Jiang, X., Wang, Z., and Li, Z. (2018). Signature of the South China Sea summer monsoon onset on spring-to-summer transition of rainfall in the middle and lower reaches of the Yangtze River basin. Clim. Dynam 51, 3785–3796. doi:10.1007/s00382-018-4110-x
Kajikawa, Y., and Wang, B. (2012). Interdecadal change of the South China Sea summer monsoon onset. J. Clim 25, 3207–3218. doi:10.1175/JCLI-D-11-00207.1
Kajikawa, Y., Yasunari, T., Yoshida, S., and Fujinami, H. (2012). Advanced Asian summer monsoon onset in recent decades. Geophys. Res. Lett 39, L03803. doi:10.1029/2011GL050540
Li, C., and Yanai, M. (1996). The onset and interannual variability of the Asian summer monsoon in relation to land-sea thermal contrast. J. Clim 9, 358–375. doi:10.1175/1520-0442(1996)009<0358:toaivo>2.0.co;2
Lin, A., Gu, D., Zheng, B., and Li, C. (2013). Relationship between South China sea summer monsoon onset and Southern Ocean sea surface temperature variation. Chin. J. Geophys 56, 383–391 [in Chinese]. doi:10.6038/cjg20130203
Lin, A., and Zhang, R. (2020). Climate shift of the South China sea summer monsoon onset in 1993/1994 and its physical causes. Clim. Dynam 54, 1819–1827. doi:10.1007/s00382-019-05086-4
Liu, Y., WuLiu, G. H., and Liu, P. (1999). The effect of spatially nonuniform heating on the formation and variation of subtropical high. Part III: condensation heating and South Asia high and western Pacific subtropical high. Acta Meteorol. Sin 57, 525–538 [in Chinese]
Luo, M., and Lin, L. J. (2017). Objective determination of the onset and withdrawal ofthe South China Sea summer monsoon. Atmos. Sci. Lett 18, 276–282. doi:10.1002/asl.753
Lyu, K., Yu, J., and Paek, H. (2017). The influences of the atlantic multidecadal oscillation on the mean strength of the north pacific subtropical high during boreal winter. J. Clim 30, 411–426. doi:10.1175/JCLI-D-16-0525.1
Mao, J. Y., Chan, J. C. L., and Wu, G. X. (2004). Relationship between the onset of the South China Sea summer monsoon and the structure of the Asian subtropical anticyclone. J. Meteorol. Soc. Jpn 82, 845–859. doi:10.2151/jmsj.2004.845
Murakami, T., and Matsumoto, J. (1994). Summer monsoon over the asian continent and western north pacific. J. Meteorol. Soc. JPN 72, 719–745. doi:10.2151/jmsj1965.72.5_719
Qian, W., Kang, H. S., and Lee, D. K. (2002). Distribution of seasonal rainfall in the East Asian monsoon region. Theor. Appl. Climatol 73, 151–168. doi:10.1007/s00704-002-0679-3
Rayner, N. A., Parker, D. E., Horton, E. B., Folland, C. K., Alexander, L. V., Rowell, D. P., et al. (2003). Global analyses of sea surface temperature, sea ice, and night marine air temperature since the late nineteenth century. J. Geophys. Res 108, 4407. doi:10.1029/2002JD002670
Sun, C., Kucharski, F., Li, J., Jin, F. F., Kang, I. S., and Ding, R. (2017). Western tropical Pacific multidecadal variability forced by the Atlantic multidecadal oscillation. Nat. Commun 8, 15998. doi:10.1038/ncomms15998
Tao, S. Y., and Chen, L. X. (1987). A review of recent research on the East Asian summer monsoon in China monsoon meteorology. Oxford, UK: Oxford University Press, 60–92.
Wang, B., Huang, F., Wu, Z. W., Yang, J., Fu, X. H., and Kikuchi, K. (2009). Multi-scale climate variability of the South China Sea monsoon: a review. Dynam. Atmos. Oceans 47, 15–37. doi:10.1016/j.dynatmoce.2008.09.004
Wang, B., and Lin, H. (2002). Rainy season of the Asian-Pacific summer monsoon. J. Clim 15, 386–398. doi:10.1175/1520-0442(2002)015<0386:RSOTAP>2.0.CO;2
Watanabe, M., and Kimoto, M. (2000). Atmosphere-ocean thermal coupling in the North Atlantic: a positive feedback. Q. J. R. Meteorol. Soc 126, 3343–3369. doi:10.1002/qj.49712657017
Wu, R., and Wang, B. (2001). Multi-stage onset of the summer monsoon over the western North Pacific. Clim. Dynam 17, 277–289. doi:10.1007/s003820000118
Xiang, B., and Wang, B. (2013). Mechanisms for the advanced asian summer monsoon onset since the mid-to-late 1990s. J. Clim 26, 1994–2009. doi:10.1175/JCLI-D-12-00445.1
Yanai, M., Esbenson, S., and Chu, J. (1973). Determination of bulk properties of tropical cloud clusters from large-scale heat and moisture budgets. J. Atmos. Sci 30, 611–627. doi:10.1175/1520-0469(1973)030<0611:dobpot>2.0.co;2
Keywords: south China sea summer monsoon, onset, interdecadal change, tropospheric temperature, sea surface temperature
Citation: You J, Jian M, Gao S and Cai J (2021) Interdecadal Change of the Winter-Spring Tropospheric Temperature Over Asia and its Impact on the South China Sea Summer Monsoon Onset. Front. Earth Sci. 8:599447. doi: 10.3389/feart.2020.599447
Received: 27 August 2020; Accepted: 30 November 2020;
Published: 11 January 2021.
Edited by:
Yoshiyuki Kajikawa, RIKEN Center for Computational Science, JapanCopyright © 2021 You, Jian, Gao and Cai. This is an open-access article distributed under the terms of the Creative Commons Attribution License (CC BY). The use, distribution or reproduction in other forums is permitted, provided the original author(s) and the copyright owner(s) are credited and that the original publication in this journal is cited, in accordance with accepted academic practice. No use, distribution or reproduction is permitted which does not comply with these terms.
*Correspondence: Maoqiu Jian, ZWVzam1xQG1haWwuc3lzdS5lZHUuY24=; Si Gao, Z2Fvc2k1QG1haWwuc3lzdS5lZHUuY24=