 Tianhang Li
 Hong-Li Ren2*
 Jianyun Gao
94% of researchers rate our articles as excellent or good
Learn more about the work of our research integrity team to safeguard the quality of each article we publish.
Find out more
ORIGINAL RESEARCH article
Front. Earth Sci., 19 January 2021
Sec. Atmospheric Science
Volume 8 - 2020 | https://doi.org/10.3389/feart.2020.598473
This article is part of the Research TopicOrigins and Predictability of the Intraseasonal to Interannual Variabilities of Regional ClimateView all 31 articles
The intraseasonal variability of multiple tropical cyclone (MTC) events in the western North Pacific (WNP) during 1979–2015 is analyzed using the best-track dataset archived at the Joint Typhoon Warning Center. MTC events are divided into three phases according to the time intervals of the tropical cyclone (TC) genesis, that is, active, normal, and inactive phases. Composite analysis results indicate that MTC events tend to occur in the active phase when the monsoon trough is stronger and located farther north than at other times. Initialized by the data from a 10-year stable running result, a 12-year control experiment is carried out using the hybrid atmosphere–ocean coupled model developed at the University of Hawaii (UH_HCM model) to evaluate its simulation capability. Compared with the climate observations, the model shows good skill in simulating the large-scale environmental conditions in the WNP, especially the subtropical high and the monsoon trough. In addition, the model can well simulate the climate characteristics of TCs in the WNP, as well as the differences in each MTC phase. However, the simulated frequency of TCs is less and their locations are more northeast, compared with the observations. The vorticity and moisture in the model appear to be the two main factors affecting MTC activity based on analyses of the genesis potential index.
The western North Pacific (WNP) is one of the main regions that generate global tropical cyclones (TCs). On average, about 30 TCs are generated in this region every year, which accounts for one-third of the global total. Of the western Pacific coastal countries, China is one of the countries most affected by TCs, and it experiences about 20 TCs every year on average. Therefore, TC forecasting and monitoring services are a top priority for disaster prevention and mitigation in China. At present, among the different timescales in TC forecasting, the 10–30-day extended-range forecast is the least accurate. In addition, the theoretical basis of the extended-range forecast, i.e., the study of subseasonal variation of TC activity, still needs improvement.
Observational results show that the TC activity in the WNP has notable subseasonal change features. The activity and inactivity of TC formation appear alternately. Previous studies have shown that the genesis of multiple TCs has a certain periodicity. The active period is about 1–2 weeks. Between two active periods, there is a 2–3-week inactive period (Gray, 1979; Xie et al., 2018). This phenomenon is abnormal for the subseasonal change of TC activity. Some studies have defined TCs that form in the same area and period as multiple tropical cyclone (MTC or TC clustering) activity. Previous studies have found that a substantial portion (34%–57%) of TCs can be described as MTC events, with a higher proportion in the WNP, compared with other MTC regions (Krouse and Sobel, 2010; Schenkel, 2015, 2017). The active phase of MTC formation is defined as when the number of TCs generating in a short period is abnormally large, and the opposite situation is called the inactive phase of MTC formation (Gao and Li, 2011, 2012). The active phase may result in a certain region being frequently affected by TCs over a short period, which increases the cumulative effect of TC damage and losses. In contrast, the inactive TC genesis phase in summer causes high temperatures and droughts.
At present, studies on TCs in the WNP area emphasize the interannual and interdecadal variations, and, in recent years, many studies on subseasonal-to-seasonal TC activity in the WNP have been carried out. The two major components of the intraseasonal oscillation—the 30–60-day Madden–Julian oscillation (MJO) and the 10–20-day quasi-biweekly oscillation (QBWO)—are the main factors affecting the intraseasonal variability of TCs. The MJO is the major component of the tropical intraseasonal oscillation, as the variability of the observed TC activity (i.e., genesis, track, and landfall) in the WNP is related to the MJO-related convection. The substantial increase (reduction) in cyclogenesis is found to be associated with the active (inactive) phase of the MJO (Nakazawa, 1988, 2006; Liebmann et al., 1994; You et al., 2019; Zhao and Li, 2019). The 10–20-day QBWO located in the Asian monsoon region presents northwestward-moving characteristics. Its energy is more powerful than that of the MJO, it exerts strong modulation on the intraseasonal activity of TCs, and it has a significant local influence on TCs (Li and Zhou, 2013a, Li and Zhou, 2013b; Zhao et al., 2015). As one of the abnormal phenomena of TC subseasonal variation, MTC events have been rarely studied. The low-frequency change in atmospheric circulation has a regulating effect on MTC events (Gao and Li, 2011). Some MTC events in the WNP are the successive cyclogenesis due to energy dispersion of preexisting TCs (Li and Fu 2006; Krouse and Sobel, 2010). The convectively coupled equatorial waves provide strong (weak) favorable environmental conditions that result in more (less) TC genesis. Compared with the synoptic-scale waves (tropical depression-type waves and mixed Rossby-gravity waves), the long-lasting equatorial Rossby waves produce more favorable humidity and convective conditions for MTC formation (Krouse and Sobel, 2010; Schenkel, 2015; Lai et al., 2020).
In the dynamic seasonal forecast, Manabe et al. (1970) were the first to find that atmospheric circulation models at low resolution can reproduce the observed low-pressure structure and physical characteristics of TCs (Bengtsson et al., 1982, 1995, 2007; Haarsma et al., 1993). Despite slight differences between the methods used for the detection and tracking of TCs in the models, most begin by identifying the distinctive atmospheric structure of TCs (i.e., the strong vortex and the warm-core structure). The ECHAM-4 general circulation model (GCM), developed by the Max Planck Institute for Meteorology (Roeckner et al., 1996), has been used for TC forecasting since the early 2000s. In 2003, the International Research Institute for Climate and Society in the United States built a dynamic prediction model using the ECHAM4.5 GCM for forecasting seasonal TC genesis frequency (Camargo and Barnston, 2009; Klotzbach et al., 2011). Fu and Hsu (2011) used a hybrid atmosphere–ocean coupled model developed at the University of Hawaii (UH_HCM model) to successfully predict a tropical cyclogenesis event in the northern Indian Ocean with a lead time of two weeks. The atmospheric component of the UH_HCM model is the ECHAM4.5 GCM, and the ocean component is a 2.5-layer equatorial upper ocean model. The UH_HCM model was developed by the International Pacific Research Center (IPRC) of the University of Hawaii (Fu et al., 2003; Fu and Wang, 2004) and it shows some prediction capability for subseasonal TC activity and a high forecast skill for the MJO (Fu et al., 2009, Fu et al., 2011; Fu and Hsu, 2011). At present, few studies have focused on the numerical simulation of MTC activity. Therefore, this paper makes a further assessment of the MTC simulation capacity of the UH_HCM model, to provide technical support for the extended-range numerical prediction of the subseasonal change of TCs in the WNP area.
The data used in this paper are as follows. 1) The TC best-track dataset archived at the Joint Typhoon Warning Center (JTWC) from May to October 1979–2015. The original temporal resolution of the JTWC observation data is 6 h, but it was transformed into 1 day in this study. A TC is defined as a tropical storm with a maximum average wind speed over 35 miles per hour near the bottom center. 2) Reanalysis data (Reanalysis 1) from the National Centers for Environmental Prediction (NCEP) and the National Center for Atmospheric Research (NCAR) from 1979 to 2015 with a spatial resolution of 2.5 ° × 2.5 °. The temporal resolution of the NCEP reanalysis data is 1 day.
The genesis potential index (GPI) is an index that reflects whether the potential background is beneficial to a comprehensive quantitative description of TC genesis (Emanuel and Nolan, 2004). It is defined as
where
where
With a simple conversion, the magnitude of the GPI anomaly (
The UH_HCM model used in this study is an ocean–atmosphere coupled model. The atmospheric component (ECHAM4.5 GCM) has 19 layers extending from the surface to 10 hPa, and we used the T106 version (the corresponding horizontal resolution is about 1°) in this study. The ocean component with a resolution of 0.5 ° × 0.5 ° comprises a mixed layer and a thermocline layer. We use the climate circulation field and sea surface temperature field as fringe conditions for the control-run experiment. We run the experiment for 22 years and analyze the last 12 years’ data. In the UH_HCM control-run experiment, the temporal resolution of the output data is 1 day.
To describe the subseasonal variation of TCs in the WNP, we used the method of Gao and Li (2011) to divide MTC events into different phases. First, the TC genesis interval (TGI) sequences between every 2 TCs are calculated. Then, the relationship between the anomalous TGI (ATGI) and its 0.5-time standard deviation is compared. According to these two criteria, MTC events are divided into three phases (Table 1). An active phase is defined as a TGI less than or equal to 3 days, which means the genesis interval between two consecutive TCs is less than or equal to 3 days. A normal phase is with a TGI of 3–9 days. An inactive phase is defined as a TGI greater than or equal to 9 days. If two or more active or inactive phases occur successively, they are considered to be the same active or inactive phase. We use the numbers 1, 2, and 3 to indicate the inactive phase, the normal phase, and the active phase of the day, respectively, and obtain the sequences of MTC phases from 1979 to 2015 (Figure 1).
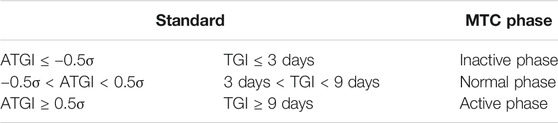
TABLE 1. Classification of the MTC phases based on the standard deviation σ of the TC genesis interval (TGI) in the WNP (ATGI denotes the anomalous TC genesis interval).
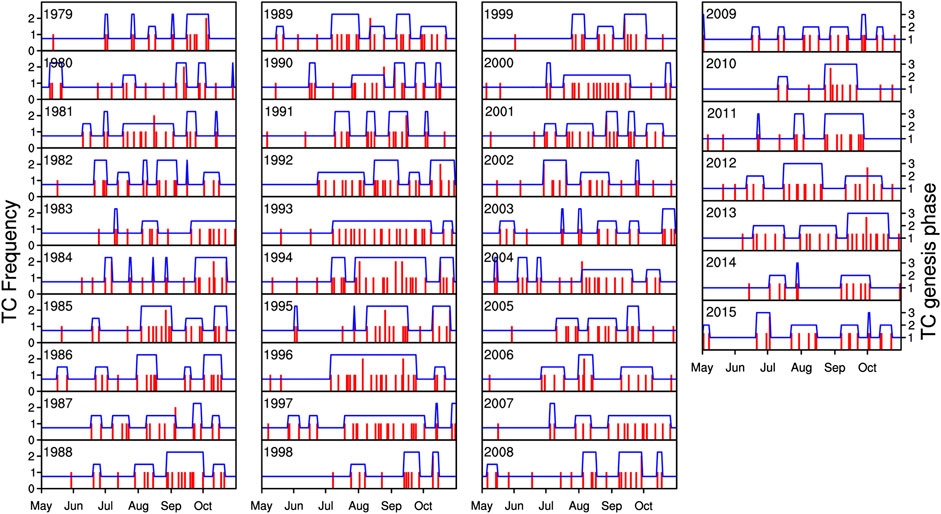
FIGURE 1. The numbers of TC genesis (red column) and the MTC phase sequences during May to October from 1979 to 2015. The numbers 1, 2, and 3 for the blue lines indicate the inactive phase, normal phase, and active phase of the MTC events, respectively.
This divides the lifetime of TCs in the WNP into inactive, normal, and active phases according to the MTC features. There are 83, 68, and 185 events for the three phases from May to October during 1979–2015, respectively. Typical events for the three MTC phases are selected and further analyzed to better show the differences in the circulation background of the three phases. For the inactive phase, 23 typical events that last for over 24 days (the average length of all events in the inactive phase) from July to September are selected. In addition, 17 and 22 typical events for the normal phase and active phase, respectively, that continuously generate five TCs (the average TCs of all events, both active phase and normal phase, is 5) or more are also selected. The outcomes are listed in Table 2. From here on, MTC events refer only to events in the active phase.
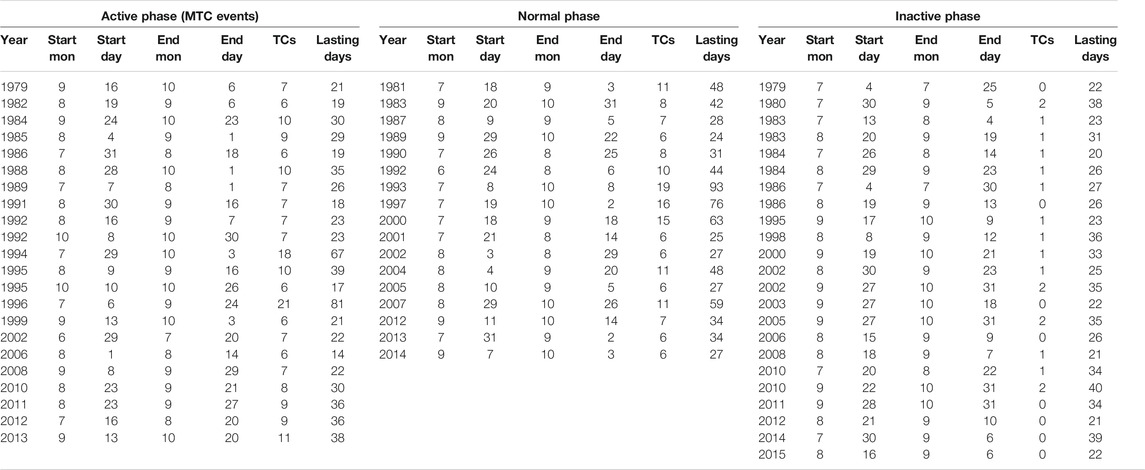
TABLE 2. Typical events of the three MTC phases in the WNP.
Figure 2 shows the composite wind and vorticity fields at 850 hPa for typical events in the inactive, normal, and active phases. The time period of each composite environmental field ranges from the start day to the end day of each typical event. We find that the low-level circulation fields of the normal phase and the active phase are similar. They both have a distinct monsoon trough, and the monsoon shear line stretches from the South China Sea (SCS) to the central Pacific Ocean (150 °E), which corresponds to a high positive vorticity zone (>0.6 × 10⁻⁵ s−1). This means that there is a strong horizontal convergence within the shear line and most of the TCs are generated in this location. The center of the high positive vorticity zone is near the Philippines (>1.2 × 10⁻⁵ s−1), where the relative wind speed is faster, the positive vorticity range is wider, and the maximum positive vorticity is higher. Meanwhile, the composite low-level wind field of the active phase shows an apparent cyclone in the northern SCS and multiple TCs generate in the center of the cyclone. In the composite low-level wind field of the inactive phase, the wind speed is much weaker than that in the other two phases. The positive vorticity zone is farther south and the intensity is slightly weaker (mostly lower than 0.6 × 10⁻⁵ s−1). This large-scale background is not conducive to the genesis of TCs. The low-level wind difference of the active phase minus that of the inactive phase shows a large-scale cyclonic circulation in the WNP with a center near 130 °E, 22 °N (Figure 2D). Along the center, there is a zone of high positive vorticity in the zonal direction. Three distinct centers of positive value are located in the eastern SCS, from the northern Philippines to coastal Taiwan, and the midwestern Pacific Ocean. Compared with Figure 4A, we find that it is also the location for MTC genesis. This indicates that the MTC formation in the WNP is mainly affected directly by the monsoon trough in the WNP.
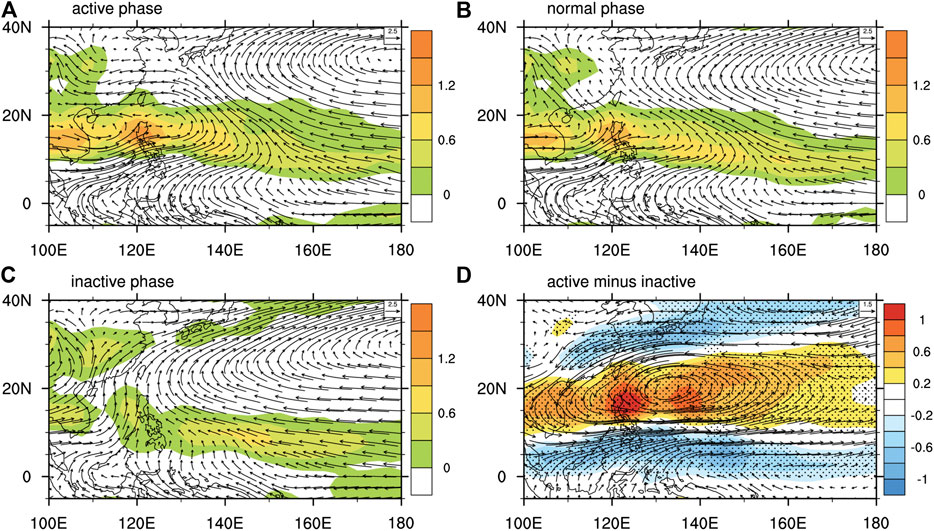
FIGURE 2. The composite wind fields and vorticity fields (shading, 10–5 s−1) at 850 hPa of the typical events in the (A) active phase, (B) normal phase, and (C) inactive phase. (D) The vorticity difference (shading) of typical events in the active phase minus those in the inactive phase. The dots represent values significant at the 95% confidence level using the t-test.
The simulation ability of the model for the atmospheric circulation, water vapor condition, and dynamic condition are analyzed, all which have a close relationship with the genesis and development of TCs.
Early studies showed that, in the season when TCs are active in the WNP, both the western Pacific subtropical high and the monsoon trough have a great influence on the genesis location, frequency, intensity, and development pattern of TCs (Chen and Ding, 1979). For example, over 75% of TCs generate in regions where a monsoon trough exists (Briegel and Frank, 1997). According to observational data, among the various large-scale environmental fields in the active season of TCs (May to October), there is an evident subtropical high system and a monsoon trough related to the summer monsoon in the WNP area (Figure 3B). The high sea-level pressure (SLP) center is near 30 °N (Figure 3D). The monsoon trough stretches from the SCS to about 150°E, and its south side is dominated by southwesterly monsoonal flows. The features of the simulated low-level wind and SLP are relatively consistent with the observations. However, compared with the observations, the position of the simulated SLP center is farther north (around 35 °N), the simulated wind speed of the southwesterly wind entering the monsoon trough is weaker, and the location of the simulated monsoon trough is also farther north.
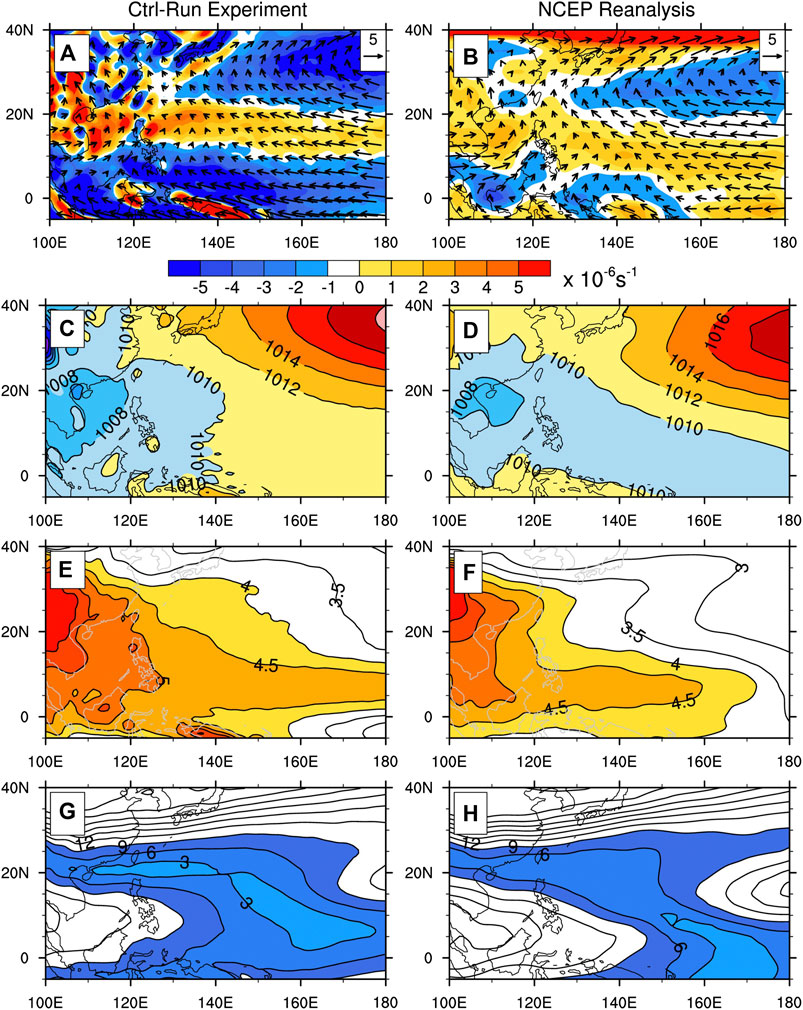
FIGURE 3. Climate state of the control-run experiment and NCEP reanalysis data during May to October. (A and B) Average wind field (m s−1) and vorticity field (10−6 s−1) at 850 hPa. (C and D) Average sea-level pressure (hPa). (E and F) Average specific humidity field (10−3 kg kg−1) at 500−700 hPa. (G and H) Average vertical wind shear field between 200 hPa and 850 hPa (m s−1).
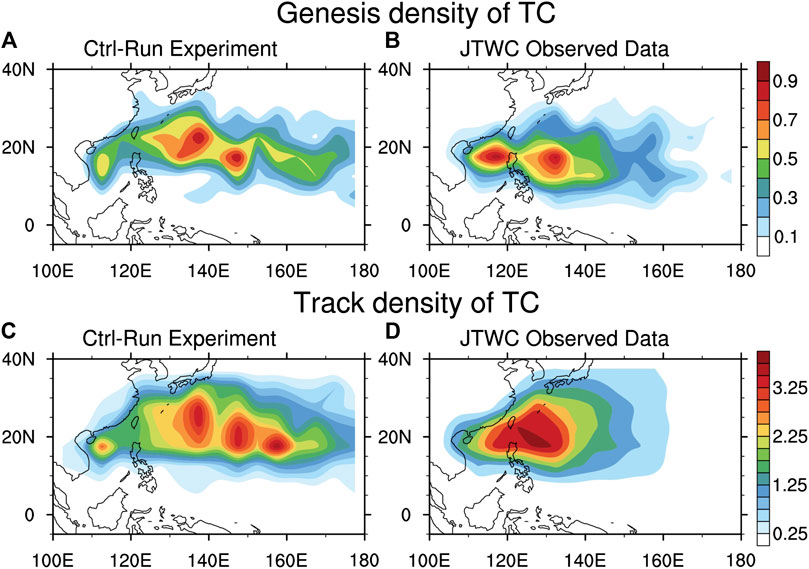
FIGURE 4. Genesis density (A and B) and track density (C and D) of TCs per year during May to October. (A) and (C) are based on the 12-year control-run experiment and (B) and (D) are based on the JTWC observation data in 1991–2012.
The positive vorticity area in the lower atmosphere is one of the dynamic conditions to generate TCs. It can help drive updrafts of air, release the instable energy, and develop cumulonimbus cloud. The observed climate state of relative vorticity at 850 hPa (Figure 3B) shows a large area of negative values in the subtropical region and an obvious high vorticity band in the area between 10° and 20°N in the WNP where TCs are more concentrated. The maximum positive vorticity value is located in the SCS. The simulated positive vorticity band corresponds well with the observations (Figure 3A). The position of the subtropical high is farther northwest and the intensity in the WNP is weaker than that in the observations, and the simulated positive vorticity values in the SCS are larger than those in the reanalysis data.
In general, most TCs generate in the mid-troposphere where the humidity is high. This aids in the development of cumulonimbus clouds, the release of latent heat, and heating of the upper troposphere. Figures 3E,F shows the average specific humidity at 500–700 hPa in May–October (typhoon season in the WNP). The observed humidity in the middle and lower troposphere is high in the monsoon trough area (>4 × 10⁻³ kg kg−1) from the SCS to 160 °E, but low in the subtropical ridge area. The spatial pattern of humidity simulated by the UH_HCM model is relatively consistent with the observations, except that its values are generally larger, especially in the monsoon trough area.
Weak vertical wind shear is an important condition for generating TCs. It helps to concentrate the latent heat released by the convective condensation of the initial disturbance in the upper and middle troposphere and develop it into a warm-core structure. Then the upper-air divergence and the decreasing surface pressure help the formation of TCs. The strong vertical wind shear restrains the development of convection and thus limits the formation of the warm core and vortex. Figures 3G,H show the distribution of the vertical wind shear between 200 hPa and 850 hPa during May to October. We find that, near the SCS, east of the Philippines, and the Mariana Islands, the simulated weak vertical wind shear region (<9 m s−1) is basically the same region as in the observations. However, the simulated vertical wind shear is weaker near 0 °N and 20 °N west of 140 °E.
In summary, the regional climate model can reasonably simulate the spatial structures of the large-scale environmental fields, including pressure, wind, humidity, low-level vorticity, and vertical wind shear, but with relatively weaker intensities than the observations. In addition, the results indicate that the simulated large-scale conditions in the SCS are more conducive to the generation and development of TCs than the observations.
To better examine the simulation performance of the UH_HCM model for MTC events, the criteria for TC identification and tracking in the typhoon hindcast experiment (Fu and Hsu, 2011) are adopted in this paper. The analysis above has shown that the intensities in the control-run experiment are weak. Therefore, we use the following standards. 1) A well-developed cyclone with maximum relative vorticity larger than 10 × 10–5 s−1 exists above 850 hPa, which is equivalent to the standard for TCs (the threshold was chosen as the best compromise for identifying TCs in this model; refer to Table 1 of Bengtsson et al., 2007). 2) The vertical section of the cyclone reveals a warm core (the average temperature at 700, 500, and 300 hPa is 0.75 °C higher in the internal 3 × 3 grid than that in the external 7 × 7 grid). On the basis of these two criteria, we locate the position of the TC in the UH_HCM model and go back to the time and location when the vorticity first meets 6 × 10⁻⁵ s−1. Then we go back to find where the vorticity is below 5 × 10⁻⁵ s−1 (we usually use the landfall intensity in this experiment).
We identify and track the TCs in the WNP area (0–35 °N, 100 °E–180 °W). TC activity with a lifetime no less than 2 days is selected in the 12-year control-run experiment. From May to October in 1979–2015, the WNP area generates an average of 20.5 TCs in a year (tropical storm or above). There is an interannual variation in the simulated TCs. The average annual TCs simulated by the UH_HCM model are 20.3, which is slightly less than the observations.
The genesis density of TCs per year from May to October is compared between the 12-year control-run experiment and the historical observation records during 1991–2012. Figure 4B shows that, near the SCS and the Philippines, there are two high-frequency centers of TC genesis in the WNP during the study period. The southwest monsoonal flows and easterly trade winds converge in these two regions, where the TCs tend to form. The frequency of the simulated TCs is less than that in the observations, and the simulated high-frequency center is located farther northeast (Figures 4A,B). Figures 4C,D shows the track density of TCs per year from May to October over 12 years. The TC activity paths that the UH_HCM model simulates are more scattered than the observed paths because of the coarse resolution. Combined with Figure 4A, we find that the simulated monsoon trough is systematically northward, which makes most of the simulated TCs active in areas north of 20°N. Furthermore, the subtropical high is located farther northwest and makes TCs active in the tropical central Pacific region (Figure 4C).
On the basis of the method provided above for analyzing the observed MTC formation features in the WNP, we show the annual phase sequence of TC genesis from May to October in the 12-year control-run experiment (Figure 5) and select some typical events in the inactive, normal, and active phases (Table 3). Table 4 shows the statistical results for all events of the three MTC phases in the 12-year control experiment and the historical observation records from the JTWC during 1991–2012. Compared with the observations, the annual frequency of MTC events in the control experiment is lower and their annual duration is longer. These differences may be because events of short duration in the control experiment are not included herein. Overall, the UH_HCM model is capable of simulating the climatic statistical characteristics of the MTC events to a certain extent. To prove that the UH_HCM model is capable of simulating MTC formation, we select a typical MTC event in the active phase for demonstration. This event occurs from 29 August to 28 September. During the 31 days, 12 TCs generate in the WNP in succession. Figure 6 shows the evolution of the outgoing longwave radiation (OLR) and the wind fields at 850 hPa from 12 September to 20 September, during which two MTC cases occur. The first case is from 14 to 15 September when 2 TCs occur. The second case is from 17 to 19 September. Two new TCs generate in this period and there are three active TCs at the same time.
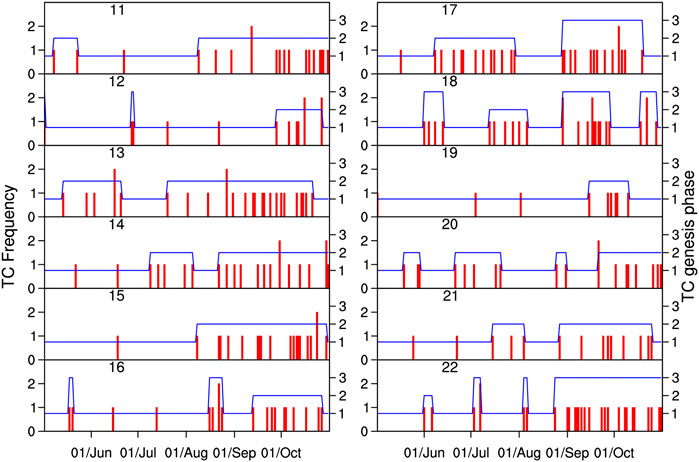
FIGURE 5. Same as in Figure 1, but for the 12-year control-run experiment.
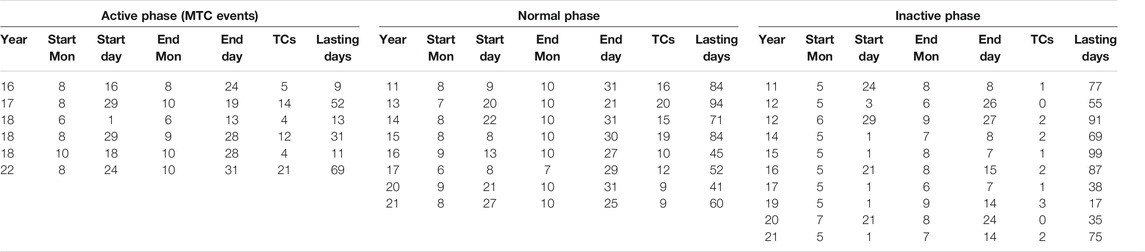
TABLE 3. Typical events of the three MTC phases in the WNP of the control-run experiment.
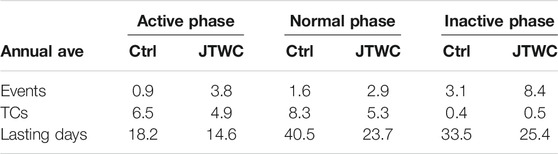
TABLE 4. Statistics of all events of the three MTC phases (observed data are the JTWC data for 1991–2012).
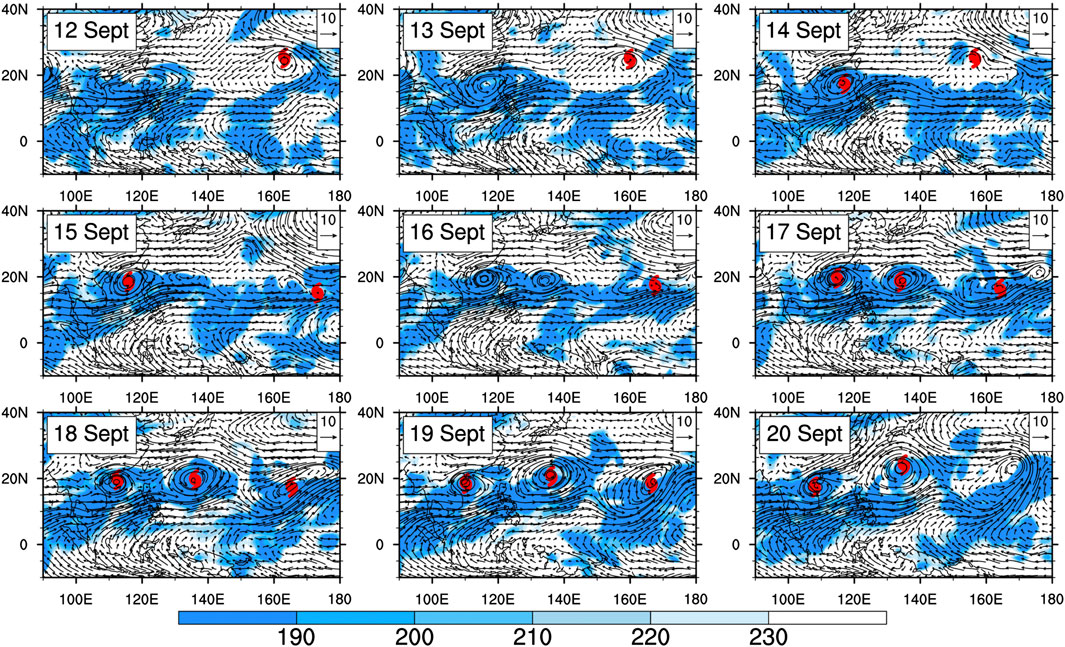
FIGURE 6. Evolution of the OLR and 850 hPa wind fields from 12 to 20 September. The date is given in the upper left corner of each panel, and the position of the individual TCs is indicated by the tropical cyclone symbol.
Figure 7 shows the composite wind and vorticity fields of typical events in the inactive, normal, and active phases at 850 hPa. Compared with Figure 2, we find that there is an evident monsoon trough simulated in the UH_HCM model during the MTC active phase. The center of the high positive vorticity corresponds to the MTC formation region. The positive vorticity zone is more distinct in the normal phase, and there is a wide range of negative vorticity in the inactive phase. The composite low-level wind difference of typical events in the active phase minus those in the inactive phase shows a large-scale cyclonic circulation in the WNP (Figure 7D). Compared with the observations, the low-level wind speed in the active phase is greater than that in the inactive phase, thus the vorticity difference is larger. In general, the simulation results are consistent with the observations.
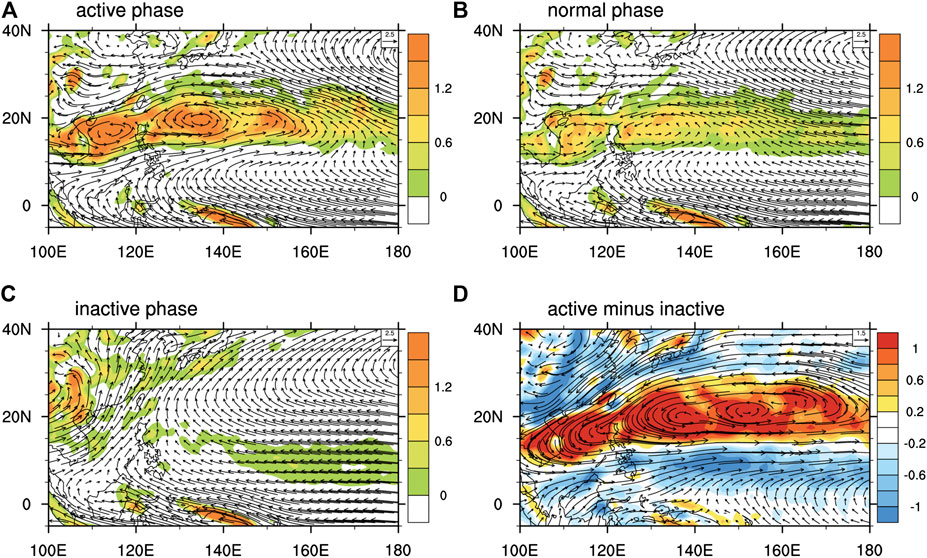
FIGURE 7. Same as in Figure 2, but for the 12-year control-run experiment.
Strong convection is an essential condition for the genesis and development of TCs. Figure 8 shows that the area of OLR lower than 230 W m−2 lies at 5–20 °N. This tropical convection activity belt covers the tropical Pacific Ocean in the Northern Hemisphere, which corresponds to the area where more TCs are generated in the control-run experiment. Compared with the active phase, the convective activity is weaker and the low value of OLR occurs at a lower latitude during the inactive phase (Figure 8B). During the active phase, the large value area of specific humidity at 600 hPa is very similar to the small value area of OLR. Furthermore, the atmospheric moisture condition is much better than that in the inactive phase, which is beneficial to TC genesis. Figure 8 also shows the large-scale wind field at 200 hPa and 925 hPa. During the active phase, the convergence in the lower atmosphere and divergence in the upper atmosphere can be clearly observed in the tropical western Pacific. However, there is a divergent circulation in the lower levels. The dissimilarities of the simulated circulation background match with those of the different MTC phases.
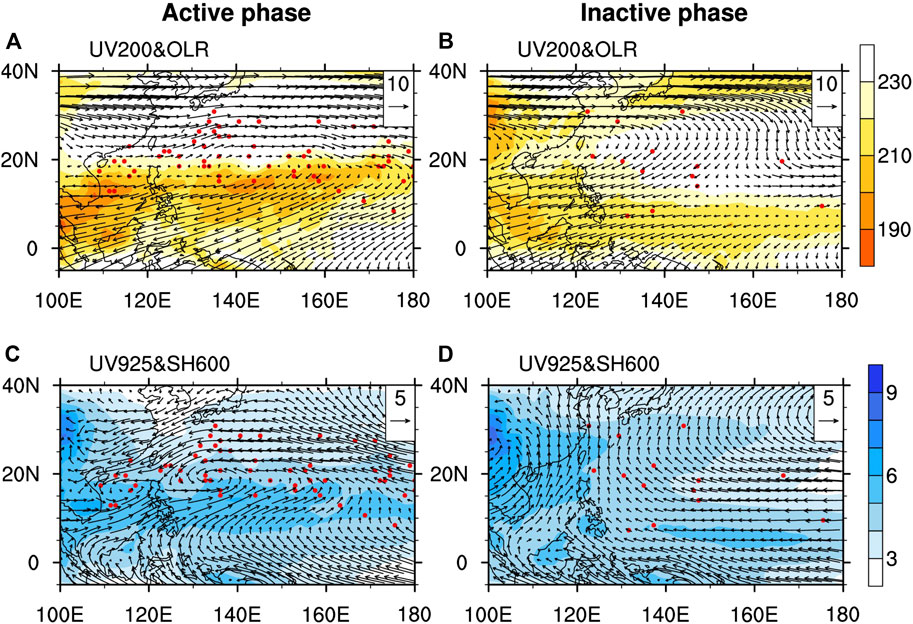
FIGURE 8. Composite fields of typical events in the active and inactive phases. (A and B) 200 hPa wind (m s−1) and OLR (W m−2). (C and D) 925 hPa wind (m s−1) and 600 hPa specific humidity (10–3 kg kg−1). The red solid marks denote the genesis location of TCs.
Using Eq. 2, we calculate the composite δGPI fields for the typical events of the three MTC phases. Figure 9 shows the spatial distribution during different phases. Larger positive values are concentrated in the 10–20 °N sea area during the active phase. Meanwhile, three maximum centers are located in the SCS and the central Pacific from 140 °E to 160 °E. During the inactive phase, relatively larger values of δGPI are widely distributed in the south of the 15 °N sea area, which is unfavorable for the MTC genesis. To further reveal how the four independent GPI terms influence MTC activity in the UH_HCM model, Figures 10 shows the composite difference of the active phase minus the inactive phase. Figure 10A (Term1) reflects the vorticity characteristics of 850 hPa and it agrees with the preceding context. The difference of Term2 (moisture) with a positive value is mainly distributed in the sea (15 °N–25 °N, 140 °N–180 °E) and the value is the largest among the four factors. In the active phase, extremely sufficient moisture in the low-level atmosphere contributes to the TC genesis in the Pacific Ocean. However, during the inactive phase, the location of the high moisture area is relatively farther north or south and it is not the main area for TC genesis. The difference of Term3 (potential intensity) is very small in the tropics. Negative values exist in the western Pacific area north of 15 °N and the maximum potential intensity simulated in the control-run experiment is not favorable for MTC activity. The difference of Term4 (vertical wind shear) is almost a negative value in the WNP, which is unfavorable for MTC activity in this model. In summary, different GPI terms have different effects on MTC activity as well as on different areas in the WNP. In the UH_HCM model, the vorticity and moisture have a significant impact on the MTC activity.
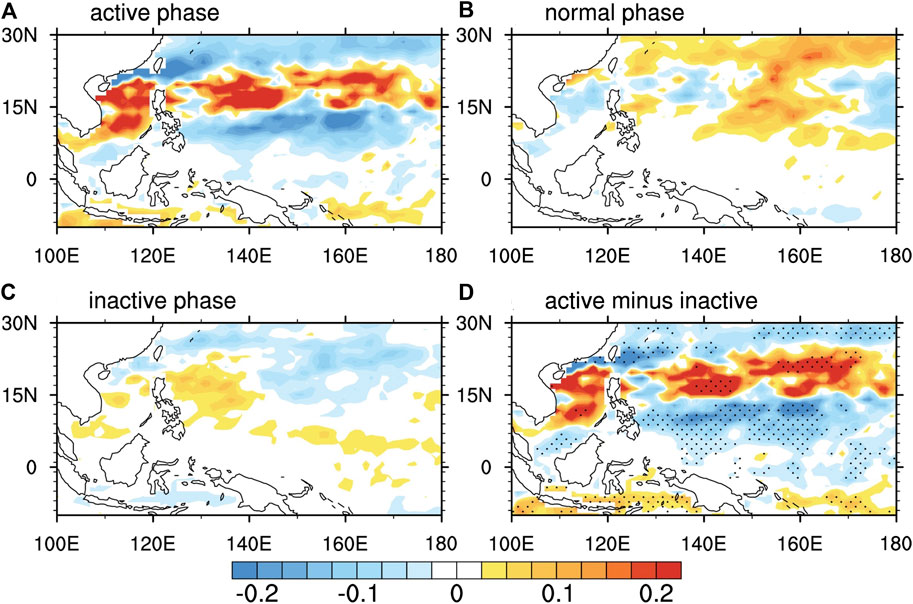
FIGURE 9. Same as in Figure 7, but showing the δGPI (GPI anomaly) fields.
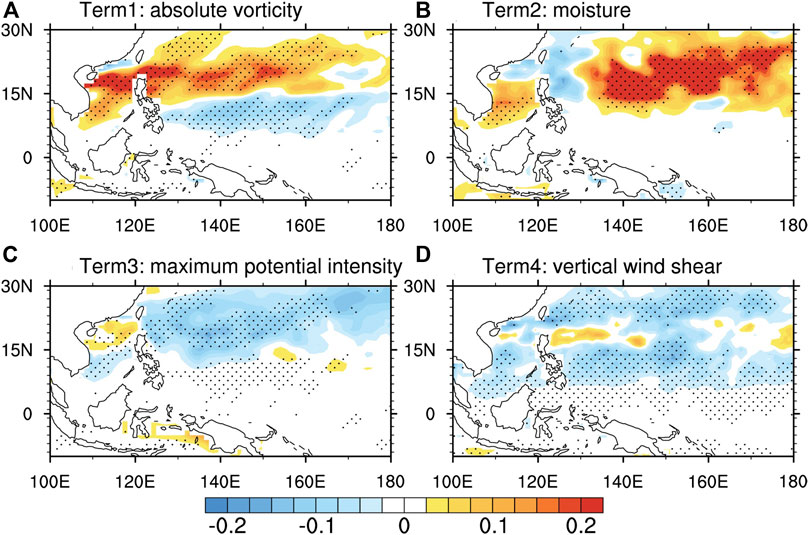
FIGURE 10. The composite difference of four independent δGPI (GPI anomaly) terms in the active phase minus those in the inactive phase. (A) Term1 represents vorticity, (B) Term2 represents moisture, (C) Term3 represents potential intensity, and (D) Term4 represents vertical wind shear. The dots represent values significant at the 95% confidence level using the t-test.
Three different phases of MTC events, i.e., the active phase, normal phase, and inactive phase, are determined during 1979–2015. By selecting typical events and performing composite analysis, the results suggest that MTC events tend to occur in the active phase when the monsoon trough is stronger and located farther north. In the control-run experiment, the UH_HCM model shows a certain ability for simulating the large-scale circulation background in the WNP area. For example, the model does well in simulating the northwest Pacific subtropical high and the monsoon trough. However, the location of the simulated subtropical high is farther northwest and the monsoon trough is farther north than in the observations. The UH_HCM model shows a certain ability for simulating TC activity in the WNP. Compared with the observational data, the frequency of TC genesis is lower, and the high-frequency center is farther northeast in the model results. As a whole, the model performs well in simulating the climatology and characteristics of the typical events in different MTC phases. The vorticity and moisture in the model appear to be the two main factors affecting MTC activity based on analyses of the GPI.
This study shows that there are some differences between the control-run experiment simulation and observational data. Our future study will use reanalysis data for historical hindcast experiments and improve the standards for TC identification, which will help to better describe the TC features and enhance the capacity of potential prediction for MTC events in the WNP.
The raw data supporting the conclusions of this article will be made available by the authors, without undue reservation.
TL and H-LR designed the study and completed the manuscript writing. YW contributed to the model simulation. JG contributed to the manuscript review. All authors equally collaborated in the research presented in this publication by making the following contributions.
This work was supported by the National Key R&D Program of China (Grant nos. 2018YFC1505805 and 2018YFC1505906) and the National Natural Science Foundation of China (41575052).
The authors declare that the research was conducted in the absence of any commercial or financial relationships that could be construed as a potential conflict of interest.
The authors thank Professor Joshua Xiouhua Fu from Fudan University for providing the UH_HCM model.
Bengtsson, L., Böttger, H., and Kanamitsu, M. (1982). Simulation of hurricane-type vortices in a general circulation model. Tellus 34 (5), 440–457. doi:10.3402/tellusa.v34i5.10830
Bengtsson, L., Botzet, M., and Esch, M. (1995). Hurricane-type vortices in a general circulation model. Tellus 47 (2), 175–196. doi:10.3402/tellusa.v47i2.11500
Bengtsson, L., Hodges, K. I., and Esch, M. (2007). Tropical cyclones in a T159 resolution global climate model: comparison with observations and re-analyses. Tellus Dyn. Meteorol. Oceanogr. 59 (4), 396–416. doi:10.1111/j.1600-0870.2007.00236.x
Briegel, L. M., and Frank, W. M. (1997). Large-scale influences on tropical cyclogenesis in the western North Pacific. Mon. Weather Rev. 125 (7), 1397–1413. doi:10.1175/1520-0493(1997)125<1397:LSIOTC>2.0.CO;2
Camargo, S. J., and Barnston, A. G. (2009). Experimental dynamical seasonal forecasts of tropical cyclone activity at IRI. Weather Forecast. 24 (2), 472–491. doi:10.1175/2008WAF2007099.1
Chen, L., and Ding, Y. (1979). Survey of typhoons over the west pacific. Beijing: Science Press. [in Chinese, with English summary]
Emanuel, K., and Nolan, D. S. (2004). “Tropical cyclone activity and the global climate system,” in Proceedings of the 26th conference on hurricanes and tropical meteorolgy, Miami, FL, May 3, 2004, 240–241.
Fu, X., and Hsu, P. C. (2011). Extended-range ensemble forecasting of tropical cyclogenesis in the northern Indian Ocean: modulation of Madden-Julian Oscillation. Geophys. Res. Lett. 38 (15), L15803. doi:10.1029/2011GL048249
Fu, X., and Wang, B. (2004). The boreal-summer intraseasonal oscillations simulated in a hybrid coupled atmosphere–ocean model. Mon. Weather Rev. 132 (11), 2628–2649. doi:10.1175/MWR2811.1
Fu, X., Wang, B., Li, T., and McCreary, J. P. (2003). Coupling between northward-propagating, intraseasonal oscillations and sea surface temperature in the Indian Ocean. J. Atmos. Sci. 60 (15), 1733–1753. doi:10.1175/1520-0469(2003)060<1733:CBNIOA>2.0.CO;2
Fu, X., Wang, B., Bao, Q., Liu, P., and Lee, J. Y. (2009). Impacts of initial conditions on monsoon intraseasonal forecasting. Geophys. Res. Lett. 36 (8), L14812. doi:10.1029/2009GL037166
Fu, X., Wang, B., Lee, J. Y., Wang, W., and Gao, L. (2011). Sensitivity of dynamical intraseasonal prediction skills to different initial conditions. Mon. Weather Rev. 139 (8), 2572–2592. doi:10.1175/2011MWR3584.1
Gao, J., and Li, T. (2011). Factors controlling multiple tropical cyclone events in the western North Pacific. Mon. Weather Rev. 139 (3), 885–894. doi:10.1175/2010MWR3340.1
Gao, J., and Li, T. (2012). Interannual variation of multiple tropical cyclone events in the western North Pacific. Adv. Atmos. Sci. 29 (6), 1279–1291. doi:10.1175/JCLI3934.1
Gray, W. M. (1979). “Hurricanes: their formation, structure and likely role in the tropical circulation,” in Meteorology over tropical oceans. Editor D. B. Shaw (Bracknell, United Kingdom: Royal Meteorological Society), 155–218.
Haarsma, R. J., Mitchell, J. F., and Senior, C. A. (1993). Tropical disturbances in a GCM. Clim. Dynam. 8 (5), 247–257.
Klotzbach, P. J., Barnston, A., Bell, G., Camargo, S. J., Chan, J. C. L., and Lea, A. (2011). in Seasonal forecasting of tropical cyclones in global guide to tropical cyclone forecasting. Editor C. Guard. 2nd Edn. (Geneva, Switzerland: World Meteorological Organization).
Krouse, K. D., and Sobel, A. H. (2010). An observational study of multiple tropical cyclone events in the western north Pacific. Tellus Series A-dynamic Meteorology & Oceanography 62 (3), 256–265. doi:10.1111/j.1600-0870.2009.00435.x
Lai, Q., Gao, J., Zhang, W., and Guan, X. (2020). Influences of the equatorial waves on multiple tropical cyclone genesis over the western North Pacific. Terr. Atmos. Ocean Sci. 31 (2), 227–238. doi:10.3319/TAO.2020.03.20.01
Li, T., and Fu, B. (2006). Tropical cyclogenesis associated with Rossby wave energy dispersion of a preexisting typhoon. Part I: satellite data analyses. J. Atmos. Sci. 63 (5), 1377–1389. doi:10.1175/JAS3693.1
Li, R. C., and Zhou, W. (2013a). Modulation of western North Pacific tropical cyclone activity by the ISO. Part I: genesis and intensity. J. Clim. 26 (9), 2904–2918. doi:10.1175/JCLI-D-12-00210.1
Li, R. C., and Zhou, W. (2013b). Modulation of western North Pacific tropical cyclone activity by the ISO. Part II: tracks and landfalls. J. Clim 26 (9), 2919–2930. doi:10.1175/JCLI-D-12-00211.1
Li, Z., Yu, W., Li, T., Murty, V. S. N., and Tangang, F. (2013). Bimodal character of cyclone climatology in the Bay of Bengal modulated by monsoon seasonal cycle. J. Clim. 26 (3), 1033–1046. doi:10.1175/JCLI-D-11-00627.1
Liebmann, B., Hendon, H. H., and Glick, J. D. (1994). The relationship between tropical cyclones of the western Pacific and Indian Oceans and the Madden-Julian oscillation. Journal of the Meteorological Society of Japan. Ser. II. 72 (3), 401–412. doi:10.2151/jmsj1965.72.3_401
Manabe, S., Holloway, J. L., and Stone, H. M. (1970). Tropical circulation in a time-integration of a global model of the atmosphere. J. Atmos. Sci. 27 (4), 580–613. doi:10.1175/1520-0469(1970)027<0580:TCIATI>2.0.CO;2
Nakazawa, T. (1988). Tropical super clusters within intraseasonal variations over the western pacific. Journal of the Meteorological Society of Japan. Ser. II. 66 (6), 823–839. doi:10.2151/jmsj1965.66.6_823
Nakazawa, T. (2006). Madden-Julian oscillation activity and typhoon landfall on Japan in 2004. SOLA 2, 136–139. doi:10.2151/sola.2006-035
Roeckner, E., Arpe, K., Bengtsson, L., Christoph, M., Claussen, M., Dümenil, L., et al. (1996). The atmospheric general circulation model ECHAM-4: model description and simulation of present-day climate. Hamburg, Germany: Max Planck Institute for Meteorology.
Schenkel, B. A. (2017). Are multiple tropical cyclone events similar among basins?. J. Clim. 30 (15), 5805–5813. doi:10.1175/JCLI-D-17-0088.1
Xie, Y. B., Chen, S. J., Chang, I. L., and Huang, Y. L. (2018). A preliminarily statistic and synoptic study about the basic currents over southeastern Asia and the initiation of typhoons. Journal of Meteorological Research 32 (4), 661–669. doi:10.1007/s13351-018-8888-6
You, L., Gao, J., Lin, H., and Chen, S. (2019). Impact of the intra-seasonal oscillation on tropical cyclone genesis over the western North Pacific. Int. J. Climato.l. 39 (4), 1969–1984. doi:10.1002/joc.5927
Zhao, C., and Li, T. (2019). Basin dependence of the MJO modulating tropical cyclone genesis. Clim. Dynam. 52 (9–10), 6081–6096. doi:10.1007/s00382-018-4502-y
Keywords: UH_HCM, multiple tropical cyclone events, western North Pacific, simulation, evaluation
Citation: Li T, Ren H-L, Wu Y and Gao J (2021) Evaluation of Simulation Capability for Multiple Tropical Cyclone Events in the Western North Pacific of the UH_HCM Model. Front. Earth Sci. 8:598473. doi: 10.3389/feart.2020.598473
Received: 24 August 2020; Accepted: 03 December 2020;
Published: 19 January 2021.
Edited by:
Ruifen Zhan, Fudan University, ChinaReviewed by:
Xi Cao, Chinese Academy of Sciences (CAS), ChinaCopyright © 2021 Li, Ren, Wu and Gao. This is an open-access article distributed under the terms of the Creative Commons Attribution License (CC BY). The use, distribution or reproduction in other forums is permitted, provided the original author(s) and the copyright owner(s) are credited and that the original publication in this journal is cited, in accordance with accepted academic practice. No use, distribution or reproduction is permitted which does not comply with these terms.
*Correspondence: Hong-Li Ren, cmVuaGxAY21hLmdvdi5jbg==
Disclaimer: All claims expressed in this article are solely those of the authors and do not necessarily represent those of their affiliated organizations, or those of the publisher, the editors and the reviewers. Any product that may be evaluated in this article or claim that may be made by its manufacturer is not guaranteed or endorsed by the publisher.
Research integrity at Frontiers
Learn more about the work of our research integrity team to safeguard the quality of each article we publish.