 Wen Zhang1
 Fei Liu
94% of researchers rate our articles as excellent or good
Learn more about the work of our research integrity team to safeguard the quality of each article we publish.
Find out more
ORIGINAL RESEARCH article
Front. Earth Sci., 11 December 2020
Sec. Atmospheric Science
Volume 8 - 2020 | https://doi.org/10.3389/feart.2020.595548
This article is part of the Research TopicThe Asian MonsoonView all 17 articles
East China has experienced positive precipitation anomalies in post-El Niño summers, mainly in the Yangtze-Huaihe River Valley. This kind of monsoonal rainfall change induced by El Niño, however, is not always the same due to El Niño diversity and mean state change. Here, we use cluster analysis on the post-El Niño (PE) East China summer precipitation anomalies to identify the diversity of this El Niño-induced monsoon change. The result shows that PE East China summer rainfall anomalies mainly display three different modes for all selected 20 El Niño events from 1957 to 2016. Cluster 1 shows the middle and lower reaches of the Yangtze River demonstrate strong wet anomalies, while South and North China are dominated by dry anomalies, similar to a sandwich mode. Cluster 2 is distinguished by dry anomalies over South China and wet anomalies over North China, exhibiting a dipole mode. Compared with Cluster 1, the change caused by Cluster 3 is different, showing negative anomalies over the Yangtze-Huaihe River Valley. The three clusters are correlated with successive events of El Niño, a quick transfer to a strong La Niña and a quick transfer to a weak La Niña respectively. The associated anomalous anticyclone (AAC) focuses on (120°E, 20°N) in Cluster 1, which expands southward for Cluster 2 and moves eastward for Cluster 3. The feedback of AAC-sea surface temperature (SST) mainly works for supporting the AAC in Cluster 1, but it is weak for Cluster 2; the strong easterly anomalies related to La Niña contribute to the AAC location change for Cluster 2. Both AAC-SST feedback and easterly anomalies support the AAC of Cluster 3. The CMIP5 output can capture these diverse responses in circulation except that their simulated AAC for Cluster 1 is significant to the east of the observed.
East Asian summer monsoon (EASM) plays a significant role in Asian monsoon system. The weather and climate in a large part of the East Asian region are affected by the variability and evolution of EASM (Chen et al., 1992; Wang et al., 2003). Rain bands distribution changes and a wide range of precipitation anomalies in China caused by the EASM often lead to floods, droughts and other meteorological disasters, damaging the ecological environment and GDP as well (Li, 2014; Xue et al., 2015). One of the most robust signals in air-sea coupling system over some tropics is the appearance of El Niño/Southern Oscillation (ENSO), which is of great importance in modulating the EASM change (Zhang et al., 1996; Tao and Zhang, 1998; Yang and Lau, 2006).
In the western North Pacific (WNP), the anomalous anticyclone (AAC) is a vital system connecting ENSO and climate changes in East Asia. With plenty of researches, it is indicated that the stable presence of WNP AAC in the decay years of El Niño suppresses the convective activity in the WNP, while EASM will be enhanced two seasons later (Zhang et al., 1996; Wang et al., 2000). Three mechanisms for maintaining anomalous WNP AAC have been proposed. The first mechanism reveals the importance of the AAC interacting with the WNP sea surface temperature (SST) cooling under the control of background average flow (Wang et al., 2000), which has been confirmed by coupled general circulation model (CGCM) experimental test (Wang et al., 2013). The northeast wind anomaly to the southeast of the AAC strengthens the average east wind. Besides, the upward latent heat flux (evaporation) there tends to be enhanced and SST, cooled. Conversely, the resultant ocean cooling will generate descending Rossby waves that reinforce the AAC and suppress local convection. The second mechanism is named the Indian Ocean capacitor effect, which indicates that the importance of SST anomalies in the tropical Indian Ocean (IO) is emphasized. It regards IO warming as a capacitor. The western North Pacific subtropical high (WNPSH) is enhanced by eastward propagation of Kelvin waves (Xie et al., 2009). This mechanism has been confirmed by numerical experiments, which include an atmospheric general circulation model (AGCM) (Huang et al., 2010) and a CGCM model (Chowdary et al., 2010; Chowdary et al., 2011). The coupling between the WNP AAC and ocean shifts from the WNP to the North Indian Ocean (NIO) as season changes. This influence which is named Indo-western Pacific ocean capacitor (IPOC) can further show the reason why the WNP AAC maintains (Kosaka et al., 2013; Wang et al., 2013). Besides, the two mechanisms are linked together and the feedback of AAC-SST is summarized, shown as a mode of coupled ocean-atmosphere, including WNP cooling and NIO warming (Xie et al., 2016).
SST cooling or warming’s control over the central Pacific is the third mechanism for maintaining the WNP AAC. Xiang et al. (2013) found that a developing La Niña is associated with a stronger western Pacific subtropical high (WPSH) anomaly. Wang et al. (2013) also put forward that Walker circulation can be shifted by the central equatorial Pacific cooling, leading to convection over the Maritime Continent been reinforced while that over the WNP been suppressed. Therefore, AAC can be enhanced by descending Rossby waves and strengthened by the equatorial easterly winds, which pass over the western Pacific, with the former being stimulated by reduced convection around 160°E and the latter being induced by the increased Maritime Continent convection.
Atmospheric circulation at mid-to-high latitudes also affects changes in East Asian circulation. Thompson and Wallace (1998) found that the main mode of sea level pressure (SLP) variability to the 20°N in the North shows a “seesaw” structure. This mode is named the Arctic Oscillation (AO), existing not only near the ground, but also in the lower stratosphere. It has been shown that the AO is in linkage with the climate of East Asia (Gong et al., 2001; Park et al., 2011). With positive AO and strengthening polar vortex as well as the mid-latitude westerly, the cold air is confined to the polar region. But if AO appears in negative phase, the polar vortex weakens, and westerly weakens and moves southward. As a result, the Arctic cold air is prone to erupt to the south, affecting Asia (Wu et al., 2004). Furthermore, the spring AO can affect the EASM via influencing East Asian jet stream (Gong et al., 2002) and stimulating tropical air-sea feedback in the WNP (Gong et al., 2011). Gong et al. (2002) and other researchers, such as Gong and Ho (2003), Liu et al. (2019), pointed out that with positive phase of AO in May, WPSH moved northwest due to the northward movement of the East Asian jet stream, which enhanced EASM and reduced rainfall in the Yangtze River Basin in summer.
Many studies have shown that the circulation and precipitation of EASM are different under different categories of ENSO in their decaying phases, such as different intensity (Xue and Liu, 2008; Lee et al., 2014), onset location (Feng et al., 2011; Yuan and Yang, 2012), decay speed (Zhou et al., 2019), which all show the diversity of EASM. In addition, various kinds of El Niño cases correspond to different decaying speeds. For instance, in the decaying summer of eastern-Pacific type, the abnormal negative precipitation occurs in the north of Yangtze-Huaihe River region, while anomalous positive precipitation occurs in South China because El Niño decays slowly. However, opposite rainfall patterns are found in the decaying summer of central-Pacific type due to the quick decay (Feng et al., 2011). Moreover, El Niño cases are separated into four types in Wang et al. (2017): super, major, moderate, and minor ones, recognizing that the distributions of rainfall over East Asia are quite different due to various strength and evolution of El Niño. Zhou et al. (2019) divided El Niño decay into early stage and late stage. For an early transition, positive rainfall anomalies mainly emerge over East China with SST anomaly result over the middle-east Pacific transiting to the state analogous to La Niña during the decaying summer. For a late transition, a tripolar negative-positive-negative rainfall anomaly pattern appears over China with the SST anomalies remained.
The classifications are not only related to the complex ENSO properties, but also related to the average state. Compared with the negative Pacific decadal oscillation (PDO) phase, the EASM becomes more vigorous after a weak East Asian Winter Monsoon associated with ENSO during the positive PDO phases (Chen et al., 2013). Feng et al. (2014) focused on El Niño decadal modulation and pointed out that during the negative PDO phase, most regions in China are dominated by positive anomalies of rainfall because El Niño decays quickly. When PDO is in its positive phase, suppressed rainfall occurs over South and North China and reinforced rainfall occurs over Central China because El Niño decays slowly.
Seasonal evolution of the ENSO-EASM relationship is also of great importance since the rainfall responses may not be fully represented by June-August (JJA) mean rainfall anomalies (Ding, 2004; Ding and Chan, 2005). It is shown that the ENSO can affect the early stage and late stage of summer rainfall anomalies in a different way in East Asia (Chang et al., 2000; Wang et al., 2009; Xing et al., 2016; Xing et al., 2017). From June to August, the rain belt conducts northward movement in El Niño decay stage (Ye and Lu, 2011; Wang et al., 2017). Feng et al. (2014) not only researched the EASM behaviors in PE summer, but also found the rainfall pattern has great subseasonal variation. From June to August, the northward migration of anomalous positive rainfall moves from South China to North China in the negative PDO phase due to two clearly northward shifts of the WPSH. Hu et al. (2017) put forward that the subseasonal variation of precipitation anomalies are attributed to the northward movement of the WNP AAC and subtropical jet anomalies in PE summer.
Previous studies all started from El Niño, while few attention was placed on El Niño-induced monsoon diversity itself. In this study, the goal is to identify the diversity of China summer rainfall change in PE summers first; then to analyze possible mechanisms related to the variations of the WNP AAC. The structure of this paper is arranged in the following way. The collection of data and research methods used in the study are depicted in Data and Methods. For Results, the precipitation over East China in PE summers is classified into three types, and the causes of different rainfall responses are explained. Subseasonal migration of rainfall anomalies in these three types are also discussed. Finally, whether model outputs support our discovery has been checked. In Discussion and Conclusions, the above conclusions are integrated together.
This study includes five datasets. For rainfall background information, 160 observational stations of the Chinese Meteorological Data Center ranging from 1951 to 2016 are used; and the data set of the Climatic Research Unit (CRU, TS4.01), which covers terrestrial rainfall data between 1901 and 2016 (Harris et al., 2014). Manual verification and correction were generally given to the suspicious and incorrect station rainfall data, and quality control codes were finally marked for them (Wang et al., 2007). Monthly wind and geopotential height fields come from the reanalysis data set of the National Centers of Environmental Prediction–National Center for Atmospheric Research (NCEP-NCAR), with the time range from January 1948 to the present (Kalnay et al., 1996). The monthly SST data comes from the data set of the Hadley Center Global Sea Ice and Sea Surface Temperature (HadISST), which is run by the UK Met Office’s Hadley Center (Rayner et al., 2003) from 1870 to 2016. The years from 1957 to 2016 are chosen as the research period in this study, mainly to consider consistency and reliability. To eliminate possible effect of long-term trends, we detrended each field before analysis by removing the least squares linear trend of the dimension from all grid points.
Considering Taylor’s et al. (2012) research, we also use the historical outputs from 38 coupled general circulation models (CGCMs) that took part in the Coupled Model Intercomparison Project phase 5 (CMIP5) during 1901–2004 (Taylor et al., 2012) to test if the findings based on observations are reproduced by these models. Only ensemble 1 of all the models is used. In Table 1, the model names, resolutions and organizations that provide the data are shown.
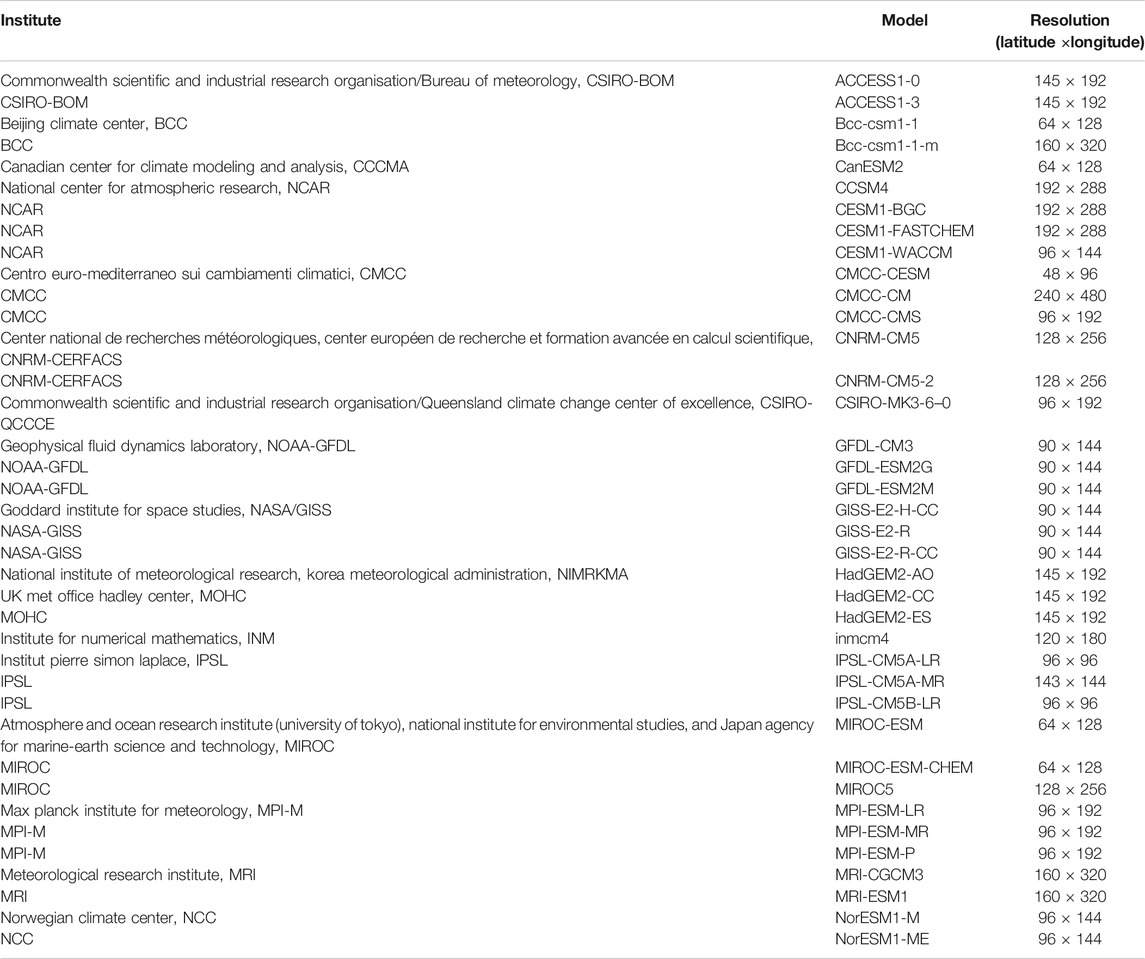
TABLE 1. Detail information in 38 CMIP5 models applied in this study.
First, El Niño events from 1957 to 2016 are selected. The selection of the observed El Niño events is according to the Niño3.4 index, which is defined by the average SST anomalies in the region (120°–170°W, 5°S–5°N), which acquires anomalies through removing climatological average value and annual cycle for 1957–2016. When the normalized Niño3.4 index of an event exceeds 0.5 in the winter (DJF), the event is called an El Niño event. Following this definition, 20 events of El Niño are picked out, which include 1957/1958, 1963/1964, 1965/1966, 1968/1969, 1969/1970, 1972/1973, 1976/1977, 1977/1978, 1979/1980, 1982/1983, 1986/1987, 1987/1988, 1991/1992, 1994/1995, 1997/1998, 2002/2003, 2006/2007, 2009/2010, 2014/2015, and 2015/2016.
Then, the K-means cluster analysis (Wilks, 2011) is applied to classify these 20 events based on China rainfall anomalies in PE summer (JJA) during 1957–2016. Cluster analysis is a significant statistical method for pattern recognition. The operation process is simple, with high efficiency and scalability in data management; the time complexity is nearly linear, and it is suitable for mining large-scale datasets (Zhang et al., 2008). Compared with the symmetry characteristics of EOF analysis, this method can also realize the diversification of mode. In this method, for the purpose of evaluating how similar each member and the corresponding centroid, squared Euclidean distance is calculated. The silhouette clustering assessment criteria is applied to measure whether the skill of this statistical method is appropriate. The silhouette value ranging from −1 to +1 for each member can measure how similar a member is to the other members in its own cluster. When silhouette value is high, it means that the member matches with its own cluster well and is not a good match with its neighboring clusters (Kaufman et al., 2009). In general, we use the rainfall anomalies of these 20 events as the cluster analysis data, and as a result, these events are classified into three clusters. In this paper, composite analysis is used in analyzing different responses of these three types and the method of significance test is Student’s t-test.
This algorithm is sensitive to the selection of initial cluster centroid and the results can be influenced by it. To overcome this defect, we first estimate the range of k value and then find optimum value (Liu, 2016). Based on the stability and physical meanings, we found it is better to classify the selected events into three clusters, with six events (1968/1969, 1976/1977, 1977/1978, 1979/1980, 1982/1983, 1986/1987, and 2014/2015) in cluster 1, nine events (1963/1964, 1969/1970, 1977/1978, 1987/1988, 1997/1998, 2002/2003, 2006/2007, 2009/2010, and 2015/2016) in cluster 2, and five events (1957/1958, 1965/1966, 1972/1973, 1991/1992, and 1994/1995) in cluster 3.
The composite summer rainfall anomalies in China are shown in Figure 1 for three clusters. For the average of 20 events, most regions are controlled by positive anomalies except for South and Northeast China, and for some eastern coastal areas (Figure 1A). In cluster 1, in the middle and lower reaches of the Yangtze River (MLRYR), there are positive anomalies of heavy rainfall and negative anomalies in South and North China, showing a tripolar pattern (Figure 1B). In cluster 2, the precipitation anomalies in South China and the lower reaches of the Yangtze River are negative. From the north of these areas to North China, the positive precipitation is abnormal (Figure 1C). In cluster 3, the Yangtze-Huaihe River Valley are dominated by negative rainfall anomalies; to the southern and northern area, it presents wet anomalies (Figure 1D). The strongest rainfall anomalies happen in the MLRYR in cluster 1.
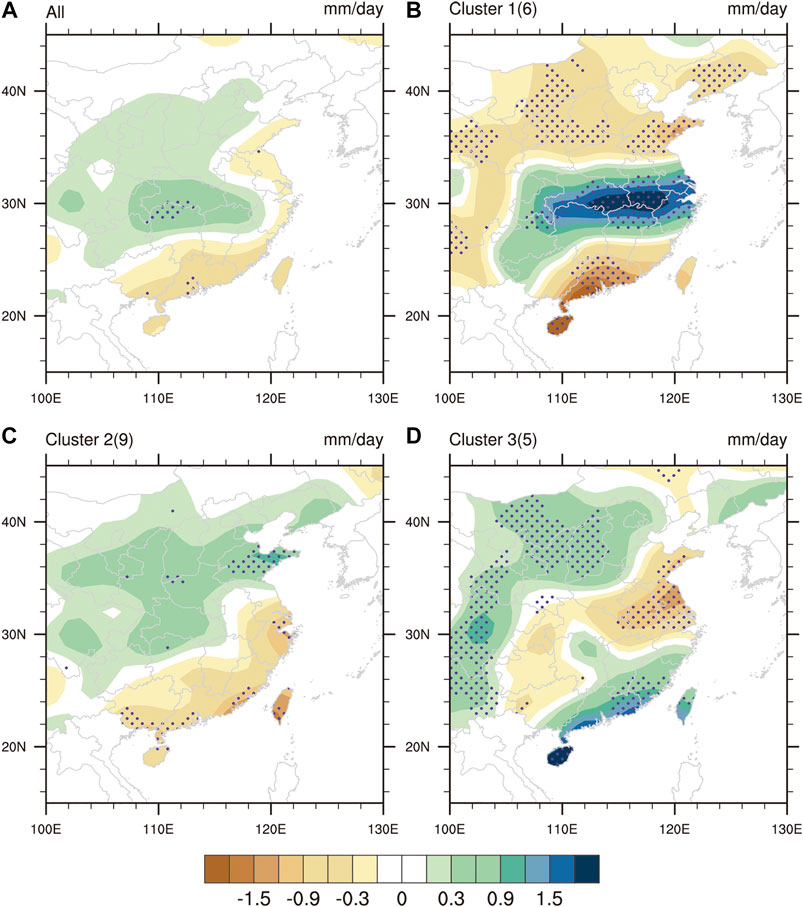
FIGURE 1. Composite El Niño decaying summer rainfall (shading; mm/day) anomalies in East China which locates at 105°E to 140°E and 15°N to 55°N in (A) all 20 (B) cluster 1 (C) cluster 2, and (D) cluster 3 during 1957–2016. Number of events in each cluster is included in the parentheses. Stippling indicates that more than 2/3 of the events have the same sign in their own cluster.
The stable presence of the WNP AAC strongly influences East Asia monsoon in PE, especially in China (Zhang et al., 1999; Lin and Lu, 2009). Figure 2 shows composite SST and wind anomalies of 850-hPa for three clusters. In cluster 1, the WNP AAC goes through the South China Sea and the Philippine Sea, while its center is located at (120°E, 20°N) (Figure 2A). The precipitation over South China is suppressed by the westward expansion of the AAC through Rossby wave propagation (Lin, 2008). Flows from the southwestern side of the WNP AAC transport moisture to MLRYR. The warm and moist air converges with the cool air from the high latitude, causing strong positive rainfall anomalies in this area. In cluster 2, the WNP AAC expands southward, which is associated with equatorial easterly wind anomaly, and Southeast China is controlled by the AAC (Figure 2B). The southwesterly wind anomaly, however, penetrates to North China and causes positive precipitation anomalies there. In cluster 3, the WNP AAC moves eastward and is centered at (150°E, 25°N) (Figure 2C), with its convergence center over Southeast China. These different AAC locations result in different types of rainfall responses.
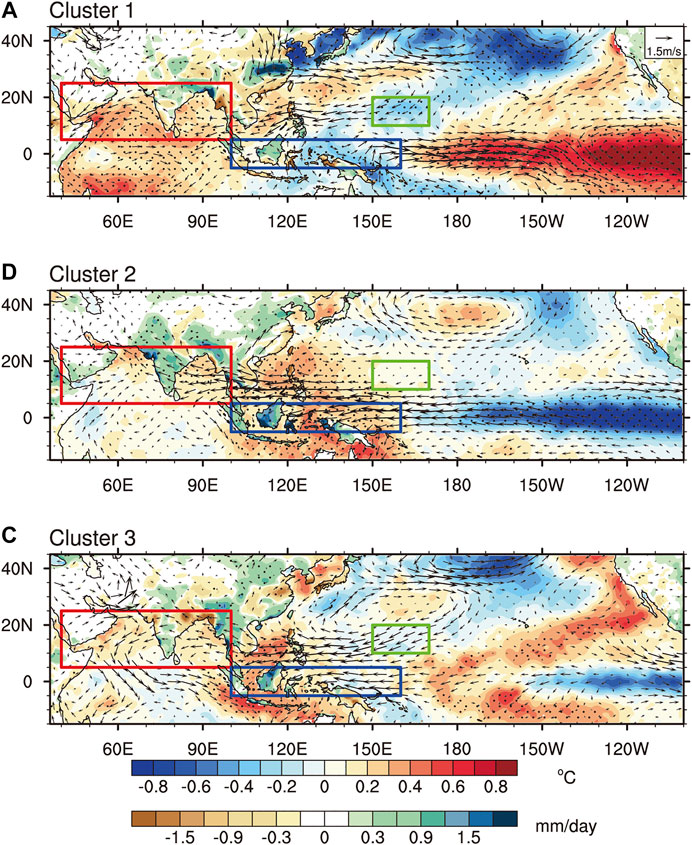
FIGURE 2. Composite El Niño decaying summer land precipitation anomalies (shading; mm/day), SST anomalies (shading; °C), and wind anomalies of 850-hPa (vector; m/s) in (A) cluster 1 (B) cluster 2, and (C) cluster 3 during 1957–2016. The Northwest Pacific (150°–170°E, 10°–20°N), NIO (40°–100°E, 5°–25°N), and Indo-western equatorial Pacific (100°–160°E, 5°S–5°N) are represented by green, red, and blue boxes, respectively. The black dots indicate the anomalous SST and rainfall above confidence level of 90% in Student’s t-test.
The local interaction of atmosphere-ocean has an impact on WNP AAC. In cluster 1, there are obvious positive SST anomalies in the middle-east equatorial Pacific and the whole IO. Westerly anomalies correlated with the SST anomalies exist in the central equatorial Pacific. Over the WNP, Northeasterly anomalies appear and the situ underlying SST anomalies are negative (Figure 2A). The anomalous northeasterlies strengthen the mean, resulting in SST cooling near the southeastern side of WNP AAC, thereby further increasing evaporation/entrainment (Wang et al., 2000). Deep convection can be suppressed by the cooling, which can generate atmospheric Rossby waves propagating westward, and strengthen the WNP AAC. The easterly anomaly over the NIO in the decaying summer weakens the southwest monsoon and maintains the NIO warming (Du et al., 2009). The Kelvin wave in the equatorial area is stimulated over the western Pacific by the warming of NIO to reinforce WNP AAC, which is called the “Indian Ocean capacitor” (Xie et al., 2009; Xie et al., 2016).
One of the unique features of cluster 2 events is that there is a remarkable strong La Nina phenomenon in the central-east Pacific, and there are anomalous easterlies over the Maritime Continent and the central equatorial Pacific. The NIO is occupied by easterly anomaly, and SST shows positive anomaly (Figure 2B). In terms of coupled NIO warming-WNP cooling mode, the WNP cooling is absent and only NIO warming exists. The strong easterly strengthens a convergence zone, thus positive rainfall anomaly extending westward and appearing over India. The intensive equatorial Pacific cooling leads to strong equatorial easterly anomalies, which help maintain the AAC and pull it southward.
In the NIO, the warm SST is seen in cluster 3, and from central area to eastern Pacific, the cold one is shown. They are similar to cluster 2, but the La Niña-like cooling is weaker in cluster 3. Correspondingly, from central area of equatorial Pacific to the Maritime Continent, easterly anomaly is also weak. The resulted AAC is shifted eastward compared with that in cluster 2. The convergence zone is also shifted eastward and positive anomalies of the rainfall occur in the Maritime Continent and South China. A weak cold SST anomaly is found in the WNP, combined with northeasterly wind anomalies (Figure 2C).
Figure 3 shows seasonal development of Niño 3.4 index for these three clusters. For all 20 events, the central-eastern equatorial Pacific SST has peaked in developing winter; and for decaying summer, it decays to neutral condition. For cluster 1, the SST remains warm from the developing winter through the decaying summer. For cluster 2, this SST decays quickly to zero in the late spring and reaches a cold condition in the following summer. For cluster 3, the overall trend is close to that in cluster 2, but the decay speed of SST is relatively slower and reaches zero in the early summer. Thus, we conclude that cluster 1 is related to successive El Niño, while clusters 2 and 3 are related to fast-decaying El Niño.
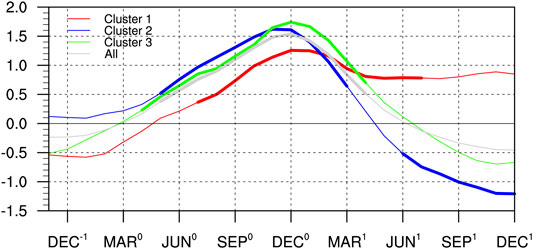
FIGURE 3. Seasonal evolution of Niño3.4 index for the three clusters. The red, blue, green, and grey colors denote the composites of cluster 1, cluster 2, cluster 3, and all events, respectively. Thick lines indicate anomalies above the confidence level of 90% in Student’s t-test. Superscripts −1, 0, 1 on the abscissa represent El Niños are in previous, developing, and decaying stages, respectively.
In summary, two feedbacks are found to maintain the WNP AAC in these three clusters, related to SST and atmospheric circulation contributions. One is the AAC-SST feedback, which means the mode of NIO warming coupling with WNP cooling; and second is the equatorial easterly feedback. To better illustrate two feedback mentioned above, we define three indices to represent them. For the AAC-SST feedback in the WNP section, the SST index refers to the WNP mean SST anomalies ranging (150°–170°E, 10°–20°N). For IO section of the dipole mode, the SST index refers to the averaged SST anomalies over the NIO, covering (40°–100°E, 5°–25°N). In addition, the mean easterly anomaly of the western equatorial Pacific (100°–160°E, 5°S–5°N), called the equatorial easterly index, is used to represent the equatorial easterly feedback. Figure 4 shows the seasonal evolutions of the three indices for the three clusters respectively. In the decaying summer, the negative SST anomaly still exists in the WNP in clusters 1 and 3, while it disappears since the late spring in cluster 2 (Figure 4A). Furthermore, compared with cluster 1, the cold SST anomaly in cluster 3 is weaker. And SST anomalies for NIO are positive in the previous autumn and remain positive in the following summer in all three types (Figure 4B), meaning the AAC-feedback only exits in clusters 1 and 3. The equatorial easterly index reaches its peak in the previous autumn in all three types. The westerly anomaly remains positive in cluster 1 but the westerly anomalies turn to easterly anomalies from the late autumn in clusters 2 and 3. Additionally, the easterly anomaly is stronger in cluster 2 in the following summer (Figure 4C), meaning the easterly feedback in equatorial area only appears in clusters 2 and 3. In general, the WNP cooling and NIO warming are both notable in cluster 1 in the PE summer. In cluster 2, the NIO section of the AAC-SST feedback and the easterly feedback in equatorial are the main factors maintaining the WNP AAC. In cluster 3, the WNP cooling, NIO warming, and the equatorial easterly jointly support the WNP AAC; however, the feedbacks are relatively weak.
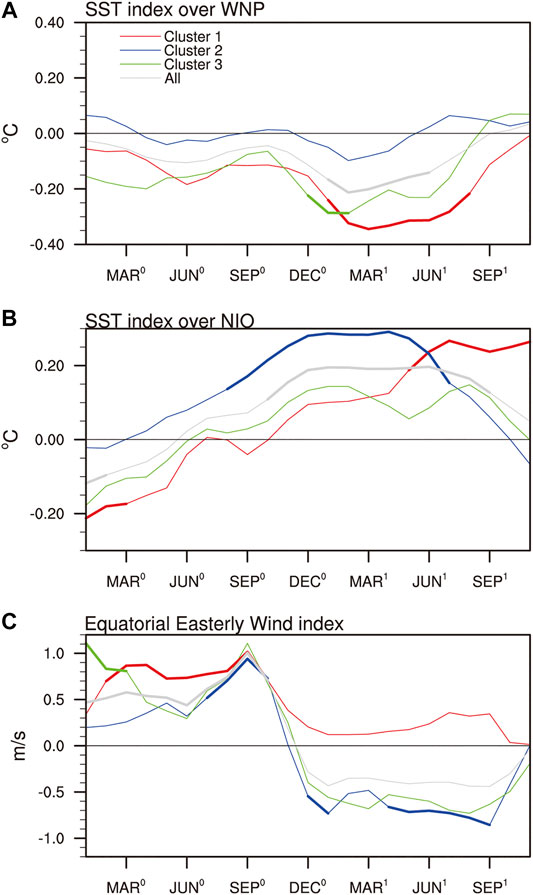
FIGURE 4. Seasonal evolutions of three indices (A) WNP index (B) NIO index, and (C) Equatorial easterly wind index in three clusters. The WNP index and NIO index refer to the mean SST anomalies in the WNP (150°–170°E, 10°–20°N) and NIO (40°–100°E, 5°–25°N), respectively. The easterly index is represented by mean zonal wind anomalies in the equatorial area of western Pacific (100°–160°E, 5°S–5°N). The red, blue, green, and grey colors represent composite cluster 1, cluster 2, cluster 3, and all events, respectively. Thick lines indicate anomalies above the confidence level of 90% in Student’s t-test. Superscripts 0 and 1 on the abscissa represent El Niños are in developing and decaying stages, respectively.
Different rainfall responses are also affected by atmospheric circulation in the mid-to-high latitude. Figure 5 presents the composite anomalous circulation field in upper troposphere for these clusters. In cluster 1, negative geopotential height anomaly appears at mid-high latitudes in Northern Hemisphere while positive anomaly appears over the polar region, similar to AO’s negative phase (Figure 5A). The north-high and south-low situation is favorable for the polar cold air invading southward (Wu et al., 2004). The downward cold, dry air and the warm, moist air on west flank of the subtropical high encounter in MLRYR and bring heavy rainfall there. In clusters 2 and 3, the geopotential height anomaly is negative over the polar region and positive in mid and high latitude, which is in accordance with positive phase in the AO (Figures 5B,C). This south-high and north-low situation traps the cold air in the polar region by the high pressure, and it is difficult for the cold air to invade southward. Therefore, the southwesterly wind anomaly can penetrate to North China without the obstruction of the cold air, and causes rainfall in North China. In addition, westerly anomalies are found over the Tibetan Plateau in cluster 1 and cluster 3 (Figures 5A,C), which can transport warm advection to the lower reaches, causing ascending movement and enhancing precipitation over East China (Sampe and Xie, 2010; Hu et al., 2017). Role of subtropical front should be considered in the future (Wang et al., 2019).
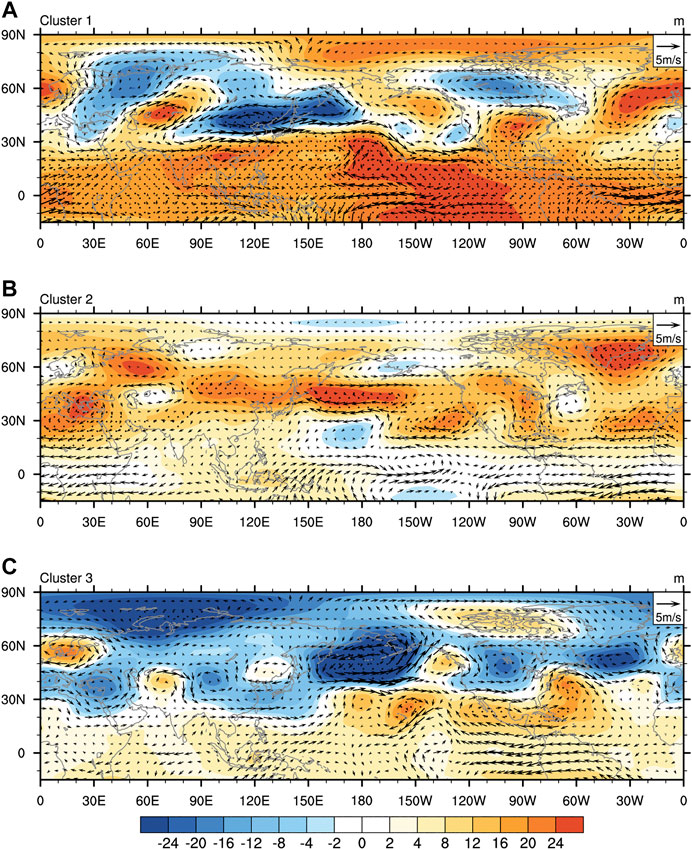
FIGURE 5. Composite El Niño decaying summer geopotential height anomalies of 200-hPa (shading; m) and wind anomalies (vector; m/s) in (A) cluster 1 (B) cluster 2, and (C) cluster 3 during 1957–2016. The black dots indicate anomalous SST and rainfall above the confidence level of 90% in Student’s t-test.
The diversity of China summer rainfall change may also be related to subseasonal migration of rainfall anomalies, because JJA averaged anomalies cannot completely represent the responses of precipitation. This is due to a northeast-southwest oriented subtropical front mainly controls the rainfall over China even the whole East Asia, which makes the region a distinct monsoon region. This convergence zone of the mean state migrates from southern part of China in June to northern part in August (Ding and Chan, 2005). For all 20 events (Figures 6A,B,C), the positive rainfall anomaly appears in parts of South China and southern part of the Yangtze River in June, and moves northward in next month to the Yangtze River Valley, and continues migrating to North China in August. The migration is similar to the northward movement in the mean state. At June, the AAC locates in the South China Sea, and after that moves toward north in July and August. For cluster 1 (Figures 6D,E,F), the positive rainfall anomalies remain in the MLRYR for the whole summer. The stabilization of the AAC around 22°N provides continuous rainfall in the mid-latitude region and leads to the JJA mean pattern in cluster 1. For cluster 2 (Figures 6G,H,I), the northward migration of rainfall anomalies is analogous to the observations in all events. The positive rainfall anomaly occurs in South China, and an AAC appears in the South China Sea at June for cluster 3 (Figure 6J). In July, the AAC moves to the east side, causing a tripolar rainfall mode distinguished by anomalous negative phase in the Yangtze-Huaihe River Valley while anomalous positive phases for the North and South (Figure 6K). In August, the AAC expands westward and the rainfall anomaly shows a dipole pattern (Figure 6L). These give rise to the positive-negative-positive sandwich rainfall pattern in JJA mean in cluster 3. The prominent subseasonal rainfall anomalies are caused by the rainfall concentrated in the subtropical frontal zone, and the subtropical front migrates northward continuously. Correct prediction of this seasonal evolution is important to improve our subseasonal prediction of China summer rainfall (Liu et al., 2020), and the role of intraseasonal variability and synoptic perturbations over the monsoon trough should be studied in the future (Liu and Wang, 2013; Gao et al., 2018; Guan et al., 2019).
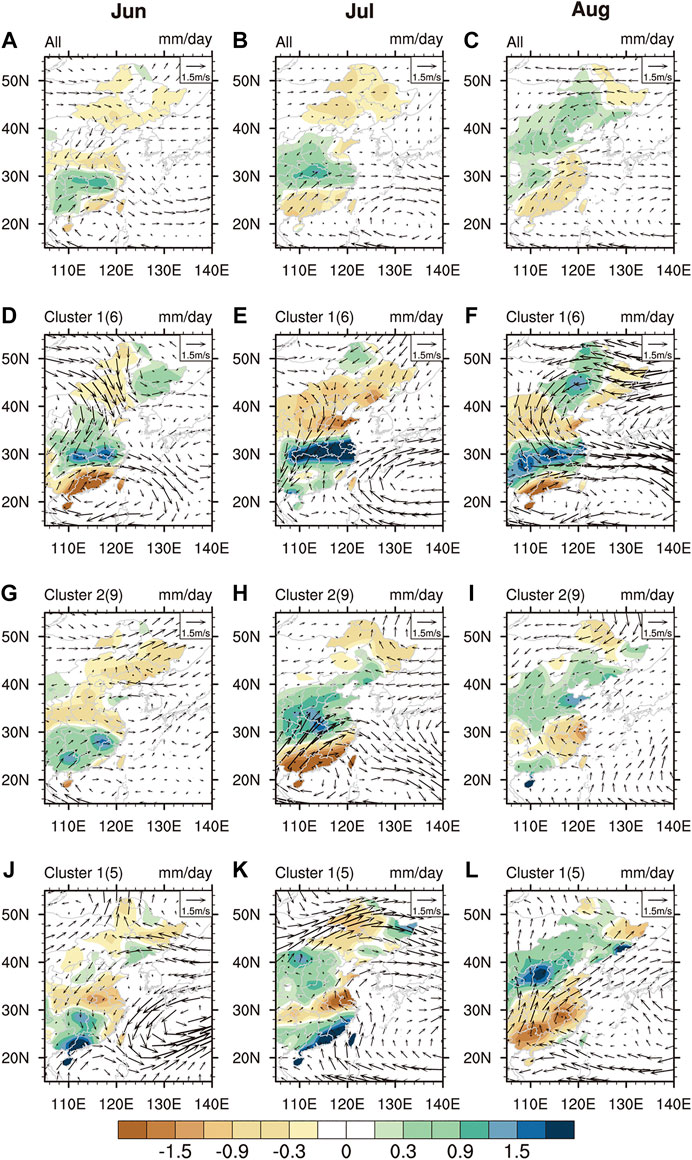
FIGURE 6. Composite El Niño decaying summer rainfall anomalies (shading; mm/day) and wind anomalies of 850-hPa (vector; m/s) over East China in (A) June (B) July, and (C) August for all 20 events during 1957–2016 (D) (E) (F) and (A) (B) (C) are alike, respectively, but for cluster 1 (G) (H), and (I) are for cluster 2; and (J) (K), and (L) are for cluster 3. The number of events in each cluster is included in the parentheses. The black dots reveal anomalous rainfall above the confidence level of 90% in Student’s t-test.
We use 38 CMIP5 model outputs during 1901–2004 to test if the responses exist in PE. Based on the above analysis results, clusters 1, 2, and 3 correspond to a successive El Niño, quick transition to a strong La Niña, and quick transition to the weak one in PE summers respectively. The successive El Niño means normalized Niño 3.4 index exceeding 0.5 in the preceding winter (DJF), as well as following summer (JJA). A quick transition to a strong La Niña refers to normalized Niño 3.4 index exceeding 0.5 in the preceding winter (DJF) and falling below −0.5 in the following summer (JJA). A quick transition to a weak La Niña refers to normalized Niño 3.4 index exceeding 0.5 in the preceding winter (DJF), and falling below 0 and exceeding −0.5 in the following summer (JJA). There are totally 490 successive El Niños, 289 strong La Niñas, and 194 weak La Niñas in these outputs.
In the PE summer of successive El Niños (Figure 7A), the NIO warming accompanied by the easterly wind anomaly is well stimulated while the WNP cooling is weaker than observed. The WNP AAC associated with subtropical, cold SST anomalies in the models, however, moves too far to the east compared with the observation, which locates at 150°E and 25°N.
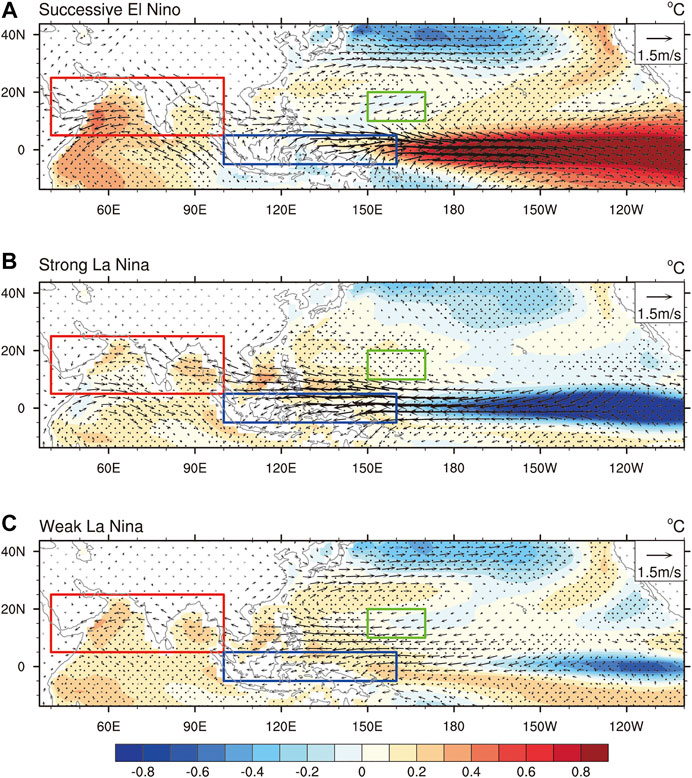
FIGURE 7. Similar to Figure 2, but for (A) 490 successive El Niños (B) 289 strong La Niñas, and (C) 194 weak La Niñas during 1901–2004 in the selected 38 CMIP5 models.
For the quick transition to a strong La Niña (Figure 7B), the strong easterly wind anomaly connected with the cooling of SST over middle-east Pacific is simulated, as well as NIO warming. While WNP AAC’s location is similar with that in the observations. Compared with the successive El Niño, the easterly wind anomalies also pull the AAC southward. For the quick transition to a weak La Niña (Figure 7C), the weak equatorial easterly wind anomaly and NIO warming are simulated. However, the SST cooling in the WNP is not significant. The WNP AAC also appears further to the east than in cluster 2.
The models can simulate different mechanisms associated with these three clusters (Figure 8). Consistent with observations, the models present stronger WNP cooling for successive El Niños and weak La Niñas than for strong La Niñas. Significant NIO warming is shown for all three clusters. The large equatorial easterly wind anomalies are also simulated for the quick transition.
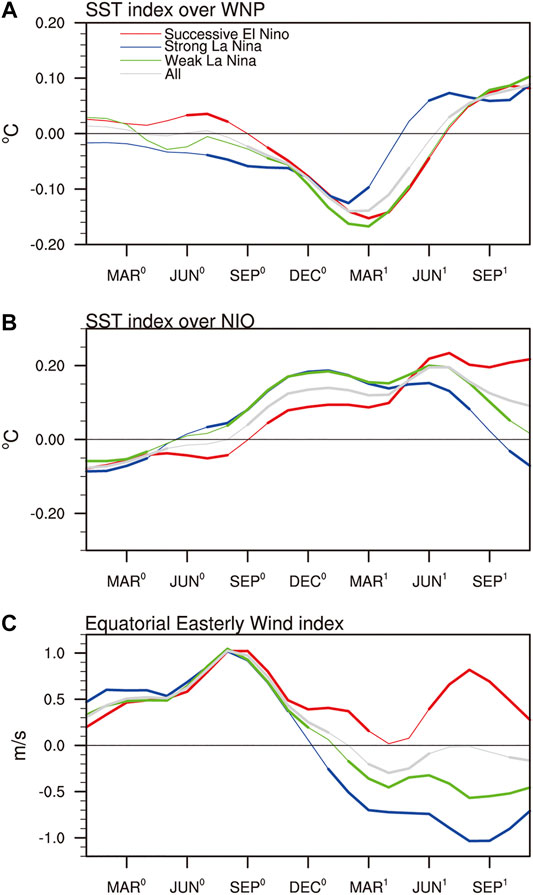
FIGURE 8. Same as Figure 5, except that the red, blue, green, and grey colors denote the composites of 490 successive El Niños, 289 strong La Niñas, 194 weak La Niñas, and all events in the CMIP5 models, respectively.
In conclusion, the CMIP5 models can well capture the observed characteristics in three clusters of El Niños, which correspond to three clusters of rainfall respectively, except that they simulate an AAC too much to the east, compared with the observations for the successive El Niño.
The study finds that East China summer rainfall changes can be divided into three types in PE summers, and that different mechanisms contribute to the diversity of the rainfall. Figure 1B indicates that cluster 1 is characterized by a tripolar pattern with distinct wet anomalies in the MLRYR, while dry anomalies in North and South China. Dry anomaly in the South and wet anomaly in the North are obvious for cluster 2, exhibiting a dipole pattern (Figure 1C). The rainfall pattern of cluster 3 is opposite to that of cluster 2 (Figure 1D).
The most important reason for these three different clusters of rainfall responses is the location of the WNP AAC. In cluster 1, the AAC locates at the Philippine Sea and South China Sea, transporting moisture to MLRYR (Figure 2A). In cluster 2, the AAC is pulled southward through the easterly wind anomalies in equatorial area, suppressing South China’s rainfall and enhancing the rainfall in the northern part (Figure 2B). As for cluster 3, the WNP AAC is farther eastward but its convergence center is located in Southeast China (Figure 2C).
Two underlying mechanisms are responsible for the maintenance of the WNP AAC in the three clusters. For cluster 1, it is related to the successive El Niño (Figures 2, 3), and the WNP cooling and the NIO warming form an AAC-SST feedback to support the WNP AAC (Figure 4). For cluster 2, it transfers to strong La Niña in the decaying summer (Figure 2, 3), and easterly anomalies caused by SST cooling in the middle-east Pacific collaborate with NIO warming to contribute to the WNP AAC (Figure 4). For cluster 3, which transfers to weak La Niña in the decaying summer (Figures 2, 3), the AAC-SST feedback interacts with the easterly feedback in equator to support the WNP AAC (Figure 4).
We also find that the AO has an influence on the rainfall responses. The AO is negative for cluster 1, guiding cold air to the south (Figure 5A), while the AO is positive in clusters 2 and 3, blocking the cold air in the polar region (Figure 5B,C). The heavy precipitation in the MLRYR is partly due to the southward cold air reaching there.
Furthermore, subseasonal rainfall migration is quite variable in the three clusters. In cluster 1, the positive rainfall anomalies are stable in the MLRYR (Figures 6D,E,F). In cluster 2, from June to August, the anomalous positive precipitation move toward north (Figures 6G,H,I). In cluster 3, as for June and July, the wet anomalies remain in South China, and in August, they move toward north (Figures 6J,K,L).
The observed circulation responses could be reproduced by CMIP5 models in terms of the three clusters, but they stimulate an AAC farther to the east, compared with the observations for successive El Niños (Figures 7, 8).
The original contributions presented in the study are included in the article/Supplementary Material, further inquiries can be directed to the corresponding author/s.
The idea and manuscript writing are done by WZ and FL. WZ and XZ are responsible for data analysis and manuscript writing. P-CH and FL came up with the study design and the manuscript review.
This work was supported by the Natural Science Foundation of China (41975107).
The authors declare that the research was conducted in the absence of any commercial or financial relationships that could be construed as a potential conflict of interest.
Chang, C.-P., Zhang, Y., and Li, T. (2000). Interannual and interdecadal variations of the East Asian summer monsoon and tropical Pacific SSTs. Part I: roles of the subtropical ridge. J. Clim. 13, 4310–4325. doi:10.1175/1520-0442(2000)013<4310:iaivot>2.0.co;2
Chen, L., Dong, M., and Shao, Y. (1992). The characteristics of interannual variations on the east asian monsoon. J. Meteorol. Soc. Jpn. 70, 397–421. doi:10.2151/jmsj1965.70.1b_397
Chen, W., Feng, J., and Wu, R. (2013). Roles of ENSO and PDO in the link of the East Asian winter monsoon to the following summer monsoon. J. Clim. 26, 622–635. doi:10.1175/jcli-d-12-00021.1
Chowdary, J. S., Xie, S.-P., Lee, J.-Y., Kosaka, Y., and Wang, B. (2010). Predictability of summer northwest Pacific climate in 11 coupled model hindcasts: local and remote forcing. J. Geophys. Res. 115, D22121. doi:10.1029/2010JD014595
Chowdary, J. S., Xie, S.-P., Luo, J.-J., Hafner, J., Behera, S., Masumoto, Y., et al. (2011). Predictability of Northwest Pacific climate during summer and the role of the tropical Indian Ocean. Clim. Dynam. 36, 607–621. doi:10.1007/s00382-009-0686-5
Ding, Y. H. (2004). Seasonal march of the East-Asian summer monsoon. in East Asian monsoon. Editor C. P. Chang (USA: World Scientific Series on Asia-Pacific Weather and Climate), 3–53
Ding, Y. H., and Chan, J. C. L. (2005). The East Asian summer monsoon: an overview. Meteorol. Atmos. Phys. 89, 117–142. doi:10.1007/s00703-005-0125-z
Du, Y., Xie, S.-P., Huang, G., and Hu, K. (2009). Role of air-sea interaction in the long persistence of El niño-induced north Indian ocean warming*. J. Clim. 22, 2023–2038. doi:10.1175/2008JCLI2590.1
Feng, J., Chen, W., Tam, C.-Y., and Zhou, W. (2011). Different impacts of El Niño and El Niño modoki on China rainfall in the decaying phases. Int. J. Climatol. 31, 2091–2101. doi:10.1002/joc.2217
Feng, J., Wang, L., and Chen, W. (2014). How does the east asian summer monsoon behave in the decaying phase of El Niño during different PDO phases?. J. Clim. 27, 2682–2698. doi:10.1175/JCLI-D-13-00015.1
Gao, S., Chen, Z., and Zhang, W. (2018). Impacts of tropical North Atlantic SST on western North Pacific landfalling tropical cyclones. J. Clim. 31, 853–862. doi:10.1175/jcli-d-17-0325.1
Gong, D.-Y., and Ho, C. H. (2003). Arctic oscillation signals in the East Asian summer monsoon. J. Geophys. Res. 108, 4066. doi:10.1029/2002JD002193
Gong, D.-Y., Wang, S.-W., and Zhu, J.-H. (2001). East Asian winter monsoon and Arctic oscillation. Geophys. Res. Lett. 28, 2073–2076. doi:10.1029/2000GL012311
Gong, D.-Y., Yang, J., Kim, S.-J., Gao, Y., Guo, D., Zhou, T., et al. (2011). Spring Arctic Oscillation-East Asian summer monsoon connection through circulation changes over the western North Pacific. Clim. Dynam. 37, 2199–2216. doi:10.1007/s00382-011-1041-1
Gong, D., Zhu, J. H., and Wang, S. W. (2002). Significant relationship between spring AO and the summer rainfall along the Yangtze River. Chin. Sci. Bull. 47, 948–952. doi:10.1360/csb2002-47-7-54610.1360/02tb9212 .(in Chinese)
Guan, W., Hu, H., Ren, X., and Yang, X. Q. (2019). Subseasonal zonal variability of the western Pacific subtropical high in summer: climate impacts and underlying mechanisms. Clim. Dynam. 53 (5-6), 3325–3344. doi:10.1007/s00382-019-04705-4
Harris, I., Jones, P. D., Osborn, T. J., and Lister, D. H. (2014). Updated high-resolution grids of monthly climatic observations - the CRU TS3.10 Dataset. Int. J. Climatol. 34, 623–642. doi:10.1002/joc.3711
Hu, K., Xie, S.-P., and Huang, G. (2017). Orographically anchored El Niño effect on summer rainfall in Central China. J. Clim. 30, 10037–10045. doi:10.1175/jcli-d-17-0312.1
Huang, G., Hu, K., and Xie, S.-P. (2010). Strengthening of tropical Indian ocean teleconnection to the Northwest Pacific since the mid-1970s: an atmospheric GCM study*. J. Clim. 23, 5294–5304. doi:10.1175/2010JCLI3577.1
Kalnay, E., Kanamitsu, M., Kistler, R., Collins, W., Deaven, D., au, L., et al. (1996). The NCEP/NCAR 40-year reanalysis Project. Bull. Am. Meteorol. Soc. 77, 437–471. doi:10.1175/1520-0477(1996)077<0437:TNYRP>2.0.CO;2
Kaufman, L., and Rousseeuw, P. J. (2009). Finding groups in data: an introduction to cluster Analysis. New York: Wiley
Kosaka, Y., Xie, S.-P., Lau, N.-C., and Vecchi, G. A. (2013). Origin of seasonal predictability for summer climate over the Northwestern Pacific. Proc. Natl. Acad. Sci. Unit. States Am. 110, 7574–7579. doi:10.1073/pnas.1215582110
Lee, S. K., DiNezio, P. N., Chung, E. S., Yeh, S. W., Wittenberg, A. T., and Wang, C. (2014). Spring persistence, transition, and resurgence of El Niño. Geophys. Res. Lett. 41, 8578–8585. doi:10.1002/2014gl062484
Li, Q. (2014). The evolution of east asian summer monsoon and Drought\Flood distribution on eastern China during the last 539yr. AMR (Adv. Magn. Reson.) 955-959, 3093–3097. doi:10.4028/www.scientific10.4028/www.scientific.net/amr.955-959.3093
Lin, H. (2009). Global extratropical response to diabatic heating variability of the Asian Summer Monsoon. J. Atmos. Sci. 66, 2697–2713. doi:10.1175/2009JAS3008.1
Lin, Z., and Lu, R. (2009). The ENSO's effect on eastern China rainfall in the following early summer. Adv. Atmos. Sci. 26, 333–342. doi:10.1007/s00376-009-0333-4
Liu, F., Ouyang, Y., Wang, B., Yang, J., Ling, J., and Hsu, P.-C. (2020). Seasonal evolution of the intraseasonal variability of China summer precipitation. Clim. Dynam. 54, 4641–4655. doi:10.1007/s00382-020-05251-0
Liu, F., and Wang, B. (2013). Mechanisms of global teleconnections associated with the asian summer monsoon: an intermediate model analysis*. J. Clim. 26, 1791–1806. doi:10.1175/jcli-d-12-00243.1
Liu, L., Zhou, T., Ning, L., Liu, J., Yan, M., Jin, C., et al. (2019). Linkage between the Arctic Oscillation and summer climate extreme events over the middle reaches of Yangtze River Valley. Clim. Res. 78, 237–247. doi:10.3354/cr01542
Liu, Q. Q. (2016). Study on characteristics of the western North Pacific tropical cyclone types and its potential impact evaluation. Tianjin, China: Tianjin University
Park, T.-W., Ho, C.-H., and Yang, S. (2011). Relationship between the arctic oscillation and cold surges over East Asia. J. Clim. 24, 68–83. doi:10.1175/2010JCLI3529.1
Rayner, N. A., Parker, D. E., Horton, E. B., Folland, C. K., AlexanderRowellKent, L. V. D. P. E. C., and Kaplan, A. (2003). Global analyses of sea surface temperature, sea ice, and night marine air temperature since the late nineteenth century. J. Geophys. Res. 108, 4407. doi:10.1029/2002JD002670
Sampe, T., and Xie, S.-P. (2010). Large-scale dynamics of the meiyu-baiu rainband: environmental forcing by the westerly jet*. J. Clim. 23, 113–134. doi:10.1175/2009jcli3128.1
Tao, S. Y., and Zhang, Q. Y. (1998). Response of asian winter and summer monsoon to ENSO events. (in Chinese). Chin. J. Atmos. Sci. 22, 399–407. doi:10.3878/j.issn.1006-9895.1998.04.02
Taylor, K. E., Ronald, J. S., and Meehl, G. A. (2012). An overview of CMIP5 and the experiment design. Bull. Am. Meteorol. Soc. 93, 14. doi:10.1175/BAMS-D-11-00094 .110.1175/bams-d-11-00094.1
Thompson, D. W. J., and Wallace, J. M. (1998). The Arctic Oscillation signature in the wintertime geopotential height and temperature fields. Geophys. Res. Lett. 25, 1297–1300. doi:10.1029/98GL00950
Wang, B., Li, J., and He, Q. (2017). Variable and robust East Asian monsoon rainfall response to El Niño over the past 60 years (1957-2016). Adv. Atmos. Sci. 34, 1235–1248. doi:10.1007/s00376-017-7016-3
Wang, B., Liu, J., Yang, J., Zhou, T., and Wu, Z. (2009). Distinct principal modes of early and late summer rainfall anomalies in East Asia*. J. Clim. 22, 3864–3875. doi:10.1175/2009JCLI2850.1
Wang, B., Xiang, B., and Lee, J.-Y. (2013). Subtropical high predictability establishes a promising way for monsoon and tropical storm predictions. Proc. Natl. Acad. Sci. Unit. States Am. 110, 2718. doi:10.1073/pnas.1214626110
Wang, H. J., Yang, Z. B., Yang, D. C., and Gong, X. C. (2007). Automatic quality control method and application of real-time data of automatic weather station (in Chinese). Meteorol. Mon. 33, 102–106. doi:10.3969/j.issn.1000-0526.2007.10.015
Wang, L., Hu, H., and Yang, X. (2019). The atmospheric responses to the intensity variability of subtropical front in the wintertime North Pacific. Clim. Dynam. 52 (9-10), 5623–5639. doi:10.1007/s00382-018-4468-9
Wang, B., Wu, R., and Fu, X. (2000). Pacific-East Asian teleconnection: how does ENSO affect East Asian climate?). pacific–East Asian teleconnection: how does ENSO affect East Asian climate?. J. Clim. 13, 1517–1536. doi:10.1175/1520-0442(2000)013<1517:PEATHD>2.0.CO;2
Wang, B., Wu, R., and Li, T. (2003). Atmosphere-warm ocean interaction and its impacts on asian-Australian monsoon variation*. J. Clim. 16, 1195–1211. doi:10.1175/1520-0442(2003)16<1195:AOIAII>2.0.CO;2
Wu, B. Y., Bian, L. G., and Zhang, R. H. (2004). Effects of the winter AO and the arctic sea ice variations on climate variations over East Asia. Chin. J. Polar Res. 16, 211–220. doi:10.1007/BF02873097
Xiang, B., Wang, B., Yu, W., and Xu, S. (2013). How can anomalous western North Pacific subtropical high intensify in late summer?. Geophys. Res. Lett. 40, 2349–2354. doi:10.1002/grl.50431
Xie, S.-P., Hu, K., Hafner, J., Tokinaga, H., Du, Y., Huang, G., et al. (2009). Indian ocean capacitor effect on indo-western pacific climate during the summer following El Niño. J. Clim. 22, 730–747. doi:10.1175/2008JCLI2544.1
Xie, S.-P., Kosaka, Y., Du, Y., Hu, K., Chowdary, J. S., and Huang, G. (2016). Indo-western Pacific ocean capacitor and coherent climate anomalies in post-ENSO summer: a review. Adv. Atmos. Sci. 33, 411–432. doi:10.1007/s00376-015-5192-6
Xing, W., Wang, B., and Yim, S.-Y. (2016). Peak-summer East Asian rainfall predictability and prediction part I: southeast Asia. Clim. Dynam. 47, 1–13. doi:10.1007/s00382-014-2385-0
Xing, W., Wang, B., Yim, S. Y., and Ha, K. J. (2017). Predictable patterns of the may-june rainfall anomaly over East Asia. J. Geophys. Res. Atmos. 122, 2203–2217. doi:10.1002/2016JD025856
Xue, F., and Liu, C. (2008). The influence of moderate ENSO on summer rainfall in eastern China and its comparison with strong ENSO. Chin. Sci. Bull. 53, 791–800. doi:10.1007/s11434-008-0002-5
Xue, F., Zeng, Q., Huang, R., Li, C., Lu, R., and Zhou, T. (2015). Recent advances in monsoon studies in China. Adv. Atmos. Sci. 32, 206–229. doi:10.1007/s00376-014-0015-8
Yang, S., and Lau, K. M. (2006). “Interannual variability of the Asian monsoon,” in The asian monsoon. Editor B. Wang (New York, USA: Springer), 259–293
Ye, H., and Lu, R. (2011). Subseasonal variation in ENSO-related East Asian rainfall anomalies during summer and its role in weakening the relationship between the ENSO and summer rainfall in eastern China since the late 1970s. J. Clim. 24, 2271–2284. doi:10.1175/2010jcli3747.1
Yuan, Y., and Yang, S. (2012). Impacts of different types of El Niño on the east asian climate: focus on ENSO cycles. J. Clim. 25, 7702–7722. doi:10.1175/jcli-d-11-00576.1
Zhang, R., Sumi, A., and Kimoto, M. (1999). A diagnostic study of the impact of El Niño on the precipitation in China. Adv. Atmos. Sci. 16, 229–241. doi:10.1007/BF02973084
Zhang, R., Sumi, A., and Kimoto, M. (1996). Impact of El Niño on the east asian monsoon. J. Meteorol. Soc. Jpn. 74, 49–62. doi:10.2151/jmsj1965.74.1_49
Zhang, Z., Zhang, J. X., and Xue, H. F. (2008). Improved K-means clustering algorithm. Congress on Image and Signal Processing 5, 169–172
Keywords: summer rainfall, post-El niño, western north pacific, anomalous anticyclone, anomalous anticyclone-sea surface temperature feedback, equatorial easterly
Citation: Zhang W, Zhou X, Hsu P-C and Liu F (2020) Diversity of East China Summer Rainfall Change in Post-El Niño Summers. Front. Earth Sci. 8:595548. doi: 10.3389/feart.2020.595548
Received: 17 August 2020; Accepted: 11 November 2020;
Published: 11 December 2020.
Edited by:
Lin Wang, Institute of Atmospheric Physics (CAS), ChinaReviewed by:
Ashok Kumar Jaswal, India Meteorological Department, IndiaCopyright © Liu. This is an open-access article distributed under the terms of the Creative Commons Attribution License (CC BY). The use, distribution or reproduction in other forums is permitted, provided the original author(s) and the copyright owner(s) are credited and that the original publication in this journal is cited, in accordance with accepted academic practice. No use, distribution or reproduction is permitted which does not comply with these terms.
*Correspondence: Fei Liu, bGl1ZmVpMjZAbWFpbC5zeXN1LmVkdS5jbg==
Disclaimer: All claims expressed in this article are solely those of the authors and do not necessarily represent those of their affiliated organizations, or those of the publisher, the editors and the reviewers. Any product that may be evaluated in this article or claim that may be made by its manufacturer is not guaranteed or endorsed by the publisher.
Research integrity at Frontiers
Learn more about the work of our research integrity team to safeguard the quality of each article we publish.