
95% of researchers rate our articles as excellent or good
Learn more about the work of our research integrity team to safeguard the quality of each article we publish.
Find out more
ORIGINAL RESEARCH article
Front. Earth Sci. , 22 December 2020
Sec. Volcanology
Volume 8 - 2020 | https://doi.org/10.3389/feart.2020.590411
This article is part of the Research Topic Basaltic Volcanism: From Magmatic Processes to Eruptive Styles View all 9 articles
 Charline Lormand1*†
 Andrew J. L. Harris1
 Magdalena Oryaëlle Chevrel1
 Sonia Calvari2
 Lucia Gurioli1
 Massimiliano Favalli3
 Alessandro Fornaciai3
 Luca Nannipieri3
Low elevation flank eruptions represent highly hazardous events due to their location near, or in, communities. Their potentially high effusion rates can feed fast moving lava flows that enter populated areas with little time for warning or evacuation, as was the case at Nyiragongo in 1977. The January–March 1974 eruption on the western flank of Mount Etna, Italy, was a low elevation effusive event, but with low effusion rates. It consisted of two eruptive phases, separated by 23 days of quiescence, and produced two lava flow fields. We describe the different properties of the two lava flow fields through structural and morphological analyses using UAV-based photogrammetry, plus textural and rheological analyses of samples. Phase I produced lower density (∼2,210 kg m−3) and crystallinity (∼37%) lavas at higher eruption temperatures (∼1,080°C), forming thinner (2–3 m) flow units with less-well-developed channels than Phase II. Although Phase II involved an identical source magma, it had higher densities (∼2,425 kg m−3) and crystallinities (∼40%), and lower eruption temperatures (∼1,030°C), forming thicker (5 m) flow units with well-formed channels. These contrasting properties were associated with distinct rheologies, Phase I lavas having lower viscosities (∼103 Pa s) than Phase II (∼105 Pa s). Effusion rates were higher during Phase I (≥5 m3/s), but the episodic, short-lived nature of each lava flow emplacement event meant that flows were volume-limited and short (≤1.5 km). Phase II effusion rates were lower (≤4 m3/s), but sustained effusion led to flow units that could still extend 1.3 km, although volume limits resulted from levee failure and flow avulsion to form new channels high in the lava flow system. We present a petrologically-based model whereby a similar magma fed both phases, but slower ascent during Phase II may have led to greater degrees of degassing resulting in higher cooling-induced densities and crystallinities, as well as lower temperatures. We thus define a low effusion rate end-member scenario for low elevation effusive events, revealing that such events are not necessarily of high effusion rate and velocity, as in the catastrophic event scenarios of Etna 1669 or Kilauea 2018.
Generally, hazard and risk associated with effusive events are deemed low (Blong 1984). This is mostly because the threat of invasion by lava flow has a local effect impacting zones typically a few kilometers across. However, for those communities affected it is a very real impact that can result in total destruction of land and property, plus population displacement and even fatalities (e.g., Branca et al., 2017; Chester et al., 1999; Harris, 2015; Komorowski and Tedesco, 2004; Tedesco et al., 2007; Richter et al., 2016), while also requiring costly mitigation efforts (e.g., Barberi et al., 1993; Barberi et al., 2003; Colombrita, 1984; Macdonald, 1958, Macdonald, 1962) and influencing city design and planning (e.g., Bonaccorso et al., 2015; Donato et al., 2009; Pagnano, 1992; Solana et al., 2017). The problem is enhanced with reduced vent altitude that places the source closer to, and even inside, communities at risk (Harris, 2015). Between 1977 and 2019, the risk associated with low flank effusive eruptions has been illustrated by one such event occurring approximately once every five-to-ten years (Table 1), the most recent (at the time of writing) occurring on Kilauea in 2018 (Neal et al., 2019). Thus, understanding the eruption and lava flow emplacement dynamics during low flank eruptions is instructive for assessment of likely event scenarios for hazard and risk assessments.
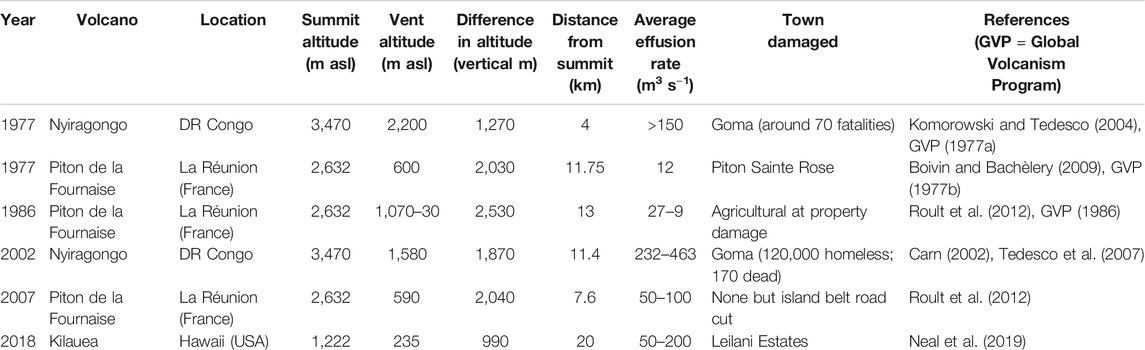
TABLE 1. Damage-causing low flank effusive eruptions between 1977 and 2020. All summit altitudes are from the GVP (Global Volcanism Program 2013), distances from summit are from Google Earth.
Low flank eruptions (i.e., effusive vents opening nearer to the base of the edifice than to the summit) are often associated with high effusion rate events that feed fast moving lava flows which can form extensive and voluminous lava flow fields. Six type-cases have become Etna’s 1669 eruption (Crisci et al., 2003; Branca et al., 2013), the ca. 1800 A.D. eruption of Hualalai (Guest et al., 1995; Kauahikaua et al., 2002), Nyiragongo’s 1977 and 2002 eruptions (Tazieff, 1977; Tedesco et al., 2007), the 2007 eruption of Piton de la Fournaise (Staudacher et al., 2009) and the 2018 eruption of Kilauea (Neal et al., 2019). In the case of the 2007 eruption of Piton de la Fournaise, around 200 × 106 m3 of lava was erupted at effusion rates of up to 200 m3/s (Staudacher et al., 2009; Bachèlery et al., 2010; Roult et al., 2012). For Etna’s 1669 lava flow field the volume was 607 ± 105 × 106 m3 with a peak effusion rate of ∼640 m3/s (Branca et al., 2013), and Kilauea’s 2018 low flank lava flows were fed at effusion rates of up to 50–200 m3/s (Neal et al., 2019). These low flank eruptions were associated with the emission of low viscosity lava capable of moving at high velocities. In the case of Nyiragongo’s 1977 lava flows, velocities may have been as high as 30 km/h (Tazieff, 1977). In terms of viscosities, for the Piton de la Fournaise 2007 eruption lavas were of the order of 102–103 Pa s with flow moving at 2–3 m/s even in small (∼1 m deep and 2–6 m wide) channels (Rhéty et al., 2017). For Nyiragongo’s 2004 eruption, lava viscosity was of the order of 101.3–102.4 Pa s (∼1,220–1,170°C) in order to reach velocities of 10 m/s on a 5° slope (Morisson et al., 2020). The lava of Hualalai’s ca. 1800 eruption had viscosities as low as 50–60 Pa s, channel velocities of up to 9–12 m/s (near the vent) and effusion rates of 100–200 m3/s (Kauahikaua et al., 2002). These characteristics can be considered fundamental source conditions in determining how far and how quickly a flow will extend, favoring rapid emplacement of long lava flows (cf. Harris and Rowland, 2001; Harris and Rowland, 2009). These source conditions, when coupled with the low flank location of the vent, make such events an extreme hazard because lava can arrive rapidly in populated areas to cause extensive damage (e.g., Guest et al., 1995; Tedesco et al., 2007; Azzaro and Castelli, 2013; Harris, 2015). However, the January–March 1974 low flank eruption of Mt. Etna (Guest et al., 1974; Tazieff, 1974; Bottari et al., 1975; Tanguy and Kieffer, 1976; Corsaro et al., 2009) seems to have been an outlier to this typology, representing a low-effusion rate, low-volume, high-viscosity, and low-velocity end-member. By linking magma properties (density and crystallinity), through rheology, to eruptive style we provide a link between magma storage and ascent conditions (as defined by Corsaro et al., 2009) and the superficial manifestation of a lowflank effusive event in terms of lava flow emplacement dynamics and style, as well as flow unit and field dimensions and morphology.
Mt. Etna is a frequently erupting stratovolcano characterized by a NE widespread flank instability (e.g. Tibaldi and Groppelli, 2002; Solaro et al., 2010) which has been associated with regular flank eruptions mostly located on or near the NE and S rift zones (Neri et al., 2011). Instead, the January–March 1974 flank eruption occurred on the western rift and at a relatively low elevation (at 1,660 m above sea level, asl: 493400 m E; 4177400 m N; WGS84 UTM33 projection) on the west flank. Given the location and altitude (3,350 m asl) of Etna’s summit craters, this is a location approximately 6 km WSW of, and 1700 m in elevation below, the summit (Figure 1A). The eruption was characterized by two phases that produced two cinder cones and two lava flow fields during which around 3.6 × 10⁶ m3 of dense rock equivalent (DRE) were erupted (Corsaro et al., 2009). The first phase involved ten discrete episodes of violent Strombolian activity and effusion (Figure 1A), during which lava was emplaced at effusion rates of up to 6 m3/s (Guest et al., 1974). Lava flows were described as “sluggish” with estimated viscosities of 104–105 Pa s (Tanguy and Kieffer, 1976), and flow fronts generally advanced at just a few meters per hour (Guest et al., 1974). In the second phase, the source of activity shifted 300 m to the west (Figure 1A) to feed a second cinder cone and lava flows that extended no more than 1.3 km from the vent (Bottari et al., 1975).
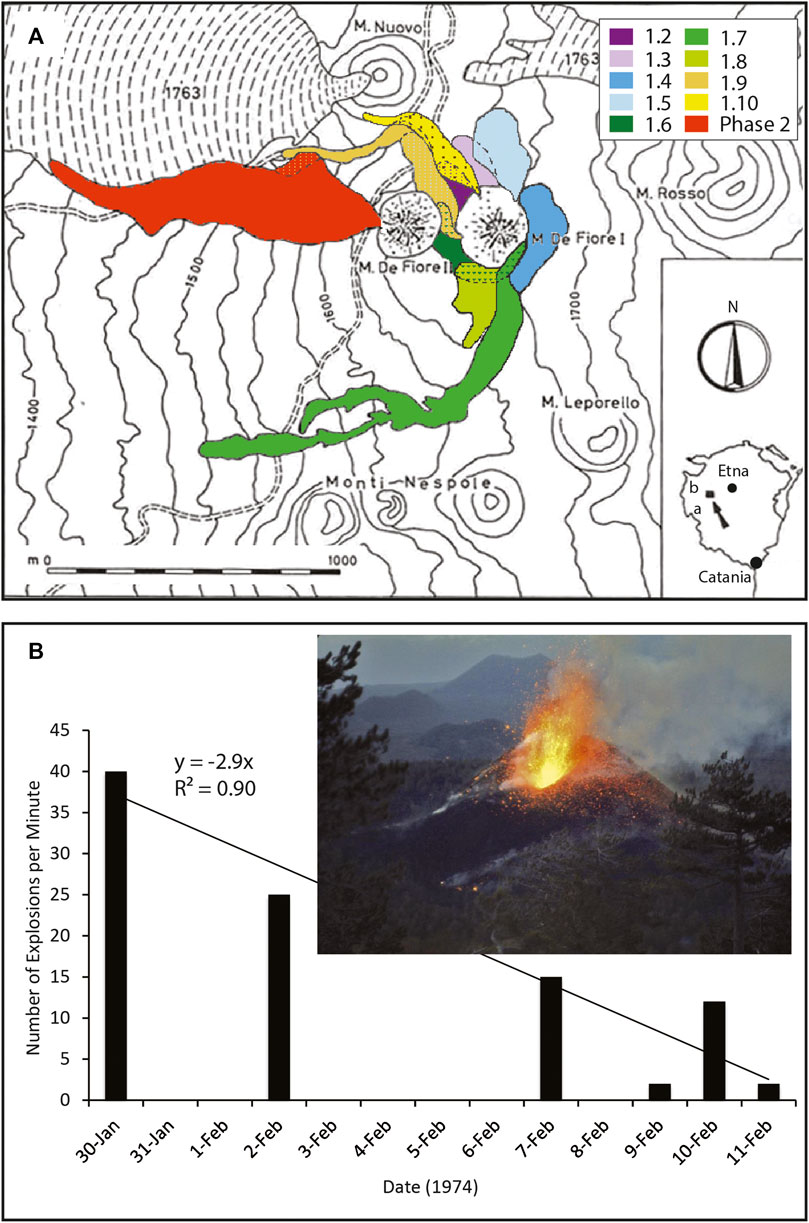
FIGURE 1. (A) Original flow field map of the January–March 1974 west flank eruption at Mount Etna with the cones built during phases I and II (labeled M. de Fiore I and II, respectively), as modified from Bottari et al. (1975). Eight of the ten lava flow units from Phase I are given as colored following the new mapping given here to allow comparison. One lava flow unit (i.e. 1.1 represented by brown dots) was buried by subsequent lava flow, and so is not mapped by Bottari et al. (1975). The dark blue unit (1.4) of the Bottari et al. (1975) map is the deposit from a collapse of the west flank of M. de Fiore I that buried lava unit 4. According to the map of Guest et al. (1974), these were “two short, thick, viscous flows (that) erupted from boccas on the eastern side of the cone”. The lava flow field from M. de Fiore II is in red. On the inset, the letters “a” and “b” mark the approximate locations of the towns of Adrano and Bronte, respectively. The edge and the parts of buried lava flows are represented respectively by dots and dashed lines of the color associated with each unit. (B) Explosion frequency during Phase I from data in Guest et al. (1974). Inset is a color version of the black and white photo of activity at M. de Fiore I given in Tanguy and Kieffer (1976). The photo was taken on the evening of February 3, 1974, and view is north toward M. Nuovo which is silhouetted on the skyline in the background. The eruptive cone is 70 m high, and the height reached by incandescent bombs in this explosive event captured by Tanguy and Kieffer (1976) is also 70 m.
The January–March 1974 event on Mt. Etna therefore represents a low flank eruption characterized by relatively low effusion rate emission of a small volume of lava, and emplacement of short, slow moving lava flows of, for a basaltic system, high viscosity (Guest et al., 1974; Tazieff, 1974; Bottari et al., 1975; Tanguy and Kieffer, 1976; Corsaro et al., 2009). It consequently differs in all respects to most events associated with low flank effusive eruptions (cf. Table 1). Our aim is thus first to describe the morphology and dimensions of the lava flow units emplaced in each of the two phases of this eruption, providing detailed geological and structural maps of the lava flow fields emplaced by Phases I and II, as well as to provide a volumetric inventory of each lava flow emplacement event. We then characterize the chemistry and texture of the lava flows of both phases to place order-of-magnitude constraint on the lava rheology. Finally, we use the analysis to 1) assess the lava flow dynamics and emplacement conditions associated with each phase, and 2) provide an eruption chronology for the 14 lava-flow-unit-emplacing events that characterized this low flank eruption.
Effusive activity associated with the first phase of the January-March 1974 eruption was well documented by Guest et al. (1974). Corsaro et al. (2009) then thoroughly defined the eruption in terms of chemistry and petrology and explored the erupted products in terms of the magmatic system that fed the eruption. Corsaro et al. (2009) also reviewed the precursory activity focusing on the seismic events as reported in Bottari et al. (1975) and Guerra et al. (1976). In terms of eruption settings at Etna, Corsaro et al. (2009) defined the event as a “deep dike-fed” eruption, as opposed to “the more common central conduit-fed flank eruptions” that feed Etna’s effusive activity. Indeed, unlike Etna’s common behavior where most flank eruptions at Mt. Etna result from the lateral propagation of dikes radiating from the summit conduit (Acocella and Neri, 2003), this eruption was fed by a vertically propagating dike, independent of the summit conduit (Corsaro et al., 2009). Over the last 120 years, this unusual behavior has occurred only in 1974 (the studied eruption) and in 2001, where the 2001 dike also fed the 2002–2003 eruption (Neri et al., 2005).
Favalli et al. (2018) used visible images of the January–March 1974 lava flow field and cone system, obtained during overflights by an unmanned aerial vehicle (UAV), to show how structure from motion (SfM) photogrammetry could be used to generate high spatial resolution digital elevation models (DEM) and orthomosaics for a lava flow field. Favalli et al. (2018) used these data to demonstrate how various products could be derived and used to assess lava surface properties, comparing with parameters derived from lower spatial resolution LiDAR DEMs to show the increase in detail and precision made possible by using the SfM-driven approach. We here use the same DEM and orthomosaics to provide detailed geological and structural maps. These maps, when coupled with chemical and textural analyses of 29 samples collected across the lava flow field, allow us to fully characterize the lava flow units associated with the January–March 1974 eruption. Our analysis thus builds on the studies of Guest et al. (1974), Corsaro et al. (2009) and Favalli et al. (2018) to define a second end-member event-type for low flank effusive eruptions, defining and describing this eruption-type in terms of lava morphology, dimensions, texture, chemistry, rheology, flow dynamics and emplacement history.
Skylab images acquired over Etna in September 1973 revealed that, five months prior to the eruption, vegetation in the area of the vent-site experienced reduced near-infrared (0.8–0.9 µm) reflectivity (De Carolis et al., 1975). This effect was interpreted by De Carolis et al. (1975) as being the result of vegetation stress due to CO2 soil degassing. Other precursory activity included summit inflation beginning three months before the eruption (Wadge et al., 1975; Wadge 1976). Then, ten days before the eruption, a seismic crisis was registered on Etna’s western flank (Guerra et al., 1976), with earthquakes being felt in the towns of Adrano and Bronte (Figure 1).
The first phase of the eruption began on January 30, 1974 and lasted for 17 days (Bottari et al., 1975). During this Phase I, ten lava flow units were emplaced through a series of explosive episodes (Figure 1A), with “violent Strombolian” activity building the Mount De Fiore I (MDF I) cone (Guest et al., 1974). Mount De Fiore I – also called “Mt. Rapido” (“rapido” being “fast”, “quick” or “rapid” in English and applied by locals due to its rapid growth)—was built during Phase I to reach a height of 70 m and a width of 50 m in a few days (Tazieff 1974; Corsaro et al., 2009). According to Tazieff (1974), each explosive episode opened with lava fountaining that fed ejections of pyroclasts up to 400 m above the vent before transitioning to violent Strombolian activity at a rate of 30–50 explosions per minute and ejecting scoria up to 500 m above the rim and sending bombs of several tons to horizontal distances of 100 m (Figure 1B). Most of the lava flows were oriented towards the northwest although the longest flow, that reached 1.5 km in length, moved towards the south before turning westward following the slope. Activity of Phase I ended during 16–17 February.
Nine days after the end of Phase I, on 25 February, a second seismic crisis occurred. This crisis was less intense than the first but had similar hypocenter depths (maximum of 29 km bsl, Bottari et al., 1975). A second eruptive phase then began on 11 March (Tazieff 1974; Tanguy and Kieffer 1976). This second phase lasted 18 days and built a second cinder cone, Mount De Fiore II (MDF II) which reached a height of around 20 m (Figure 1A). Phase II consisted of a single episode of Strombolian and effusive activity, characterized by the formation of several channel-fed lava flows. Phase II, and the eruption itself, ended on 29 March. Activity was less well described at the time due to poor weather conditions involving strong winds, low temperatures and blizzards (Guest et al., 1974; Bottari et al., 1975; Tanguy and Kieffer 1976).
A decrease in the number of explosive events per minute was recorded at the eruption site during Phase I (Figure 1B). Activity was then reported as changing from “fountaining”/ “violent Strombolian” to “Strombolian” between Phases I and II (Guest et al., 1974; Tazieff 1974; Tanguy and Kieffer 1976). During Phase II, explosion frequencies also decreased with time, from 80 per minute on 11 March to 50 per minute by 13 March, and emission heights decreased from 500–600 m initially, to 100–250 m by 23 March (Bottari et al., 1975; Corsaro et al., 2009). Activity within the summit craters during Phase I was characterized by continuous ash emissions, but during Phase II incandescent scoria was ejected and fractures developed across the summit zone (Tanguy and Kieffer 1976). A sudden drop of the magma column in the summit conduit was then observed at the end of the eruption (Bottari et al., 1975).
Compositionally, the lavas erupted during the 1974 flank eruption were trachybasalts and were nearly aphyric (1–3 vol% phenocrysts). This is in contrast to lavas commonly erupted at Etna which are typically highly porphyritic (30–40 vol% phenocrysts), and even contrasted with bombs and lava flows erupted contemporaneously from the summit crater (Corsaro et al., 2009). Although the two eruptive phases were separated by 22 days of quiescence (Bottari et al., 1975), Corsaro et al. (2009) inferred that both were fed by the same magma source which resulted from mixing of a preexisting K-poor magma responsible of past eruptions (e.g., the 1763 eruption of La Montagnola) and a new more primitive magma. The petrochemical and volatile analysis of Corsaro et al. (2009) showed that the eruption was likely triggered by “deep tectonic fracturing” with the vertical propagation of a dike from a depth of ≥11 km to the surface, and bypassing the central conduits. Within this model, “relatively fast, closed-system decompression of the volatile-rich magma” fed Phase I, whereas a “more viscous magma” created by “gas-melt separation” in the upper portion of the dike fed Phase II. A petrological study using high resolution chemical maps of clinopyroxene crystals and more specifically the dominance of Cr-rich zones occurring at the rims, revealed that the trigger of this eruption was linked to the new arrival of a mafic magma (Ubide et al., 2019), which marked a turning point in the volcanic activity at Mt. Etna.
Corsaro et al. (2009) also stressed the relatively “violent” explosive nature of such “eccentric” eruptions on Mt. Etna (cf. 2001 and 2002–03, Andronico and Lodato, 2005; Acocella and Neri, 2003), and examined the precursors to such events—as briefly reviewed above. Supported by observations of the lava flow emplacement published in Guest et al. (1974), we here focus on the effusive aspect of the 1974 event, and on the style and dynamics of lava flow emplacement during such a low flank eruption.
During May 2015, eleven UAV over-flights of the 1974 flow field allowed acquisition of overlapping images covering a total area of 1.35 km2. The UAV was equipped with a Sony NEX-5T which provides 4,912 × 3,264 pixel images. This allowed generation of a 20-cm spatial resolution DEM and a 3-cm orthomosaic as described in Favalli et al. (2018). We here use the DEM (Supplementary Figure 1) and orthomosaic of Favalli et al. (2018) to generate flow field geological (Figure 2) and structural (Figure 3) maps for all exposed units, as well as to estimate unit length, thickness, width, area, and volume (Table 2). Cross-unit profiles were obtained by slicing the DEM down to a datum defined by projecting surrounding surfaces beneath the flow field itself (as inset in Figure 3), and used to define the dimensions, areas and volumes of Table 2 following the methodology of Mazzarini et al. (2005). Since no DEM prior to the eruption was available, the volumes were estimated using the area and the average thickness determined using the base of the flow as baseline. Mapping was aided by comparison with maps and chronologies of Guest et al. (1974), Bottari et al. (1975) and Corsaro et al. (2009), as well as by observations made during field surveys carried out simultaneous with the UAV survey.
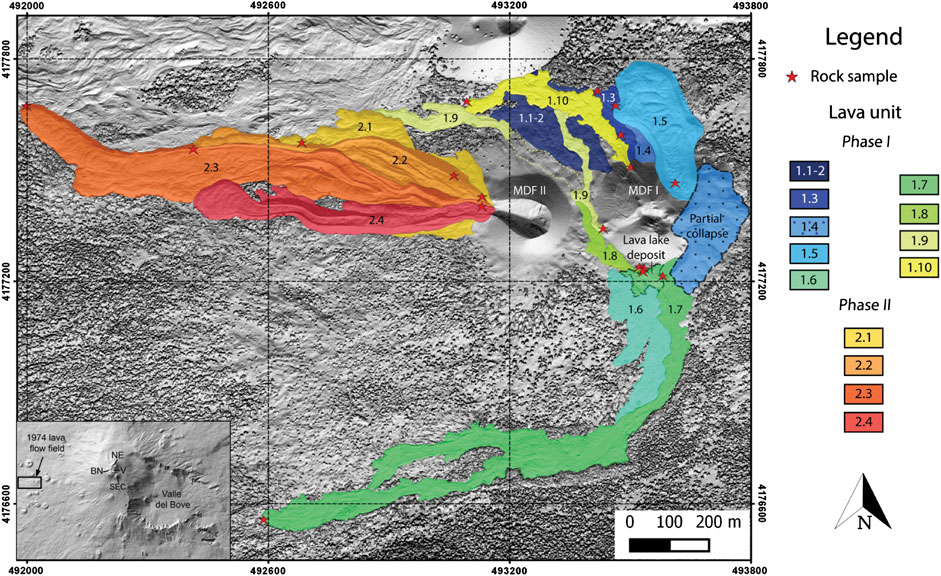
FIGURE 2. Geological map of the January–March 1974 west flank eruption of Mount Etna overlain on the DEM (as shaded relief) of Favalli et al. (2018), with locations (red stars) of the 19 samples that were used for further analysis. Lava flow units are numbered in chronological order (see Table 2 for dates of emplacement of each unit). Inset locates the area of the magnification on the Etna DEM (as shaded relief) of Favalli et al. (2009b). On the inset the four summit craters are marked: NE Crater (NE), Bocca Nuova (BN), La Voragine (V) and South East Crater (SEC).
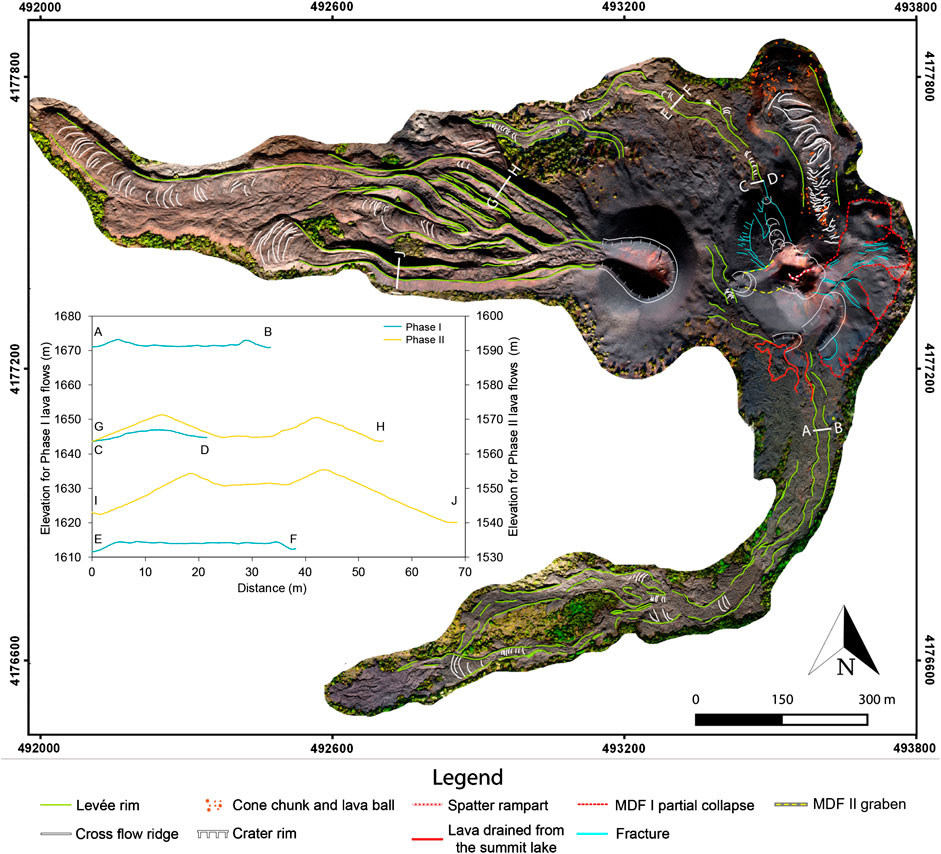
FIGURE 3. Structural map of the January–March 1974 west flank eruption of Mount Etna overlain on the orthophoto of Favalli et al. (2018). Inset represents cross-unit profiles, taken perpendicular to flow direction, to show the overall shape of lava units associated with each phase: Profiles A-B (Unit 1.7), C-D (Unit 1.10, at vent) and E-F (Unit 1.10, medial) are for Phase I, and G-H (Unit 2.2) and I-J (Unit 2.4) are for Phase II.
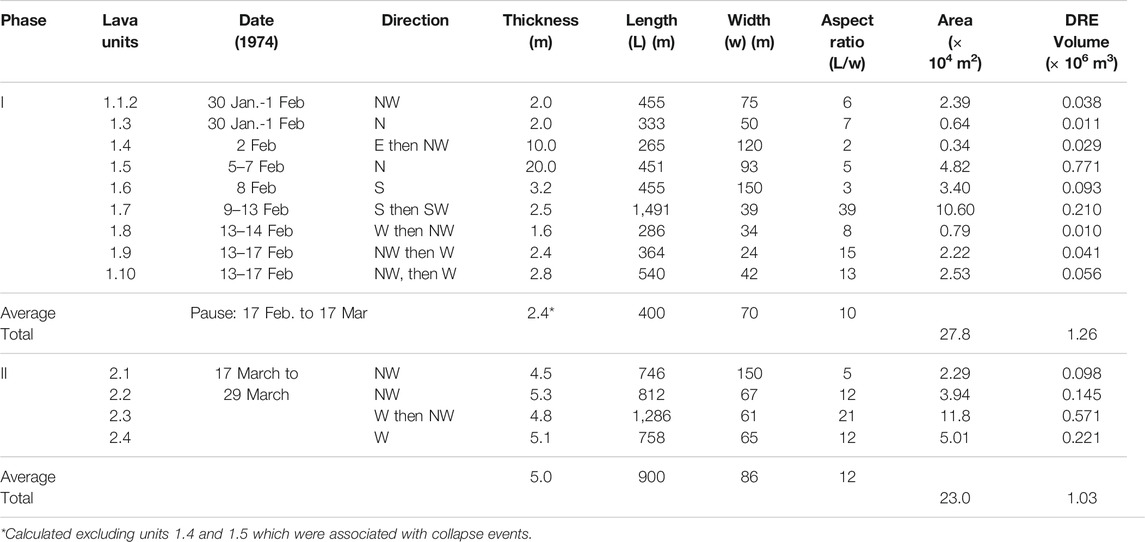
TABLE 2. Dimensions, areas, and volumes of each unit obtained from the DEM. Dates assigned to emplacement of each unit are following the chronology given in Guest et al. (1974). DRE volume is obtained by multiplying the bulk volume by the one minus the vesicularity obtained for each unit.
During the field survey, 29 samples were collected for all exposed lava and cone units (Supplementary Figure 1; Supplementary Table). Twenty-two lava samples were collected: sixteen from the Phase I flow field, and six from the Phase II flow field. Our main objective was to characterize the at-vent (source) character of the lava for each unit/phase to determine whether any textural or chemical differences between the two phases were coherent across all units. Due to potential textural heterogeneity with distance and depth (e.g., Wilmoth and Walker, 1993; Cashman et al., 1999; Riker et al., 2009; Robert et al., 2014), we also needed to compare like with like (i.e., vent samples with vent samples, surface with surface, interior with interior, front with front, etc.). Our sampling strategy was thus designed accordingly, with a focus on sampling of near (or at) vent lava and lava flow fronts (Figure 2; Supplementary Figure 1; Supplementary Table).
Sampling followed the strategy of Riker et al. (2009), where glassy, air-quenched samples (generally associated with channel overflows) were collected. This is not too difficult for pahoehoe, but more problematic with 'a'a lava flow type which lacks coherent, glassy surfaces (cf. Robert et al., 2014). We attempted to sample all exposed Phase I units, focusing on near-vent accreted levees and squeeze-outs of toothpaste lava; however, units 1, 2, 4 and 6 could not be sampled, either because they were buried, or no suitable sample was available for collection. Due to problems of oxidation and alteration, only 15 of these 22 lava samples could be used for further analysis (Supplementary Table). In addition, seven bomb and scoria samples were collected: three associated with the MDF I cone, and four associated with the MDF II cone. Of these, two samples were selected (one scoria and one bomb sample) for each cone, respectively (Supplementary Table).
Textural analyses were completed for density, vesicularity and crystallinity following the methodologies of Houghton and Wilson (1989) and Robert et al. (2014). First, one sample from each phase (Supplementary Table) was powdered and used to obtain the DRE density using the Accupyc 1,340 Helium Pycnometer of the textural laboratory at the Laboratory Magmas et Volcans (LMV, Université Clermont Auvergne, Aubière, France). A value of 2,970 kg/m3 was obtained for both samples. This value was then used to obtain the vesicularity of 19 samples following the Archimedes-based method of Houghton and Wilson (1989). Results are given in Table 3.
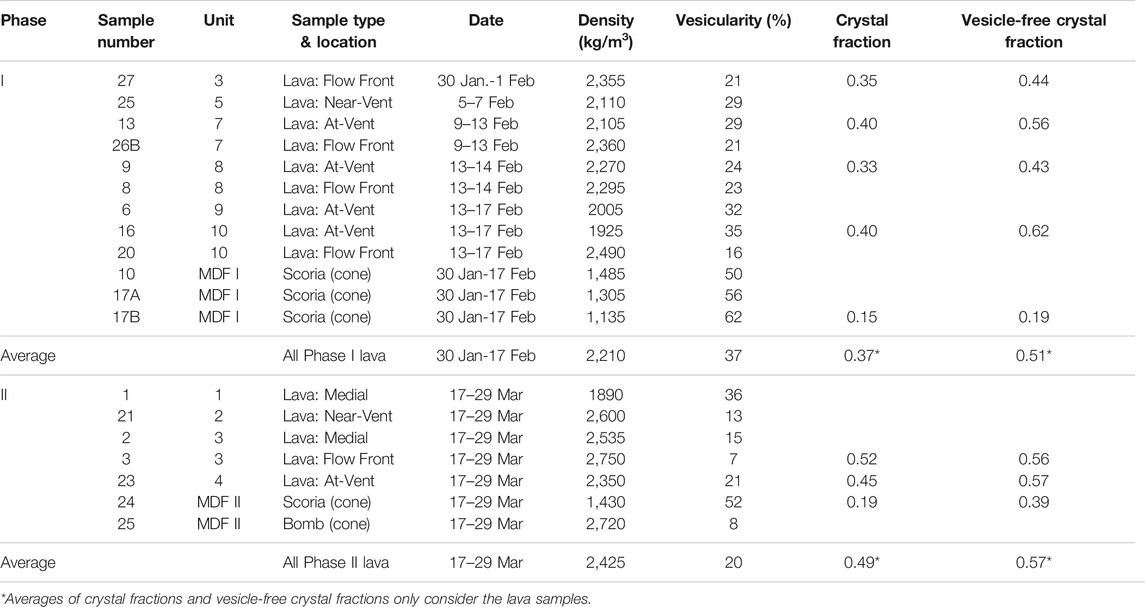
TABLE 3. Densities, vesicularities and crystallinities by phase and unit. Dates assigned to emplacement of each unit are following the chronology given in Guest et al. (1974).
Next, thin sections were prepared for 13 samples (eight for Phase I, and five for Phase II; Supplementary Table) and gray scale images (separating vesicles, crystals and glass) were prepared. For each of the 13 samples, we used a scanned image of the rock section and a scanned image of the thin section (both at 1,200 ×1,200 dpi), plus six Back Scattered Electron (BSE) images, with magnifications of ×25 and ×100 (acquired with the Scanning Electron Microscope Jeol JSM-5910 LV, at 15 keV with a 10 nA beam current). Two dimensional crystal content (>30 µm) were obtained for six lava samples (at-vent and at lava flow front) and two scoriae from each phase (Table 3, Supplementary Table).
Crystal size distributions of plagioclases and Fe-Ti oxides were also performed on scoriae from both phases to compare the crystallization kinetics between the two phases (e.g., Higgins, 1999; Higgins, 2000; Higgins and Roberge, 2007). Microphenocrysts of plagioclase and Fe-Ti oxides were manually outlined from ten BSE images for each scoria. Subsequently, the crystal measurements including area, 2D aspect ratio, major and minor ellipses were retrieved from the digitized binary images imported into ImageJ. CSDSlice (Morgan and Jerram (2006)) was used to estimate the 3D crystal aspect ratios of the population which returned 1:5:9 (R2 = 0.82) and 1:5:10 (R2 = 0.94) for the plagioclases of Phase I and Phase II, respectively, and 1:1.2:1.6 (R2 = 0.81) and 1:1.2:1.9 (R2 = 0.88) for the oxides of Phase I and Phase II, respectively. Each population consisted of more than 300 crystals as recommended by Morgan and Jerram (2006). Finally, the conversion of the apparent crystal dimensions to 3D crystal shapes was performed using the software CSDCorrections (version 1.6; Higgins, 2000) which integrates corrections of the intersection probability effect and the cut-section effect (e.g., Higgins, 1999; Brugger and Hammer, 2010). The thin sections contained no perceptible fabric and, based on a visual inspection of the samples, a roundness factor of 0.1 was selected for all samples.
Major element analysis was carried on six samples (two from Phase I, and four from Phase II; Supplementary Table) using Inductively Coupled Plasma Atomic Emission Spectroscopy (ICP-AES) on the Jobin Yvon Ultima-C spectrometer of LMV. Our results are given, along with those of Corsaro et al. (2009), in Table 4. We also report the glass chemistry measured by Corsaro et al. (2009) for four samples: two from Phase I and two from Phase II in Table 5.
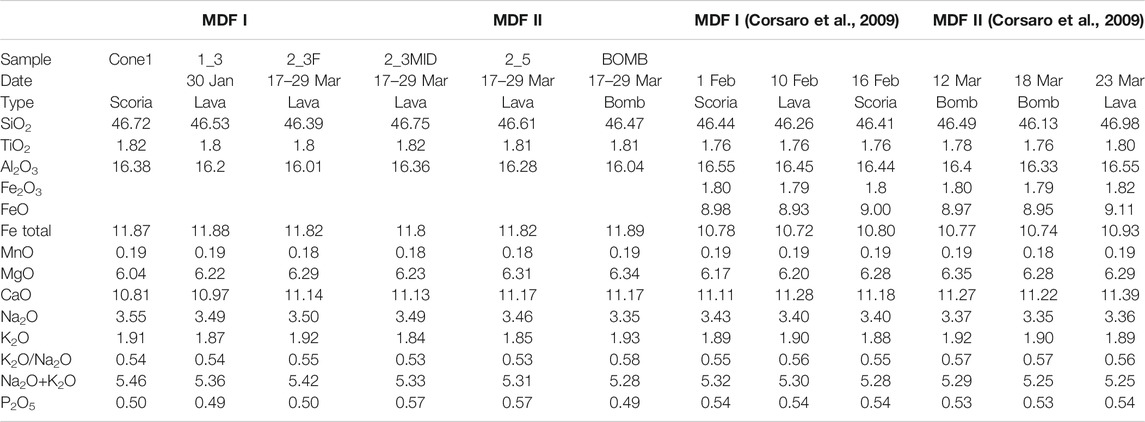
TABLE 4. Bulk rock compositions obtained in this study and by Corsaro et al. (2009).

TABLE 5. Glass chemistry, eruption temperatures and derivation of viscosity for Phase I and II samples.
To provide order of magnitude estimates on the rheological differences between the two phases, we estimated the viscosity of the lava using a petrographic and empirical model-based approach. To employ such approach, we considered the petrographic and geochemical characteristics of the pyroclast samples rather than the samples collected for the lava flows, ensuring that the effect of post-emplacement crystallization did not influence the result. The viscosity of the lava (ηlava) is the product of the interstitial melt viscosity (ηmelt) multiplied by the relative effect of suspended crystals (
The interstitial melt viscosity was calculated following Giordano et al. (2008) using the chemical composition of the glassy matrices for two scoria samples from Phase I and for a bomb and a lava flow sample from Phase II (Table 5). The amount of dissolved water (% H2O) was set following Harris and Allen (2008), assuming Phase I to be a typical flank eruption at Etna with water content of 0.4 wt%, and Phase II being typical of a degassed summit eruption (H2O ∼0.1 wt%). The temperature was obtained following Corsaro et al. (2009) by applying the geothermometer of Pompilio et al. (1998) to the MgO content (%) of glass to obtain eruption temperature, i.e., T (°C) = 989.73 + 29.623 × MgO (wt%).
The effect of crystals on viscosity (
where
Finally, the relative effect of bubbles was calculated following Llewellin and Manga (2005) by considering bubbles as rigid spheres (high capillary number):
or deformable (low bubble capillary number):
To calculate the lava yield strength (
The average viscosity and yield strength values were then used to extract the mean velocity (
with the at-source channel depth (h), and slope (
Finally, we used vmeanw, and h, to estimate instantaneous effusion rate (Er) in (Harris et al., 2007):
Our geological map (Figure 2), coupled with the detailed description of lava flow emplacement during the first phase of the eruption by Guest et al. (1974), allowed us to recreate an accurate chronology of effusive events during Phase I. Guest et al. (1974), however, do not document the second phase; but a chronology of lava flow emplacement events during Phase II can be drawn up, in a relative sense, from the cross-cutting and overlying relationships apparent in our geological map (Figure 2). Our field survey and sampling then allowed us to characterize the two phases in terms of dimensions, morphology, texture and chemistry.
The 1974 eruption began during the afternoon of January 30, 1974 with nearly continuous Strombolian activity being observed at MDF I (Guest et al., 1974). The first three lava units of Phase I (units 1.1–2 and 1.3) were 2–3 m thick (Guest et al., 1974) and were emitted from three distinct vents (Bottari et al., 1975) on the northern flank of the MDF I cone (Figure 2). These flows initially moved north, before turning west around the base of the Monte Nuovo cinder cone (Figure 1) to attain lengths of 330–450 m (Table 2). These three lava flows were active for two-to-three days (30 January–1 February; Guest et al., 1974), with their vent structures and large parts of the flow units being buried by subsequent activity (Figure 2). These three lava flows were the first, though, to move into the pine forest that surrounds MDF I to the north. As a result, tree molds and the remains of burnt tree trunks and branches can be found here (Figure 4A; Supplementary Photos A–C).
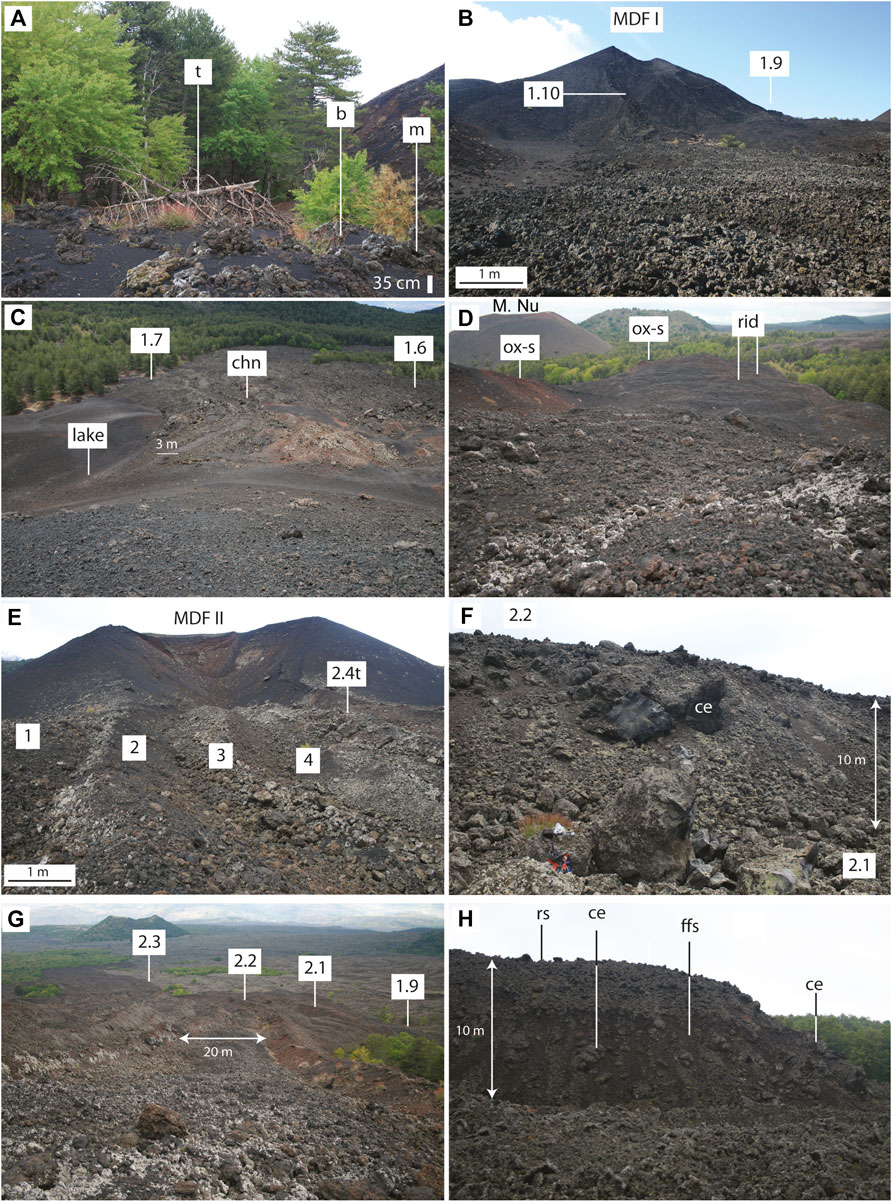
FIGURE 4. (A) Tree mould (m) in unit 1.3 with its felled tree (t), and location of carbonized wood, labeled “b”. (B) View south towards MDF I over the 1.10 'a'a unit (scale bar is for lava surface in the foreground). Pits and toothpaste lava associated with late stage extrusion from the vents feeding 1.9 and 1.10 are apparent as indicated. (C) View looking south from the summit of MDF I of units 1.6 and 1.7. Incipient channel is marked (chn) as is the “lava lake” source of unit 1.6 (lake). (D) View looking north down unit 1.5 (distance to flow front is 450 m) showing cross-flow ridges (two of which are marked as labeled “rid”) and lava balls (Monte Nuovo “M.Nu” in background). Ox-s show locations where oxidized scoriae were sampled (Supplementary Table). (E) View west into MDF II showing the right-bank (north) channel levees of Phase II 'a'a units 1 (2.1), 2 (2.2), 3 (2.3) and 4 (2.4); scale bar is for lava surface in the foreground. Toothpaste lava associated with late stage extrusion into the head of the 2.4 channel is labeled “2.4t”. (F) Levee of the 2.2 'a'a unit where it overlies 2.2, with dense, massive core extrusions (“ce”). (G) View looking west from MDF II down the proximal portion of the 2.2 lava channel, levees associated with the 2.1 and 2.3 channels are also labeled, as is the flow front of 1.9. (H) Flow front of 2.3 showing the three facies of distal 'a'a at Etna (Kilburn and Guest, 1993).
On 2 February two “short, thick, viscous flows” (unit 1.4) were erupted from the eastern side of MDF I (Guest et al., 1974). These flows are now buried by a partial collapse of MDF I (Figure 2), but were followed by extrusion of further “viscous lava” to the north (unit 1.5), where the flow front was around 10 m thick and moving at 1 m/h (0.0003 m/s) on 6 February (Guest et al., 1974). Our field observations and mapping confirm that unit 1.5 was emplaced after the collapse, and was fed by a breach in the northern sector of MDF I (Figure 2). Unit 1.5 remained active until 7 February (Guest et al., 1974) and attained a final length of 450 m (Table 2).
Unit 1.6 was emplaced on 8 February (Guest et al., 1974), and comprised three lobes (Figure 2) extending up to 460 m to the south (Table 2). Emission of “more fluid” lava had begun by 9 February from southern base of MDF I (Guest et al., 1974) to feed Unit 1.7. Unit 1.7 was the longest flow of the eruption, being almost 1.5 km in length (Table 2), and was active for 4 days (Guest et al., 1974). Flow front advance velocities were as high as 20 m/h (0.006 m/s) on 9 February, but had declined to 1 m/h (0.0003 m/s) by 13 February, with the flow stopping at 17:00 (local time) on the same day (Guest et al., 1974).
During 13 February three new vents opened at the southern, western and northern base of MDF I. These fed units 1.8, 1.9 and 1.10, respectively (Figure 2). Unit 1.8 flowed around the SW base of MDF I for just a few hours, with flow ending by the next day—14 February (Guest et al., 1974). The medial and distal segments of Unit 1.8 were later buried by MDF II (Figure 2). Instead, units 1.9 and 1.10 remained active for at-least 3 days, covering units 1.1, 1.2 and 1.3. They respectively extended 365 m and 540 m (Table 2). Guest et al. (1974) estimated flow velocities of 0.04–0.07 m/s and 0.03 m/s for units 1.9 and 1.10, and 0.005 m/s for unit 1.8, but it is unclear where in the system these velocities were measured (at vent or flow front). By 17 February, all Phase I activity had stopped (Guest et al., 1974).
Phase II began on 17 March from a new vent around 200 m west of MDF I (Guest et al., 1974), from which “thick lava flows slowly appeared” (Tanguy and Kieffer 1976). Activity at MDF II lasted 18 days, ending on 29 March (Tanguy and Kieffer 1976). Field-based descriptions for Phase II are lacking, but from our mapping we can say that four main east-west orientated channel-fed 'a'a lava flow units were emplaced (Figure 2). A first basal lava unit (unit 2.1) flowed for about 750 m, before being covered by the following flow (Figure 2). This second flow, unit 2.2, extended to around 810 m (Table 2). This was, in turn, covered by unit 2.3 (Figure 2), which was the longest lava flow in the sequence extending to 1,290 m (Table 2). Unit 2.4 then pirated the 2.3 channel close to the source (Figure 2) and extended to a distance of around 760 m (Table 2).
Lava flow unit thicknesses for Phase I are typically 2–3 m, except for the two units (1.4 and 1.5) associated with the collapse of MDF I which are 10–20 m thick (Table 2). Phase I flow lengths are 270 m–1,500 m (average of 400 m), for a total area coverage of 0.28 km2 (Table 2). Instead, Phase II lava flow unit thicknesses are typically 5 m, with lengths of 750 m–1,290 m (average of 900 m), for a total area of 0.23 km2 (Table 2). For Phase I, the average width is 70 m and the aspect ratio is 10; for Phase II, average width is 90 m and aspect ratio is 12 (Table 2). Thus, our results show that Phase I lava flow units are generally thinner, shorter and narrower than Phase II units.
The total DRE volumes of Phases I and II are 1.26 × 10⁶ m3 and 1.01 × 10⁶ m3, respectively. In both cases, this is about half of that estimated by Corsaro et al. (2009) who, using data in Bottari et al. (1975), arrived at 2.4 × 10⁶ m3 and 2.1 × 10⁶ m3 for the two phases, respectively. Our volume estimates are smaller because they do not take into account buried portions of any unit which are assumed to represent about 50% of the total lava flow field (by volume). Units 1.5 and 2.2, for example, were emplaced on top of 1.4 and 2.1, respectively (Figure 2) and so cannot be distinguished in our post-event (total lava flow field) analysis.
Lava flow units comprising the Phase I lava flow field are generally channel-fed 'a'a with a maximum clast size for clinker comprising the surface crust being 10–30 cm (Figure 4B; Supplementary Photo D). The discrete nature of each of the ten eruptive episodes that built the Phase I lava flow field led to the emplacement of ten relatively “simple” (Walker, 1973) lava flow units (Figure 2). Each unit is characterized by a single master channel (Figure 3) issuing from one of ten source vents distributed around the northern, western and southern sides of the MDF I cone (e.g., Figure 4B). The vent distribution and regional slope on this flank of Etna (which is 7–10° to the west) caused each of the flow units to move north or south before turning west (Figure 2; Table 1). Unit 1.10 moved north to pond against Monte Nuovo (a topographic obstacle to the north, Figure 1), before the left (south) bank levee failed to feed a final distal flow to the west (Figure 2).
Levees to channels in Phase I units are incipient, discontinuous and low (Figure 4C; Supplementary Photo D), typically being 1–3 m high and 4–10 m wide, with flow in the channel being more-or-less bank-full (see profiles as inset in Figure 3). Flow fronts are 2–3 m high, and of the “proximal” type defined for Etna by Kilburn and Guest (1993) where the clasts of the surface crust form the flow front scree. Most Phase I flows also lack cross-flow ridges (Figure 3) and, where they are apparent, have a wavelength of 4–6 m, heights of around 0.3 m and arc lengths of ∼5 m (see Figures 9 and 10 of Favalli et al., 2018). The exceptions are units 1.4 and 1.5 (Figure 2) which have the form of a “coulee” (Blake, 1990) with 10–20 m high levees and well-formed cross-channel ridges with wavelengths of 17–30 m and heights of 2–5 m (Figure 3). There is also a preponderance of cone-cored lava balls on the flow surface and cone material (of oxidized scoria) in the levees and at the flow front, i.e., in the zones of deposition (Figure 4D; Supplementary Photo E,F).
Lava flow units comprising the Phase II lava flow field are also channel-fed 'a'a, but have a maximum clast size of 30–60 cm (Figure 4E–F) and well-formed cross-flow ridges (Figure 3). Folds are well-formed, and the associated cross-channel ridges have wavelengths of 14–20 m, heights of around 1.3 m and arc lengths of ∼20 m. All units can be traced to a single central-vent outlet on the western (downslope) side of MDF II (Figure 2). Proximally, the channel system is bifurcated with the master channel having four branches (Figure 2). Phase II levees are well-formed, continuous and high (Figure 4F–G), typically being 10 m high and 20 m wide with lava in the channel being 2–5 m below-bank (see profiles as inset in Figure 3). Flow fronts are also of the order of 10 m high, and are of the “distal” (rubbly) type defined for Etna by Kilburn and Guest (1993) with a metric-clasts on the surface, and at the foot of the flow front, decametric clasts comprising the flow front scree and core extrusions of dense, massive lava (Figure 4H).
Like the lava flow units associated with the two phases, the cone morphology associated with each of the two phases is also quite different (Figure 3, see also Supplementary Figure 2). The MDF I cone has an extremely complex form, with the summit being cut by coalesced pit craters and the flanks are modified by faulting and collapse. Collapse of the east flank prior to extrusion of lava units 1.4 and 1.5 results in a tephra-mantled hummocky terrain, and to the north a breach in the crater is filled by lava unit 1.5. Spatter ramparts are apparent in the walls of the summit crater MDF I (Figure 5A). These were constructed during lava fountaining activity, before being covered by cinder from subsequent violent Strombolian activity. Three vents opened around the southern base of the cone feeding lava flow units 1.6, 1.7, and 1.8, with a fourth opening on the west flank to feed unit 1.9 (Figure 3).
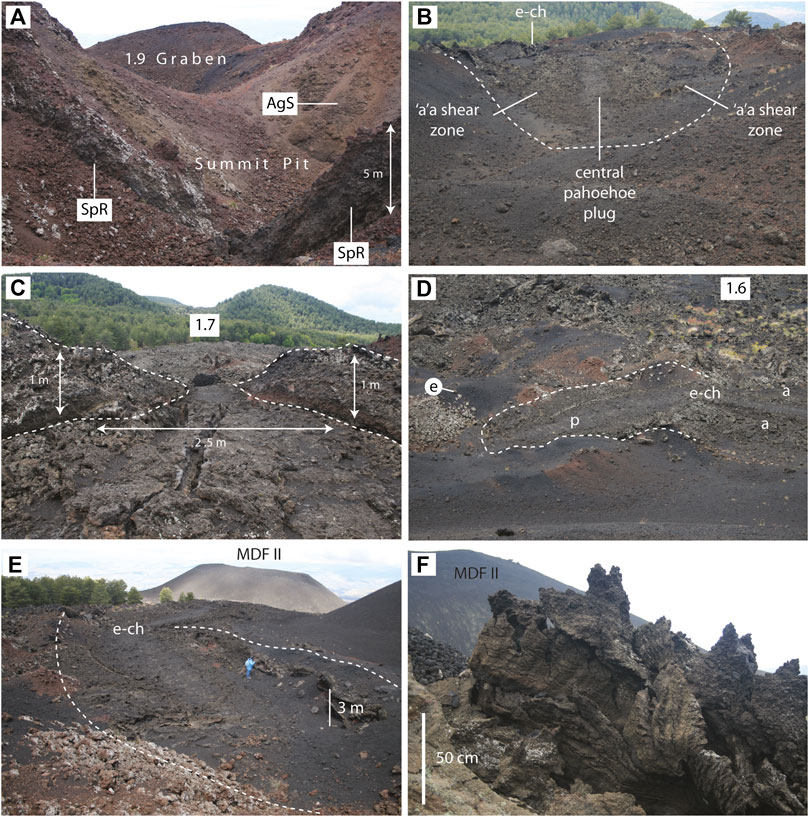
FIGURE 5. (A) View from the SE rim of the summit of MDF II looking NW into the summit pit showing spatter ramparts (SpR) overlain by agglutinated spatter (AgS). (B) View of the 1.7 “lava lake” from the NE rim of the 1.7 vent structure showing final flow out of the lake and into the exit channel (e-ch). Main “lake” area is outlined with dashed line and is around 20 m across. (C) View SE down the exit channel from the 1.7 “lake” with levee’s outlined with dashed line. Channel contains undrained, inflated pāhoehoe with inflation cleft running down-channel. Proximal portion of lava unit 1.7 in background as labeled. (D) View of the 1.8 “lava lake” from the S rim of the MDF I showing final flow out of the lake and into the exit channel (e-ch) where “a” denotes 'a'a shear zones and “p” the central plug of pāhoehoe. Main “lake” area is outlined with dashed line and is around 6 m on the long axis, and the underlying lava unit (1.6) is in the background. (E) View NW towards MDF II and across the 1.8 “lake” (outlined with dashed line) showing exit channel (e-ch) and proximal portion of lava unit 1.8. (F) Toothpaste lava in the 1.10 vent.
The largest depression on the flank of MDF I is that associated with the vent that fed unit 1.7 and in which the ephemeral “lava lake” of Guest et al. (1974) formed. This structure is a horseshoe-shaped crater, open to the SW (Figure 3 and Figure 4E). The vent area is characterized by a 50 × 20 m oval area of flat pāhoehoe (Figure 5B). This is drained by a 2–3 m wide exit channel which runs into a 10 m wide master channel to feed unit 1.7 (Figure 5C). The vent area associated with unit 1.8 has a similar, but smaller, form. This lava lake-like structure comprises smaller (3 × 6 m) oval area of flat pāhoehoe (Figure 5D), from which a 2 m wide channel extends to the NW (Figure 5E). The W flank is cut by a graben, with its head in the summit pit and the vent structure for flow 1.9 at its mouth (Figure 3 and Figure 4B). The vent of unit 1.9 contains a ∼10 m long flow of toothpaste lava (Rowland and Walker, 1991) which forms a late stage squeeze-out into the head of the channel (Figure 5F). Likewise, a graben on the NE flank (within which four pit craters formed, Figure 3) has the unit 1.10 vent at its mouth. Again, this is filled by a late-stage squeeze-out of toothpaste lava. On 14 and 15 February the inner walls of the MDF I crater suffered “major collapses” and fractures opened on the southern and western flanks of Guest et al., (1974). These are those marked on the north flank of MDF I in Figure 3.
The MDF II cone, instead, has a simple form, being a symmetric, horseshoe-shaped and open to the west, with no collapses, peripheral vents or fault structures (Figure 3). As with the MDF I vents, late stage extrusion of toothpaste lava into the head of the channel draining the vent zone is apparent (Figure 4E). Following Favalli et al. (2009a), the morphology of MDF I defines it as a “structurally deformed cone”, characterized by a complex shape, an abundance of faults, collapse structures and formation of secondary vents. Instead, the morphology of MDF II is similar to that described by Dóniz-Páez (2015) for the cinder cones of Tenerife, where the cone has an otherwise simple and symmetrical form but attains a horseshoe-shape, with the central open on the down slope side, due to lava exiting the system in that direction.
Bulk densities for Phase I lavas were 1,920–2,490 kg m−3, with an average of 2,210 kg m−3 and standard deviation of 190 kg m−3. Instead, those of Phase II were 1890–2,750 kg m−3, with an average of 2,425 kg m−3 and standard deviation of 330 kg m−3 (Table 3). These values convert to vesicularities of 30–56% (average = 37 ± 8%) for Phase I, and 4–40% (average = 20 ± 16%) for Phase II. For lava flow units 1.7, 1.10 and 2.3, samples collected near the vent are less dense than those collected at the flow front (Table 3; Figure 6A). For these lava flow units near-vent vs. flow-front densities are, respectively: 2,105 vs. 2,360 kg m−3 (1.7), 1920 vs. 2,490 kg m−3 (1.10), and 2,540 vs. 2,750 kg m−3(2.3). This is a result assumed to be due to crystallization and down flow degassing (Sparks and Pinkerton, 1978), and represents a vesicle loss of 2, 15 and 9%, respectively. For all lava samples, densities are much higher than for those of at-vent scoria (1,300–1,500 kg m−3; vesicularity of 60–80%, Table 3), but generally lower than those of degassed bombs sampled around the vent (2,720 kg m−3; vesicularity 15%, Figure 6A).
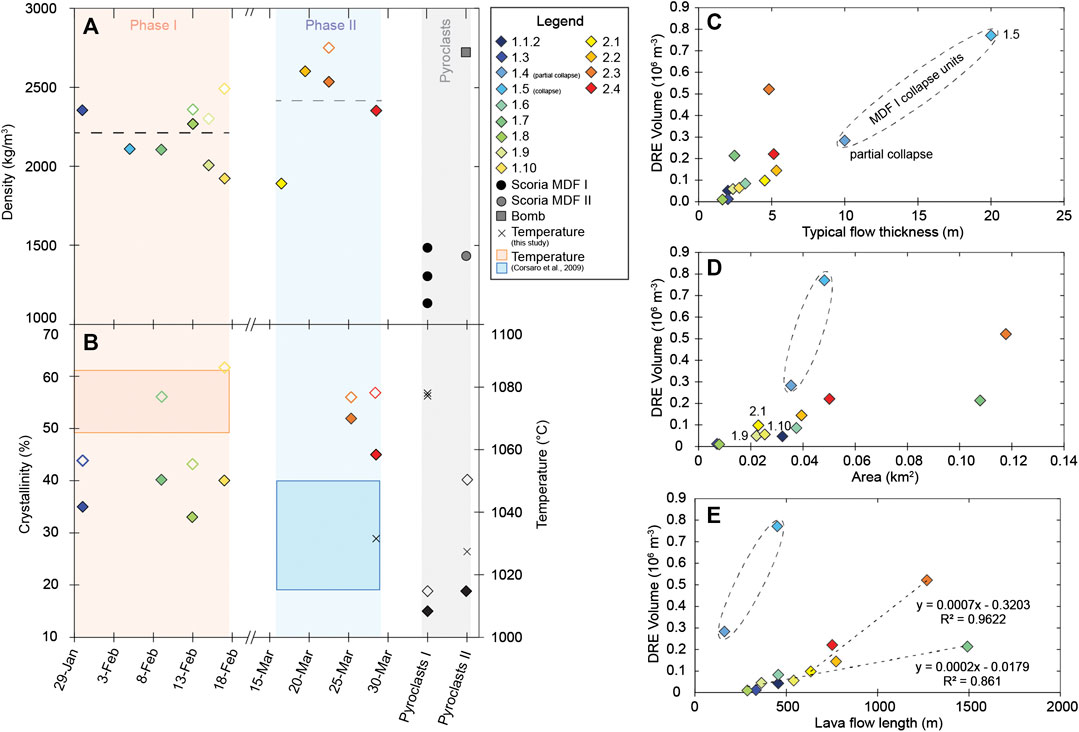
FIGURE 6. (A) Density and (B) crystallinity and geothermometer-derived eruption temperature for samples analyzed during each phase. Each lava flow unit sample is sequenced in chronological order. Scatter plots of DRE volume vs. lava flow unit (C) thickness, (D) area, and (E) length. Empty diamonds represent lava front samples in (A) and vesicle-free crystallinity in (B).
All six samples analyzed for crystallinity were aphyric with phenocryst contents of 1–3%, with microphenocrysts (>30 µm) consisting of plagioclase, clinopyroxene, olivine and Ti-magnetite (Figure 7). Clinopyroxene microphenocrysts from both phases are often associated with hourglass sector-zoning (Figures 7B,D; Downes, 1974). Phase II lavas and pyroclasts have more ferric clinopyroxenes, more Ti-magnetite compared to that of Phase I, and are also distinctive due to the occurrence of Fe-rich rims in olivines. The total microphenocryst content varies between 35 and 40% for Phase I lavas, and between 45 and 52% for Phase II lavas (Figure 6B). These convert to vesicle-free crystal fraction of 0.43–0.62 for Phase I lavas, with the two Phase II samples being 0.56 and 0.57 (Table 3). Following the same pattern, the crystal content of the scoria samples from Phase II is higher than for Phase I. We measure a vesicle-free crystal fraction of 0.19 for Phase I and of 0.39 for Phase II. The mean aspect ratio of crystals was 3.3 and 3.1 for Phases I and II, respectively, and 5.3 and 4.9 for plagioclase which is the primary mineral.
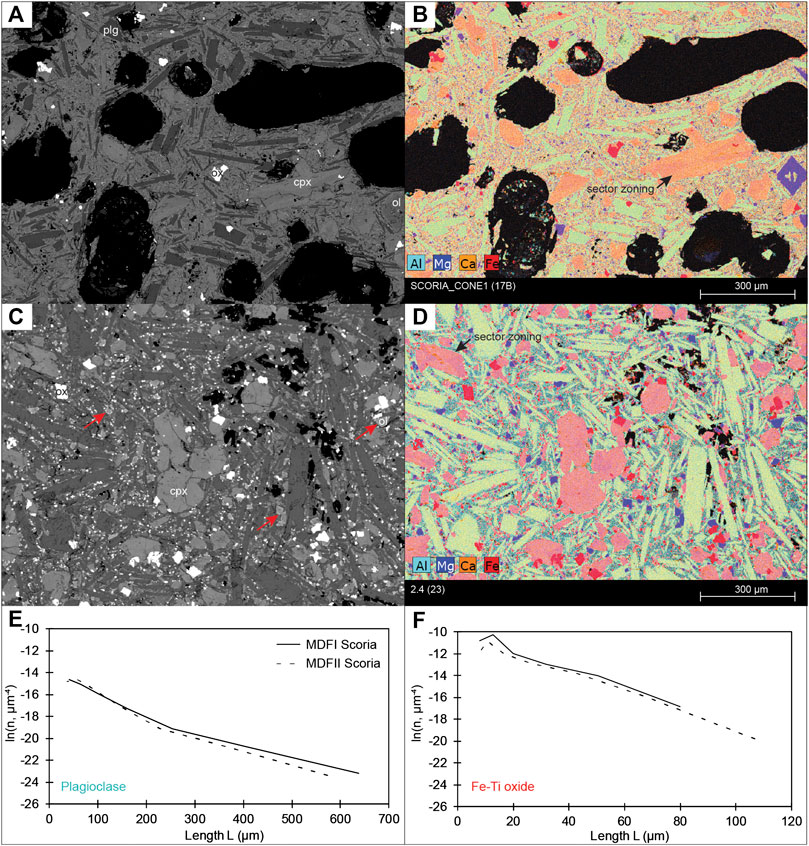
FIGURE 7. Back-scattered electron images and element maps of two eruptive products from the 1974 flank eruptions of Mt. Etna: (A, B) a scoria from the Phase I (sample #17B, cf. Table 3) and (C) (D) a lava sample from the vent of Phase II (sample #23, cf. Table 3). Note that hourglass sector zoning occurs in clinopyroxenes (cpx). Also, note that Phase II lavas contain more Ti-magnetites than those of Phase I, as well as Fe-rich rimmed olivine crystals (red arrows), which are inexistent in Phase I lavas. Plg, ox, cpx and ol respectively stand for plagioclase, oxide, clinopyroxene and olivine. Comparisons of the size distributions of plagioclase (E) and Fe-Ti oxides (F) for both phases. Note that CSDs were generated from the same number of images from each phase in which 946 plagioclases and 335 oxides were considered for Phase I and 1,028 plagioclases and 668 oxides were considered for Phase II. The 3D shape factors determined using CSDSlice (Morgan and Jerram, 2006) returned best level of fits of R2 = 0.82 and R2 = 0.94 for plagioclases of each phase and R2 = 0.81 and R2 = 0.88 for oxides of each phase.
The crystal size distributions (CSD) for plagioclases and oxides between the two phases (Figures 7E,F) result in linear ln(n)-L relationships that are similar for both phases. Here, n is the number of crystals and L is their dimension. For the four CSD plots, we obtain an R2 of 0.97 with a standard deviation of 0.001.
Bulk rock compositions show, in agreement with Corsaro et al. (2009), little variation between Phases I and II, aside from a small increase in CaO and decrease in MgO between Phases I and II (Table 4). Analysis of matrix glass by Corsaro et al. (2009) revealed Phase I to be “sideromelane-type” and Phase II to be “tachylite-type”, yielding eruption temperatures of 1,075 ± 10°C for Phase I, and 1,025 to 1,040 (±10)°C for Phase II. Our analyses are again in agreement with those of Corsaro et al. (2009), yielding eruption temperatures of 1,077 ± 10°C for Phase I, and 1,027 to 1,031 (±10)°C for Phase II (Table 5). While Guest et al. (1974) measured a maximum temperature of 1,060°C during Phase I, Tanguy and Kieffer (1976) give an eruption temperature of 1,085°C, in good agreement with these Phase I eruption temperatures.
Given the higher crystallinity and higher bubble content on Phase II in comparison to Phase I, we assumed that Phase II is more degassed than Phase I. Following Harris and Allen (2008), Etnean lavas have water contents of 0.4 wt%, but degassed lava may have H2O content as low as ∼0.1 wt%. With the glass chemistry and temperatures of Table 4, the melt viscosity for the lava on eruption is about 5.5 × 10² Pa s for Phase I, and 1.9 × 10⁴ Pa s for Phase II. The effect of adding crystals and vesicles to the mixture increases the viscosity of Phase I lavas to 0.4–2.1 × 10³ Pa s, and those of Phase II lavas to 7.7 × 10⁵–1.0 × 10⁶ Pa s (Table 5). The low crystal content of Phase I suggests that the lava may not have had a significant yield strength (ϕc/ϕm < 0.5) and therefore that the lava behavior may be assumed to be Newtonian. For these flows, we calculate a vent-leaving velocity of about 1 m/s and effusion rate around 5 m3/s. For Phase II, the higher crystal fraction probably induced higher crystal-crystal interaction and therefore the lava could have developed a yield strength that can be modeled by a Bingham-like behavior. The lava yield strength calculated using Eq. (6) gives a value of up to 900 Pa (for a crystal content of 50%). The velocity of the lava, calculated using Eq. (7), is 0.04 m/s with a basal shear stress obtained from Eq. (8) of 2.0 × 10⁴ Pa with the effusion rate through the 20 m wide channel (Table 7) being 4 m3/s.
In terms of lava flow system morphology, texture and rheology, the two phases of Etna’s 1974 low flank eruption were fundamentally different. Phase I produced ten relatively thin (2–3 m, Table 2) lava flows (units 1.1 to 1.10, Figure 2), within which channels were, following the system of Lipman and Banks (1987), “transitional”. That is, they were near bank-full with poorly defined levees (Figure 3, inset). Phase I also built a complex cone system with coalesced summit vents, flank vents containing lava lakes, grabens, pits, and collapse deposits (Figure 3). Lavas that were erupted during Phase I were of a relatively high (30–56%) vesicle and low (35–40%) crystal content (Table 3), and of a higher (1,077 ± 10°C) temperature than Phase II (Figure 6B). Instead, Phase II produced four relatively thick (5 m, Table 2) units (2.1–2.4, Figure 1) with well-formed channels that were, following Lipman and Banks (1987), “stable”. That is, they had well-defined levees with below-bank flow (Figure 3, inset). Phase II also built a simple cone system (Figure 3 and Figure 4E). Phase II erupted lavas with a lower (4–40%) vesicle and higher (27–52%) crystal content (Table 3), with lower (1,030 ± 10°C) temperature, than Phase I (Figure 6B). These differences imply a change in rheology, and hence flow dynamics, between Phases I and II; as well as a change in eruption style.
To gain an order of magnitude assessment of the viscosity difference between the two phases, we take the typical chemical, temperature and textural values of each phase. In agreement with Corsaro et al. (2009), textural analysis reveals Phase II lavas to be more degassed (more crystalline, denser and cooler) than Phase I. Thus, rheologically, we model Phase I as hot and fresh, and Phase II as cool and degassed. Considering only the melt phase, we find a two-order of magnitude increase (from 102 to 104 Pa s) between the two phases. This is due to the change in glass chemistry, decrease in water content and decrease in temperature between the two phases (Table 5). If we also consider the effect of differing crystal and bubble contents on the viscosity of the erupted lava, there is a difference of two order of magnitudes (103 vs. 105 Pa s) between Phases I and II (Table 5).
This increase in viscosity between the two phases is consistent with the observations of Favalli et al. (2018) where the differences in fold wavelength in the lavas emplaced during each of the two phases suggest that Phase II is more viscous than Phase I. They are also consistent with previous viscosity estimates made for Etnean lavas. Measurements of the 1975 lava made by Pinkerton and Sparks (1978) using a viscometer gave a viscosity of 9.4 × 10³ Pa s, which compares with 3–74 × 103 Pa s obtained by Walker (1967) and Tanguy (1973) for lava active during Etna’s 1966 eruption. Calvari et al. (1994) obtained values of up to 2 × 10⁵ Pa s at some distance from the vent in the 1991–1993 lava flow field, a location where lava had cooled and crystallized over at-vent conditions. This is all in line with theoretical calculations of Harris and Allen (2008) which, based on the three-phase treatment of Phan-Thien and Pham (1997) and using the typical chemistry and temperature of Etna’s 1975 lavas, gave at-source lava viscosities of 103–104 Pa s, increasing to 104–105 Pa s for particularly high bubble and/or crystal contents (see Figure 10 of Harris and Allen, 2008). Thus, while viscosities during Phase I of the 1974 eruption are typical for Etna, those of Phase II were relatively high and consistent with a cooled and more crystalline magma.
The total DRE volume of lava erupted during Phase I was 1.3 × 10⁶ m3 (Table 3) over 18 days, which gives a Mean Output Rate (MOR) of 0.8 m3/s (Harris et al., 2007). To assess potential peak effusion rates, we use our measurements for our best constrained unit, this being unit 1.7 (Table 7). Our velocity for vent-leaving lava of 1.7 m/s and effusion rate of 5 m3/s agree with Guest et al. (1974) who estimated the flux to be “more than 6 m3/s” on 8 and 9 February.
Based on measurements of 17 lava flow units emplaced on Etna between 1974 and 1993, Calvari and Pinkerton (1998) provided the empirical relation between flow length (L) and effusion rate (Er):
Using this, we expect flow units during Phase I to have extended to 4 km at 10 m3/s, and to 1.2 km at 0.8 m3/s. However, Phase I lava flows flow units only attained lengths of 0.3–1.5 km (Table 2). Hence, we infer that the episodic nature of Phase I meant that units were volume limited. That is, during each episode supply was cut before the flow could attain its maximum extent (Guest et al., 1987; Harris and Rowland, 2009). Thus, although the first phase of the eruption may have lasted 18 days, individual lava flow emplacement events lasted just a few hours-to-days, and flow stopped while any given unit was still in flow so that flow forms remained “transitional” (senso: Lipman and Banks, 1987).
During Phase II, DRE volume of 106 m3 was erupted over 12 days at a MOR of 0.99 m3/s. Higher viscosities, though, meant that velocity for vent-leaving lava were much lower (0.03 m/s), as were peak effusion rates which we estimate as being no more than 4 m3/s (Table 7). Using Equation (10), we expect flow units during Phase II to have extended to 1.3 km at 1 m3/s, and to 2.5 km at 4 m3/s, where the maximum length for a Phase II lava flow was 1.3 km (for unit 2.3, Table 2). Judging from the channel morphology, the shorter lengths of the other units can be explained by levee failure high in the channel system, within 100 m of the vent (Figure 2). As a result, volume limits to flow extension were the result of beheading of any given unit and creation of a new channel, rather than termination in supply from the vent. Thus, we envisage eruption of lava during Phase II being much more sustained, with one flow (unit 2.3, Figure 2) attaining its full cooling-limited potential. Units were active for long enough to reach a degree of maturity, showing all four parts of the Lipman and Banks (1987) channel system (Figure 3): 1) well-formed master channels over the proximal-medial sections, 2) a short zone of transitional channel feeding, 3) a zone of channel-free dispersed flow behind, 4) a well-developed flow front (Figure 4H).
The lower yield strength and viscosity of Phase I lavas resulted in flows of markedly different lava flow unit dimensions and morphologies than those of Phase II, as is immediately apparent from the cross-flow profiles (Figure 3). The Phase I units are all thinner with poorly developed channels. Poor channel development, though, is also likely due to the episodic, volume-limited nature of the emplacement of the Phase I units. Under such conditions, the channels would still have been in construction when supply was cut so that they could not take on the well-formed “mature” form of the Lipman and Banks system (1987). Instead, levees remained incipient and (following Sparks et al., 1976) simple, being initial, rubble levees, without construction by overflow or accretion to create more substantial, compound levees with below bank flow (cf. Naranjo et al., 1992), which typically requires some time and variation in flow rate and level in the channel to form (cf. Harris et al., 2009).
We do, though, find reasonable (R2 > 0.85) positive relations between DRE volume and 1) unit area, 2) flow length and 3) flow thickness (Figure 6C–E). However, two trends and groupings are present representing 1) the volume-limited control on Phase I units, and 2) the higher viscosity and yield strength of Phase II units (Figure 6C–E). For the relationship of volume vs. thickness (Figure 6C), the higher yield strength of Phase II units means that a given volume will spread to greater thickness (cf. Hulme, 1974). This also means that, the same volume spreading with the Phase I rheology will attain greater area and length than when spreading under Phase II rheological conditions. This is apparent in the different relations in the linear increase in area with volume (Figure 6D) and length with volume (Figure 6E) between the Phase I and II units.
The difference in style of eruption between the two phases (episodic vs. sustained) also influenced the morphology of the cone, where the episodic nature of Phase I resulted in a complex cone form, and the steady character of Phase II resulted in a simple cone form (Figure 3 and Figure 4E). In this regard, the Phase I cone represents the result of explosive eruptions from the summit craters and opening of ten different events around its base (Figure 2). The form of MDF I was further modified by collapse events, which ranged from large scale flank failure (i.e. ∼0.8 × 10⁶ m3; Table 2), to pit and graben formation above dikes (cf. Wilson and Head, 2002; Figure 3). Instead, the Phase II cone was breached at a single point to the west where a continuous discharge of lava from a stable point meant that the cone was not able to build in this sector, but was able to build symmetrically in all other sectors (Figure 3, Figure 4E; Supplementary Figure 2).
Although there was no change in bulk rock geochemistry between the two phases of the 1974 eruption, in terms of vesicularity, crystallinity, glass chemistry temperature and, therefore, also lava rheology, flow dynamics and system morphology, the two phases were completely different (cf. Tables 2–6). Most importantly, the eruption temperatures of Phase II were lower than those of Phase I, and the lavas were denser and of a higher crystal content (Figures 6A,B). The two phases were thus fed by the same trachybasaltic magma source from a depth of 10 ± 2 km below sea level (Table 4; Corsaro et al., 2009), but the ascending magma underwent two different degassing and cooling histories, resulting in two different glass chemistries (Table 5; Corsaro et al., 2009). According to Corsaro et al. (2009), the magma that fed Phase I indicated a high decompression rate consistent with a rapid ascent under closed system conditions to a depth of at-least 2 km. Instead, Phase II magma was fed by the same magma but (Table 7) which underwent more cooling, a slower ascent favoring gas-melt separation (Corsaro et al., 2009), and thus resulting in a lower effusion rate. This is also consistent with the presence of sector-zoned clinopyroxenes suggesting slow ascent rate (Figure 7) and the higher Al concentrations in clinopyroxenes from Phase II compared to Phase I suggesting higher undercooling (Ubide et al., 2019). As a result, magma feeding Phase II experienced a greater degree of degassing, cooling and therefore crystallization, than that feeding Phase I.
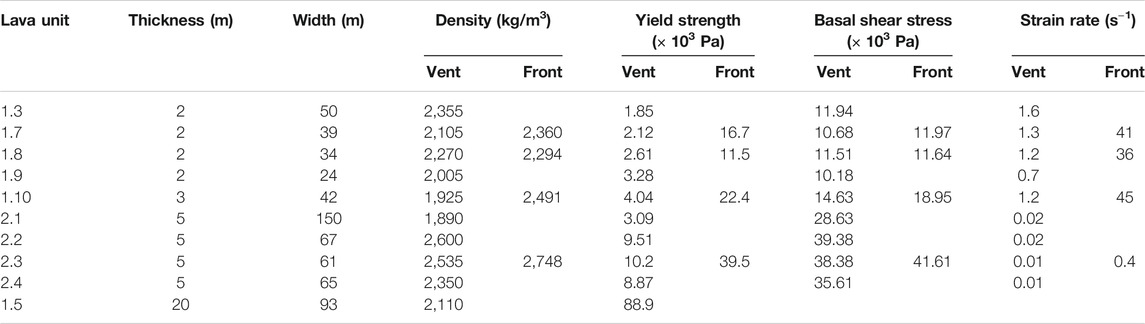
TABLE 6. Yield strengths, basal shear stress and strain rate calculated for Phase I and II units for which we have density values (Table 3). For the basal shear stress, we use slopes of 15° for Phase I and 18° for Phase II, and for strain rate we use the typical (median value) Phase I and II mixture viscosities of Table 5. Unit 1.5 is placed last as it us somewhat anomalous amongst the Phase I units, and a basal shear stress and strain rate could not be calculated.
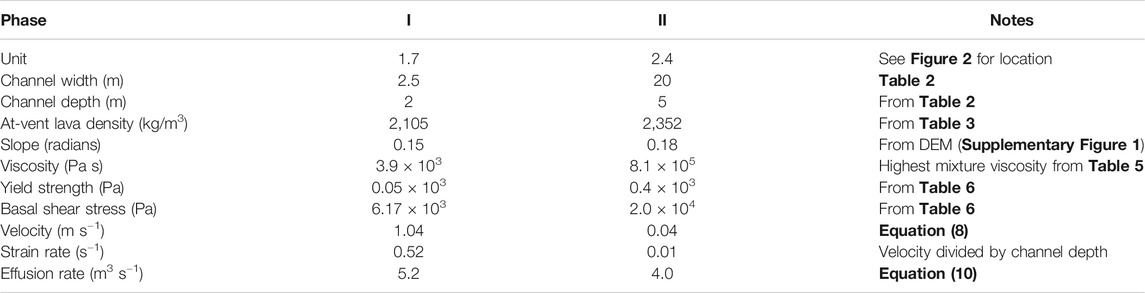
TABLE 7. At-vent dimensional, rheological and dynamic parameters for the master channels feeding Units 1.7 and 2.4.
A fundamental factor which may be linked to the distinct physical properties of Phase I and Phase II is the 23 days quiescence between the two phases. Our question is: could this time account for these differences, especially in terms of crystal content and temperature? If this is the case, this would have important implications on crystallization kinetics and cooling rates. However, the answer is not straightforward as the role of volatiles may also yield changes in crystallinity, temperature and viscosity. In fact, the study of Ubide and Kamber (2018) on the recurrence of Cr-enrichment near the rims followed by formation of Cr-poor at the outermost rims of clinopyroxenes from Phase I suggests fast magma ascent rates (i.e., 35–2080 m/h) triggered by mafic intrusion at ∼10 km depth. Thus, the change in eruption style from explosively periodic (Phase I) to effusively sustained (Phase II) may be attributed to the closed system ascent conditions before Phase I which did not allow as much degassing as prior to Phase II. Indeed, the high explosivity at the beginning of Phase I may have been caused by the lack of volatile exsolution before the eruption whereas the more effusive behavior of Phase II may be attributed to greater magma outgassing during the quiescence period and during the eruptive phases. This is also consistent with the decrease in explosion frequency and intensity as well as the increase in effusion rate (e.g., lava flows 1.7 to 1.10) observed towards the second half of Phase I (Guest et al., 1974; Tazieff, 1974; Tanguy and Kieffer, 1976). Furthermore, the experimental study of La Spina et al. (2016) suggests that H diffuses very rapidly in basaltic magmas—such as those feeding Etnean eruptions—as it stays close to equilibrium values at extremely short timescales (<100s). This confirms that degassing induced crystallization during ascent was not the controlling factor of the change in lava flow emplacement between Phase I and Phase II. In fact, our CSD data (Figures 7E,F) which show a simple crystallization history for both phases demonstrate that the kinetics at work during crystallization within the conduit were similar for both phases and that the major change in viscosity, and hence eruption style, must have been associated with release of volatiles during the eruptive phases. Consequently, the lavas of Phase II were of higher viscosity than those of Phase I (105 vs. 103 Pa s, Table 5) and were of higher yield strength (104 vs. 103 Pa, Table 6), as well as experiencing lower velocities and strain rates, but higher shear stresses (Table 7).
These rheological differences meant that the lava flow field geometries and morphologies were fundamentally different between the two phases. Phase I fed short, thin flows (Table 2) with relatively small 'a'a clasts (Figures 4B–D) and poorly formed levees (Figure 3), but with a volume limit due to the short duration of magma supply during each episode. Instead, Phase II fed thicker flows (Table 2) with large 'a'a clasts (Figures 4E–H) and well-formed levees (Figure 3), supply was sustained but volume limits resulted from channel pirating.
The exception was the lava flow fed by collapse of MDF I, unit 1.5 (Figure 2). This had the textural, rheological, dynamic and morphological character of Phase II flows. Indeed, the flow dimensions imply a yield strength of almost 105 Pa (Table 6), and unit 1.5 fold wavelengths (17–30 m) are similar to those of Phase II units, as are the clast sizes of the 'a'a clinker (Figures 4B–D). This implies a similar viscosity (of up to 106 Pa s) to units of Phase II. We infer that the high yield strengths and viscosities (in comparison to other Phase I lavas) were due to the magma that fed the flow being stored in the shallow (in-cone) conduit system of MDF I, that was then released by failure of the cone in the northern sector. Here, failed cone chunks were rafted to the flow front (cf. Younger et al., 2019) and formed the cores of the metric-sized lava balls unique to this unit (Figure 4D). For this Phase I effusive event, the source magma thus experienced a much greater increase in density and crystal content (as well as temperature loss) due to near-to-at surface degassing, crystallization and cooling during its residence in the shallow conduit (cf. Gurioli et al., 2014) than any other Phase I (“rapid-ascent”, Corsaro et al., 2009) magma that fed Phase I units.
We have here defined the emplacement style and history of lavas associated with a low effusion rate, low elevation flank eruption; an event which may be considered rare (Guest et al., 1974; Andronico and Lodato, 2005), but which is intriguing from both the points of view of magma ascent, lava flow emplacement dynamics and hazard. Thus, follow-up questions useful in further understanding the evolution of such an eruption would, following the lead of Corsaro et al. (2009), return to further understanding and constraining the ascent dynamics of the magma feeding the eruption so as to address questions such as:
(1) What can cause a change in eruption style - periodic vs. continuous outflow of magma, during such a low flank event?
(2) How can the explosivity and discharge rate of different phases be related to magma ascent conditions?
(3) What can cause a repose period between two phases of a low flank eruption?
At Etna, several previous papers have tried to address these issues for various flank and summit effusive events, but a clear and unambiguous relationship between cause and effect has not yet been established. Lautze et al. (2004) found that even persistent summit effusions (as observed during January–May 2001), when analyzed at a shorter time scale, display oscillations in discharge rate that may result from changes in the supply rate of magma to the near-vent conduit system. If such variations can be observed even during apparently steady-state lava output, it should be expected during the initial phases of dike emplacement and eruption, as well as following pauses, especially in the case of the 1974 feeder dike that rose straight from a depth of 10–15 km (Bottari et al., 1975). It is worth noting that the greatest changes in output rate are normally observed at the start of a lava effusion (cf. Wadge 1981; Harris et al., 2011; Harris et al., 2012) when the eruptive fissure has just opened and the source is depressurizing, which would have affected the first phase more than the second, when the pathway would already have been opened (cf. Harris et al., 2000). Another reason for an intermittent output behavior could be collection of gas-rich magma forming a foam that is episodically released during effusions fed at higher levels of explosivity (cf. Harris and Neri, 2002).
Eccentric eruptions displaying two eruptive phases separated by a pause lasting several days are not common at Etna (Branca and Del Carlo, 2004), but it is intriguing that one of these rare cases, together with the 1974 eruption, is the 1763 eruption that built up the scoria cones (Monte Nuovo and Monte Mezza Luna) located near to the 1974 Mount de Fiore cones which also formed short lava flows. Although difficult to prove, it is possible that the sedimentary basement, which is more elevated below the west flank of the volcano and gently slopes eastward (Branca and Ferrara, 2013), plays an important role when a feeder dike ascends from the deep storage system to reach the surface (Patanè et al., 2006). Future work on the 1763 flank eruption of Mt. Etna—currently understudied—would provide further insights into the origin of these rarely occurring eccentric eruptions.
At Etna, other flank eruptions have occurred fed by a dike ascending from depth and by-passing the central conduit system (Acocella and Neri, 2003), but these have tended to follow the NE and S rift zones and have their eruptive vents at higher elevations. These have also been fed at higher effusion rates to feed long lava flows, and have a different dike orientation to the 1974 case. The 2001 flank event, for example, was fed by a N–S trending lateral dike within the south rift zone (Acocella and Neri, 2003). Vents opened between 2,100 m and 2,150 m asl, and erupted lavas at up to 30 m3/s which extended 6.4 km (Coltelli et al., 2007). Instead, the 1974 eruption was fed by an WSW trending dike (Tanguy and Kieffer, 1976), was located well off rift and was characterized by considerably lower effusion rates and flow lengths (Table 2). This points to a fundamental difference between the genesis of off-rift (eccentric) and on-rift activity, as well as low flank vs. high flank events at Etna.
Low effusion rate events characterized by discharge rates of 1–5 m3/s to feed short lava flows (no more than a kilometer in length) have characterized Etna’s effusive activity, but these have associated long-lived (months-long) summit effusions (Favalli et al., 2010; Harris et al., 2011), as well as long waning phases of on-rift flank eruptions, as during 1991–1993 (Calvari et al., 1994). This again points to a contrast between genesis, magma ascent and flow dynamics during Etna’s low flank, off-rift activity, and that apparent during flank and summit activity more typical of this volcanic system. This highlights why low flank eruptions, whether of high or low effusion rate, need to be treated and considered differently than more typical and common activity.
The low flank eruption case considered here opened above the municipalities of Bronte (600–1,000 m asl) and Adrano (400–750 m asl) which have a combined population of 56,000 (ISTAT 2008). Although at a relatively low altitude of 1,660 m asl, MDF II was still 7.7 km east of Bronte, with the longest lava flow stopping 6.6 km from the town. Thus, flows were not a threat to Bronte because of 1) the distance between the vent and the town, 2) the volume-limited nature of Phase I events, and 3) the low effusion rates of Phase II. However, while on the southern, eastern and northern flanks communities extend to higher elevations, vents feeding low flank eruptions can also open at lower elevations; placing the source not just close to, but within populated areas. The worst-case scenario at Etna would thus be a low flank event opening in the vicinity of Etna’s 1,669 vent, where the low flank vents are within a large and dense population (Crisci et al., 2003; Harris et al., 2011).
For such a low flank event with the end member character detailed here, during the first phase viscosities will be low and effusive activity will be episodic so that, due to the volume-limited nature of emplacement, lava flows will not extend to their full potential. A second phase may follow during which emission will be of a higher viscosity to form thick flows with well-defined channels and advancing at much slower rates. In this phase, flow lengths remain relatively short, now due to the rheological control on flow dynamics, dimension and morphology. With our topographic data we can define two new relations between volume (V, × 106 m3) and flow length (L, m) for these two scenarios:
Phase I (volume-limited control): V = 0.0002L – 0.0233 R2 = 0.91.
Phase II (cooling-limited control): V = 0.0008L – 0.4624 R2 = 0.93.
With these relations, which are tailored only for the 1974 effusion rate, rheological and slope conditions (cf. Murray and Stevens, 2000), we can add that lavas of the Phase I character have the potential to extend greater than 7 km (the distance between MDF II and the population at risk) if a volume of more than 1.4 × 10⁶ m3 is erupted in a single, continuous effusive event (supply, though has to be maintained for the duration of the effusive episode). This is a volume between ten and 145 times greater than that erupted during any one of the 1974 Phase I episodes (Table 2) and, at typical Phase I effusion rates of 5 m3/s (Table 6), would have needed 1.5 days of sustained effusion to achieve. Instead, lavas of Phase II rheology can only extend greater than 7 km if more than 5.1 × 10⁶ m3 of lava is erupted. This is between 10 and 50 times greater than the volume erupted during Phase II of the 1974 eruption (Table 2), and at typical Phase II effusion rates of 4 m3/s (Table 7) would have needed 20 days of sustained effusion to achieve. It is important to note that these implications are valid for this particular eruption.
Etna’s January–March 1974 involved two effusive phases. In the first phase, lava of relatively low viscosity (103 Pa s) fed thin (<3 m thick) lava flows at effusion rates of up to 5 m3/s. However, the episodic nature of the eruption meant that lava flows were volume-limited, extending no further than 1.5 km from the vent. In the second phase, degassed magma fed thicker (5–20 m thick) flows of high (105–107 Pa s) viscosity at effusion rates of less than 4 m3/s. These low effusion rates meant that, even though supply was sustained in the second phase so that some units were cooling-limited, flows extended no more than 1.3 km from the vent. In addition, levee failure at the head of the channel system in Phase I, plus the changing vent location around the base of MDFI during Phase I, meant that flow front supply became frequently pirated. This process favored construction of a compound lava flow field where about 50% of the erupted volume was piling up on previously emplaced units. High viscosities also meant that flows were relatively slow moving, where flow fronts advanced at just a few meters per hour, and velocities were <1.75 m/s for lava in the vent-leaving channel.
In terms of activity at Etna, the January–March 1974 eruption has been classified as an “eccentric eruption” (Guest et al., 1974; Andronico and Lodato 2005) or as a “deep lateral eruption” by Tanguy and Kieffer (1976). It was later ascribed to a deep dike-fed origin (Corsaro et al., 2009), but we here place it in a globally applicable class of “low flank” eruption, i.e., an effusive eruption fed by a flank vent that opens closer to the base of the volcano than the summit. Opening at an elevation of 1,660 m asl, in comparison to the elevation of Etna’s summit craters (3,350 m asl) the 1974 eruption does qualify as being such an event. However, by the standards of such an eruption type both on Etna and globally, its character was anomalous; it being of very low mean output rate (<1 m3/s), erupted volume (∼106 m3) and flow length (average = 0.65 km). If we compare with the global cases reviewed in the introduction, these values are extremely low. Even by Etna’s standards the values are low. Effusion rates can be up to 20–50 m3/s during flank events (Harris et al., 2011; Harris et al., 2012), and up to 200–400 m3/s during fountaining events at the summit craters (Ganci et al., 2012; Proietti et al., 2020). Flow length and volume ranges recorded for 25 “most accurately surveyed” lava flow fields by Murray and Stevens (2000) was typically 3–11 km and 4–230 × 106 m3, respectively.
We thus define an end-member event-scenario of low flank eruption which involves eruption of relatively high viscosity lava that feed lava flows that are slow moving, of limited extent and length, but thick. Such a definition allows us to consider all possible variants of low flank activity that can impact vulnerable communities. This is an eruption type that represents a relatively uncommon eruptive behavior at Etna (Guest et al., 1974; Andronico and Lodato 2005) and elsewhere, but is one that cannot be neglected in terms of hazard. We have here defined the properties, dynamics and emplacement style/history of lavas associated with one such eruption type. However, follow up work to further understanding the ascent dynamics of the magma feeding the eruption would be of great value.
In terms of risk, the slow flow advance rates and limited extent of lava flow inundation gives time for evacuation (days to weeks) and will mean that impacts are localized (extending over just 0.5 km2 for the case considered here). However, the flow thickness, high lava viscosity and lack of tube formation likely make implementation of mitigation measures, such as barrier construction or intervention using explosives (cf. Macdonald 1962; Colombrita 1984; Barberi et al., 1993), of little value.
The original contributions presented in the study are included in the article/Supplementary Material, further inquiries can be directed to the corresponding author.
CL prepared the samples, performed the analyses, collected the images of the lava samples, processed the chemical, textural and mapping data. AH participated to the field work where the samples were collected and where the drone flight was performed. AH also assisted CL with the sample preparation, analyses and the processing of the data. OC processed the rheological data. SC participated to the field work where the samples were collected and where the drone flight was performed. More specifically, SC helped with the selection of the samples on the field. LG assisted CL with the textural analyses. MF, AF, and LN participated to the field work where the samples were collected and where the drone flight was performed, and they also assisted with the processing and the interpretation of the drone data. All the authors contributed to the edition of the manuscript for submission to Frontiers.
This research was financed by the Agence Nationale de la Recherche through the project LAVA (Program: DS0902 2016; Project: ANR-16 CE39-0009). This is ClerVolc publication 443 and ANR-LAVA publication 16.
The authors declare that the research was conducted in the absence of any commercial or financial relationships that could be construed as a potential conflict of interest.
This work is based on CL Master’s thesis at LMV, Université Clermont Auvergne. CL and AH thank the Labex ClerVolc and LMV (équipe volcano) for field and travel support. OC wishes to thank the Auvergne fellowship. The authors acknowledge the thorough reviews of the Field Chief Editor Valerio Acocella and two reviewers whose advice, questions and remarks on this manuscript vastly improved the resulting content. The authors are also grateful to Rosa Anna Corsaro for her constructive suggestions. Matthew Patrick and an reviewer are also acknowledged for their suggestions and feedback on an initial version of this manuscript.
The Supplementary Material for this article can be found online at: https://www.frontiersin.org/articles/10.3389/feart.2020.590411/full#supplementary-material
Acocella, V., and Neri, M. (2003). What makes flank eruptions? The 2001 Etna eruption and its possible triggering mechanisms. Bull. Volcanol. 65 (7), 517–529. doi:10.1007/s00445-003-0280-3
Andronico, D., and Lodato, L. (2005). Effusive activity at Mount Etna volcano (Italy) during the 20th century: a contribution to volcanic hazard assessment. Nat. Hazards 36, 407–443. doi:10.1007/s11069-005-1938-2
Azzaro, R., and Castelli, V. (2013). L’eruzione Etnea del 1669 nelle relazoni giornalistiche contemporanee. Catania: Le Nove Muse Editrice, 232.
Bachèlery, P., Saint-Ange, F., Villeneuve, N., Savoye, B., Normand, A., Le Drezen, E., et al. (2010). “Huge lava flows into the sea and caldera collapse, April 2007, Piton de la Fournaise volcano,” in IAVCEI Third Workshop on Collapse Calderas Abstracts, Volume. France: La Réunion, 73–74.
Barberi, F., Brondi, F., Carapezza, M. L., Cavarra, L., and Murgia, C. (2003). Earthen barriers to control lava flows in the 2001 eruption of Mt. Etna. J. Volcanol. Geoth. Res. 123, 231–243. doi:10.1016/S0377-0273(03)00038-6
Barberi, F., Carapezza, M. L., Valenza, M., and Villari, L. (1993). The control of lava flow during the 1991-1992 eruption of Mt. Etna. J. Volcanol. Geoth. Res. 56, 1–34. doi:10.1016/0377-0273(93)90048-V
Blake, S. (1990). “Viscoplastic Models of Lava Domes,” in Lava Flows and Domes. IAVCEI Proceedings in Volcanology. Editor J. H. Fink (Berlin, Heidelberg: Springer), vol 2. doi:10.1007/978-3-642-74379-5_5
Boivin, P., and Bachèlery, P. (2009). Petrology of 1977 to 1998 eruptions of Piton de la Fournaise, La Réunion Island. J. Volcanol. Geoth. Res. 184, 109–125. doi:10.1016/j.jvolgeores.2009.01.012
Bonaccorso, A., Calvari, S., and Boschi, E. (2015). “Hazard mitigation and crisis management during major flank eruptions at Etna volcano: reporting on real experience,” in Detecting, modelling and responding to effusive eruptions. Editors Harris A.J., L., T. De Groeve, F. Garel, and S., A. Carn (Geological Society, London: Special Publications (IAVCEI) Series), 426, 447–461. doi:10.1144/SP426.4
Bottari, A., Lo Giudice, E., Patanè, G., Romano, R., and Sturiale, C. (1975). L’eruzione etnea del genniao - marzo 1974. Riv. Mineraria Sicil. 154–156, 175–198. doi:10.1007/BF02597773
Branca, S., De Beni, E., Chester, D., Duncan, A., and Lotteri, A. (2017). The 1928 eruption of Mount Etna (Italy): Reconstructing lava flow evolution and the destruction and recovery of the town of Mascali. J. Volcanol. Geoth. Res. 335, 54–70. doi:10.1016/j.jvolgeores.2017.02.002
Branca, S., De Beni, E., and Proietti, C. (2013). The large and destructive 1669 AD eruption at Etna volcano: reconstruction of the lava flow field evolution and effusion rate trend. Bull. Volcanol. 75, 694. doi:10.1007/s00445-013-0694-5 2013
Branca, S., and Del Carlo, P. (2004). Eruptions of Mt. Etna during the past 3,200 years: a revised compilation integrating the historical and stratigraphic records in “Mt. Etna: volcano laboratory”, Geophysical Monograph series 143. Washington, D.C.: American Geophysical Union. doi:10.1029/143GM02
Branca, S., and Ferrara, V. (2013). The morphostructural setting of Mount Etna sedimentary basement (Italy): implications for the geometry and volume of the volcano and its flank instability. Tectonophysics 586, 46–64. doi:10.1016/j.tecto.2012.11.011
Brugger, C., and Hammer, J. (2010). Crystal size distribution analysis of plagioclase in experimentally decompressed hydrous rhyodacite magma. Earth Planet Sci. Lett. 300 (3–4), 246–254. doi:10.1016/j.epsl.2010.09.046
Calvari, S., Coltelli, M., Neri, M., Pompilio, M., and Scribano, V. (1994). The 1991– 93 Etna eruption: chronology and lava flow-field evolution. Acta Vulcanol. 4, 1–4. doi:10.1007/BF00300989
Calvari, S., and Pinkerton, H. (1998). Formation of lava tubes and extensive flow field during the 1991–1993 eruption of Mount Etna. J. Geophys. Res. Solid Earth 103 (B11), 291–301. doi:10.1029/97JB03388
Carn, S. A. (2002). Eruptive and passive degassing of sulphur dioxide at Nyiragongo volcano (D. R. Congo): the 17 January 2002 eruption and its aftermath. Acta Vulcanol. 14 (1–2), 178.
Cashman, K. V., Thornber, C., and Kauahikaua, J. (1999). Cooling and crystallization of lava in open channels, and the transition of pāhoehoe lava to ‘a‘ā. Bull. Volcanol. 61, 306–323. doi:10.1007/s004450050299
Chester, D. K., Duncan, A. M., Dibben, C., Guest, J. E., and Lister, P. H. (1999). Mascali, Mount Etna Region Sicily: example of fascist planning during the 1928 eruption and its continuing legacy. Nat. Hazards 19, 29–46. doi:10.1023/A:1008001003888
Colombrita, R. (1984). Methodology for the construction of earth barriers to divert lava flows: the Mt Etna 1983 eruption. Bull. Volcanol. 47 (4), 1009–1038. doi:10.1007/BF01952358
Coltelli, M., Proietti, C., Branca, S., Marsella, M., Andronico, D., and Lodato, L. (2007). Analysis of the 2001 lava flow eruption of Mt. Etna from three-dimensional mapping. J. Geophys. Res. 112, F02029. doi:10.1029/2006JF000598
Corsaro, R. A., Métrich, N., Allard, P., Andronico, D., Miraglia, L., and Fourmentraux, C. (2009). The 1974 flank eruption of Mount Etna: an archetype for deep dike-fed eruptions at basaltic volcanoes and a milestone in Etna’s recent history. J. Geophys. Res. Solid Earth 114, B07204. doi:10.1029/2008JB006013
Crisci, G. M., Di Gregorio, S., Rongo, R., Scarpelli, M., Spataro, W., and Calvari, S. (2003). Revisiting the 1669 Etnean eruptive crisis using a cellular automata model and implications for volcanic hazard in the Catania area. J. Volcanol. Geoth. Res. 123, 211–230. doi:10.1016/S0377-0273(03)00037-4
De Carolis, C., Lo Giudice, E., and Tonelli, A. (1975). The 1974 etna eruption: Multispectral analysis of skylab images reveals the vegetation canopy as a likely transducer of pre-eruptive volcanic emissions. Bull. Volcanol. 39, 371–384. doi:10.1007/BF02597262
Donato, S., Di Mauro, R., and Puliafito, F. (2009). Catania la citta e le mura : analisi dei processi di formazione e trasformazione della realita urbana di Catania. Reggio Calabria, Italy: Jason Editrice, 139.
Dóniz-Páez, J. (2015). Volcanic geomorphological classification of the cinder cones of Tenerife (Canary Islands, Spain). Geomorphology 228, 432–447. doi:10.1016/j.geomorph.2014.10.004
Downes, M. J. (1974). Sector and oscillatory zoning in calcic Augites from M. Etna, Sicily. Contrib. Mineral. Petrol. 47, 187–196.
Favalli, M., Fornaciai, A., Mazzarini, F., Harris, A., Neri, M., Behncke, B., et al. (2010). Evolution of an active lava flow field using a multitemporal LIDAR acquisition. J. Geophys. Res. 115, B11203. doi:10.1029/2010JB007463
Favalli, M., Fornaciai, A., Nannipieri, L., Harris, A., Calvari, S., and Lormand, C. (2018). UAV-based remote sensing surveys of lava flow fields: a case study from Etna’s 1974 channel-fed lava flows. Bull. Volcanol. 80, 29. doi:10.1007/s00445-018-1192-6 2018
Favalli, M., Karátson, D., Mazzarini, F., Pareschi, M. T., and Boschi, E. (2009a). Morphometry of scoria cones located on a volcano flank: a case study from Mt. Etna volcano (Italy), based on high-resolution LiDAR data. J. Volcanol. Geoth. Res. 186, 320–330. doi:10.1016/j.jvolgeores.2009.07.011
Favalli, M., Fornaciai, A., and Pareschi, M. T. (2009b). LIDAR strip adjustment: application to volcanic areas. Geomorphology 111 (3), 123–135. doi:10.1016/j.geomorph.2009.04.010
Ganci, G., Harris, A. J. L., Del Negro, C., Guehenneux, Y., Cappello, A., et al. (2012). A year of lava fountaining at Etna: volumes from SEVIRI. Geophys. Res. Lett. 39, L06305. doi:10.1029/2012GL051026
Giordano, D., Russell, J. K., and Dingwell, D. (2008). Viscosity of magmatic liquids: a model. Earth Planet Sci. Lett. 271, 123–134. doi:10.1016/j.epsl.2008.03.038
Global Volcanism Program, (2013). in Volcanoes of the World. Smithsonian Institution. Editor E Venzke, 4.8, 8. doi:10.5479/si.GVP.VOTW4-2013
Global Volcanism Program, (1977a). “Report on Nyiragongo (DR Congo),”. Natural Science Event Bulletin Editor D. Squires Washington, D.C.: Smithsonian Institution, 2, 3. doi:10.5479/si.GVP.NSEB197703-223030
Global Volcanism Program, (1977b). “Report on Piton de la Fournaise (France),”. Natural Science Event Bulletin Editor D. Squires Washington, D.C.: Smithsonian Institution, 2, 4. doi:10.5479/si.GVP.NSEB197704-233020
Global Volcanism Program, (1986). “Report on Piton de la Fournaise (France),”. Scientific Event alert network Bulletin Editor L. McClelland Washington, D.C.: Smithsonian Institution, 11, 3. doi:10.5479/si.GVP.SEAN198603-233020
Guerra, I., Lo Bascio, A., Luongo, G., and Scarpa, R. (1976). Seismic activity accompanying the 1974 eruption of Mt. Etna. J. Volcanol. Geoth. Res. 1, 347–362. doi:10.1016/0377-0273(76)90024-X
Guest, J. E., Kilburn, C. R. J., Pinkerton, H., and Duncan, A. M. (1987). The evolution of lava flow fields: observations of the 1981 and 1983 eruptions of Mount Etna, Sicily. Bull. Volcanol. 49, 527–540. doi:10.1007/BF01080447
Guest, J. E., Spudis, P. D., Greeley, R., Taylor, G. J., and Baloga, S. M. (1995). Emplacement of xenolith nodules in the Kaupulehu lava flow, Hualalai Volcano, Hawaii. Bull. Volcanol. 57, 179–184. doi:10.1007/BF00265037
Guest, J. E., Huntingdon, A. T., Wadge, G., Brander, J. L., Booth, B., Carter, S., et al. (1974). Recent eruption of Mount Etna. Nature 250, 385–387. doi:10.1038/250385a0
Gurioli, L., Colo’, L., Bollasina, A. J., Harris, A. J. L., Whittington, A., et al. (2014). Dynamics of Strombolian explosions: Inferences from field and laboratory studies of erupted bombs from Stromboli volcano. J. Geophys. Res. Solid Earth 119, 319–345. doi:10.1002/2013JB010355
Harris, A. J. L., and Allen, J., S. (2008). One-, two- and three-phase viscosity treatments for basaltic lava flows. J. Geophys. Res.: Solid Earth 113, 1–15. doi:10.1029/2007JB005035
Harris, A. J. L., Dehn, J., and Calvari, S. (2007). Lava effusion rate definition and measurement: a review. Bull. Volcanol. 70 (1), 159. doi:10.1007/s00445-007-0120-y
Harris, A. J. L., Favalli, M., Mazzarini, F., and Hamilton, C., W. (2009). Construction dynamics of a lava channel. Bull. Volcanol. 71, 459–474. doi:10.1007/s00445-008-0238-6
Harris, A. J. L., Favalli, M., Wright, R., and Garbeil, H. (2011). Hazard assessment at Mount Etna using a hybrid lava flow inundation model and satellite-based land classification. Nat. Hazards 58, 1001–1027. doi:10.1007/s11069-010-9709-0
Harris, A. J. L., Murray, J. B., Aries, S. E., Davies, M. A., Flynn, F. P., Wooster, M. J., et al. (2000). Effusion rate trends at Etna and Krafla and their implications for eruptive mechanisms. J. Volcanol. Geoth. Res. 102 (3–4), 237–269. doi:10.1016/S0377-0273(00)00190-6
Harris, A. J. L., and Neri, M. (2002). Volumetric observations during paroxysmal eruptions at Mount Etna: pressurized drainage of a shallow chamber or pulsed supply?. J. Volcanol. Geoth. Res. 116, 79–95. doi:10.1016/S0377-0273(02)00212-3
Harris, A. J. L., and Rowland, S., K. (2009). “Effusion rate controls on lava flow length and the role of heat loss: a review,”. Studies in Volcanology: the legacy of George Walker Editors T. Thordarson, S. Self, G. Larsen, S., K. Rowland, and A. Hoskuldsson London: Special Publications of IAVCEI, 2, 33–51.
Harris, A. J. L., and Rowland, S. (2001). FLOWGO: a kinematic thermo-rheological model for lava flowing in a channel. Bull. Volcanol. 63, 20–44. doi:10.1007/s004450000120
Harris, A. J. L., Steffke, A., Calvari, S., and Spampinato, L. (2012). Correction to “Thirty years of satellite-derived lava discharge rates at Etna: implications for steady volumetric output”. J. Geophys. Res. Solid Earth 117, B08207. doi:10.1029/2012JB009431
Harris, A. J. L. (2015). “Basaltic lava flow hazard”, in Volcanic hazards, risks, and Disasters. New York: Elsevier, 17–46. doi:10.1016/B978-0-12-396453-3.00002-2
Higgins, M. D. (2000). Measurement of crystal size distributions. Am. Mineral. 85, 1105–1116. doi:10.2138/am-2000-8-901
Higgins, M. D., and Roberge, J. (2007). Three magmatic components in the 1973 eruption of Eldfell volcano, Iceland: Evidence from plagioclase crystal size distribution (CSD) and geochemistry. J. Volcanol. Geoth. Res. 161 (3), 247–260. doi:10.1016/j.jvolgeores.2006.12.002
Higgins, M. D. (1999). Origin of megacrysts in granitoids by textural coarsening: a crystal size distribution (CSD) study of microcline in the Cathedral Peak Granodiorite, Sierra Nevada, California. Geol. Soc., 168, 207–219. doi:10.1144/GSL.SP.1999.168.01.14
Houghton, B. F., and Wilson, C. (1989). A vesicularity index for pyroclastic deposits. Bull. Volcanol. 51, 451–462. doi:10.1007/BF01078811
Hulme, G. (1974). The interpretation of lava flow morphology. Geophys. J. R. Astron. Soc. 39, 361–383. doi:10.1111/j.1365-246X.1974.tb05460.x
ISTAT (2008). Demografia in cifre. Roma, Italy: Istituto Nazionale di Statistica http://demo.istat.it/.
Jeffreys, H. (1925). Flow of water in an inclined channel of rectangular section. Philos. Mag. J. Sci. 49, 793–807.
Kauahikaua, J., Cashman, K. V., Clague, D. A., Champion, D., and Hagstrum, J. T. (2002). Emplacement of the most recent lava flows on Hualalai Volcano, Hawai‘i. Bull. Volcanol. 64, 229–253. doi:10.1007/s00445-001-0196-8
Kilburn, C. R. J., and Guest, J. E. (1993). ‘A’ a lavas of Mount Etna, Sicily, in Active lava. London: UCL Press, 73–106.
Komorowski, J. C., and Tedesco, D. (2004). The January 2002 flank eruption of Nyiragongo volcano (Democratic Republic of Congo): chronology, evidence for a tectonic rift trigger, and impact of lava flows on the city of Goma. Acta Vulcanol. 14, 29–64. doi:10.1007/s00445-008-0232-z
La Spina, G., Burton, M., de’ Michieli Vitturi, M., and Arzilli, F. (2016). Role of syn-eruptive plagioclase disequilibrium crystallization in basaltic magma ascent dynamics. Nat. Commun. 7 (13402). doi:10.1038/ncomms13402
Lautze, N. C., Harris, A. J. L., Bailey, J. E., Ripepe, M., Calvari, S., Dehn, J., et al. (2004). Pulsed lava effusion at Mount Etna during 2001. J. Volcanol. Geoth. Res. 137 (1–3), 231–246. doi:10.1016/j.jvolgeores.2004.05.018
Lipman, P. W., and Banks, N. G. (1987). Aa flow dynamics, Mauna Loa. USSG Prof. Pap. 1350, 1527–1567.
Llewellin, E. W., and Manga, M. (2005). Bubble suspension rheology and implications for conduit flow. J. Volcanol. Geoth. Res. 143 (1–3), 205–217. doi:10.1016/j.jvolgeores.2004.09.018
Macdonald, G. A. (1962). The 1959 and 1960 eruptions of Kilauea volcano, Hawaii, and the construction of walls to restrict the spread of the lava flows. Bull. Volcanol. 24, 249–294. doi:10.1007/BF02599351
Mader, H. M., Llewellin, E. W., and Mueller, S. P. (2013). The rheology of two-phase magmas: a review and analysis. J. Volcanol. Geoth. Res. 257, 135–158. doi:10.1016/j.jvolgeores.2013.02.014
Maron, S. H., and Pierce, P. E. (1956). Application of Ree-Eyring generalized flow theory to suspensions of spherical particles. J. Colloid Sci. 11, 80–95. doi:10.1016/0095-8522(56)90023-X
Mazzarini, F., Pareschi, M. T., Favalli, M., Isola, I., and Tarquini, S. (2005). Morphology of basaltic lava channels during the Mt. Etna September 2004 eruption from airborne laser altimeter data. Geophys. Res. Lett. 32, L04305. doi:10.1029/2004GL021815
Moore, H. J. (1987). Preliminary estimates of the rheological properties of 1984 Mauna Loa lava. UGSG Prof. Pap. 1350, 1569–1588.
Morgan, D. J., and Jerram, D. A. (2006). On estimating crystal shape for crystal size distribution analysis. J. Volcanol. Geoth. Res. 154 (1–2), 1–7. doi:10.1016/j.jvolgeores.2005.09.016
Morrison, A. A., Whittington, A. G., Smets, B., Kervyn, M., and Sehlke, A. (2020). The rheology of crystallizing basaltic lavasfrom Nyiragongo and Nyamuragira volcanoes. D.R.C. Volcanica 3 (1), 1–28. doi:10.30909/vol.03.01.0128
Murray, J. B., and Stevens, N. F. (2000). New formulae for estimating lava flow volumes at Mt. Etna Volcano, Sicily. Bull. Volcanol. 61, 515–526. doi:10.1007/s004450050002
Naranjo, J. A., Sparks, R. S. J., Stasiuk, M. V., Moreno, H., and Ablay, G. J. (1992). Morphological, structural and textural variations in the 1988–1990 andesite lava of Lonquimay Volcano, Chile. Geol. Mag. 129 (6), 657–678. doi:10.1017/S0016756800008426
Neal, C., A., Brantley, S., R., Antolik, L., Babb, J.L., Burgess, M., et al. (2019). The 2018 rift eruption and summit collapse of Kīlauea Volcano. Science 363 (6425), 367–374. doi:10.1126/science.aav7046
Neri, M., Acocella, V., Behncke, B., Giammanco, S., Mazzarini, F., and Rust, D. (2011). Structural analysis of the eruptive fissures at Mount Etna (Italy). Ann. Geophys. 54, 5. doi:10.4401/ag-5332
Neri, M., Acocella, V., Behncke, B., Maiolino, V., Ursino, A., and Velardita, R. (2005). Contrasting triggering mechanisms of the 2001 and 2002–2003 eruptions of Mount Etna (Italy). J. Volcanol. Geoth. Res. 114 (1–4), 235–255. doi:10.1016/j.jvolgeores.2004.11.025
Pagnano, G. (1992). Il disegno dell difese: L’eruzione del 1669 e il riassetto delle fortificazioni di Catania. C.U.E.C.M. (Catania, Italy), 224.
Patanè, D., Barberi, G., Cocina, O., De Gori, P., and Chiarabba, C. (2006). Time-resolved seismic tomography detects magma intrusions at Mount Etna. Science 313, 821–823. doi:10.1126/science.1127724
Phan-Thien, N., and Pham, D. C. (1997). Differential multiphase models for polydispersed suspensions and particulate solids. J. Non Newt. Fluid Mech. 72, 305–318. doi:10.1016/S0377-0257(97)90002-1
Pinkerton, H., and Sparks, R. S. J. (1978). Field measurements of the rheology of lava. Nature 276, 383–385. doi:10.1038/276383a0
Pompilio, M., Trigila, R., and Zanon, V. (1998). Melting experiments on Mt. Etna lavas: I - the calibration of an empirical geothermometer to estimate the eruptive temperature. Acta Vulcanol. 10, 67–75.
Proietti, C., Coltelli, M., Marsella, M., Martino, M., Scifoni, S., and Giannone, F. (2020). Towards a satellite-based approach to measure eruptive volumes at Mt. Etna using Pleiades datasets. Bull. Volcanol. 82, 35. doi:10.1007/s00445-020-01374-8
Rhéty, M., Harris, A., Villeneuve, N., Gurioli, L., Médard, E., Chevrel, O., et al. (2017). A comparison of cooling-limited and volume-limited flow systems: Examples from channels in the Piton de la Fournaise April 2007 lava-flow field. Geochem. Geophys. Geosyst 18, 178. doi:10.1002/2017GC006839
Richter, N., Favalli, M., De Zeeuw-van Dalfsen, E., Fornaciai, A., Da Silva, R., M., Pérez, N., M., et al. (2016). Lava flow hazard at Fogo volcano, Cabo Verde, before and after the 2014–2015 eruption. Nat. Hazards Earth Syst. Sci. 16, 1925–1951. doi:10.5194/nhess-16-1925-2016
Riker, J. M., Cashman, K. V., Kauahikaua, J. P., and Montierth, C. M. (2009). The length of channelized lava flows: insight from the 1859 eruption of Mauna Loa Volcano, Hawaii. J Volcanol Geotherm Res 183, 139–156. doi:10.1016/j.jvolgeores.2009.03.002
Robert, B., Harris, A., Gurioli, L., Médard, E., Sehlke, A., and Whittington, A. (2014). Textural and rheological evolution of basalt flowing down a lava channel. Bull. Volcanol. 76, 824. doi:10.1007/s00445-014-0824-8
Roult, G., Peltier, A., Taisne, B., Staudacher, T., Ferrazzini, V., and Di Muro, A. (2012). A new comprehensive classification of the Piton de la Fournaise eruptions spanning the 1986-2011 period. Search and analysis of eruption precursors from a broad-band seismological station. J. Volcanol. Geotherm. Res. 241–242, 78–140. doi:10.1016/j.jvolgeores.2012.06.012
Ryerson, F. J., Weed, H. C., and Piwinskii, A. J. (1988). Rheology of subliquidus magmas: 1. Picritic compositions. J. Geophys. Res.: Solid Earth 93 (B4), 3421–3436. doi:10.1029/JB093iB04p03421
Solana, M. C., Calvari, S., Kilburn, C. R. J., Gutierrez, H., and Chester, D. (2017). “Supporting the development of Procedures for Communications during volcanic Emergencies: Lessons Learnt from the canary Islands (Spain) and Etna and Stromboli (Italy),” in Observing the Volcano World. Advances in Volcanology (an official Book Series of the International association of Volcanology and Chemistry of the Earth’s Interior – IAVCEI. Editors C. J. Fearnley, D. K. Bird, K. Haynes, W. J. McGuire, and G. Jolly Barcelona, Spain: Springer. doi:10.1007/11157_2016_48
Solaro, G., Acocella, V., Pepe, S., Ruch, J., Neri, M., and Sansosti, E. (2010). Anatomy of an unstable volcano from InSAR: multiple processes affecting flank instability at Mt. Etna, 1994–2008. J. Geophys. Res.: Solid Earth 115 (B10). doi:10.1029/2009JB000820
Sparks, R. S. J., and Pinkerton, H. (1978). Effect of degassing on rheology of basaltic lava. Nature 276, 385–386.
Sparks, R. S. J., Pinkerton, H., and Hulme, G. (1976). Classification and formation of lava levees on Mount Etna, Sicily. Geology 4, 269–271. doi:10.1130/0091-7613(1976)4%3C269:CAFOLL%3E2.0.CO;2
Staudacher, T., Ferrazzini, V., Peltier, A., Kowalski, P., Boissier, P., Catherine, P., et al. (2009). The April 2007 eruption and the Dolomieu crater collapse, two major events at Piton de la Fournaise (La Réunion Island, Indian Ocean). J. Volcanol. Geoth. Res. 184, 126–137. doi:10.1016/j.jvolgeores.2008.11.005
Tanguy, J., C., and Kieffer, G. (1976). The 1974 Eruption of Mount Etna. Bull. Volcanol. 40 (4), 239–252. doi:10.1007/BF02597566
Tanguy, J. C. (1973). The 1971 Etna eruption: petrology of the lavas. Philos. Trans. R. Soc. London, Ser. A B 274, 45–53. doi:10.1098/rsta.1973.0024
Tazieff, H. (1977). An exceptional eruption: Mt. Niragongo, Jan. 10th, 1977. Bull. Volcanol. 40 (3), 189–200. doi:10.1007/BF02596999
Tazieff, H. (1974). Card 1791, 06/1974Bulletin of the global volcanic network. Washington DC: Smithsonian Institution.
Tedesco, D., Vaselli, O., Papale, P., Carn, S.A., Voltaggio, M., et al. (2007). January 2002 volcano-tectonic eruption of Nyiragongo volcano, Democratic Republic of Congo. J. Geophys. Res. 112, B09202. doi:10.1029/2006JB004762
Tibaldi, A., and Groppelli, G. (2002). Volcano-tectonic activity along structures of the unstable NE flank of Mt. Etna (Italy) and their possible origin. J. Volcanol. Geoth. Res. 115 (3–4), 277–302. doi:10.1016/S0377-0273(01)00305-5
Truby, J. M., Mueller, S. P., Llewellin, E. W., and Mader, H. M. (2015). The rheology of three-phase suspensions at low bubble capillary number. Proc. R. Soc. A 471, 20140557. doi:10.1098/rspa.2014.0557
Ubide, T., and Kamber, B. S. (2018). Volcanic crystals as time capsules of eruption history. Nat. Commun. 9, 326. doi:10.1038/s41467-017-02274-w
Ubide, T., Mollo, S., Zhao, J., Nazzari, M., and Scarlato, P. (2019). Sector-zoned clinopyroxene as a recorder of magma history, eruption triggers, and ascent rates. Geochem. Cosmochim. Acta 251, 265–283. doi:10.1016/j.gca.2019.02.021
Wadge, G. (1976). Deformation of Mount Etna, 1971–1974. J. Volcanol. Geoth. Res. 1, 237–263. doi:10.1016/0377-0273(76)90010-X
Wadge, G., Horsfall, J.A., C., and Brander, J., L. (1975). Tilt and strain monitoring of the 1974 eruption of Mount Etna. Nature 254, 516–517.
Wadge, G., and Lopes, R. M. C. (1991). The lobes of lava flows on Earth and Olympus Mons, Mars. Bull. Volcanol. 54, 10–24. doi:10.1007/BF00278203
Wadge, G. (1981). The variation of magma discharge during basaltic eruptions. J. Volcanol. Geoth. Res. 11, 139–168. doi:10.1016/0377-0273(81)90020-2
Walker, G. P. L. (1967). Thickness and viscosity of Etnean lavas. Nature 213, 484–485. doi:10.1038/213484a0
Walker, G. P. L. (1973). Mount Etna and the 1971 eruption - lengths of lava flows. Phil. Transact. Royal Soc. London Ser. A 274 (1238), 107–118. doi:10.1098/rsta.1973.0030
Wilmoth, R. A., and Walker, G. (1993). P-type and S-type pahoehoe: a study of vesicle distribution patterns in Hawaiian lava flows. J. Volcanol. Geoth. Res. 55, 129–142. doi:10.1016/0377-0273(93)90094-8
Wilson, L., and Head, J. W. (2002). Tharsis-radial graben systems as the surface manifestation of plume-related dike intrusion complexes: models and implications. J. Geophys. Res. 107 (E8), 5057. doi:10.1029/2001JE001593
Keywords: Mount Etna, low flank eruptions, lava channel, lava flow morphology, rheology, effusion rate, volume-limited flow, volcanic hazards
Citation: Lormand C, Harris AJL, Chevrel MO, Calvari S, Gurioli L, Favalli M, Fornaciai A and Nannipieri L (2020) The 1974 West Flank Eruption of Mount Etna: A Data-Driven Model for a Low Elevation Effusive Event. Front. Earth Sci. 8:590411. doi: 10.3389/feart.2020.590411
Received: 01 August 2020; Accepted: 02 November 2020;
Published: 22 December 2020.
Edited by:
Aaron J. Pietruszka, University of Hawaii, United StatesReviewed by:
Oleg E. Melnik, Lomonosov Moscow State University, RussiaCopyright © 2020 Lormand, Harris, Chevrel, Calvari, Gurioli, Favalli, Fornaciai and Nannipieiri. This is an open-access article distributed under the terms of the Creative Commons Attribution License (CC BY). The use, distribution or reproduction in other forums is permitted, provided the original author(s) and the copyright owner(s) are credited and that the original publication in this journal is cited, in accordance with accepted academic practice. No use, distribution or reproduction is permitted which does not comply with these terms.
*Correspondence: Charline Lormand, Y2hhcmxpbmUubG9ybWFuZEBnbWFpbC5jb20=
†Present address: Charline Lormand, Volcanic Risk Solutions, Massey University, Palmerston, New Zealand
Disclaimer: All claims expressed in this article are solely those of the authors and do not necessarily represent those of their affiliated organizations, or those of the publisher, the editors and the reviewers. Any product that may be evaluated in this article or claim that may be made by its manufacturer is not guaranteed or endorsed by the publisher.
Research integrity at Frontiers
Learn more about the work of our research integrity team to safeguard the quality of each article we publish.