- Istituto Nazionale di Geofisica e Vulcanologia, Osservatorio Etneo, Catania, Italy
Infrasonic signals investigation plays a fundamental role for both volcano monitoring purpose and the study of the explosion dynamics. Proper and reliable detection of weak signals is a critical issue in active volcano monitoring. In particular, in volcanic acoustics, it has direct consequences in pinpointing the real number of generated events (amplitude transients), especially when they exhibit low amplitude, are close in time to each other, and/or multiple sources exist. To accomplish this task, several algorithms have been proposed in literature; in particular, to overcome limitations of classical approaches such as short-time average/long-time average and cross-correlation detector, in this paper a subspace-based detection technique has been implemented. Results obtained by applying subspace detector on real infrasound data highlight that this method allows sensitive detection of lower energy events. This method is based on a projection of a sliding window of signal buffer onto a signal subspace that spans a collection of reference signals, representing similar waveforms from a particular infrasound source. A critical point is related to subspace design. Here, an empirical procedure has been applied to build the signal subspace from a set of reference waveforms (templates). In addition, in order to determine detectors parameters, such as subspace dimension and detection threshold, even in presence of overlapped noise such as infrasonic tremor, a statistical analysis of noise has been carried out. Finally, the subspace detector reliability and performance, have been assessed by performing a comparison among subspace approach, cross-correlation detector and short-time average/long-time average detector. The obtained confusion matrix and extrapolated performance indices have demonstrated the potentiality, the advantages and drawbacks of the subspace method in tracking volcanic activity producing infrasound events. This method revealed to be a good compromise in detecting low-energy and very close in time events recorded during Strombolian activity.
Introduction
Amplitude transient detection plays a fundamental role in volcano monitoring, allowing counting amplitude transients, identifying amplitude and occurrence rate variations. Besides, it is an essential step to localize seismic sources and their possible migration, which could be related to changes in volcano state and dynamics.
Classical methods for signal detection in seismology and volcano-seismology are grouped into two main categories: energy and correlation detectors. The former, called incoherent energy detectors, include algorithms searching for signals which are not or poorly known, such as STA/LTA (short-time average/long-time average) algorithm (Allen, 1978; Trnkoczy, 2012). These techniques, routinely used in volcano seismology, need no data pre-processing, beside the filtering applied to identify the desired signals, such as volcano-tectonic (VT) earthquakes or long period (LP) events. This approach suffers from high rate of false alarms or even of missed detections, due mainly to the background noise strongly affecting the reliability of this technique. This is especially true on active volcanoes with continuous volcanic tremor, which could dramatically reduce the signal (intended as the amplitude transients) to noise ratio. The latter group, correlation detectors, consists of algorithms based on the cross-correlation between a known waveform and the continuously recorded signal. These algorithms are very sensitive, give low false alarm rate but have the disadvantage of being able to detect only signals which are very similar to the template waveform, which in turn needs to be well known (Withers et al., 1999; Gibbons et al., 2007). In volcano acoustics, similar techniques (e.g., Cannata et al., 2013a; Cannata et al.,2013b; Thompson, 2015; Hotovec-Ellis and Jeffrines, 2016; Matoza et al., 2019a; Senobari et al., 2019), or methods making use of advanced signal processing techniques (Bueno et al., 2019), are implemented to identify and extract amplitude transients from the real-time streaming of signals, that characterize explosive or degassing activity. In particular, energy detectors, such as STA/LTA, are efficient algorithms when multiple infrasound sources are active (as at multi-vent volcanoes) and exhibit space-time variations, while correlation detectors are a powerful tool when we want to identify amplitude transients produced by a single and/or stable infrasound source in order to study its physical properties (Montalto et al., 2010; Sciotto et al., 2013; Cannata et al., 2013a; Hotovec-Ellis and Jeffrines, 2016; Yokoo et al., 2019).
Subspace-based detectors overcome the aforementioned limitation, in that they operate a comparison between the continuous signal and a set of reference waveforms hereafter called templates (Harris, 2006). One of the strong points of this method is the assumption on noise statistical features: it is supposed to be uncorrelated zero-mean gaussian noise. Signals acquired on active volcanoes generally are affected by band overlapped noise (e.g., volcanic tremor and volcanic infrasound tremor; e.g., Cannata et al., 2013b; Cannavò et al., 2019). In the light of it, without loss of generality, well known sources of noise, like infrasound tremor, can be preventively filtered. While in correlation detectors the waveform is a single template or a stacked waveform (Gibbons and Ringdal, 2006), in the subspace approach the designed set of templates is built by means of the Singular Value Decomposition (SVD) of a matrix whose columns are a variable number of templates. Subspace methods have been carried out mainly in seismology, where they have been applied for earthquakes tracking, especially in case of aftershock sequences (Harris and Dodge, 2011; McMahon et al., 2017), as well as to identify low-frequency earthquakes in non-volcanic tremor (Maceira et al., 2010).
Volcano acoustic plays a fundamental role for both monitoring purpose and the study of the explosion dynamics and revealed to be a reliable tool to characterize eruptive activity and shed a light into the shallow plumbing structure system at Etna (Cannata et al., 2013a; Sciotto et al., 2013, Spina et al., 2015; Cannavò et al., 2019; Sciotto et al., 2019). Proper detection of signal of interest is a crucial, and at the same time critical, issue in volcano seismology, in that it allows extracting and collecting amplitude transient waveforms (events), which are therefore analyzed to provide information about spectral content and source location. In particular, in volcano monitoring, events detection has direct consequences in pinpointing the real number of generated events and identifying amplitude and occurrence rate variations. This information can be of support to follow the explosive activity and to improve the assessment of volcanic activity. This is particularly true on Etna, where multiple open-conduit vents exist, whose activity often consists of persistent Strombolian explosions, producing low amplitude and very close in time infrasound events. In order to accomplish the detection task, several algorithms have been proposed in literature; in particular, to overcome limitations of classical approaches such as short-time average/long-time average and cross-correlation detector, in this paper a subspace-based detection technique has been implemented.
In this paper, we attempt to clear the way to the application of subspace detection method in volcano-acoustics, previously investigated in Sciotto et al., (2011) in a preliminary study, comparing its performance with correlation and STA/LTA detectors. In particular, we test this technique on signals recorded by the infrasound permanent network deployed at Mt. Etna, which represents an ideal dataset to lead tests on this matter. Indeed, infrasound activity at Mt. Etna is almost continuous, and is also characterized by both discrete amplitude transients and continuous tremor, produced by several summit craters and eruptive fractures often opening on the flanks of the summit cones. Moreover, the infrasound signals are generated by different source mechanisms related to explosive activity, such as Strombolian activity and lava fountaining, as well as to degassing phenomena (Cannata et al., 2013a; Sciotto et al., 2013; Spina et al., 2015; Sciotto et al., 2019). Therefore, in a multi-vent and open-conduit volcano such as Mt. Etna, where volcanic activity is almost persistent and prone to eruptive fracture opening, infrasound signal can consist of a superposition of signals from different time-variant and stationary infrasound sources. If on the one hand each infrasound source is repetitive, on the other hand it can undergo modifications in time. In these cases, correlation detector may fail in detection of the variation in infrasound waveforms caused by these factors. Subspace detector is supposed to accomplish these two tasks: high sensibility and high flexibility.
Data and Method
For the purpose of subspace-based detection implementation, theory of detection problem is first introduced. Successively subspace approach is explained and an empirical procedure used to build and design signal subspace described. Other two sub-sections are dedicated to discuss the statistical analysis of noise related to parameter estimation, both for subspace, correlation and STA/LTA detectors.
Subspace Detection Problem
Detectors usually implement a binary hypothesis test on the presence or absence of the signal of interest in a data observation window (Van Trees, 1968). In particular, the test is aimed to choose between the null hypothesis H0, where noise only is present, and the alternative hypothesis H1, where both the signal of interest and noise are present.
where x[n] is the n-long window of continuous data, s is the signal of interest and η is the background noise assumed zero-mean Gaussian and temporally and spatially uncorrelated. In general, considering a multi-channel data acquisition, if Nt is the number of samples of observation window and Nc is the total number of data channel streams, the total number of samples N of a multiplexed data stream vector x[n] is:
In our framework, infrasound sensor acquires only one channel, so in Eq. 3
Signal s in Eq. 2 is assumed deterministic and dependent on a vector of an unknown parameters a and expressed by unknown linear combination of a basis waveform:
where U is a
where I is
Under these assumptions, the probability densities function (pdf) for the recorded data under the null hypothesis
while, under the null hypothesis of
As formulated by Harris (2006), the detection rule is a likelihood ratio test comparing the probability that the observed data are due to signal and noise to the probability that they are due to noise alone:
using Eqs. 6, 7, the likelihood ratio test expressed in Eq. 8 can be rewritten as a Generalized Likelihood Ratio Test (GLRT; Van Trees, 1968):
Using natural logarithm, Eq. 9 can be rewritten as:
where
and
The generalized likelihood ratio test (Eq. 9) detects an event of interest if the generalized log likelihood ratio (Eq. 10) exceeds a certain threshold
Considering the subspace detection statistics
where
This matrix has peculiar characteristics, which are described in the Template Matrix, and consists of templates, representing previously observed events of interest, and is a fundamental tool for building the subspace. The number and type of templates needed to build the matrix depends on detector design. Signal subspace is the core of the algorithm, since it is the vector subspace used to represent the reference templates to be found into the signal. In order to extract orthonormal bases, Singular Value Decomposition (SVD) is applied to the template matrix, and then the dimension of the subspace is chosen. The dimension determines the amount of energy that the subspace is able to capture. Once the SVD is applied, d singular values are used to build the subspace (Eqs. 4, 11). A few approaches have been implemented in literature to set this parameter, aiming to gain a compromise between detecting weak and less represented events (characterized by waveforms quite different from the reference templates) and having low false alarm or loss of significant events. In this paper, following Harris (2006), we selected the dimension parameter by means of an empirical approach making use of two different graphs as explained in Subspace Design.
Regarding the definition of the threshold
where
Dataset
In order to design a dataset for the analysis, we chose a 1-h-long time interval (13:30–14:30 of May 30, 2019) of infrasound continuous signal recorded at EMFO station. This station belongs to the Infrasound Permanent Network run by Istituto Nazionale di Geofisica e Vulcanologia (INGV), is equipped with a GRAS 40AN microphone with a flat response at a sensitivity of 50 mV/Pa in the frequency range of 0.3–20,000 Hz and sampling rate of 50 Hz, and is located about 8 km far from Etna summit craters and about seven from the eruptive fracture (Figure 1). This station, together to ESLN (which is deployed at about the same distance from the summit area), was the only station able to record the explosive activity, is one of the less noisy stations among the permanent network, and, if compared with summit stations (located at higher altitude) is less affected by wind noise that can hide weak amplitude transients.
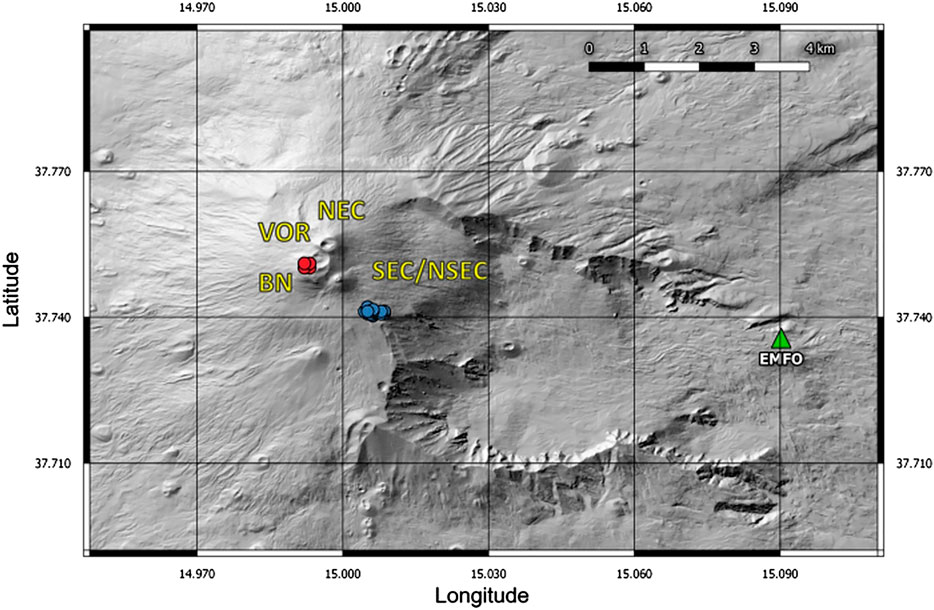
FIGURE 1. Digital elevation model of Etna (Tarquini et al., 2007) with the location of the infrasonic station used in this work (green triangle EMFO), summit crater acronyms (VOR, Voragine; BN, Bocca Nuova; NEC, North-East Crater; SEC, South-East Crater; NSEC, New South-East Crater), infrasonic tremor source locations (red circles) and infrasonic event source locations (blue circles).
Signal buffer is characterized by infrasound events generated by an intense Strombolian activity that occurred at an eruptive fracture opened southeast of New Southeast Crater on the firsts hours of May 30, 2019 (here after NSEC, INGV-OE Internal Report, 2019). Here lava flows, ash emission, Strombolian and spattering activity took place. Explosive activity produced infrasound amplitude transients characterized by most of energy in the band 2.5–10 Hz, which are identifiable in the spectrogram from about 07:00 UTC, and with amplitude varying in a wide range (Figure 2). From about 14:00 UTC infrasonic activity at this fracture became more energetic, explosion generated infrasound events were more energetic and very close in time (Figure 2). Higher amplitude infrasonic events were detected and located by the real-time automatic system in force at INGV-OE (INGV-OE Internal Report, 2019) in correspondence of the eruptive fracture, as shown by blue circles in Figure 1.
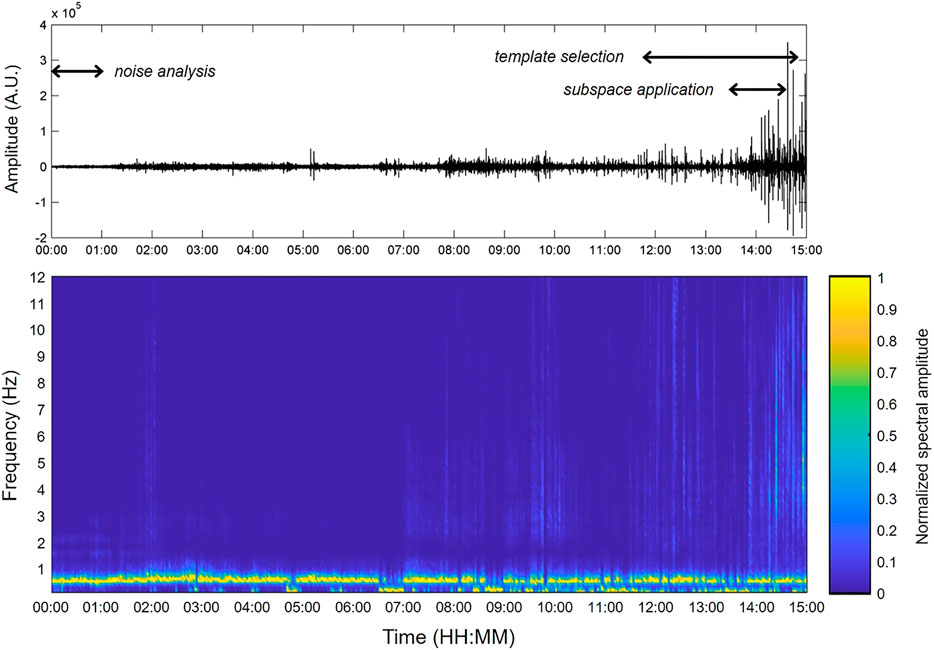
FIGURE 2. Infrasound signal recorded at EMFO station on May 30, 2019 including the three buffers took into account in this work for statistical parameter estimation (00:00 -01:00), templates selection (12:00 -15:00) and subspace detector application (13:30 -14:30) (top) and normalized spectrogram, where spectra are averaged in 2-min-long windows (bottom).
In addition to infrasound events from the eruptive fracture, an overload continuous low frequency infrasonic tremor (∼0.6 Hz, Figure 2), whose source was located at Bocca Nuova crater (BN; red circles in Figure 1), was recorded. These characteristics make the dataset particularly useful to be used as test for an automatic detection algorithm. In particular, the chosen signal is suitable for verifying the subspace capability to detect the maximum number of infrasound events, especially of low amplitude ones, and to compare its performance with other detection algorithms. Furthermore, it allows us to verify this triggering technique in presence of noise, which is represented by the overlying low frequency infrasonic tremor.
Subspace Algorithm Implementation
The subspace algorithm for event detection needs several key steps to be accomplished in order to be efficiently implemented, which are examined in following subsections and are summarized as follows:
• events of interest selection and pre-processing of template matrix (Template Matrix);
• statistical analysis of noise aiming to choose the threshold value (Subspace Design);
• subspace design (SVD and setting up of required parameters for subspace building) (Threshold Setting).
Three buffers of infrasound signal were selected for subspace method application (Figure 2): 1) a 1 h-long time interval of signal consisting of background noise, and with no infrasound events, recorded during the same day of the dataset of analysis, to carry out statistical parameter estimation (00:00–01:00 of May 30, 2019; all times are in GMT); 2) a 3 h-long time interval of signal characterized by infrasound events of interest, for waveform templates selection (12:00–15:00 of May 30, 2019); and 3) 1 h-long time interval to test the subspace detector and searching for events of interest (13:30–14:30 of May 30, 2019).
We performed a first test by detrending and filtering each signal window between 1 and 10 Hz, to get rid of noise such as wind and low frequency tremor generated by a second infrasound source (Figures 1, 2), and set to zero mean and unit variance. A second test was performed by filtering signal between 0.5 and 10 Hz, in order to include the low frequency infrasonic tremor, and verify its influence on the detection.
Template Matrix
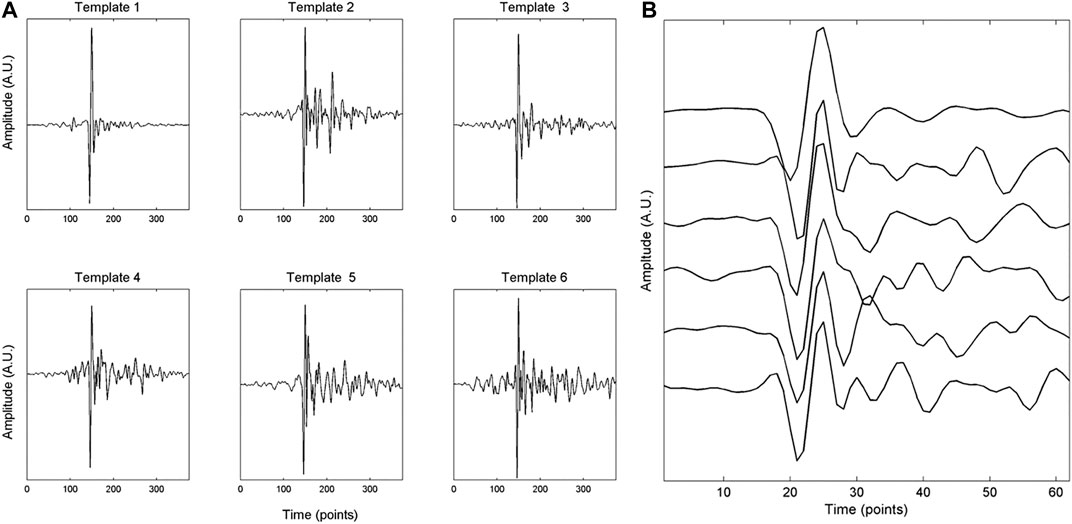
Building the template matrix is the preparatory step for subspace design. The template matrix is thought to consist of events of interest we are searching into the continuous signal. These can be manually selected, or, for a more robust procedure, waveforms can be automatically detected by a trigger algorithm (Maceira et al., 2010; Song et al., 2014). We made use of this last approach, and first triggered the events by means of STA/LTA energy detector. Secondly, we applied waveform cross-correlation, choosing an appropriate threshold, and selected the first event of each family, related to the infrasound source of interest (Figure 3A) in which the events were grouped. Once extracted, waveforms were aligned (Figure 3B); the algorithm has been designed to allow the operator to choose the alignment method. Waveforms can be aligned based on maximum or minimum amplitude value, or by means of manual picking. Successively, they were placed as columns in the template matrix.
Subspace Design
Signal subspace (U in Eq. 4) is the vector subspace used to represent the reference templates we want to find into continuous signal. The SVD provides the singular values allowing to build the subspace of the signal, that is a low-dimension representation of signal. Meaning of the dimension of subspace relies in the amount of energy that it is able to capture, and hence in the degree of waveform variation the algorithm is capable to detect. A few approaches have been implemented in literature (e.g., Harris, 2006; Song et al., 2014) to set this parameter, aiming to gain a compromise between detecting weak and less represented events (that is events having waveform quite different from reference template) and having low false alarm rate and possible loss of significant events. In this paper, following Harris (2006), we selected the dimension parameter by means of an empirical approach, making use of two different graphs. First, the fractional energy captured for each event is calculated:
where
where
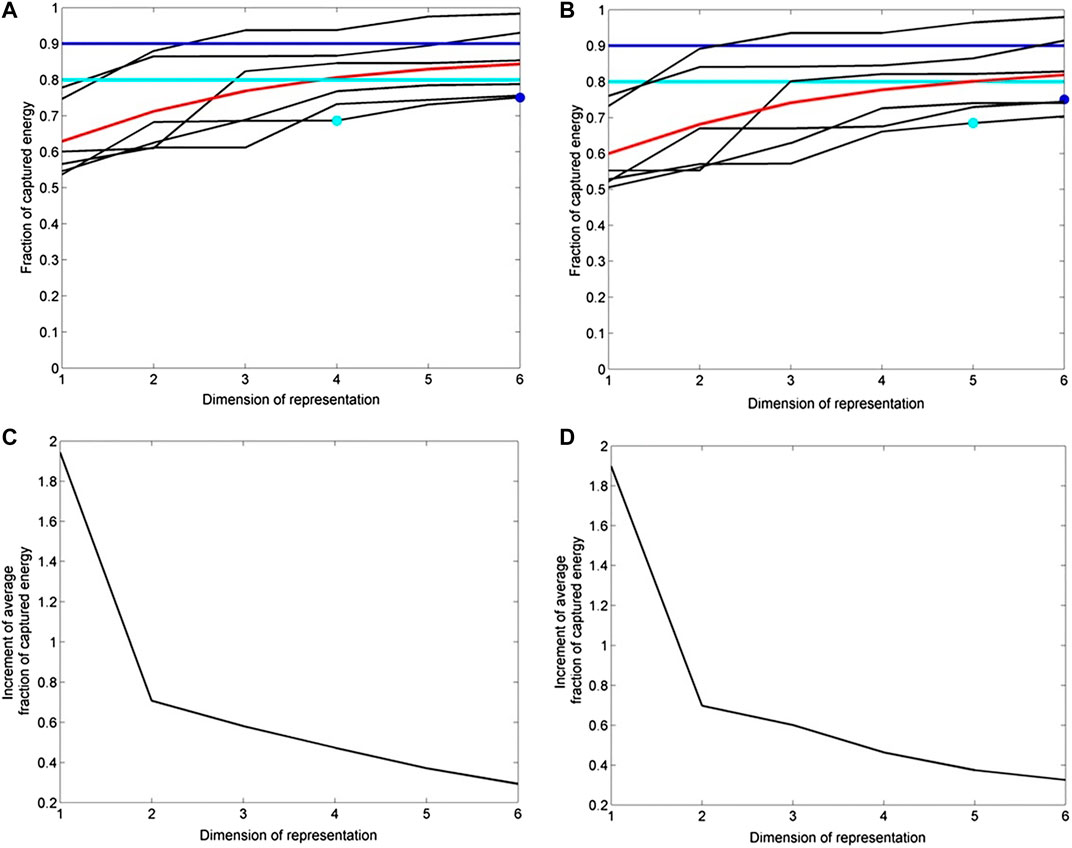
FIGURE 4. Fraction of captured energy by each template of the designed matrix in function of the subspace dimension for signal filtered in the band 1–10 Hz (A) and in the band 0.5–10 Hz (B). Black curve represents captured energy by each template, red curve the average captured energy, while, blue and light blue lines represent the 90 and 80 percentage of captured energy, respectively. Increment of average fractional captured energy (∆fc), in function of subspace dimension for signal filtered in the band 1–10 Hz (C) and in the band 0.5–10 Hz (D).
The sufficient statistic for the subspace can be now calculated by implementing Eqs. 11, 12, by means of windows of signal subspace sliding against the continuous signal, and compared against the threshold (Eqs. 13, 14) to declare if an event is present.
In subspace detector algorithm, signal in a detection window is projected into a subspace spanned by the d columns of the subspace representation. The statistic is therefore the ratio of the squared norm of the projected vector to the squared norm of the original data vector (Eq. 12). It ranges between 0 and 1 and is a measure of the linear dependence between the signal and the orthonormal bases constituting the signal subspace. Every time the sufficient statistic exceeds the given threshold (
Threshold Setting
The choice of the threshold
Following Harris (2006) and Song et al. (2014), we implemented the Neyman-Pearson decision criterion (Van Trees, 1968). In the criterion, the threshold γ is derived from the false alarm rate with Eq. 15. In order to obtain the detection threshold, a few parameters need to be determined: 1) the false alarm probability (Eq. 15), 2) subspace dimension and 3) N. Regarding this latter, we should discuss about noise. Indeed, noise in the detection windows is assumed to be statistically uncorrelated. As Wiechecki-Vergara et al. (2001) point out, the effective dimension of the embedding space can be significantly lower than N if the data are filtered prior to detection. Noise could be correlated and could reduce the effective dimension of the embedding space even if data are not filtered. As Song et al. (2014) suggested, we applied the correction for the influence of the correlated noise, and estimated the effective embedding space dimension of detection windows
In particular, once calculated the cross-correlation values using the specific window length N, the variance is obtained and the effective embedding space of the respective detection window (subspace, correlation, STA/LTA) are calculated by means of:
in the light of it, Eq. 15 can be rewritten as:
Hence, simple correlation detector can be written as:
where
After obtaining
In order to accomplish this task, threshold
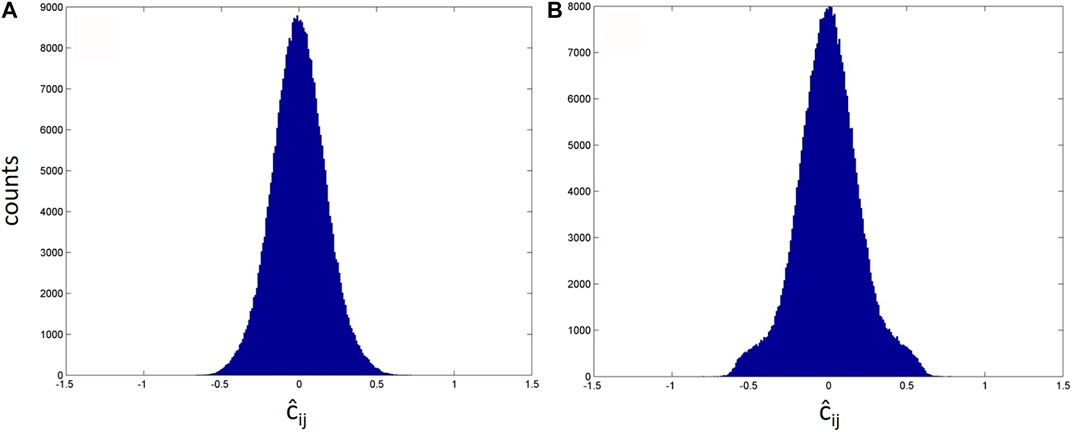
FIGURE 5. Histograms of cross-correlation value distributions between event templates and noise data where infrasonic tremor is filtered out (A), and with presence of infrasound tremor (B).
Once the cross-correlation threshold
At this stage of the processing, we own all parameters needed to derive γ from Eq. 21, that is: 1) the false alarm probability PF (Eq. 23), 2) the effective dimension of the embedding space
With the aim of evaluating the advantages/effectiveness of the subspace-based detector, we make a comparison with the performance of STA/LTA and the simple correlator trigger algorithms. As regards the former, the detection statistic is calculated:
where
The STA/LTA threshold was determined by means of γr the same approach implemented for subspace, once computed
Regarding the STA/LTA detector, based on event spectral content, we empirically set STA and LTA window length equal to 3 and 25 times the dominant period (Withers et al., 1998) respectively, corresponding with the lower frequency characterizing infrasound events.
Correlation detector was instead implemented as a subspace detector in which d = 1, by means of Eq. 22. Detection window length chosen for subspace and correlator scan was set to 4 times the dominant period to include the entire waveform (Figure 3B).
Results
Subspace-based algorithm, as well as correlation detector and STA/LTA, were applied to the dataset of 30/May/2019 (13:30–14:30), which consists of the infrasound signal recorded by EMFO station, and is characterized by infrasound events located at the eruptive fracture and infrasonic tremor located at BN (Figures 1, 2). Concerning the subspace method, we used, as event templates, waveforms extracted from signal recorded at the same station (Figure 3A), by means of the approach described in Template Matrix, setting a cross-correlation threshold equal to 0.6. Once template matrix has been designed, waveforms were cut in 62 points-long windows, filtered, normalized and aligned by their positive peaks (Figure 3B). A first test was carried out by filtering signal in the frequency band 1–10 Hz. This frequency band was chosen with the aim of filtering out the correlated low frequency tremor.
We performed two computations, by using 99.9 and 99.99, as percentile for statistic threshold estimation (Eqs. 22, 23, Figure 6), and built the subspace by using a dimension of representation equal to 4 (Figures 4A,C). The estimated thresholds and other setting parameters are reported in Table 1.
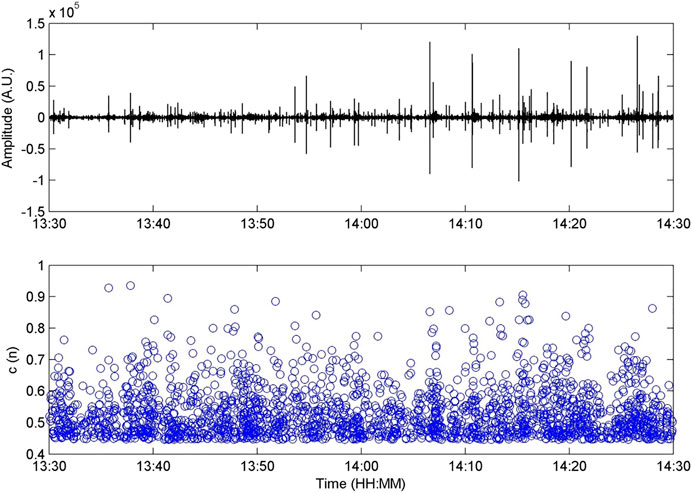
FIGURE 6. Signal recorded at EMFO station and filtered in the band 1–10 Hz (top) and subspace detection statistic values (c(n)) above the estimated threshold (ɣ).
One subspace detection statistic c[n] value is calculated in each detection window, with a sliding step of three points, we obtain Ntot/3 c[n], where Ntot is the signal buffer length. In Figure 6, the recorded signal and the sufficient statistics of subspace detector (c[n]) above the estimated threshold are shown.
With the aim of avoiding more values of detection statistics for each triggered event, we extrapolated one detection in a 1 s long window. For the purposes of the comparison among subspace, correlator and STA/LTA performance, the detections computed by the aforementioned algorithms are overlapped to the continuous signal in Figure 7A. Histograms, obtained by counting detections in 2 min long windows for all algorithms, are shown in Figure 7B.
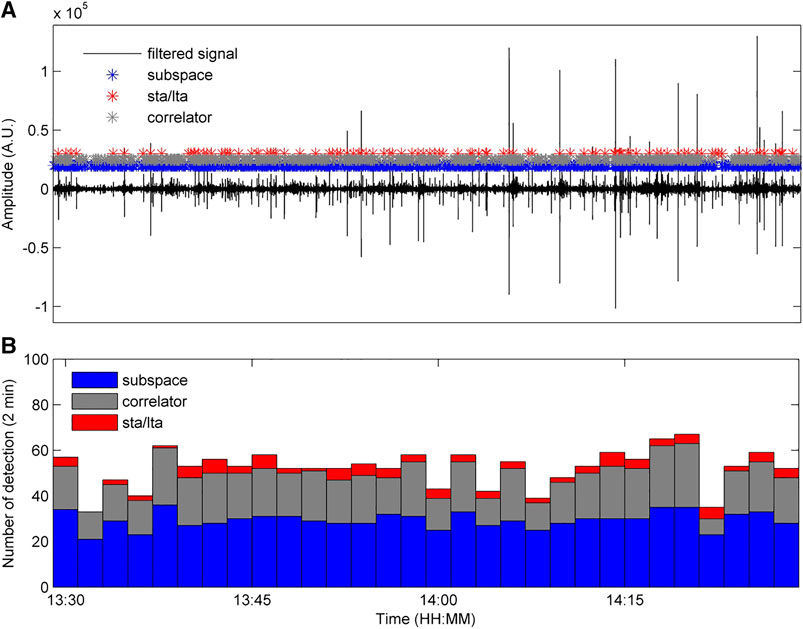
FIGURE 7. Signal recorded at EMFO station and filtered in the band 1–10 Hz with the overlapped positions of detections obtained in 1-s long window by subspace (blue asterisks), correlation (green asterisks) and STA/LTA (red asterisks) detection algorithms for 99.9 percentile and using four SVD (A). Event occurrence rate resulting from STA/LTA, correlation and subspace (bottom) detection algorithms counted in 2-min-long window (B).
Plots of the occurrence rates show that subspace succeeds in detecting a higher number of amplitude transients, especially if compared with the STA/LTA triggered events (Figure 7B).
Results reveal the capability of the subspace-based algorithm to detect infrasound events of lower amplitude, while STA/LTA algorithm is able only to detect high amplitude transients. Figures 8A,B, which reports a zoom of continuous signal and the detected event positions, shows that subspace-based algorithm detected even more transients than correlator.
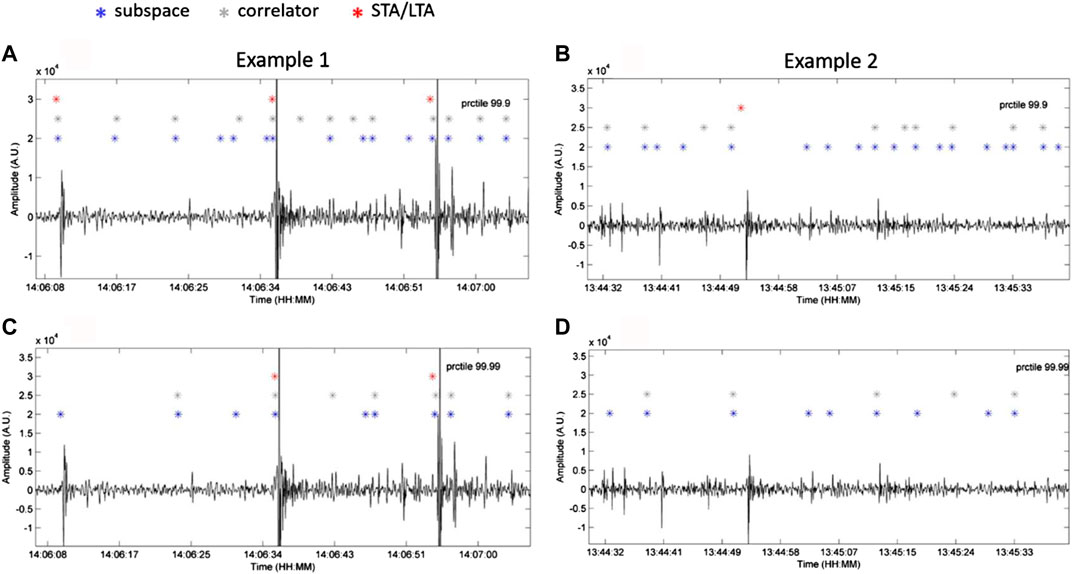
FIGURE 8. Zoom in of Figure 7A (example 1, A and example 2 in B) by using 99.9 as percentile and respective comparison with results of Figure 9A using 99.99 as percentile (C,D).
Successively, with the aim of highlighting the influence and the importance of parameter setting in this kind of approach, we run the detectors by setting the percentile equal to 99.99 instead of 99.9, used to obtain the respective detection threshold. The estimated parameters are reported in Table 1. By using a 99.99 percentile, detection threshold of the three detectors raises and, as a consequence, we observe a decrease of detection number as also demonstrated by the occurrence rates (Figure 9 and Table 1). Furthermore, subspace and correlator exhibit a similar trend of the event occurrence rate.
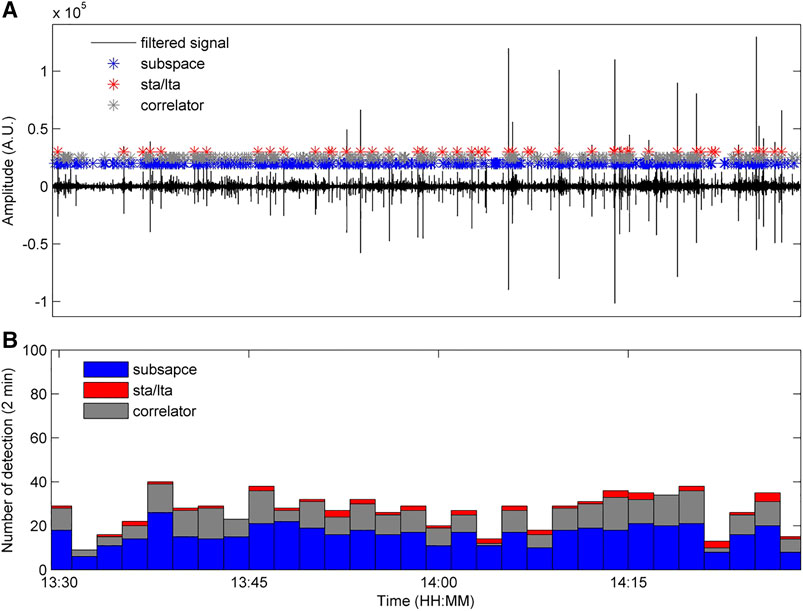
FIGURE 9. Signal recorded at EMFO station and filtered in the band 1 -10 Hz with the overlapped positions of detections obtained in 1-s long window by subspace (blue asterisks), correlation (green asterisks) and STA/LTA (red asterisks) detection algorithms for 99.99 percentile and using four SVD (A). Event occurrence rate resulting from subspace, correlation and STA/LTA detection algorithm counted in 2-min-long window (B).
In the first case (percentile 99.9), the three detectors trigger more events with respect to the second one (percentile 99.99) (Figures 8, 9). In particular, the subspace succeeds in the detection of very low amplitude transients. Nevertheless, a lower threshold can imply the identification of a higher number of false detections. By an inspection of signal buffer reported in Figures 8, almost all the detections are real and not false positives.
Reliable estimation of the detection capability when correlated noise, due to low frequency infrasonic tremor, is overlapped, was tested using the three described methods. In the light of it, signal was previously filtered in the band 0.5–10 Hz. In such a way, signal to be scanned is characterized by both infrasound events, exhibiting a frequency content in the band 2.5–10 Hz, and the infrasonic tremor, whose spectral peak is at ∼0.6 Hz (Figure 2).
The resulting cross-correlation value distribution is shown in Figure 5B. A value of 99.9 as percentile was chosen, and the subspace was built by means of five SVD (Figures 4B,D). By introducing a correlated continuous tremor on the signal, the subspace and correlator thresholds result higher, due to the increase of variance, as expected (Table 1).
In this case, comparison with STA/LTA detector is inconsistent due to a not well defined statistics (Eqs. 19, 20, 26) used in the threshold γr computation. Despite this, simple correlation detector and subspace detector, from a practical point of view, exhibit robustness in the detection of waveforms transient as reported in Figure 10.
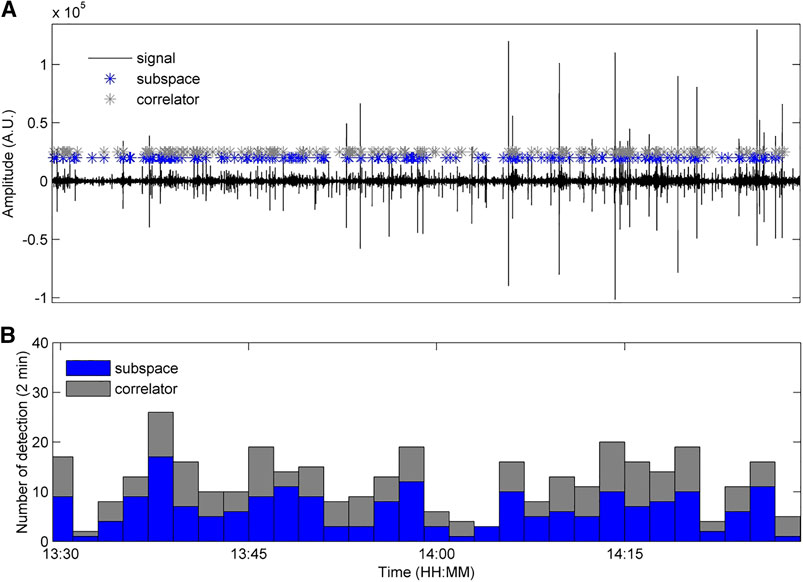
FIGURE 10. Signal recorded at EMFO station and filtered in the band 0.5–10 Hz with the overlapped positions of detections obtained in 1-s long window by subspace (blue asterisks) and correlation (green asterisks) detection algorithms for 99.9 percentile and using five SVD (A). Event occurrence rate resulting from subspace and correlation detection algorithm counted in 2-min-long window (B).
Comparison between Figures 7B, 10B, whose results were obtained by using similar false alarm probability (Table 1), reveals that, if the low frequency infrasonic tremor is overlapped to the signal and not filtered out, the number of detections by means of both subspace and correlation based methods is lower. Furthermore, even in this case, subspace method succeeds in event detection with respect to the correlator detector.
Discussion and Conclusion
In the present work, we applied a subspace-based trigger algorithm for the automatic detection of infrasound amplitude transients in volcanic area. A 1 h-long buffer of continuous infrasound signal characterized by amplitude transients related to Strombolian activity, taking place at an eruptive fracture, was analyzed (Figure 1). In order to test the feasibility and performance of this technique, we made a comparison among results obtained by implementing STA/LTA, correlation and subspace detectors. Several computations were carried out by using different setting parameters (Table 1).
Results highlight that subspace detector succeeds in detection of explosive activity related infrasound events. Indeed, Figures 7B and 9B, show that subspace detector turns out to detect a higher number of amplitude transients with respect to both correlation and STA/LTA trigger algorithms. This is particularly true for a lower false alarm probability (that is choosing 99.99 as percentile of cross-correlation distribution values in Eq. 22, Figure 5A). Indeed, the ratio between the total number of detections of subspace with respect to correlation and STA/LTA is higher than for a higher false alarm probability (that is choosing 99.9) (Table 1).
It is worth noting that subspace detector is able to detect even infrasound events of low amplitude (Figure 8), which, especially in presence of noise, are difficult to be triggered by means of an energy detector. Several runs were performed by using variable setting parameter values. These tests demonstrate that the choice of setting parameter plays a fundamental role in the outcomes of elaborations. In particular, an in-depth statistical analysis of noise needs to be carried out, in that distribution value of cross-correlation between template waveform and noise determines the threshold of the detector.
Succeeding in the detection of all amplitude transients allows to monitor the time variation of occurrence rate, and thus to follow the evolution of explosive activity. Indeed, energy-based trigger algorithm (as STA/LTA) often fails in detection of low amplitude transients, events with low signal to noise ratio and events too close in time to each other.
With the aim of performing a quantitative estimate of the subspace effectiveness, especially in terms of false alarms and missed detections, and in general, to validate the results, a visual inspection of the 1 h-long signal buffer (Figure 6) and its comparison with the results obtained by means of the three algorithms were carried out. In particular, concerning the performance assessment goal, we chose to analyze the results of the second test presented into the work (Figures 8C,D, 9), that is the one with percentile equal to 99.99 (which is the most conservative test), and inspected the true and false positive, and true and false negative events. We collected a dataset of 669 true events belonging to the same family (same source). Successively, by comparing waveforms with the detections (Figure 9A), a confusion matrix was calculated, for each of the three algorithms (Figure 11). The performance indices were then extrapolated from each confusion matrix (Table 2).

FIGURE 11. Confusion matrices of subspace, correlator and STA/LTA triggering algorithms. True positive (TP), false positive (FP), true negative (TN) and false negative (FN) values were obtained by an accurate analysis consisting of a visual inspection of the 1 h-long buffer of continuous infrasound signal and its comparison with the detections.

TABLE 2. Performance indices, with relative equations, calculated from confusion matrices (see Figure 11) for subspace, correlator and STA/LTA triggering algorithms.
The validation results show that the subspace detector is generally characterized by the best indices among those derived from the confusion matrix (Figure 11; Table 2). In particular, it performs the best error rate (number of all incorrect predictions divided by the total number of dataset), accuracy (correct predictions divided by the total number of the dataset), and sensitivity, also called true positive rate, which is the number of correct positive predictions divided by the total number of positive, compared to the other two methods. In particular, STA/LTA gives the poorest results, as expected (Table 2). Nevertheless, it has to be highlighted that the correlator and STA/LTA show the best precision, which quantifies the number of correct positive predictions divided by the total number of the positive prediction, specificity (representing the true negative rate) and false positive rate, due to the lower false positive values and higher true negative values (Figure 11; Table 2). Finally, F-Score, providing a single score balancing both precision and sensitivity, shows the highest value in case of the subspace detector, due to the high rate of the actual triggered waveforms (Figure 11; Table 2). In the light of this, the subspace detector method can be considered a good compromise in recognizing low-amplitude waveforms, particularly useful in tracking volcanic activity producing low-energy and very close in time events.
As regards the better performance of subspace over correlation detector, in terms of error rate, accuracy, and sensitivity, this can be ascribed to the events waveform variability. Indeed, subspace method allows making a comparison between the continuous signal and a set of waveforms of interest (templates) and the linear combination among them, instead of a single one or multiple in few cases (Hotovec-Ellis and Jeffrines, 2016; Senobari et al., 2019), as the correlation detector does. This makes the subspace detector particularly attracting and suited to detect infrasound events undergoing slight modifications in waveforms due for example to geometrical characteristic variations (e.g., vent/crater enlargement) (e.g., Cannata et al., 2011; Fee et al., 2017; Matoza et al., 2019b).
Automatic detection of seismo-volcanic events (seismic and infrasound) in monitoring framework and/or analyses of huge dataset is successfully currently carried out by means of energy detectors, correlation-based algorithms or methods making use of advanced signal processing techniques (e.g., Cannata et al., 2013a, Cannata et al., 2013b; Thompson, 2015; Hotovec-Ellis and Jeffrines 2016; Bueno et al., 2019; Matoza et al., 2019b; Senobari et al., 2019). Among more recent developed trigger algorithms, for example, VINEDA, designed for infrasound event detection (Bueno et al., 2019), parses the original signal into a characteristic function, whose amplitude is proportional to the sharpness of the original explosion onset. This latter method is very useful to increase signal to noise ratio, much better than the STA/LTA approach, and is able to detect even low-amplitude transients. Another recent method, REDPy (Hotovec-Ellis and Jeffrines, 2016), designed for earthquake detection, consist in performing a STA/LTA, storing the triggered events, and then cross-correlating waveforms to find similar events. REDPy is an effective tool in order to discover events belonging to the same family and offers the advantages and the disadvantages of both STA/LTA and cross-correlation. In the framework of our goal, that is to identify and extracting waveforms similar to each other (hence, belonging to the same source), subspace detector exhibits the advantages of being able to detect low-amplitude transients associated to a specific source, as well as transients showing slight waveform modifications. The latter feature is related to the use of SVD and the subspace method, which consists of the scanning of the signal buffer with all the linear combinations among basis vectors derived from the template matrix (previously designed). An additional feature of the subspace method lies in its reliability in the detection of events that are close in time to each other.
Furthermore, in the proposed subspace-based detection method, algorithm parameters are automatically tuned by implementing a statistical analysis of the background noise.
In general, as reported in Song et al., 2014, the limitation of the subspace detector is the complexity and relatively large computation cost in building the signal subspace. Nevertheless, the aim of our work focused on the statistical analysis of noise in order to optimize the quality of the trigger, in terms of low-amplitude event number.
In future developments, the subspace detector method has the potentiality to be adapted to multi-station framework, considering multiple instances or by multiplexing the data (e.g., Song et al., 2014; McMahon et al., 2017). In the perspective of a real-time implementation, a detector should scan a 2-min-long buffer. Actually, using simple Matlab scripts, it takes 0.4 s on average to process 2 min of infrasound data, seeming suitable for real-time processing. Future work will be dedicated to optimization and code compilation to build a module working in a real-time framework.
Findings of this work reveal the potentiality of subspace-based method in infrasound event detection. Advantages of this technique are particularly interesting in infrasound recorded in open-conduit volcanoes such Mt. Etna, where activity at summit craters often consists of persistent Strombolian explosions, producing infrasound events very close in time, that can take place at several vents, thus giving rise to multiple and time varying infrasound sources.
This first application of a subspace-based detection algorithm to infrasound signal proves that this is an efficient technique for identification and triggering of events in volcanic area.
Data Availability Statement
The raw data supporting the conclusions of this article will be made available by the authors, without undue reservation.
Author Contributions
MS is the main investigator of this research. She assembled and implemented the method of subspace-based detector and performed data elaborations. PM contributed to the design of the detection problem methodology and to the statistical analysis and contributed to the manuscript writing.
Funding
This work partially funded by the FISR project “SALE OPERATIVE INTEGRATE E RETI DI MONITORAGGIO DEL FUTURO: L’INGV 2.0 (S.O.I.R.).”
Conflict of Interest
The authors declare that the research was conducted in the absence of any commercial or financial relationships that could be construed as a potential conflict of interest.
Acknowledgments
We are indebted to the technicians of the INGV, Osservatorio Etneo and Italian Civil Protection Department (DPC) for funding and enabling the acquisition of infrasonic data. Also, we thank the reviewers and editors for their useful suggestions.
References
Allen, R. V. (1978). Automatic earthquake recognition and timing from single traces. Bull. Seismol. Soc. Am. 68 (5), 1521–1532.
Bueno, A., Diaz-Moreno, A., Álvarez, I., De la Torre, A., Lamb, O. D., Zuccarello, L., et al. (2019). VINEDA—volcanic INfrasound explosions detector algorithm. Front. Earth Sci. 7, 335. doi:10.3389/feart.2019.00335
Cannata, A., Di GraziaAliotta, G. M., Cassisi, C., Montalto, P., and Patanè, D. (2013a). Monitoring seismo-volcanic and infrasonic signals at volcanoes: Mt. Etna case study. Pure Appl. Geophys. 170 (11), 1751–1771. doi:10.1007/s00024-012-0634-x
Cannata, A., Montalto, P., and Patanè, D. (2013b). Joint analysis of infrasound and seismic signals by cross wavelet transform: detection of Mt. Etna explosive activity. Nat. Hazards Earth Syst. Sci. 13, 1669–1677. doi:10.5194/nhess-13-1669-2013
Cannata, A., Sciotto, M., Spampinato, L., and Spina, L. (2011). Insights into explosive activity at eruptive ssure closely-spaced vents by infrasound signals: example of Mt. Etna 2008 eruption. J. Volcanol. Geoth. Res. 208, 1–11.
Cannavò, F., Sciotto, M., Cannata, A., and Di Grazia, G. (2019). An integrated geophysical approach to track magma intrusion: the 2018 christmas eve eruption at mount Etna. Geophys. Res. Lett. 46, 8009. doi:10.1029/2019GL083120
Fee, D., Izbekov, P., Kim, K., Yokoo, A., Lopez, T., Prata, F., et al. (2017). Eruption mass estimation using infrasound waveform inversion and ash and gas measurements: evaluation at Sakurajima Volcano, Japan. Earth Planet Sci. Lett. 480. doi:10.1016/j.epsl.2017.09.043
Gibbons, S. J., and Ringdal, F. (2006). The detection of low magnitude seismic events using array-based waveform correlation. Geophys. J. Int. 165, 149–166. doi:10.1111/j.1365-246X.2006.02865.x
Gibbons, S. J., Sørensen, M. B., Harris, D. B., and Ringdal, F. (2007). The detection and location of low magnitude earthquakes in northern Norway using multi‐channel waveform correlation at regional distances. Phys. Earth Planet. In. 160, 285–309. doi:10.1016/j.pepi.2006.11.008
Harris, D. B. (2006). Subspace detectors: theory. Livermore, CA: Lawrence Livermore National Laboratory Internal Report UCRL-TR-222758
Harris, D. B., and Dodge, D. A. (2011). An autonomous system for grouping events in a developing aftershock sequence. Bull. Seismol. Soc. Am. 101, 763–774. doi:10.1785/0120100103
Hotovec-Ellis, A. J., and Jeffries, C. (2016). Near real-time detection, clustering, and analysis of repeating earthquakes: application to mount st. Helens and redoubt volcanoes. Reno, Nevada: Seismological Society of America Annual Meeting
INGV-OE Internal Report (2019). 23/2019. BollettinoEtna20190604. Available at: www.ct.ingv.it.
Maceira, M., Rowe, C. A., Beroza, G., and Anderson, D. (2010). Identification of low-frequency earthquakes in non-volcanic tremor using the subspace detector method. Geophys. Res. Lett. 37, L06303. doi:10.1029/2009GL041876
Matoza, R. S., Arciniega-Ceballos, A., Sanderson, R. W., Mendo-Perez, G., Rosaldo-Fuentes, A., and Chouet, B. (2019a). High-Broadband seismoacoustic signature of vulcanian explosion at Popocatépetl volcano, Mexico. Geophys. Res. Lett. 46 (1), 148–157. doi:10.1029/2018GL080802
Matoza, R. S., Fee, D., Green, D., and Mialle, P. (2019b). Volcano infrasound and the international monitoring system: challenges in middle atmosphere dynamics and societal benefits Book: infrasound monitoring for atmospheric studies. Switzerland, Europe: Springer Nature. doi:10.1007/978-3-319-75140-5_33
McMahon, N. D., Aster, R. C., Yeck, W. L., McNamara, D. E., and Benz, H. M. (2017). Spatiotemporal evolution of the 2011 Prague, Oklahoma, aftershock sequence revealed using subspace detection and relocation. Geophys. Res. Lett. 44, 7149–7158. doi:10.1002/2017GL072944
Montalto, P., Cannata, A., Privitera, E., Gresta, S., Nunnari, G., and Patanè, D. (2010). Towards an automatic monitoring system of infrasonic events at Mt. Etna: strategies for source location and modeling. Pure Appl. Geophys. 167, 1215–1231. doi:10.1007/s00024-010-0051-y
Mudholkar, G. S., Chaubey, Y. P., and Ching-Chuong, L. (1976). Approximations for the doubly noncentral-F distribution. Commun. Stat. Theor. Methods 5, 49–63. doi:10.1080/03610927608827331
Sciotto, M., Cannata, A., Gresta, S., Privitera, E., and Spina, L. (2013). Seismic and infrasound signals at Mt. Etna: modelling of North-east Crater conduit and its relation with the feeding system of the 2008-2009 eruption. J. Volcanol. Geoth. Res. 254, 53–68. doi:10.1016/j.jvolgeores.2012.12.024
Sciotto, M., Cannata, A., Prestifilippo, M., Scollo, S., Fee, D., and Privitera, E. (2019). Unravelling the links between seismo-acoustic signals and eruptive parameters: Etna lava fountain case study. Sci. Rep. 9, 16417. doi:10.1038/s41598-019-52576-w
Sciotto, M., Rowe, C. A., Cannata, A., Arrowsmith, S., Privitera, E., and Gresta, S. (2011). Investigation of volcanic seismo-acoustic signals: applying subspace detection to lava fountain activity at Etna volcano. AGU–American Geophysical Union, Fall Meeting. San Francisco, CA.
Senobari, N. S., Funning, G. J., Keogh, E., Zhu, Y., Yeh, C. M., Zimmerman, Z., et al. (2019). Super‐efficient cross‐correlation (SEC‐C): a fast matched filtering code suitable for desktop computers. Seismol Res. Lett. 90, 322–334. doi:10.1785/0220180122
Song, F., Warpinski, N. R., Nafi Toksőz, M., and Sadi Kuleli, H. (2014). Full-waveform based microseismic event detection and signal enhancement: an application of the subspace approach. Geophys. Prospect. 62, 1406–1431. doi:10.1111/1365-2478.12126
Spina, L., Cannata, A., Privitera, E., Vergniolle, S., Ferlito, C., Gresta, S., et al. (2015). Insights into Mt. Etna’s shallow plumbing system from the analysis of infrasound signals. Pure Appl. Geophys. 172, 473–490. doi:10.1007/s00024-014-0884-x
Tarquini, S., Isola, I., Favalli, M., and Battistini, A. (2007). TINITALY, a digital elevation model of Italy with a 10 m-cell size. Ercolano, Italy: Istituto Nazionale di Geofisica e Vulcanologia (INGV).
Thompson, G. (2015). “Seismic monitoring of volcanoes,” in Encyclopedia of earthquake engineering. Editors M. Beer, I. A. Kougioumtzoglou, E. Patelli, and S. K. Au (Berlin, Heidelberg: Springer). doi:10.1007/978-3-642-35344-4
Trnkoczy, A. (2012). IASPEI New manual of seismological observatory practice 2 (NMSOP-2). Deutsches GeoForschungsZentrum GFZ, Understanding and parameter setting of STA/LTA trigger algorithm. Berlin, Germany: Helmholtz-Zentrum. doi:10.2312/GFZ.NMSOP-2_IS_8.1
Van Trees, H. L. (1968). Detection, estimation and modulation theory. Hoboken, NJ: John Wiley & Sons.
Wiechecki-Vergara, S., Gray, H. L., and Woodward, W. A. (2001). Tech. Rep. DTRA-TR-00–22, Statistical development in support of CTBT monitoring. Dallas, TX: Southern Methodist University.
Withers, M., Aster, R., and Young, C. (1999). An automated local and regional seismic event detection and location system using waveform correlation. Bull. Seismol. Soc. Am. 89, 657–669.
Withers, M., Aster, R., Young, C., Beiriger, J., Harris, M., Moore, S., et al. (1998). A comparison of select trigger algorithms for automated global seismic phase and event detection. Bull. Seismol. Soc. Am. 88 (1), 95–106.
Keywords: infrasound signal, subspace detector, trigger algorithm, Infrasound volcano monitoring, strombolian activity, Infrasound events, Etna volcano, Infrasonic tremor
Citation: Sciotto M and Montalto P (2021) Application of Subspace-Based Detection Algorithm to Infrasound Signals in Volcanic Areas. Front. Earth Sci. 8:579923. doi: 10.3389/feart.2020.579923
Received: 03 July 2020; Accepted: 26 November 2020;
Published: 03 March 2021.
Edited by:
Reik Donner, Hochschule Magdeburg-Stendal, GermanyReviewed by:
Stephen Arrowsmith, Southern Methodist University, United StatesOliver D. Lamb, University of North Carolina at Chapel Hill, United States
Copyright © 2021 Sciotto and Montalto. This is an open-access article distributed under the terms of the Creative Commons Attribution License (CC BY). The use, distribution or reproduction in other forums is permitted, provided the original author(s) and the copyright owner(s) are credited and that the original publication in this journal is cited, in accordance with accepted academic practice. No use, distribution or reproduction is permitted which does not comply with these terms.
*Correspondence: Mariangela Sciotto, bWFyaWFuZ2VsYS5zY2lvdHRvQGluZ3YuaXQ=
 Mariangela Sciotto
 Placido Montalto