 Thomas E. Shaw
 César Deschamps-Berger
 Simon Gascoin
 James McPhee
- 1Advanced Mining Technology Center, Universidad de Chile, Santiago, Chile
- 2Swiss Federal Institute for Forest, Snow and Landscape Research (WSL), Birmensdorf, Switzerland
- 3CESBIO, CNES/CNRS/INRAE/IRD/UPS, Université de Toulouse, Toulouse, France
- 4Météo-France, CNRS, CNRM, Centre d’Etudes de la Neige, University Grenoble Alpes, Université de Toulouse, Grenoble, France
- 5Department of Civil Engineering, Universidad de Chile, Santiago, Chile
Quantifying the high elevation winter snowpack in mountain environments is crucial for lowland water supply, though it is notoriously difficult to accurately estimate due to a lack of observations and/or uncertainty in the distribution of meteorological variables in space and time. We compare high spatial resolution (3 m), satellite-derived snow depth maps for two drought years (2017 and 2019) in a high mountain catchment of the central Chilean Andes, applying a recently updated methodology for spaceborne photogrammetry. Regional weather station observations revealed an 80% reduction in precipitation for 2019 (the second driest winter since 1950) relative to 2017, though only a 10% reduction in total snow-covered area is seen in the satellite imagery. We threshold surface height changes based upon uncertainty of stable (snow-free) terrain differences for topographic characteristics of the catchment (slope, aspect, roughness etc). For a conservative analysis of change, outside of the topographically-derived confidence intervals, we calculate a mean 0.48 ± 0.28 m reduction of snow depth and a 39 ± 15% reduction in snow volume for 2019, relative to 2017 (for 23% of the total catchment area). Our findings therefore quantify, for the first time in the Andes, the relationship of high-resolution mountain snow depth observations with low elevation precipitation records and characterise its inter-annual variability over high elevation, complex terrain. The practical use of such detailed snow depth information at high elevations is of great value to lowland communities and our findings highlight the clear need to relate the high spatial (Pléiades) and temporal (in-situ) scales within the available datasets in order to improve estimates of region-wide snow volumes.
Introduction
Seasonal snow is a crucial fresh water resource in mountain regions and plays a highly important role in the socio-economic well-being of lowland communities for drinking water, agriculture, hydropower and mining (Mankin et al., 2015; Meza et al., 2015; Arheimer et al., 2017; Sturm et al., 2017; Biemans et al., 2019). Despite this, quantifying the spatio-temporal variability of the winter snowpack remains difficult and/or costly (e.g., Bühler et al., 2016; Painter et al., 2016; Möller et al., 2017), often relying on intensive ground and/or airborne surveys (Harpold et al., 2014; Deems et al., 2015; Nolan et al., 2015; Currier et al., 2019). Our understanding of large scale snow processes has been greatly aided by decades of global satellite observations of snow cover extent (e.g., Hall et al., 2010) and more recently of snow volume by leveraging highly detailed airborne LiDAR surveys (Painter et al., 2016; Hedrick et al., 2018; Margulis and Fang, 2019). Studies have found that improving representation of snow water equivalent (SWE) from such detailed snow depth observations can increase the predictive capability of seasonal streamflow forecast models (Li et al., 2019; Margulis and Fang, 2019) and help to quantify the inter-annual variability and persistence of the snow depth in space (Hedrick et al., 2018). Nevertheless, the spatial extent and cost of such intensive campaigns, despite their invaluable contribution to process understanding, limits the wider applicability to catchments in many parts of the world where snow water resources are highly important, yet more poorly understood (e.g., Cortés et al., 2016; Fayad et al., 2017; Smith and Bookhagen, 2018; Baba et al., 2018).
The advent of high resolution, optical satellite constellations has lead to many valuable contributions in the discipline of Earth sciences (Zhou et al., 2015; Bagnardi et al. 2016), including quantification of glacier mass balance (Berthier et al., 2014; Melkonian et al., 2016; Belart et al., 2017; Brun et al., 2018; Bƚaszczyk et al., 2019; Ren et al., 2020) and spatial snow volumes (Marti et al., 2016; McGrath et al., 2019; Deschamps-Berger et al., 2020; Shaw et al., 2020a). The application of sub-metre resolution stereo imagery for elevation model generation, namely that of Pléiades and WorldView products, has demonstrated decimetre accuracy when comparing to high resolution, albeit typically small scale, reference data (Marti et al., 2016; Shaw et al., 2020a). Recent work by Deschamps-Berger et al. (2020) found a sub-metre random error and low bias of Pléiades-derived snow depths when comparing to the Airborne Snow Observatory (“ASO”) over an extensive (137 km2) area of the Tuolumne Basin, United States. The direction of this research suggests that the use of such high spatial and temporal resolution (tri-)stereo satellite imagery will continue to be a valuable tool for understanding the mountain snowpack, regardless of the limitations that it presents, notably that of cloud cover occlusion and a reduced accuracy for steep terrain (Deschamps-Berger et al., 2020; Shaw et al., 2020a).
This study focuses upon the application of Pléiades-derived snow depths for two distinct years in a high mountain catchment of the central Chilean Andes. The winter snowpack in the central Andes is a vital resource for lowland communities as it offers a storage of water to be released during the spring/summer when typically <15% of the annual precipitation occurs (Garreaud et al., 2009). The very high (up to 5,000–6,000 m) elevation differences between the mountain peaks and populous lowland regions further emphasise the strong dipole of the source and sink of snow which is exacerbated by prolonged severe drought conditions for the region (Garreaud et al., 2017; Garreaud et al., 2019). Quantifying the snow volume of these high mountain catchments is therefore of great importance (Masiokas et al., 2006; Gascoin et al., 2013; Ragettli et al., 2014; Cortés et al., 2016; Masiokas et al., 2020; Shaw et al., 2020a; Shaw et al., 2020b), yet the lack of high elevation observations is a limiting factor in understanding the spatio-temporal behaviour of the snowpack (Alvarez-Garreton et al., 2018; Scaff et al., 2018; Masiokas et al., 2020). This is particularly evident when there are insufficient observations at very high elevations (>∼3,000 m a.s.l.) (Scaff et al., 2018; Shaw et al., 2020a) or for observing precipitation events that originate from the eastern side of the Andes (Shaw et al., 2020b).
We utilised 2 years of Pléiades imagery to explore the inter-annual variability of snow depth in a high elevation Andean catchment under prolonged regional drought conditions. Optical high-resolution satellite images were first evaluated in the Andes by Shaw et al. (2020a), though this work aims to extend that initial investigation with recently updated workflows and a previously unexplored inter-annual comparison of Pléiades-derived snow depths and their topographically-varying uncertainties. Specifically, we aimed to i) quantify the mountain snowpack using high spatial resolution (3 m) snow depth maps generated from Pléiades imagery in separate years, ii) explore the spatial uncertainties in Pléiades-derived snow depth and its dependence on the topography of the catchment, and iii) evaluate the relationship between spatial snow depth differences and persistence of snow to topographic parameters of the catchment and the meteorological conditions of the preceding winter months. Considering that this is the first time that such an inter-annual comparison of Pléiades snow depth maps has been performed, we place some emphasis on the steps taken to evaluate multi-year digital elevation model (DEM) uncertainties in order to provide generalised guidelines for future work.
Study Site
The Río Yeso catchment is located in the semi-arid Andes of central Chile (33.44°S, 69.93°W) and is at the headwall of one of the many important tributaries to the Maipo River, which serves as the main freshwater resource for the country’s capital, Santiago (Figures 1A,B). The glacierised catchment has an area of 102 km2 with an elevation range of ∼2,900-5,400 m a.s.l. (Figure 1C). There are three main glaciers in the basin: Bello (4.6 km2), Yeso (2.9 km2) and Pirámide (4.7 km2, debris-covered) which have been estimated to contribute between 3–32% of the basin’s spring-summer streamflow through icemelt (Burger et al., 2019), though the hydrological regime is typically dominated by contributions from snowmelt (Ayala et al., 2016; Burger et al., 2019; Shaw et al., 2020b). The catchment is characterised by steep terrain (average slope of 27°) that supports small sclerophyllous vegetation. Snow is typically present between early May and until late December at the highest elevations, with an estimated peak SWE in early to mid-September (Cornwell et al., 2016). Drought conditions since 2010 have resulted in a reduction in the number of snow cover days and increase in the snow line altitude (Mernild et al., 2016; Garreaud et al., 2017; Saavedra et al., 2018), with 2019 being the second driest year on record (as measured at Quinta Normal station, Santiago: 1950-present) up to the date of the 2019 Pléiades acquisition (Digital Elevation Model Generation).
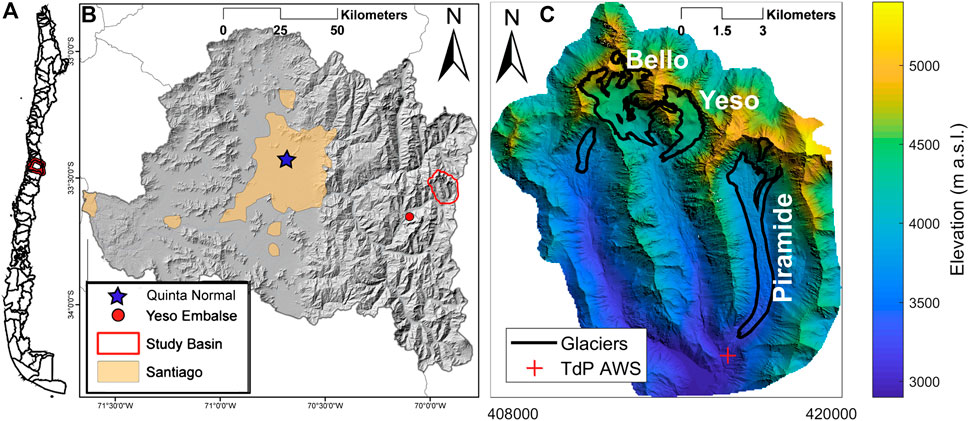
FIGURE 1. A map of (A) Chile, (B) the metropolitan region and (C) the Rio Yeso catchment. The automatic weather station Quinta Normal, Yeso Embalse and Termas del Plomo are marked in panels b and c. The hillshade in b is provided by ASTER GDEM and the hillshade/digital elevation model scale in c is that of SnowOFF_2018. Glacier outlines were manually digitised from the Pléiades SnowOFF_2018 orthoimage.
Data and Methods
The following methodology for derivation of snow depth from Pléiades optical satellite imagery builds upon the initial work of Shaw et al. (2020a) who evaluated its use in the same catchment for a single year. This paper, however, aims at observing and understanding the key detectable snow depth differences between two end-of-winter scenes for the first time and characterising the expected uncertainties in an updated workflow that was not addressed in previous studies. The flowchart in Figure 2 provides an overview of the processing steps with respect to the Pléiades datasets. The following subsections detail the specific processing steps with reference to this workflow.
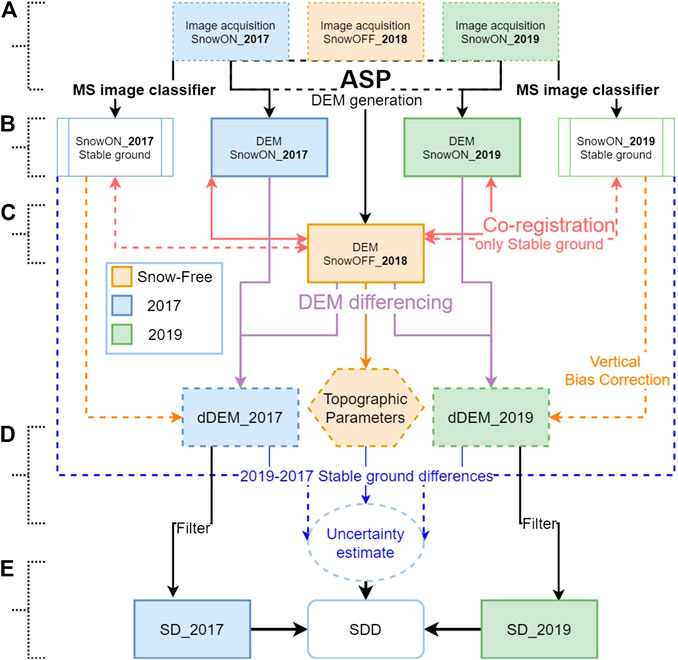
FIGURE 2. A flowchart of the steps taken to process Pléiades digital elevation models to assess snow depth difference (SDD) in this study. Steps (A‒E) are referenced in the methodology text.
Pléiades
Digital Elevation Model Generation
DEMs were generated from triplets of high resolution (0.5 m) imagery using Pléiades 1A and 1B satellites (Marti et al., 2016; Deschamps-Berger et al., 2020; Shaw et al., 2020a) (Figure 2A). Image triplets were taken during four separate acquisition dates (Table 1) that were either snow-free (hereafter SnowOFF_y, where y refers to the year of interest) or the equivalent snow-covered terrain in late austral winter (hereafter SnowON_y). The SnowON acquisitions were obtained for the 4th and 2nd September in the years 2017 and 2019, respectively. The reference SnowOFF acquisition was obtained January 6, 2018 and was used to generate dDEM maps of snow depth by Shaw et al. (2020a). This scene had minimal snow cover at the highest elevations of catchment (<0.1% of pixels >5,100 m a.s.l. - Supplementary Figure S1) that were ignored in this analysis. A second SnowOFF image set was acquired on April 24, 2019. Unfortunately, this acquisition shortly followed the first small snowfall of the 2019 winter, and thus, the 2018 image triplets (SnowOFF_2018) were used to generate the reference snow-free DEM surface for both years. The SnowOFF_2019 DEM was, however, used to update surface elevation changes over glacierised areas of the catchment (see Correction for Glacier Change).
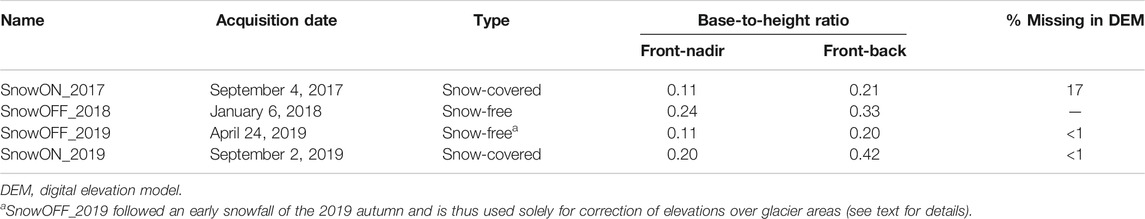
TABLE 1. The basic information regarding each DEM date referred to in the text.
We applied the semi-global matching stereo algorithm with a binary census transform cost function following Deschamps-Berger et al. (2020) to generate point clouds from Front-Nadir (FN) and Front-Back (FB) image pairs in the stereo process of the Ames Stereo Pipeline [ASP - Shean et al. (2016)]. This function generates two disparity maps from the FN-FB pairs, which are combined in a single point cloud with a joint triangulation process. We opted for a FN-FB set as it offered a larger disparity in point clouds when calculated within the ASP routine, and therefore found as the best trade-off in reducing intersection errors and data gaps due to terrain occlusion. The semi-global matching, binary transform routine in ASP was found by Deschamps-Berger et al. (2020) to reduce the random error and root mean squared error of both snow-covered and stable, snow-free terrain compared to local search algorithms previously implemented for snow depth mapping using Pléiades (Marti et al., 2016; Shaw et al., 2020a). Due to saturation in the SnowON_2017 images (see discussion Limitations of Pléiades for Multi-Annual Snow Depth Derivation), correlation failure of the stereo process in ASP resulted in a loss of ∼17% of the total pixels in the catchment (Shaw et al., 2020a). No saturation was evident in the SnowON_2019 images.
We subsequently applied the point2dem function in ASP in order to map the stereo-generated point cloud onto a rough 50 m grid and provide an adequate absolute georeference for the DEM. This coarse DEM was therefore used as a projection base for the ASP routine mapproject. This routine produces roughly rectified images which were again processed with stereo (Shean et al., 2016). The gridding of the point cloud was this time made at the final resolution of 3 m. We selected this resolution as a balance of accuracy and data gaps in the final DEM product (Marti et al., 2016). This resolution was also considered appropriate by Deschamps-Berger et al. (2020) when comparing Pléiades-derived snow depths to ASO in the Sierra Nevada, United States.
Land Surface Classification
We utilised the ASP mapproject function to ortho-rectify the nadir multispectral image for each acquisition date based upon the respective DEM (Table 1; Figure 2B) and provided a manual training classification of the following surface classes; i) snow, ii) bare ground, iii) snow in shadow and iv) bare ground in shadow. Vegetation and water bodies are almost non-existent and not included in the classification scheme. Each class was digitised manually in ArcMap 10.3 to provide a training set for a random forest classifier in the Orfeo toolbox (Grizonnet et al., 2017). A co-author of the study provided an independent digitisation of snow-covered/snow-free pixels that were used to evaluate the random forest classifier. Pixels from each class were sampled randomly across the entire space of the catchment. We derive an overall Accuracy Index as the sum of all the true positive scores of a confusion matrix divided by the total number of validation points (523 and 487 in 2017 and 2019, respectively). Using this metric, we found a score of 0.95 and 0.93 for the images of September 2017 and 2019, respectively, indicating a strong performance of the classifier.
Co-Registration of Digital Elevation Models
Using the SnowOFF_2018 DEM as the reference, we relatively co-registered all other DEMs (Table 1; Figure 2C) following the approach of Nuth and Kääb (2011). To horizontally translate and vertically bias correct each DEM, we extract only stable terrain (defined as snow-free, non-glacierized land) for slope angles <45° (Berthier et al., 2007) using the classified images of each acquisition date (as described in Land Surface Classification). We applied the same translation to each equivalent orthoimage, to retain the same spatial coverage of the surface classification for further analyses. We used the classified bare ground (illuminated) of <45° to remove the median vertical difference of the SnowON DEMs relative to the SnowOFF_2018 reference. The values of the co-registration transforms are given in Supplementary Table S1. Following co-registration of each DEM, we differenced the SnowON_2017 and SnowON_2019 DEMs with the reference SnowOFF_2018 DEM to produce an initial raw difference map (hereafter referred to as a “dDEM”) at a 3 m horizontal resolution. Hereafter the naming convention follows that described in Table 2, such that dDEMs refer to raw DEM differences and “SD/SDD” refer to DEM differences with filtered and/or gap-filled data that describe a “snow depth.”
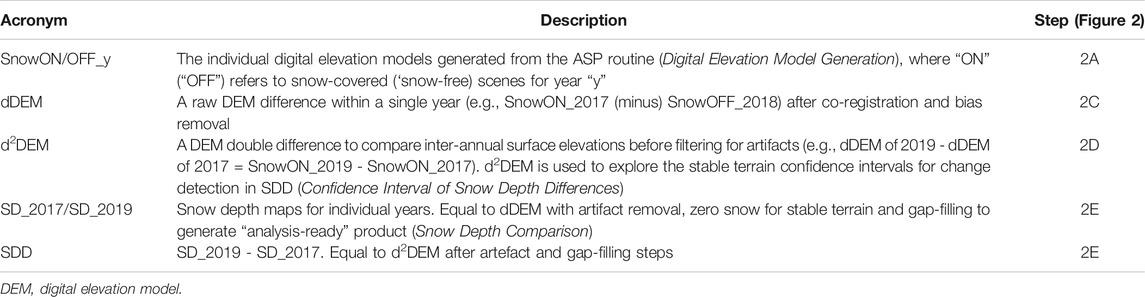
TABLE 2. Key acronyms to describe elevation models or elevation model differencing to calculate snow depth of inter-annual snow depth differences in this study.
Correction for Glacier Change
Due to the relative dates of the SnowON_2017 and SnowOFF_2018 acquisitions, DEM differencing to obtain snow depth also included a signal of glacier mass balance and dynamics (glacier horizontal and vertical motion and subsequent snow and ice melt in the ablation zone). We apply the same corrections as in Shaw et al. (2020a) to account for these effects in the 2017 dDEM. The mean propagated uncertainty for these glaciers was calculated by Shaw et al. (2020a) as 0.3 m. For SnowON_2019, we differenced with the SnowOFF_2019 DEM (April 2019) over glacier areas and assumed a similar uncertainty would account for light snow fall preceding the SnowOFF_2019 image acquisition. For stricter statistical change detection analyses (Snow Depth Comparison), we ignored glacier areas.
Topographic Indices of the Digital Elevation Model
To aid analyses of snow depth differences, we derived topographic indices for the catchment (Supplementary Figure S2). These indices are similar to those as described in Shaw et al. (2020a), though updated based upon the SnowOFF_2018 DEM (Table 1) that we derived from the new ASP stereo routine described in Digital Elevation Model Generation. These topographic indices are i) elevation extracted directly from the DEM (hereafter “ELE”), ii) slope angle (°, “SLP”), iii) the topographic position index that determines the relative elevation of a pixel to its surroundings ((Revuelto et al., 2014) – “TPI”), iv) the catchment aspect (°, “APT”), v) the wind exposure parameter developed by Winstral et al. (2002) (“SX”) and, vi) the calculated sky view factor (“SVF”). The SX parameter was calculated using the modal direction of hourly 10 m winds of the closest ERA5 cell for the period 1st April to 3rd September in each year (44.2° in 2017 and 47.4° in 2019). The period was selected as the beginning of the hydrological year (1st April) until the mean Pléiades acquisition date for the 2 years (2nd and 4th September). The ERA5 reanalysis wind vectors cannot represent localised wind conditions in the catchment, though it is a generalised representation of the regional wind direction. A TPI search distance of 60 m was applied following Shaw et al. (2020a).
Confidence Interval of Snow Depth Differences
We evaluated the quality of the inter-annual dDEM difference (d2DEM - Table 2) by assessing the empirical cumulative distributions of the stable (snow-free) terrain residuals (Figure 2D). In doing so, we were able to attribute a range of uncertainty that is derived for 3 m pixels that should in reality be zero (i.e., no snow). We extended this uncertainty range to explore how topographic indices of the basin (Topographic Indices of the Digital Elevation Model) might affect the quality of the d2DEM, and thus the assessment of snow depth differences between years (see Snow Depth Comparison). We extracted stable terrain pixels in 10 equal bins of each topographic index and obtained the 25–75% confidence interval of differences in each bin to provide a “strict” assessment of snow depth changes (Snow Depth Comparison), excluding differences that were within the stable terrain confidence intervals. With this, we assumed that the stable pixel residuals are representative of the differences over snow-covered areas. Given that the stable terrain pixels were well distributed in space and across the full range of topographic indices we believe that this is a fair assumption, though a full test of the relative uncertainties for stable and snow pixels would require a high resolution reference dataset or the entire catchment (e.g., Deschamps-Berger et al., 2020) that was not available to this study, nor would typically be available in studies of this kind.
Snow Depth Comparison
To assess dDEMs of individual years as “snow depth maps” [i.e., an analysis ready “end-product” - Shaw et al. (2020a), Shaw et al. (2020b)], we i) ignore any remaining snow-classified pixels that are negative in the dDEM of either year, ii) set stable terrain differences to zero, and iii) limit extreme outliers of each dDEM for high slope angles following the relation of slope holding capacity given by Bernhardt and Schultz (2010) (<3% of total pixels).
For evaluation of pixel-to-pixel snow depth differences (SDD), we considered:
where “SD” is the single year snow depth map (Table 2) such that negative values indicate smaller snow depths in 2019 (Figure 2E).
For a stricter comparison, we limited SDD by excluding pixels that are over glacierised areas, pixels that are within a buffer area of 6 m (2 pixels) around saturated areas of the SnowON_2017 image (Digital Elevation Model Generation) or pixels that were within the calculated confidence limits of the d2DEM over stable terrain for all topographic indices (Confidence Interval of Snow Depth Differences; Supplementary Table S2).
Alternatively, to provide an estimate of a full, catchment-wide SDD, we filled any remaining data gaps of a single year (such as those resulting from image saturation) using a random forest model trained on all available snow depth data and topographic indices, following Shaw et al. (2020a). We considered that mean differences at this full catchment scale is thus the weighted sum of the differences across all elements of analysis:
where the proportional area of elements of A (the mean change is zero - no snow in both orthoimages), B (mean change is not significant - within the confidence ranges of topographic indices), C (elements of greater uncertainty - glacierised or gap-filled pixels) and D (the ‘strict’ SDD where mean change is outside the confidence range) add to 1.
Finally, we also investigated the areas of snow absence in each year where the equivalent pixel is snow-covered for the other year (i.e., snow-covered in 2017 and absent in 2019), and we related these differences to the topographic indices above.
Uncertainties at the Catchment Scale
It is not straightforward to analytically estimate the error of the mean snow depth over a catchment as it results from the combination of different errors correlated at different spatial scales (Anderson, 2019). Another, typical approach would be to infer the error from the stable terrain residual. However the median error over stable terrain is zero by correction of the vertical bias (Co-Registration of Digital Elevation Models). We estimated the error on the mean snow depth of the catchment from previous studies which compared Pléiades snow depth with independent measurements. Shaw et al. (2020a) found a 0.22 m bias against terrestrial LiDAR data over a small region of the same catchment while Deschamps-Berger et al. (2020) found a bias ∼0.1 m over a similarly complex terrain of comparable size in the Sierra Nevada, United States. Therefore we considered that
For the catchment-wide SDD, we follow the structure of Eq. 2 and weight the uncertainties by area:
Nivo-Meteorological Data
To relate the quantity and distribution of snow in each year to meteorological conditions during the preceding winter months, we utilised local automatic weather station (AWS) data for the region. We obtained data from the high elevation (2,995 m a.sl.) AWS, Termas del Plomo (Figure 1C) for the period 1st April to 31st October in both years. The station is maintained by the Chilean Water Directorate and contains information on air temperature (°C), relative humidity (%), wind speed (m s−1) and direction (°) and precipitation (mm/h). During 2019, precipitation data are missing for a period of 3 months (May-July). Therefore, we supported this data series with precipitation records from the long-term AWS, Yeso Embalse (2,475 m a.s.l.) for the same period (Figure 1B). We consider the beginning of the hydrological year (April) until the end of October in order to provide context to the nivo-meteorological conditions preceding and following the image acquisitions.
To explore the time series of snow cover in the preceding winter of each year, we extracted the daily catchment fractional snow cover area based upon a 0.2 threshold of the normalised difference snow index (NDSI) from the MODIS (MODerate resolution Imaging Spectroradiometer) MOD10A1 V6. dataset. This dataset was not validated within our study, though provides a generalised view of the snow cover evolution preceding the Pléiades acquisitions. Finally, to provide a historical context of climatic conditions for the 2 years under investigation, we also obtained air temperature and precipitation records from the long-term (1950-present) meteorological station, Quinta Normal (505 m a.s.l.), maintained in Santiago by the Chilean Meteorological Directorate. This site provides the longest modern record of precipitation in the country and emphasises the dramatic changes of winter precipitation under current drought conditions.
Results
Nivo-Meteorological Conditions of the 2017/2019 Winters
The winters of 2017 and 2019 were both dominated by warm and relatively dry conditions in the context of the historical records (Figure 3) that are characteristic of the current prolonged drought state of the region since 2010 (Garreaud et al., 2019). Nevertheless, comparing the 2 years under analysis, 2019 had experienced the second driest winter on record since 1950, up until the date of Pléiades acquisition (Figure 3A). 2019 had a mean AWS (Yeso Embalse) air temperature of 5.9°C between 1st April and 3rd September (average SnowON acquisition date of the 2 years), compared to 2.2°C in 2017. MODIS snow cover duration for this time period was 147 days in 2017, compared to 130 days in 2019. Snow initially fell a week later into the year for 2019, though quickly melted away, delaying the persistent winter snow cover until late May (Figure 4). Total precipitation recorded at Yeso Embalse AWS (Figure 1B) for the 1st April and 3rd September period was 156 mm for 2017 and only 30 mm for 2019 (∼80% less than 2017), with fewer large precipitation events (Figure 4). The 2019 winter was both drier and warmer, though typically experienced similar patterns in the speed and direction of the wind, interpreted from both Termas del Plomo AWS and the ERA5 reanalysis (Figure 4). 2019 experienced a greater quantity of winds from the northwest, though mean wind speeds were similar and no strong differences in the wind patterns were discernible between years. For the period of available data, there were no significant inter-annual differences in the measured incoming shortwave radiation for the lower catchment.
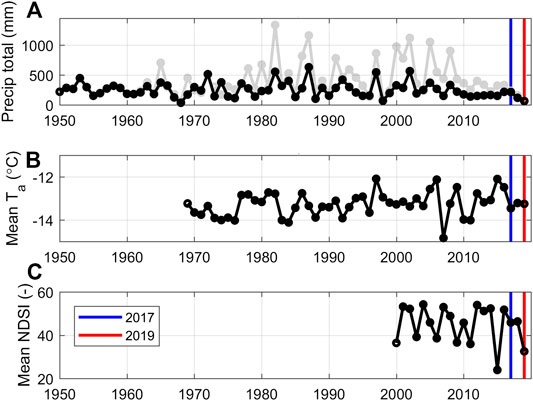
FIGURE 3. The historical records of (A) total precipitation (mm) for Quinta Normal (black) and Yeso Embalse (grey) and (B) mean winter air temperature (°C) at Quinta Normal (Figure 1) lapsed to the mean elevation of the catchment (4,150 m a.s.l.) using the environmental lapse rate (−6.5°C km-1). Panel c shows the mean NDSI derived from MODIS MOD10A1 V6 for the Rio Yeso catchment. All annual sums/means represent the period of 1st April–3rd September. The years 2017 and 2019 are marked.
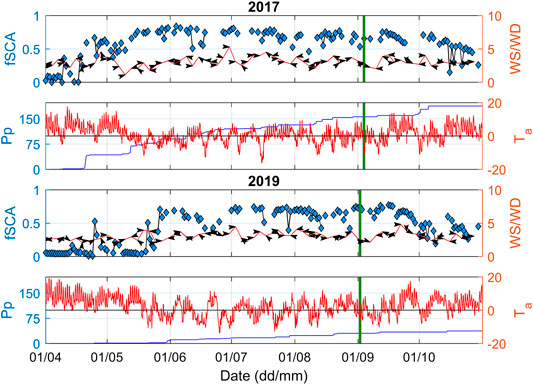
FIGURE 4. The winter meteorological conditions preceding the acquisition dates of Pléiades in 2017 and 2019 (vertical green bars). The upper panels for each year show the daily catchment-average fractional snow cover area (fSCA) using a 0.2 threshold of the normalised differential snow index (NDSI) from MODIS MOD10A1 V6 (blue diamonds) and the 5-days average wind speed (m s-1) and direction (arrows) derived from ERA5. The bottom panel for each year shows the cumulative precipitation (mm) record at Yeso Embalse automatic weather station (AWS) (blue line) and hourly temperature (°C) from Termas del Plomo AWS (red line).
Evaluation of Pléiades Digital Elevation Model Differences
Figure 5 shows the stable terrain residuals for individual years and the empirical cumulative distribution of stable terrain residuals between years (d2DEM). Inter-annual (2019–2017) stable terrain differences for the entire catchment reveal an uncertainty range of −0.36 to +0.24 m for the 25–75% confidence interval (Figure 5C), suggesting that within such range there is a 50% chance that SDD are the result of error. For bins of each topographic index (Topographic Indices of the Digital Elevation Model), uncertainty ranges are highly variable (see Supplementary Table S2), with ranges of −1.5 to +0.25 m for slopes >45° and the most convex TPI bin. For shallow slopes (<25°) with high sky view fraction, the range of uncertainty is typically within ±0.2 m.
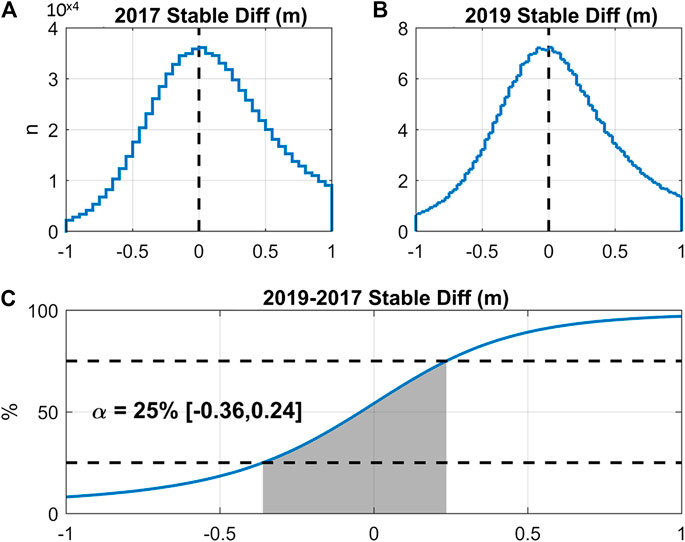
FIGURE 5. The evaluation of digital elevation model (DEM) differencing over stable terrain for 2017 (A), 2019 (B) and 2019–2017 (d2DEM - C). Scales are limited to −1 to +1 m for visualisation purposes. Panel C) shows the empirical cumulative distribution function with an alpha value of 25% (related to a 25–75th percentile). The shaded grey area represents the uncertainty band for all mutually stable terrain pixels in both years.
Pléiades-Derived Snow Depths
Figure 6 shows the spatial snow depths derived from Pléiades DEM differencing in each year at a horizontal resolution of 3 m. Snow accumulation on glaciers appears higher in almost all locations for 2017, though especially for the borders and headwall of Pirámide Glacier (through avalanching) and lower on the tongue of Bello Glacier (Figure 1C). Hummocky terrain in the Bello Glacier forefield revealed a much greater scarcity of snow in 2019 (Figure 6B). Patterns of snow-covered area are similar, though considering the surface classification of each SnowON image (Land Surface Classification), the calculated snow cover area is considered to be ∼60% in 2017, compared to 50% in 2019. We find mean snow depths of 1.27 ± 0.2 m and 0.92 ± 0.2 m in 2017 and 2019 respectively.
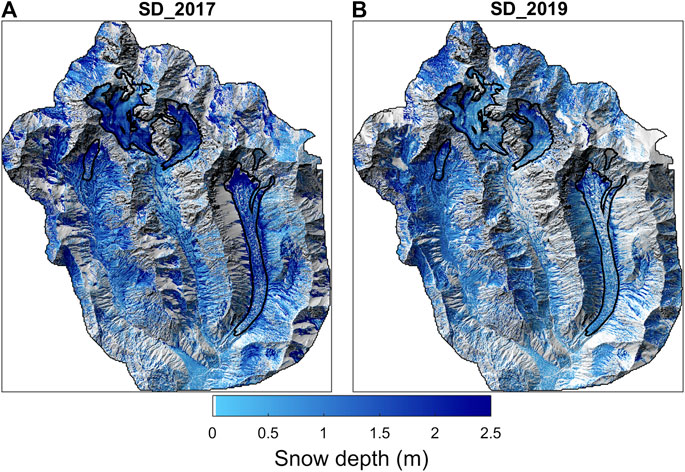
FIGURE 6. The spatial snow depth maps for 2017 (A) and 2019 (B), with axes limited to 0–2.5 m for clarity in the smaller depth values. With the exception of glacier areas (see text for explanation), snow depths were derived from digital elevation model (DEM) differencing of both September “SnowON” DEMs with the reference SnowOFF_2018 DEM.
Mean snow depths are related similarly to the topographic indices in each year (Figure 7) whereby sheltered, east facing slopes of 10‒30° possess the deepest snow depths. Those sites which represent moderately low sky-view fractions (0.5) are also subject to large inter-annual differences in snow depth, likely as a result of avalanche deposits at the base of steep slopes. In both years, the higher elevation (>4,500 m a.s.l.), steep slopes of a north facing orientation have the shallowest snow depths, as expected due to the effect of slope-dependent holding capacity, wind redistribution and radiative melting/sublimation of snow. The meteorological controls on snow melt/distribution are deemed to be similar based upon the observations from both AWS and reanalysis data sources. However, 2017 again shows a larger variability across all topographic indices.
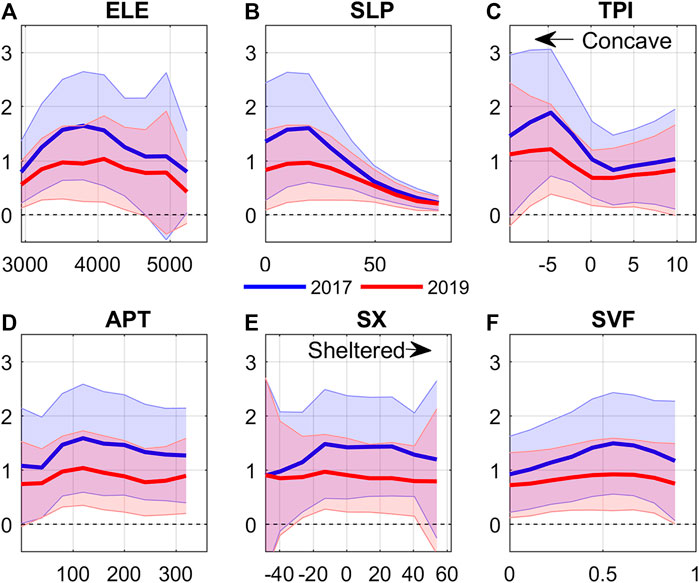
FIGURE 7. The mean (solid line) and standard deviation (shaded bars) of snow depth in 10 equal intervals of the topographic indices of the catchment (see text). ELE, elevation (m a.s.l.), SLP, slope (°), TPI, topographic position index (−), APT, aspect (°), SX, exposure (−) and SVF, sky view factor (−). Blue and red lines indicate the results for 2017 and 2019, respectively.
Quantifying Inter-annual Snow Depth Differences
The mean and standard deviations of SDD are plotted against topographic indices in Figure 8 with the related d2DEM stable terrain confidence intervals (grey shaded areas). The smallest confidence intervals are related to flatter and open terrain (Evaluation of Pléiades d Digital Elevation Models; Figure 8B; Supplementary Table S2) and most SDD values lie outside these confidence ranges. The largest SDD values are found for south-facing, concave slopes of slope <30° (Figure 8). Figure 9 shows the pixel-to-pixel SDD for the catchment, again highlighting the mostly negative differences due to dry conditions of the 2019 austral winter. Total mean catchment-wide SDD (Figure 9A) is −0.34 ± 0.29 m, with a volume change of −38 ± 20% in 2019, relative to 2017. Figures 9B,C shows the “strict” SDD, based upon removal of glacier and saturation areas and pixel differences within the confidence limits related to topography (Figure 8). With 23% of the total catchment area remaining for this analysis, we find a mean snow depth difference of −0.48 ± 0.28 m, and a 39 ± 15% reduction in 2019 total snow volume compared to 2017. The mean of negative differences is −0.84 m and +0.33 m for positive differences (i.e., for deeper snow depths in 2019). A large proportion of these negative differences appear to be associated with gullies and the base of steep, north-easterly slopes, though positive differences are more sporadic with no clear visible pattern (Figure 9C).
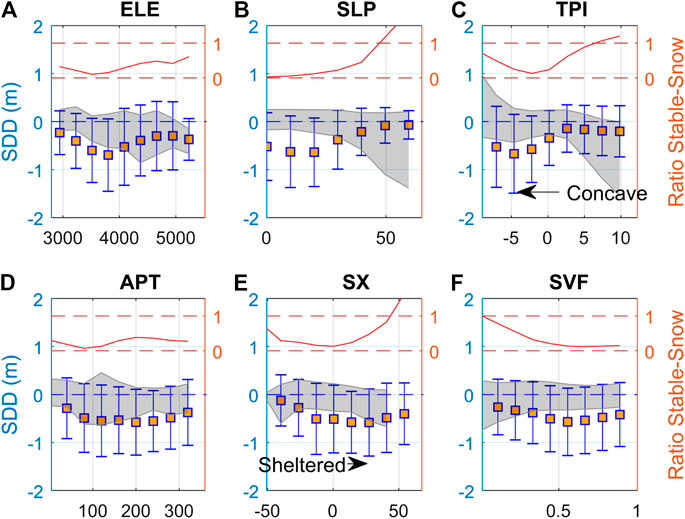
FIGURE 8. The mean (orange boxes) and standard deviation (error bars) of snow depth in 10 equal bins of the topographic indices of the catchment (named as in Figure 7; Topographic Indices of the Digital Elevation Model). The grey shaded area denotes the range of uncertainty in the stable terrain (d2DEM) for each bin of each index. The right-hand axes represent the ratio of stable to snow pixels for each bin and index (reference of 0 and 1 given by horizontal dashed lines). Low ratios are noted to still have >20,000 stable terrain pixels in total. Arrows for TPI and SX are used to clarify the meaning of positive and negative values for those indices.
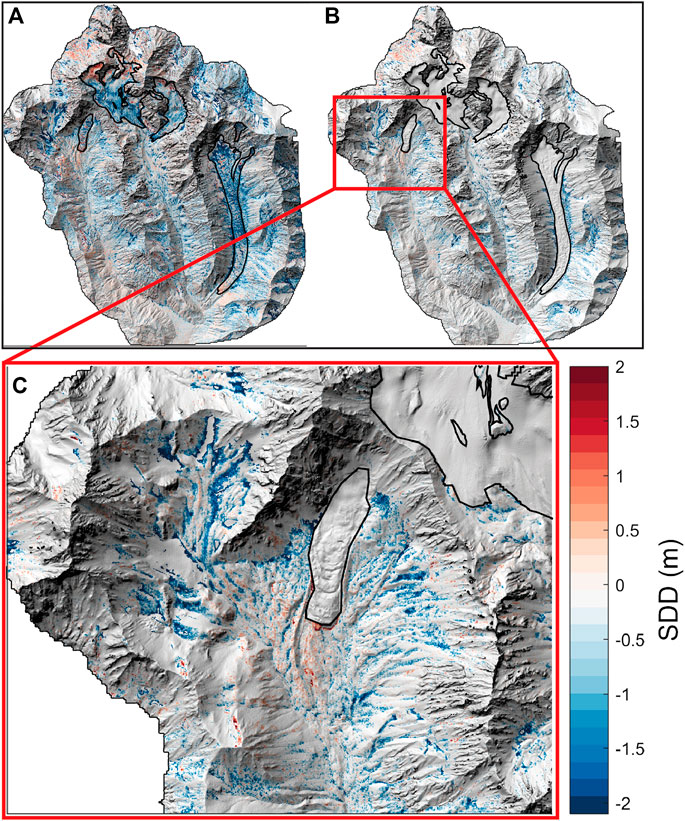
FIGURE 9. A map of the snow depth difference [snow depth difference (SDD - m)] for all pixels (A) and the restricted changes that exclude i) glacier areas, ii) areas of saturation and iii) differences within the uncertainty of the topographic indices (B). SDD (2019–2017) is shown in a range of −2 to +2 m whereby negative values indicate that 2019 had less snow depth. Panel C shows the zoomed panel in a subregion to highlight the detail of pixel-to-pixel differences. Gray areas in panel A are associated with no snow and in B,C where changes are ignored due to the above criteria.
Negative SDDs are associated more often with shallower slopes (Figure 10B) that are more sheltered (Figure 10E) and are concentrated in a bimodal pattern of east and west facing slopes (Figure 10D). Smaller SDD between years, those that are within the confidence limits of the Pléiades observations, are typically found at lower elevations with steeper, convex slopes than the larger negative differences (not shown), though otherwise follow similar patterns related to topography. Positive SDDs are more common for steep slopes of an east facing orientation, though do not relate well to any of the topographic indices.
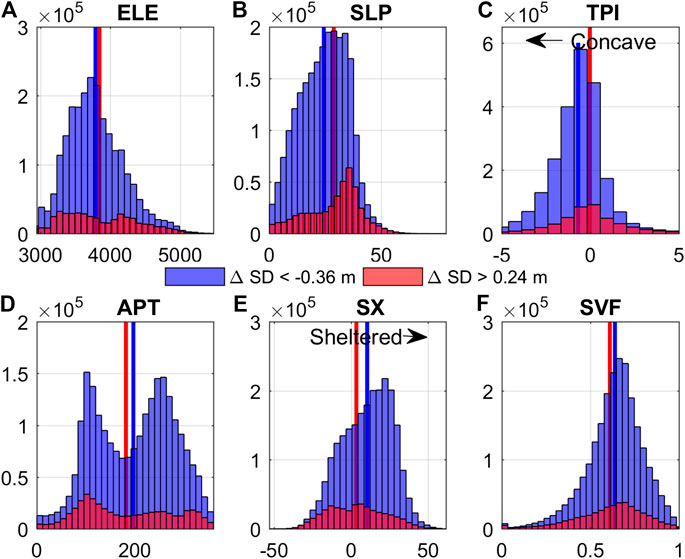
FIGURE 10. A histogram of the frequency of occurrence of negative (blue) or positive (red) snow depth difference for topographic indices outside of the uncertainty band for all stable terrain (Figure 5). Vertical bars show the mean value for each grouping. Y-axes differ. Arrows for TPI and SX are used to clarify the meaning of positive and negative values for those indices.
We find that in 2019, snow absence is typically more common at lower elevations (Figure 11A), related to the warmer conditions of the 2019 winter (Figures 3, 4). Absence of snow in 2019 is common for west facing pixels of the catchment (Figure 11D) and those that are with a higher sky view factor (Figure 11F), suggesting a possible link to the radiative energy balance of the catchment and the relative timing of winter snowfalls and cloud-free days during the preceding winter. Absence of snow in 2017 shows a lesser, albeit similar relation to each topographic index, though is most noteworthy for slopes >30° (Figure 11B). The mean of 2017 and 2019 snow depths were 0.68 and 0.70 m, respectively for the areas of snow absence in the alternative year. These areas represent 9.9% and 1.7% of the total catchment area, respectively.
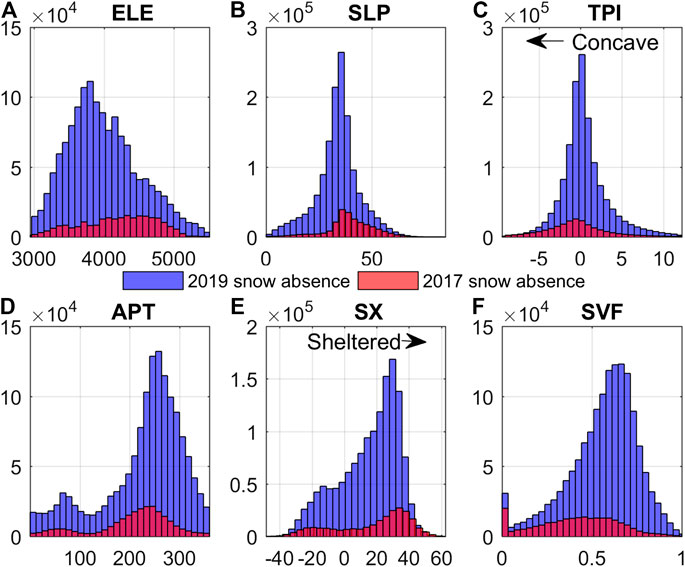
FIGURE 11. Histograms of snow absence in 1 year only (2019 in blue and 2017 in red) when grouped against the topographical indices. Arrows for TPI and SX are used to clarify the meaning of positive and negative values for those indices.
Discussion
Snow Depth vs. Meteorology of the Central Andes
The recent, prolonged occurrence of drought for the central Chilean Andes is of serious concern for the future water security of the region (Meza et al., 2015; Garreaud et al., 2019). Ayala et al. (2020) estimated that glacier contributions to streamflow of the Maipo River (1955–2099) may have already peaked if climate was to stabilize at the level of the past two decades. Such model findings of the last decades also support the large scale observed patterns in glacier mass balance related to the so-called “mega-drought” (Braun et al., 2019; Dussaillant et al., 2019; Farias-Barahona et al., 2019; Farias-Barahona et al., 2020a; Farias-Barahona et al., 2020b; Masiokas et al., 2020). Nevertheless, the relative contributions of glaciers are governed by the hydrological snow year in the upper catchments of the central Andes, which are typically snow-dominated. For example, estimates of annual streamflow contribution from snowmelt for the Rio Yeso catchment are up to 97% for wet years (Burger et al., 2019) and estimated as 54 ± 10% on average for the entire Maipo catchment of 4,843 km2 between 1955–2016 (Ayala et al., 2020).
The key challenge of all such modelling studies in mountainous regions to date, is the uncertainty in the distribution of solid precipitation in space and time (Ragettli et al., 2014; Ayala et al., 2016; Burger et al., 2019; Ayala et al., 2020; Shaw et al., 2020b), largely governed by the lack of high elevation data and/or the reliability of high elevation snow-precipitation records (e.g., Scaff et al., 2018). Shaw et al. (2020a) addressed this challenge by using Pléiades DEM differencing to obtain an estimate of snow depth for the Rio Yeso catchment. Their study showed that deviations from this observed snow volume could be up to ∼30% if modelling snow depths based upon local meteorological information from the catchment outlet (Termas del Plomo AWS presented here). While this AWS provides one of the highest elevation observations available for the region, calibrating a precipitation gradient from this and other, high elevation weather stations of the region was alone not sufficient to characterise the accumulation and likely re-distribution of snow observed over the >2,400 m elevation range of the catchment.
In this study, we have expanded this research focus to investigate the differences in snow depth between 2 years of the drought period (Figure 3), updating the general workflow based upon recent findings of Deschamps-Berger et al. (2020) and characterising the uncertainties in a robust manner. Our findings suggest that static, elevation-dependent precipitation gradients (such as in the aforementioned studies) would not be sufficiently robust to apply to multiple years of AWS data in the hopes of estimating high elevation snow volumes (Figure 7). For example, we find approximately an 80% reduction of measured 2019 winter precipitation at the Yeso Embalse AWS (Figure 1B) when compared to the 2017 winter, though we find a difference of −39 ± 15% in the snow volumes of snow covered cells outside the 25–75% confidence limit (23% of the total catchment) and −10% difference in the snow-covered area of the entire catchment.
The consistent patterns of snow-covered area between years, despite sizeable differences in the observed volume of snow (Figure 6; Supplementary Figure S2) implicates the strong control of both topography (such as exposure or slope) and its interaction with local meteorological conditions (such as incoming shortwave radiation and wind speed/direction) in determining the spatial distribution of snow. Whereas snow volumes have an evident connection to the total precipitation occurring in the basin or in nearby basins (e.g., Termas del Plomo or Yeso Embalse AWSs), the topography acts as a stronger predictor for snow melt, sublimation or mechanical removal (avalanching or wind redistribution), producing very similar inter-annual patterns of snow cover for the end-of-winter. The relationship of snow depth and meteorology can also be inferred from the catchment topography, which combines orographic precipitation differences with elevation up to a threshold (∼4,000 m a.s.l.) followed by the dominant role of ablation or redistribution at high elevation steep and north facing slopes. The mean snow depths at elevations >4,000 m a.s.l. are mostly sustained by concave landforms that receive avalanched snow and protect it from both ablation or wind redistribution (TPI, SX and SVF indices).
Comparing records of precipitation at the Embalse Yeso and Termas del Plomo AWS in 2017 (not shown), we find that the former could not represent all of the same precipitation events seen by Termas del Plomo AWS in the study catchment (Shaw et al., 2020b). Therefore, we can infer that at least some of the differences in the Yeso Embalse precipitation records and Pléiades observations may be explained by orographic precipitation differences between these stations or by storms originating from Argentina. Additionally, the high uncertainties of volume change at the full catchment scale (−38 ± 20%) and a greater snow compaction of thicker snow packs in 2017 may also partly affect the distinct differences between observed precipitation and snow depth for the catchment.
Unfortunately, Termas del Plomo AWS records were partly missing for the 2019 winter and so differences in timing and magnitude of precipitation events cannot be fully assessed here. Even so, this emphasises the immense difficulty in attempting to model changes of large catchment hydrology using statistically-derived forcing of precipitation and highlights the potential advantages of satellite stereo DEMs for calibration, validation or initial conditions in glacio-hydrological models (Vögeli et al., 2016; Shaw et al., 2020b). While a greater number of high-elevation AWSs would be highly recommendable to support such glacio-hydrological modelling and improve process understanding of snow accumulation and remobilisation of catchments in the Andes (Shaw et al., 2020b), the inferred radiative and wind processes based upon high resolution topography and low-elevation meteorological AWSs are perhaps sufficient to account for the smaller expected differences in snow-covered area. A key challenge remains for linking precipitation events, wind variability and snow depth at the highest reaches of the mountain catchments, especially because the available data for snow depth offers only a snap shot in time (Figure 4). Nevertheless, the emergence of decimetre accuracy Pléiades and World-View products to estimate snow depth (Marti et al., 2016; McGrath et al., 2019; Shaw et al., 2020a; Deschamps-Berger et al., 2020) may offer new potential in how we can constrain high mountain precipitation, though further steps are required to relate localised in situ meteorological observations to catchment-wide snow volumes on an inter-annual basis.
Limitations of Pléiades for Multi-Annual Snow Depth Derivation
We have presented 2 years of snow depth estimates for almost the same day of year, using the same methodology provided by Deschamps-Berger et al. (2020). The fact that we difference both September DEMs with the same SnowOFF_2018 reference DEM arguably creates a more robust test of the inter-annual differences in snow depth. Nevertheless, the inconsistent acquisition geometries between years means that DEM quality is variable and resulted in data loss. For example, the issues of saturation in the 2017 image acquisition had limited the area of the basin that was comparable between years (by approximately 17% - Shaw et al. (2020a)). This was largely due to non-standardised acquisition parameters set by the tasking, an issue that can be mitigated by specifying the time domain integration (TDI) lines to image the scene. We therefore highlight that there are limitations that are specific to our study (such as saturation or image timing and change detection over glaciers) that are not necessarily representative of the capabilities of Pléiades for snow depth mapping in other domains (Marti et al., 2016). Nevertheless, future tasking of images for this region could benefit from standardisation of acquisition parameters that lead to fewer image saturation problems and data loss.
A further issue with the work presented here is that we are unable to quantify inter-annual variability of shallow snow depths (i.e., small DEM differences) that are particularly prevalent under recent drought conditions, especially for the winter of 2019. Approximately 9% of the total 3 m pixels from the Pléiades acquisition area were within the 25–75% confidence limits calculated from the topographic indices (grey band of Figure 8). This is therefore a sizeable proportion of the catchment that cannot be reliably considered in analyses for inter-annual differences. Nevertheless, evidence of snow-covered area changes from the classification of the high resolution e.g., multispectral Pléiades images allows an analysis of factors that may have affected the presence/absence of snow in a given year (Figure 11). From this we establish that exposure, slope and aspect control a large proportion of the absences of snow in 2019 (Figure 11) that can likely be explained by radiative fluxes during the winter. Given that differences in snow-covered areas are therefore typical for steeper slopes, we can assume that snow depths for the year where snow is still present are small given the likely slope holding capacity (Bernhardt and Schulz, 2010). Such smaller differences in spatial snow depth have been shown to have minimal impact upon models of monthly streamflow (e.g., Shaw et al., 2020b) and therefore uncertainty of the reported magnitudes may not be crucial, especially when spatially resampling to coarser resolutions (Deschamps-Berger et al., 2020).
In relation to the relative errors for stable and snow-covered terrain (Figure 8), we assumed that stable terrain uncertainties were representative of the SDD uncertainties, and this can be partially supported by the fact that the stable terrain pixels are well distributed across all of the topographic indices (Figure 8). As previously mentioned, studies of this type typically lack a large-scale reference dataset, such as that provided by ASO. Comparing Pléiades and ASO snow depths, Deschamps-Berger et al. (2020) in fact found a higher error for snow-covered pixels than over stable terrain. The authors partly attribute this to the presence of vegetation and to the co-registration process optimized on stable terrain within their study catchment. We highlight that at least the former is not applicable to the Rio Yeso catchment due to the lack of vegetation. Nevertheless, a full assessment of the stable vs. snow errors are not possible given the data availability of this study.
We estimated the mean error from studies which measured error on similar mountainous terrain with independent validation datasets (Deschamps-Berger et al., 2020; Shaw et al., 2020a). We are aware that this neglects the specificity of each study site, though given that the error was estimated over a catchment of similar size and complex topography by Deschamps-Berger et al. (2020), we believe that it provides a typical range of errors that are relevant for the Rio Yeso catchment.
Finally, we identify that our late winter DEMs aid snow depth estimation only for a brief snapshot in time (Margulis and Fang, 2019; Shaw et al., 2020b). Therefore, these single yearly observations may obscure partly the causes of snow depths in the months preceding and thus it is difficult to build a story of the full winter-time accumulation record (Figure 4). Hedrick et al. (2018) utilised multiple snow depth maps of a single winter season from the aforementioned ASO data in order to update the SWE conditions within an energy balance routine. Their study found a large improvement in SWE estimation if the model had previously been updated with observations of the ASO, thus demonstrating the advantages of a higher temporal resolution for such detailed spatial snow depth datasets. While this could be a recommendation for future work on snow depth derivation and has previously been performed using Pléiades data for glacier mass balance studies (Belart et al., 2017), multiple spaceborne stereo DEMs obtained throughout the season likely could not detect smaller snow accumulation events within the likely uncertainties reported (Marti et al., 2016; McGrath et al., 2019; Deschamps-Berger et al., 2020; Shaw et al., 2020a). Our study has provided a generalised workflow of comparing Pléiades-derived snow depths for two distinct years. However, the calculated levels of uncertainty are both difficult to fully quantify, but also clearly larger than LiDAR-derived snow depths from dedicated surveys (Painter et al., 2016). Accordingly, calculating snow depths and snow depth differences from spaceborne photogrammetry, as presented here, one should carefully plan acquisitions based upon sound knowledge of the local conditions (such as the typical length and intensity of the core winter season and timing of the SWE maxima).
Future Directions
Further years of data, even at single “well-timed” end-of-winter dates could have benefits for modelling seasonal streamflow (Li et al., 2019; Margulis and Fang, 2019; Shaw et al., 2020b), calibration of suitable parameterisations for snow accumulation (e.g., solid precipitation threshold) or elevation gradients of forcing variables, namely precipitation (Ragettli et al., 2014; Ayala et al., 2016; Vögeli et al., 2016; Burger et al., 2019; Ayala et al., 2020). In combination with the increasing resolution of (merged) snow cover products at short revisit periods (e.g., Gascoin et al., 2019), leveraging more, “well-timed” Pléiades imagery may improve our ability to characterize the snow cover distribution and evolution in mountain environments, in particular for data-scarce regions such as the central Andes. We recognise a potential limitation that our comparison years (and possibly future observation years) were during a prolonged and severe drought period (Garreaud et al., 2019), and therefore any parameterisations based upon meteorology or topography using these snow depth datasets may not be applicable to years not under such drought conditions. Nevertheless, the clear contrast of information from in situ observations and high resolution spatial snow depths presented here argue a strong need for further research into forming a link between the high spatial (Pléiades) and temporal (winter AWS records) data series with further years of high resolution data.
Conclusion
We present, for the first time, a comparison of 2 years of high resolution, 3 m Pléiades-derived snow depth maps for a high mountain catchment of the central Chilean Andes, building on an initial study for the same catchment. Applying a recently updated methodology for tri-stereo photogrammetry and robustly assessing uncertainties, we compare the pixel-to-pixel and grouped snow depth differences based upon topographic indices (e.g., slope, aspect, sky view) between the late winter of 2017 and 2019.Both years represented drought conditions for the region, though 2019 experienced the second driest winter for the observation record (1950-present), resulting in an 80% reduction of winter (April-September) precipitation compared to 2017 at a high elevation AWS (2,475 m a.s.l.) available in both years. Nevertheless, we find a 10% reduction in snow-covered area for the total catchment and a mean −0.48 ± 0.28 m snow depth difference and 39 ± 15% reduction in total snow volume (2019−2017) for the pixels restricted by stable terrain uncertainty ranges of binned topography indices (23% of the total catchment). We find that the largest differences in snow depth and snow-covered area are related to the aspect, exposure and slope, such that greater depth (and presence) of snow in 2017 was found for west-facing, sheltered pixels of moderate slope (30–40°). Areas of greater snow depth in 2019 appear related to north-easterly slopes of 30–40°, though no clear explanations relating to wind re-mobilisation or other meteorological phenomena are apparent. Smaller snow volumes of 2019 relate to warmer conditions, lack of winter precipitation and a likely role of the winter energy balance on thin and patchy snowpacks. Nevertheless, we identify a clear need to relate the high spatial (Pléiades) and temporal (AWS) scales within the available datasets in order to address the distinct differences between measured precipitation at lower elevations and observed snow depths at higher elevations. We recommend leveraging further observations of satellite-derived snow depths combined with newly developed snow-cover products to construct a history of the winter snow accumulation regime at such high mountain sites.
Data Availability Statement
The datasets presented in this study can be found in online repositories. The names of the repository/repositories and accession number(s) can be found below: http://doi.org/10.5281/zenodo.3924571.
Author Contributions
TS, CD-B and SG planned the experimental design. SG acquired the Pléiades imagery. CD-B and SG processed the DEMs with input from TS. TS wrote the manuscript with edits, inputs and revisions from CD-B, SG and JM.
Funding
This work recognises funding from the FONDECYT projects of TS (3180145) and JM (1171032). Imagery was acquired through DINAMIS (Dispositif Institutionnel National d’Approvisionnement Mutualisé en Imagerie Satellitaire). SG acknowledges support from CNES Tosca and Programme National de Télédétection Spatiale (PNTS,http://www.insu.cnrs.fr/pnts), grant n°PNTS-2018-4. Snow depth maps and topographic indices presented in this work are available at the following Zenodo open-access repository: 10.5281/zenodo.3924571.
Conflict of Interest
The authors declare that the research was conducted in the absence of any commercial or financial relationships that could be construed as a potential conflict of interest.
Supplementary Material
The Supplementary Material for this article can be found online at: https://www.frontiersin.org/articles/10.3389/feart.2020.579142/full#supplementary-material.
References
Alvarez-Garreton, C., Mendoza, P. A., Boisier, J. P., Addor, N., Galleguillos, M., Zambrano-bigiarini, M., et al. (2018). The CAMELS-CL dataset: catchment attributes and meteorology for large sample studies–Chile dataset. Hydrol. Earth Syst. Sci. 22, 5817–5846. doi:10.5194/hess-22-5817-2018
Anderson, S. W. (2019). Uncertainty in quantitative analyses of topographic change: error propagation and the role of thresholding. Earth Surf. Process Landforms 1033, 1015–1033. doi:10.1002/esp.4551
Arheimer, B., Donnelly, C., and Lindström, G. (2017). Regulation of snow-fed rivers affects flow regimes more than climate change. Nat. Commun. 8 (1), 62–68. doi:10.1038/s41467-017-00092-8
Ayala, Á., Farías-Barahona, D., Huss, M., Pellicciotti, F., McPhee, J., and Farinotti, D. (2020). Glacier runoff variations since 1955 in the Maipo River basin, in the semiarid Andes of central Chile. Cryosphere 14, 2005–2027. doi:10.5194/tc-14-2005-2020
Ayala, Á., Pellicciotti, F., MacDonell, S., McPhee, J., Vivero, S., Campos, C., et al. (2016). Modelling the hydrological response of debris-free and debris- covered glaciers to present climatic conditions in the semiarid Andes of central Chile, Hydrol. Processes 30 (22), 4036–4058. doi:10.1002/hyp.10971
Baba, M. W., Gascoin, S., Jarlan, L., Simonneaux, V., and Hanich, L. (2018). Variations of the snow water equivalent in the ourika catchment (Morocco) over 2000–2018 using downscaled MERRA-2 data. Water 10 (1120) doi:10.3390/w10091120
Bagnardi, M., González, P. J., and Hooper, A. (2016). High-resolution digital elevation model from tri-stereo pleiades-1 satellite imagery for lava flow volume estimates at Fogo Volcano. Geophys. Res. Lett. 43, 6267–6275 doi:10.1002/2016GL069457
Belart, J. M. C., Berthier, E., Magnússon, E., Anderson, L. S., Pálsson, F., Thorsteinsson, T., et al. (2017). Winter mass balance of Drangajökull ice cap (NW Iceland ) derived from satellite sub-meter stereo images. Cryosphere 11, 1501–1517. doi:10.5194/tc-11-1501-2017
Bernhardt, M., and Schulz, K. (2010). SnowSlide: a simple routine for calculating gravitational snow transport. Geophys. Res. Lett. 37 (11), 1–6. doi:10.1029/2010GL043086
Berthier, E., Arnaud, Y., Kumar, R., Ahmad, S., Wagnon, P., and Chevallier, P. (2007). Remote sensing estimates of glacier mass balances in the Himachal Pradesh (western Himalaya, India). Remote Sens. Environ. 108 (3), 327–338. doi:10.1016/j.rse.2006.11.017
Berthier, E., Vincent, C., Magnússon, E., Gunnlaugsson, P., Pitte, P., Le Meur, E., et al. (2014). Glacier topography and elevation changes derived from Pléiades sub-meter stereo images. Cryosphere 8 (6), 2275–2291. doi:10.5194/tc-8-2275-2014
Biemans, H., Siderius, C., Lutz, A. F., Ahmad, B., Hassan, T., Bloh, W. V., et al. (2019). Importance of snow and glacier meltwater for agriculture on the Indo-Gangetic Plain. Nat. Sustain. 2 (7), 594–601. doi:10.1038/s41893-019-0305-3
Błaszczyk, M., Ignatiuk, D., Grabiec, M., Kolondra, L., Barzycka, B., and Czapla, M. (2019). Quality assessment and glaciological applications of digital elevation models derived from space-borne and aerial images over two tidewater glaciers of southern spitsbergen. Rem. Sens. 11, 1–21. doi:10.3390/rs11091121
Braun, M. H., Malz, P., Sommer, C., Farías-Barahona, D., Sauter, T., Casassa, G., and , T. C. (2019). Constraining glacier elevation and mass changes in South America. Nat. Clim. Change 9 (2), 130–136. doi:10.1038/s41558-018-0375-7
Brun, F., Wagnon, P., Berthier, E., Shea, J. M., Immerzeel, W. W., Kraaijenbrink, P. D. A., et al. (2018). Ice cliff contribution to the tongue-wide ablation of Changri Nup Glacier, Nepal, central Himalaya. Cryosphere 12, 3439–3457. doi:10.5194/tc-12-3439-2018
Buhler, Y., Adams, M. S., Bosch, R., and Stoffel, A. (2016). Mapping snow depth in alpine terrain with unmanned aerial systems (UASs): potential and limitations. Cryosphere 10 (3), 1075–1088. doi:10.5194/tc-10-1075-2016
Burger, F., Ayala, Á., Farias-Barahona, D., Shaw, T. E., MacDonell, S., Brock, B., et al. (2019). Interannual variability in glacier contribution to runoff from a high ‐ elevation Andean catchment: understanding the role of debris cover in glacier hydrology. Hydrol. Processes, 33 (2), 214–229. doi:10.1002/hyp.13354
Cornwell, E., Molotch, N. P., and Mcphee, J. (2016). Spatio-temporal variability of snow water equivalent in the extra-tropical Andes Cordillera from distributed energy balance modeling and remotely sensed snow cover. Hydrol. Earth Syst. Sci. 20, 411–430. doi:10.5194/hess-20-411-2016
Cortés, G., Girotto, M., and Margulis, S. (2016). Snow process estimation over the extratropical Andes using a data assimilation framework integrating MERRA data and Landsat imagery. Water Resour. Res. 52, 2582–2600. doi:10.1002/2015WR018376
Currier, W. R., Justin, P., Mazzotti, G., Jonas, T., Deems, J. S., Bormann, K. J., et al. (2019). Comparing aerial lidar observations with terrestrial lidar and snow ‐ probe transects from NASA’s 2017SnowEx campaign water resources research. Water Resour. Res. 55, 6285–6294. doi:10.1029/2018WR024533
Deems, J. S., Gadomski, P. J., Vellone, D., Evanczyk, R., Lewinter, A. L., Birkeland, K. W., et al. (2015). Cold regions science and technology mapping starting zone snow depth with a ground-based lidar to assist avalanche control and forecasting. Cold Reg. Sci. Technol. 120, 197–204 doi:10.1016/j.coldregions.2015.09.002
Deschamps-Berger, C., Gascoin, S., Berthier, E., Deems, J., Gutmann, E., Dehecq, A., et al. (2020). Snow depth mapping from stereo satellite imagery in mountainous terrain: evaluation using airborne lidar data. Cryosphere 14, 2925–2940. doi:10.5194/tc-14-2925-2020
Dussaillant, I., Berthier, E., Brun, F., Masiokas, M., Hugonnet, R., Favier, V., et al. (2019). Two decades of glacier mass loss along the Andes. Nat. Geosci. 12 (10). 802–808. doi:10.1038/s41561-019-0432-5
Farias-Barahona, D., Ayala, Á., Bravo, C., Seehaus, T., Vijay, S., Schaefer, M., et al. (2020a). 60 years of glacier elevation and mass changes in the Maipo River basin, central Andes of Chile. Rem. Sens. 12, 1–19. doi:10.3390/rs12101658
Farias-Barahona, D., Casassa, G., Schaefer, M., Burger, F., Seehaus, T., Iribarren-Anacona, P., et al. (2019). Geodetic mass balances and area changes of echaurren norte glacier (central Andes, Chile ) between 1955 and 2015. Rem. Sens. 11 (260), 1–17. doi:10.3390/rs11030260
Farías-Barahona, D., Wilson, R., Bravo, C., Vivero, S., Caro, A., Shaw, T. E., et al. (2020b). A near 90-year record of the evolution of El Morado Glacier and its proglacial lake, Central Chilean Andes. J. Glaciol. 66 (259), 846–860. doi:10.1017/jog.2020.52
Fayad, A., Gascoin, S., Faour, G., Fanise, P., Drapeau, L., Somma, J., et al. (2017). Snow observations in mount-Lebanon (2011–2016). Earth Syst. Sci. Data 9, 573–587 doi:10.5194/essd-9-573-2017
Garreaud, R. D. (2009). The Andes climate and weather. Adv. Geosci. 7, 3–11. doi:10.5194/adgeo-22-3-2009
Garreaud, R. D., Alvarez-Garreton, C., Barichivich, J., Pablo Boisier, J., Christie, D., Galleguillos, M., et al. (2017). The 2010–2015 megadrought in central Chile: impacts on regional hydroclimate and vegetation. Hydrol. Earth Syst. Sci. 21 (12), 6307–6327. doi:10.5194/hess-21-6307-2017
Garreaud, R. D., Boisier, J. P., Rondanelli, R., Montecinos, A., and Veloso-Aguila, D. (2019). The central chile mega drought (2010–2018): a climate dynamics perspective. Int. J. Climatol. 40 (1), 421–439. doi:10.1002/joc.6219
Gascoin, S., Grizonnet, M., Bouchet, M., Salgues, G., and Hagolle, O. (2019). Theia Snow collection: high-resolution operational snow cover maps from sentinel-2 and landsat-8 data. Earth Syst. Sci. Data 11, 493–514. doi:10.5194/essd-11-493-2019
Gascoin, S., Lhermitte, S., Kinnard, C., Bortels, K., and Liston, G. E. (2013). Wind effects on snow cover in Pascua-Lama, dry Andes of Chile. Adv. Water Resour. 55, 25–39. doi:10.1016/j.advwatres.2012.11.013
Grizonnet, M., Michel, J., Poughon, V., Inglada, J., Savinaud, M., and Cresson, R. (2017). Software and Standards Orfeo ToolBox: open source processing of remote sensing images. Open Geospatial Data, Softw. Stand. 2, 15. doi:10.1186/s40965-017-0031-6
Hall, D. K., Riggs, G. A., Foster, J. L., and Kumar, S. V. (2010). Remote sensing of environment development and evaluation of a cloud-gap- filled MODIS daily snow-cover product. Remote Sens. Environ. 114 (3), 496–503. doi:10.1016/j.rse.2009.10.007
Harpold, A. A., Guo, Q., Molotch, N. P., Brooks, P. D., Bales, R., Fernandez-Diaz, J. C., et al. (2014). LiDAR-derived snowpack data sets from mixed conifer forests across the western United States. Water Resour. Res. 50, 1–7. doi:10.1002/2013WR013935
Hedrick, A., States, U., Marks, D. G., Marshall, H., and Bormann, K. J. (2018). Direct insertion of NASA airborne snow observatory-derived snow depth time series into the iSnobal energy balance snow model direct insertion of NASA airborne snow observatory-derived snow depth time series into the iSnobal energy balance snow model. Water Resour. Res. 54, 8045‒8063. doi:10.1029/2018WR023190
Li, D., Lettenmaier, D. P., Margulis, S. A., and Andreadis, K. (2019). The value of accurate high-resolution and spatially continuous snow information to streamflow forecasts. J. Hydrometeorol. 20, 731–749. doi:10.1175/JHM-D-18-0210.1
Mankin, J. S., Viviroli, D., Mesfin, M., Rastogi, D., and Ashley, W. S. (2015). The potential for snow to supply human water demand in the present and future the potential for snow to supply human water demand in the present and future. Environ. Res. Lett. 10, 114016. doi:10.1088/1748-9326/10/11/114016
Margulis, S. A., and Fang, Y. (2019). The utility of infrequent snow depth images for deriving continuous space ‐ time estimates of seasonal snow water equivalent geophysical research letters. Geophys. Res. Lett. 46, 5331–5340. doi:10.1029/2019GL082507
Marti, R., Gascoin, S., Berthier, E., Pinel, M. De., Houet, T., and Laffly, D. (2016). Mapping snow depth in open alpine terrain from stereo satellite imagery. Cryosphere 10 (4), 1361–1380. doi:10.5194/tc-10-1361-2016
Masiokas, M. H., Rabatel, A., Rivera, A., Ruiz, L., Pitte, P., Ceballos, J. L., et al. (2020). A review of the current state and recent changes of the Andean cryosphere. Front. Earth Sci. 8, 1–27. doi:10.3389/feart.2020.00099
Masiokas, M. H., Villalba, R., Luckman, B., Le Quesne, C., and Aravena, J.-C. (2006). Snowpack variations in the central andes of Argentina and Chile, 1951–2005: large-scale atmospheric influences and implications for water resources in the region. J. Clim. 19 (24), 6334–6352. doi:10.1175/jcli3969.1
McGrath, D., Webb, R., Shean, D., Bonnell, R., Marshall, H. P., Painter, T. H., et al. (2019). Spatially extensive ground ‐ penetrating radar snow depth observations during NASA’s 2017 snowex campaign: comparison with in situ, airborne, and satellite observations water resources research. Water Resour. Res. 55, 10026–10036. doi:10.1029/2019WR024907
Melkonian, A. K., Willis, M. J., Pritchard, M. E., and Stewart, A. J. (2016). Remote sensing of environment recent changes in glacier velocities and thinning at novaya zemlya. Remote Sens. Environ. 174, 244–257. doi:10.1016/j.rse.2015.11.001
Mernild, S. H., Liston, G. E., Hiemstra, C. A., Malmros, J. K., Yde, J. C., and Mcphee, J. (2016). The Andes Cordillera. Part I: snow distribution, properties, and trends (1979–2014). Int. J. Climatol. 37 (4), 1680–1698. doi:10.1002/joc.4804
Meza, F. J., Vicuna, S., Gironás, J., Poblete, D., Oertel, M., Meza, F. J., et al. (2015). Water–food–energy nexus in Chile: the challenges due to global change in different regional contexts. Water Int. 40 (5‒6), 839–855. doi:10.1080/02508060.2015.1087797
Möller, D., Andreadis, K. M., Bormann, K. J., Hensley, S., and Painter, T. H. (2017). Mapping snow depth from ka-band interferometry: proof of concept and comparison with scanning lidar retrievals. Geosci. Rem. Sens. Lett. 14 (6), 886–890. doi:10.1109/LGRS.2017.2686398
Nolan, M., Larsen, C., and Sturm, M. (2015). Mapping snow depth from manned aircraft on landscape scales at centimeter resolution using structure-from-motion photogrammetry. Cryosphere 9, 1445–1463. doi:10.5194/tc-9-1445-2015
Nuth, C., and Kääb, A. (2011). The Cryosphere co-registration and bias corrections of satellite elevation data sets for quantifying glacier thickness change. Cryosphere 5 (1), 271–290. doi:10.5194/tc-5-271-2011
Painter, T. H., Berisford, D. F., Boardman, J. W., Bormann, K. J., and Deems, J. S. (2016). The airborne snow observatory: fusion of scanning lidar, imaging spectrometer, and physically-based modeling for mapping snow water equivalent and snow albedo. Remote Sens. Environ. 184, 139–152. doi:10.1016/j.rse.2016.06.018
Ragettli, S., Cortés, G., Mcphee, J., and Pellicciotti, F. (2014). An evaluation of approaches for modelling hydrological processes in high-elevation, glacierized Andean watersheds. Hydrol. Process. 28 (23), 5674–5695. doi:10.1002/hyp.10055
Ren, S., Menenti, M., Jia, L., Zhang, J., and Zhang, J. (2020). Glacier mass balance in the nyainqentanglha mountains between 2000 and 2017 retrieved from ZiYuan-3 stereo images and the SRTM DEM. Rem. Sens. 12 (5), 864. doi:10.3390/rs12050864
Revuelto, J., López-Moreno, J. I., Azorin-Molina, C., and Vicente-Serrano, S. M. (2014). Topographic control of snowpack distribution in a small catchment in the central Spanish Pyrenees: intra- and inter-annual persistence. Cryosphere 8 (5), 1989–2006. doi:10.5194/tc-8-1989-2014
Saavedra, F. A., Kampf, S. K., Fassnacht, S. R., and Sibold, J. S. (2018). Changes in Andes snow cover from MODIS data, 2000–2016. Cryosphere 12, 1027–1046. doi:10.5194/tc-12-1027-2018
Scaff, L., Rutllant, J., Rahn, D., Gascoin, S., and Rondanelli, R. (2018). Meteorological interpretation of orographic precipitation gradients along an Andes west slope basin at 30°S (Elqui Valley, Chile). J. Hydrometeorol. 18 (3), 713–727. doi:10.1175/JHM-D-16-0073.1
Shaw, T. E., Gascoin, S., Mendoza, P. A., Pellicciotti, F., and McPhee, J. (2020a). Snow depth patterns in a high mountain Andean catchment from satellite optical tri-stereoscopic remote sensing. Water Resour. Res. 56 (2), e24880. doi:10.1029/2019WR024880
Shaw, T. E., Caro, A., Mendoza, P., Ayala, Á., Pellicciotti, F., Gascoin, S., et al. (2020b). The utility of optical satellite winter snow depths for initializing a glacio-hydrological model of a high elevation, Andean catchment, Water Resour. Res. 56 (8), 1–19. doi:10.1029/2020WR027188
Shean, D. E., Alexandrov, O., Moratto, Z. M., Smith, B. E., Joughin, I. R., Porter, C., et al. (2016). An automated, open-source pipeline for mass production of digital elevation models (DEMs) from very-high-resolution commercial stereo satellite imagery. ISPRS J. Photogramm. Remote Sens. 116, 101–117. doi:10.1016/j.isprsjprs.2016.03.012
Smith, T., and Bookhagen, B. (2018). Changes in seasonal snow water equivalent distribution in high mountain Asia (1987 to 2009). Sci. Adv. 4, e1701550–e1701558. doi:10.1126/sciadv.1701550
Sturm, M., Goldstein, M. A., and Parr, C. (2017). Water and life from snow: a trillion dollar science question. Water Resour. Res. 53, 3534–3544. doi:10.1002/2017WR020840
Vögeli, C., Lehning, M., Wever, N., and Bavay, M. (2016). Scaling precipitation input to spatially distributed hydrological models by measured snow distribution. Front. Earth Sci. 4, 1–15. doi:10.3389/feart.2016.00108
Winstral, A., Elder, K., and Davis, R. E. (2002). Spatial snow modeling of wind-redistributed snow using terrain-based parameters. J. Hydrometeorol. 3 (5), 524–538. doi:10.1175/1525-7541(2002)003
Keywords: snow depth, andes, remote sensing, snow cover, drought
Citation: Shaw TE, Deschamps-Berger C, Gascoin S and McPhee J (2020) Monitoring Spatial and Temporal Differences in Andean Snow Depth Derived From Satellite Tri-Stereo Photogrammetry. Front. Earth Sci. 8:579142. doi: 10.3389/feart.2020.579142
Received: 01 July 2020; Accepted: 19 November 2020;
Published: 10 December 2020.
Edited by:
Walter W. Immerzeel, Utrecht University, NetherlandsReviewed by:
Robert McNabb, Ulster University, United KingdomDenis Samyn, International Centre for Integrated Mountain Development, Nepal
Copyright © 2020 Shaw, Deschamps-Berger, Gascoin and McPhee. This is an open-access article distributed under the terms of the Creative Commons Attribution License (CC BY). The use, distribution or reproduction in other forums is permitted, provided the original author(s) and the copyright owner(s) are credited and that the original publication in this journal is cited, in accordance with accepted academic practice. No use, distribution or reproduction is permitted which does not comply with these terms.
*Correspondence: Thomas E. Shaw, dGhvbWFzLnNoYXdAd3NsLmNo