
95% of researchers rate our articles as excellent or good
Learn more about the work of our research integrity team to safeguard the quality of each article we publish.
Find out more
ORIGINAL RESEARCH article
Front. Earth Sci. , 15 December 2020
Sec. Geomagnetism and Paleomagnetism
Volume 8 - 2020 | https://doi.org/10.3389/feart.2020.578294
This article is part of the Research Topic Frontiers in Southeast Asian Geosciences View all 17 articles
 Nuresi Rantri Desi Wulan NdariPutu Billy Suryanata
 Satria Bijaksana*Darharta Dahrin
 Fadhli Ramadhana AtaritaAditya PratamaAbd Hafidz
 Silvia Jannatul Fajar
Anisotropy of magnetic susceptibility (AMS) analyses have been used widely in many applications that include studying lava flows. In this paper, we introduce an auxiliary parameter, i.e., preferred pore orientation, on the use of AMS for lava flow studies on the basaltic lava samples from Batur Volcano in Bali Indonesia. We also examine the effect of sample position in lava flow outcrop to the relationship between preferred pore orientation and AMS. The samples are subjected to petrographic analyses as well as to magnetic measurements and micro-computed tomography (μCT) imaging. Preferred pore orientations were obtained by quantified the long-axis of the vesicles from the images. The correlation was evaluated by measuring the angle between the maximum susceptibility axes and the preferred pore orientations. All samples show that the maximum susceptibility axes are parallel with the flow direction. Three out of six samples of two lava flows from the same eruption show a positive correlation between AMS and preferred pore orientation, where both parameters point to the northeast direction. A difference of sample position in the outcrop of lava flow was observed as a possible factor that influenced the results for the preferred pore orientations. Samples which were taken from the summit of the lava flow have pore orientation parallel to the lava flow direction. While samples which were taken from the foot slope of the lava flow have pore orientation perpendicular to the lava flow direction. This study provides further evidence that pore orientation might be positively correlated with the AMS.
The use of anisotropy of magnetic susceptibility (AMS) analyses in lava flow studies has been found to have unpredictable results (Khan, 1962; Wing-Fatt and Stacey, 1966; Halvorsen, 1974; Symons, 1975; Kolofikova, 1976; Knight and Walker, 1988; Cañón-Tapia et al., 1995; Herrero-Bervera et al., 2002; Zhu et al., 2003; Panaiotu et al., 2011; Maggart, 2016; Martin et al., 2018; Atarita et al., 2019). The main difference in the conclusions from these studies was how the lava flow directions aligned with the principal magnetic susceptibility axes. Even when a correlation is irrefutable (Cañón-Tapia and Pinkerton, 2000), these results have made it difficult to make a generalized statement with regards to the correlation between flow direction and AMS (Cañón-Tapia, 2004).
On the other hand, imaging techniques for rock investigations have developed rapidly in recent years, most notably micro-computed tomography (μCT). The number of geosciences studies that have incorporated this method has been increasing rapidly (Ketcham and Carlson, 2001; Mees et al., 2003; Cnudde et al., 2006; Kaestner et al., 2008; Mao et al., 2012; Voorn et al., 2015). Visualization of the rocks’ pore space has to be done using a method that can achieve high-resolution results, given the small dimension of rock pores, and is suited for small samples. μCT seems to be apt for the requirements. It is plausible that a thorough analysis of the shapes of the vesicles can give a good indication for the flow direction. Vesicles are formed when there is a drop in pressure during rock formation, which increases gas content inside lava (Lockwood and Hazlett, 2010). According to Waters (1960) as well as Peterson and Hawkins (1971), the inclination of pipe vesicles inside lava flow and long-axis of ellipsoidal shaped vesicles near base and upper part of lava flow can infer the directions of the flow.
Thus, there is a possibility that distribution of pore orientation can be correlated with AMS in determining the flow direction. As concluded by Atarita et al. (2019) in their introductory study, the correlation between AMS and preferred pore orientation is evident but not thoroughly established, as the research in this regard is still insufficient (see also Wing-Fatt and Stacey, 1966; Cañón-Tapia et al., 1997; Atarita et al., 2019). In this study, a more comprehensive approach is carried out by combining AMS and preferred pore orientation (using μCT) analyses on well-dated and well-oriented lava flows from Mount Batur in Bali, Indonesia. The objective is to test the viability of this combined analysis in clarifying the use of AMS in studying lava flows.
The samples were taken with permission from Batur Global Geopark in Bali. The Geopark covers the main cone of Mount Batur, the parasite cone of Mount Abang, the main caldera, Sampeanwani hill, Bukit Puraknya landslide, Mount Bunbulan lava blockage, and various eruption products (Figure 1). Mount Batur had erupted 25 times since 1800, with the last eruption occurred in 2004. The eruptions were usually Strombolian type, which produced mostly basalt and basaltic andesite lava flows (Geomagz, 2012a).
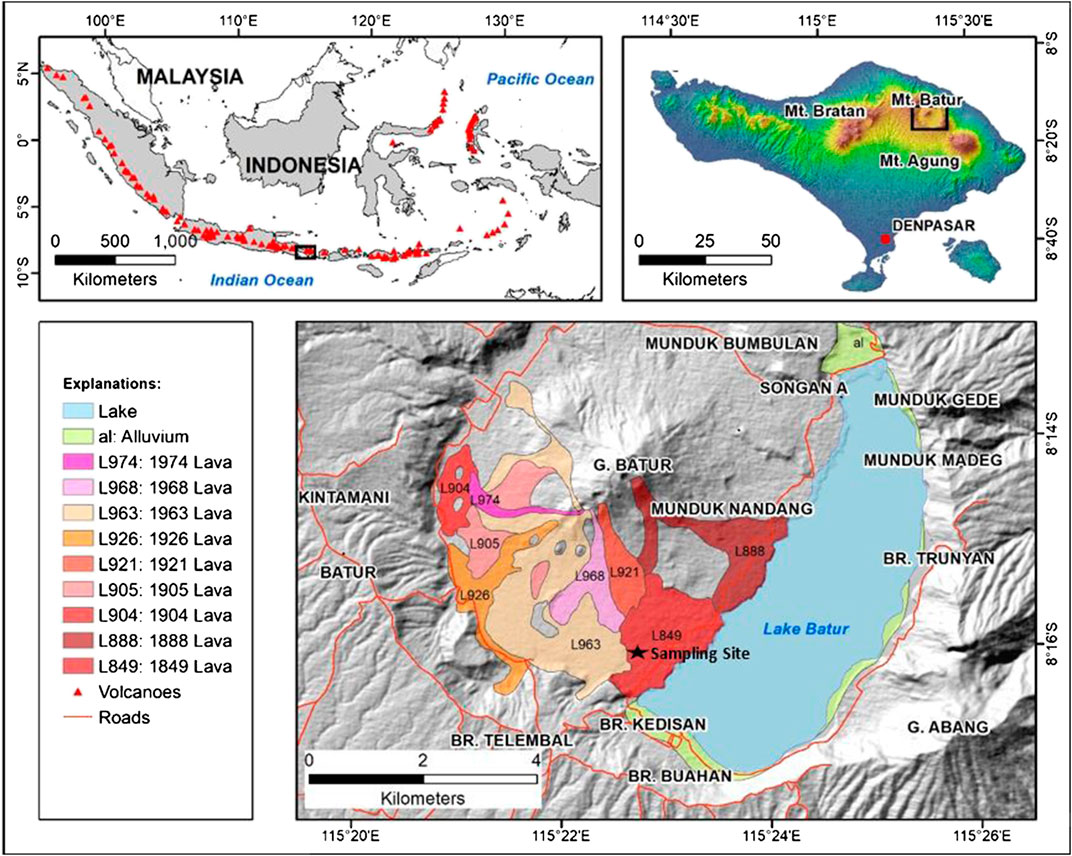
FIGURE 1. Geological map of Batur Mountain (Sutawidjaja et al., 1992). Black point indicates the sampling location.
The sampling sites were within a lava flow, which is the product of the Mount Batur 1849 eruption (Wheller, 1986; Sutawidjaja et al., 1992) (see Figure 1). The 1849 lava is relatively fresh, while the direction of the lava flow is still clear; it seems to still be in accordance with the direction of the lava flow when it was formed. In most places, lava flows from Mount Batur are categorized as blocky and ʻAʻā lava (Geomagz, 2012b). The lava flow shows rugose morphology, and each flow can be differentiated by hilly-elongated forms. Some samples contain around 5% pore space with a size range from 1 to 10 mm. The various size of vesicles defines the lava structure and presume or infer the flow direction. For the 1849 eruption event, lava spread from the crater to the south-west direction.
According to the previous study (Atarita et al., 2019), the position of the sample in the outcrop of the flow may have influenced the results for the preferred pore orientations. In this study, we took six hand-sized lava flow samples at different positions from two lava outcrops. Magnetic compass orientation and clinometer were conducted before retrieving the samples. The samples were then coded as BTR2–BTR7 in order to examine the effect of sample position in the outcrop, and its relationship to the preferred pore orientation and AMS. Samples of BTR2, BTR3, and BTR4 were taken within the same lava flow outcrop, while BTR5, BTR6, and BTR7 were taken from another flow within close proximity to the first flow. It is apparent that these are two different flows but the possibility of them being parts of a larger one cannot be ignored. BTR3, BTR6 and BTR7 were taken from the summit or the upper part of the lava flow outcrop, while BTR 2, BTR4 and BTR5 were taken from the foot slope or the bottom part of the lava flow outcrop.
For this study, all samples were prepared as cylindrical cores, six core specimens for each sample. The dimension of each core was 2.5 cm in diameter and 2.2 cm in height. All six specimens of each sample were used in magnetic susceptibility measurements while one specimens of each sample were used for μCT measurements and then later used to generate pore space images.
Petrographic analysis was carried out to identify rock types, textures, and mineral orientation due to lava flows that may be present in all rock samples. This analysis was conducted at a facility of PT FERG Geosains Indonesia, a private company offering services in petrographic analyses. Petrographic analysis is performed by making a thin section of each sample and then observing the thin section using a polarizing microscope. Then to calculate mineral orientation, it used the Crystal Size Distributions (CSD) correction plugin installed on the ImageJ program (Schneider et al., 2012). This plugin quantifies the textures (Higgins, 2000; Higgins, 2002; Higgins and Chandrasekharam, 2007), in this case is the plagioclase, with manual identification by the user picking and tabulating the values of plagioclase orientation. The preferred plagioclase orientation is analyzed from the rose diagrams.
Magnetic susceptibility is a physical parameter that represents how a certain mineral can get magnetize from an outside magnetic field. Magnetic susceptibilities of rocks can have different values if measured in different directions. In a three-axis coordinate system, there are three principal magnetic susceptibilities: maximum susceptibility (K1), intermediate susceptibility (K2), and minimum susceptibility (K3) with Km as the mean value (Km = (K1 + K2 + K3)/3). In an isotropic medium, the magnitudes of these three susceptibilities are identical. However, they are different in an anisotropic medium, where K1 > K2 > K3.
Magnetic susceptibility of the samples was measured in low-frequency (χLF), at 470 Hz (Sudarningsih et al., 2017a; Sudarningsih et al., 2017b) using Bartington Susceptibility Meter instrument at the Faculty of Mining and Petroleum Engineering, Institut Teknologi Bandung. The measurements were based on the nine directions technique by Girdler (1961a) but were modified to be carried out in six directions: north-south (A1), east-west (A2), down-up (A3), north-east (A4), north-down (A5), and east-down (A6). The measurements were conducted three times for each direction. The standard deviation is 2% or less. As control, one specimen of each sample was randomly selected and its AMS was measured in full nine directions.
Table 1 lists the AMS parameters that are discussed in this study. The shape parameter, T (Jelinek, 1981) is defined as T = (2η2–η1–η3)/(η1–η3), where η1 = ln K1, η2 = ln K2, and η3 = ln K3. Positive T value (T > 0) means that the specimen has oblate shape while negative T value (T < 0) indicates prolate shape (Tarling and Hrouda, 1993). The AMS ellipsoid represents the vectorial sum to the susceptibility ellipsoid arising from each grain (Cañón-Tapia, 2004). Parameters L and F represent lineation and foliation respectively where L = K1/K2 and F = K2/K3. The degree of anisotropy (P%) represents how anisotropic a sample is and is defined as P% = 100% × (K1–K3)/K3. Meanwhile, the corrected anisotropy degree Pj is defined as
where
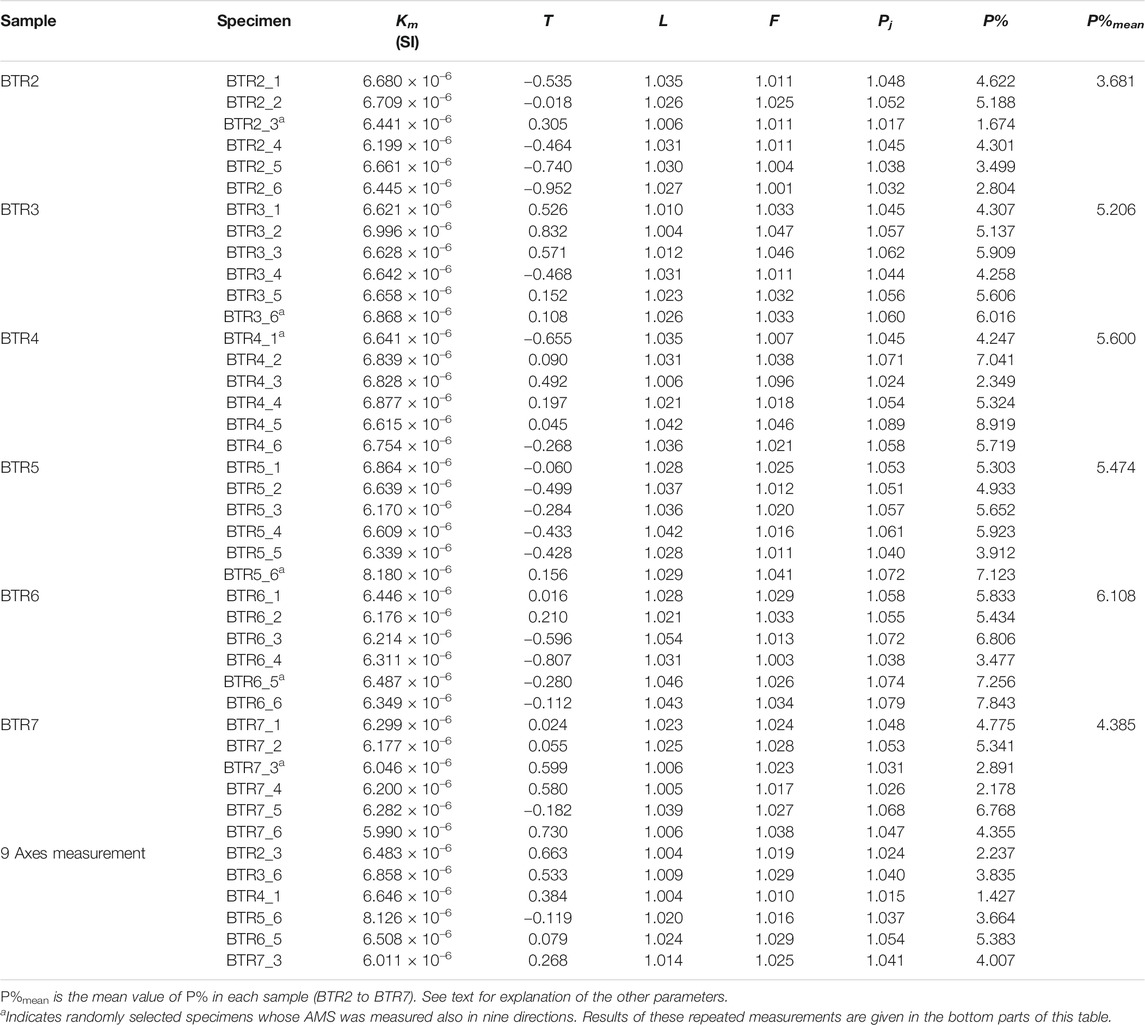
TABLE 1. Magnetic anisotropy parameters for all specimens.
Micro-computed tomography (µCT) measurements were carried out using a Bruker MicroCT Scanning Devices—SkyScan 1173 instrument at the Faculty of Mathematics and Natural Sciences, Institut Teknologi Bandung. The datasets are reconstructed to produce slices of 2D images using NRecon software (by Bruker MicroCT). In order to differentiate between the matrix and the pore space, the images were stacked into 3D model and filtered using BLOB3D software (by The High-Resolution X-ray Computed Tomography Facility at The University of Texas at Austin/UTCT) (Ketcham, 2005). After filtering, the 3D pores will appear as gray parts within the images. These filtered images were then analyzed using the CSD correction for identification of preferred horizontal and vertical pore orientation. Considering the 3D distribution of pores in each sample, two perpendicular images seen from above and seen from the side perpendicular to the assumed maximum axis were used to quantify respectively the declination as well as the inclination of the preferred pore orientation.
The results of petrographic analyses are shown in Figure 2. All samples (Figures 2A–F) are of a similar rock type, i.e., basalt. The most dominant texture is pilotaxitic in which small plagioclase laths are randomly oriented and grouped around larger phenocrysts as opposed to trachytic texture in which the small plagioclase laths are oriented in flow direction. Pilotaxitic is typical of aphanitic matrix of basalts. As show in Figure 2, the plagioclase laths in BTR3 and BTR4 are oriented in SW-NE direction which is the direction of lava flow. In contrast, the plagioclase laths in BTR6 are oriented perpendicular to the direction of lava flow while that in BTR2, BTR5 and BTR7 are oriented in E-W direction.
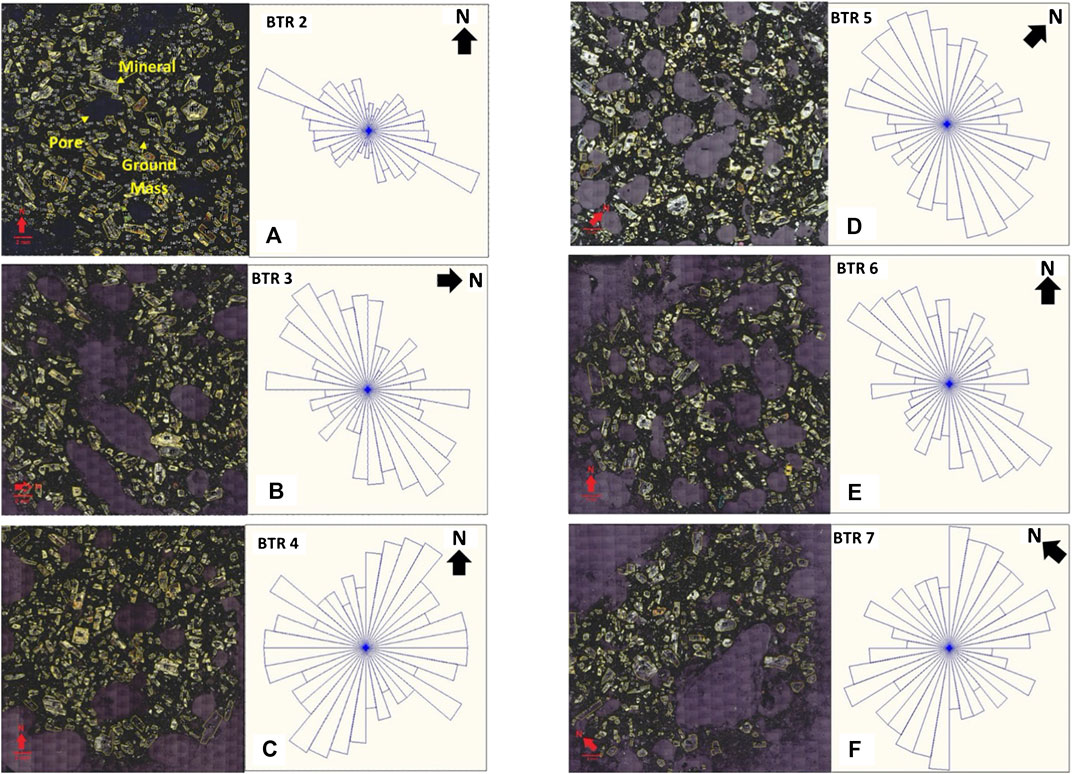
FIGURE 2. Mineral orientation based on petrographic analyses on thin sections for representative specimens of BTR2 (A), BTR3 (B), BTR4 (C), BTR5 (D), BTR6 (E), and BTR7 (F). Notes in BTR2 (A) show typical pore, groundmass and mineral (i.e., plagioclase). Red arrows indicate north direction.
As shown in Table 1, the Km, Pj and P% values of all specimens are rather similar inferring that the samples are of the same rock type and confirming the results of petrographic analyses. The mean values of P% (shown as P%mean in Table 1) are in the range of 3.681–6.108%. This degree of anisotropy is similar to what others have found for samples from lava flows (Girdler, 1961a; Girdler, 1961b; Khan, 1962; Zananiri and Kondopoulou, 2004; Atarita et al., 2019). Table 1, however, shows some variations in the ellipsoidal parameters, i.e., T, L, and F, which could be derived from varying cooling experience. Based on the shape parameters, BTR3, BTR4, and BTR7 are mostly oblate, while the other sites are mostly prolate (see also Figure 3). There is no consistent relationship that can be concluded between the shape parameters and the sampling position of all samples. Borradaile and Henry (1997) warned that the shape of the AMS ellipsoid could not be calibrated or referred to a particular physical process as it combines contributions from minerals whose individual AMS ellipsoids are of different shape. As shown in Table 1, AMS measurements in nine and six directions show similar values of Km but they show discrepancies in P% values that vary from 0.563% for BTR2_3 to 3.459% for BTR5_6. Meanwhile the discrepancies in the direction of K1 is, on average, 36°.
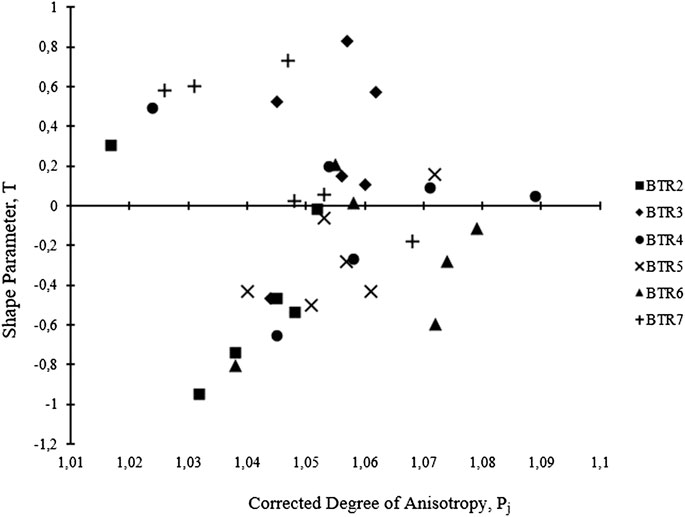
FIGURE 3. A plot of shape parameter (T) and the corrected degree of anisotropy (Pj). Positive values indicate an oblate shape, whereas negative values indicate a prolate shape.
The declination and inclinations of each susceptibility axes (K1, K2, and K3) for all specimens of all samples are projected onto the lower hemisphere of equal area stereoplots (Figure 4). Mean vectors and 95% area of confidence are calculated using Jelinek statistic (Jelínek and Kropáček, 1978). Figure 4 shows that AMS data are mostly clustered and consistent, as can be seen with small circles of confidence. The maximum and minimum axes generally have medium inclinations while intermediate axes have shallow inclinations. The directions of the mean vector of all principle susceptibility axes of all samples are consistent (Table 2). The direction of the maximum axes of all samples are parallel to the lava flow directions from the eruption sources as reported by Wheller (1986).
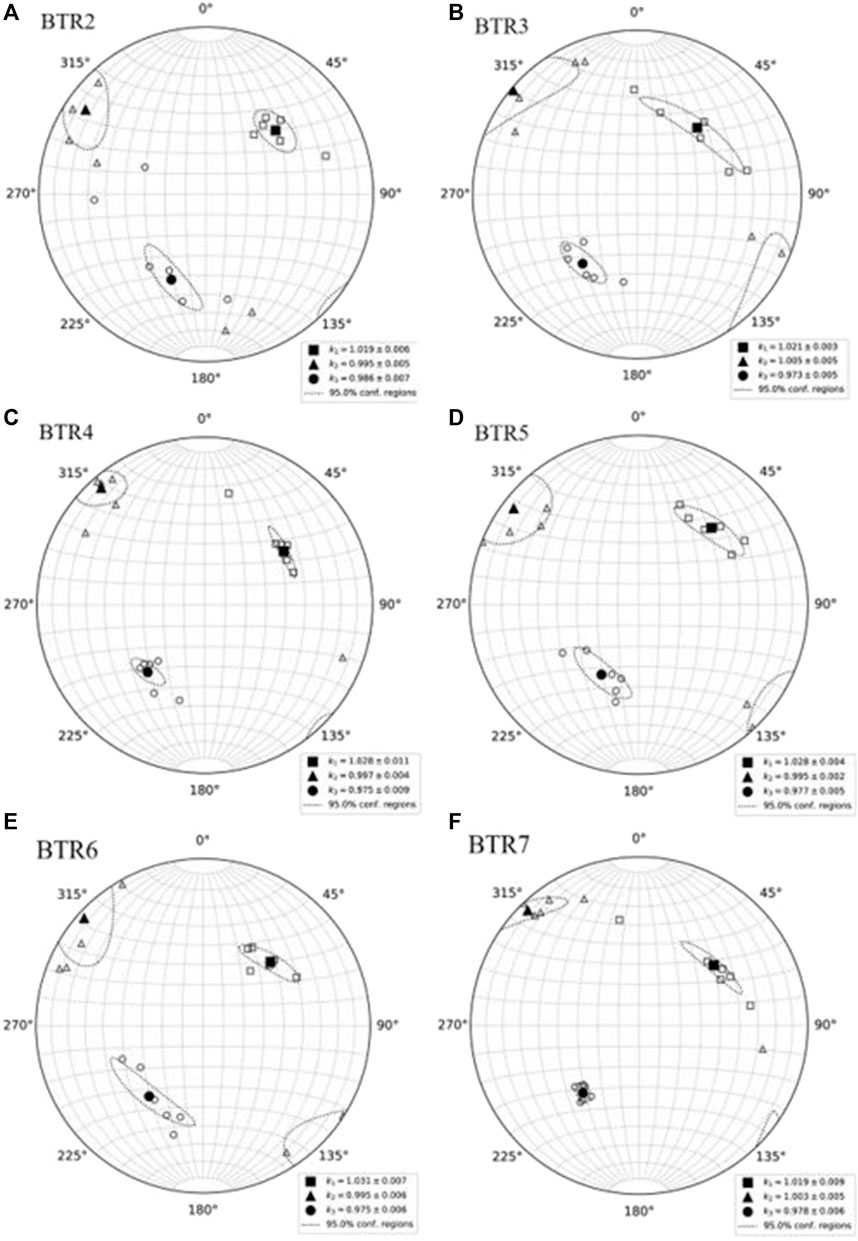
FIGURE 4. The declination and inclinations of each susceptibility axes for all specimens are projected onto the lower hemisphere of equal area stereoplots of (A) BTR2; (B) BTR3; (C) BTR4; (D) BTR5 and (E) BTR6; and (F) BTR7. Large filled symbols represent the mean vector of each corresponding axis. Circles show the 95% area of confidence. K1 = maximum susceptibility, K2 = intermediate susceptibility, and K3 = minimum susceptibility.
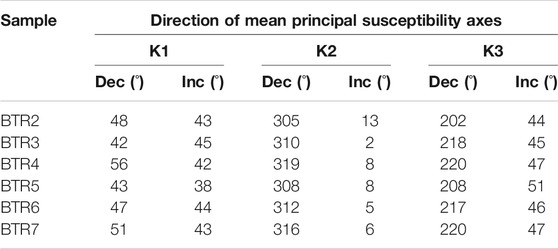
TABLE 2. Directions of mean principal susceptibility axes of the samples (BTR2 to BTR7).
The pore space images obtained using µCT method are shown in Figure 5. Based on the shapes of the vesicles, the samples are divided into two types: a) spherical shaped vesicles, and b) ellipsoidal shaped vesicles. BTR2, BTR3, and BTR4 are the former type while BTR5, BTR6, and BTR7 are the latter ones. This confirms the initial assumption that the samples are from two different flows. This could happen because of the different local flow mechanisms as well as flow viscosities, where the first flow (type a) had significantly slower velocity, prompted the vesicles to obtain their original shapes while type b caused deformations to the vesicle shapes.
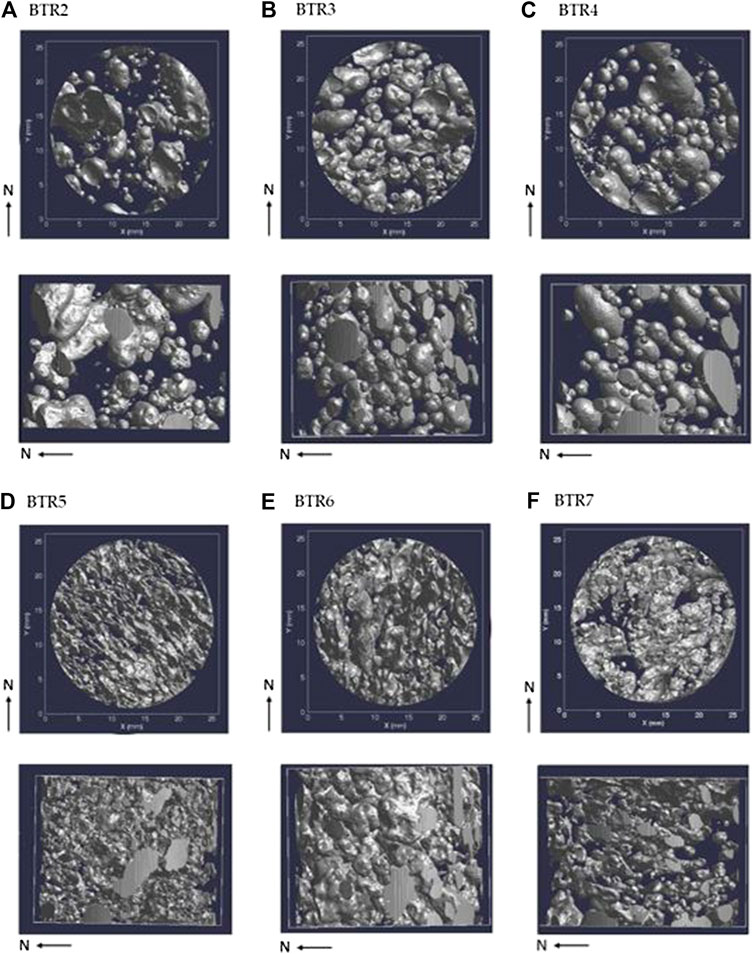
FIGURE 5. Pore distribution images of (A) BTR2; (B) BTR3; (C) BTR4; (D) BTR5 and (E) BTR6; and (F) BTR7 seen from the top (circles) and the side (rectangles) of the core specimens. Gray area represents the pores. Round images are the vertical view of each sample while rectangular images represent the side view. N indicates north directions. Vertical streaks are from where the pores intersect the scan field.
In order to find more rigorous results, quantitative analysis was done to quantify the flow direction from the pore images. The results of CSD analysis of the pore images were then transformed into rose diagrams to find the distribution and the preferred pore orientation (declination and inclination) (Figures 6, 7). This method resulted in each sample having a set of declinations. In order to determine the actual declinations of each sample, we observed the declination where the corresponding inclination is tilted upwards.
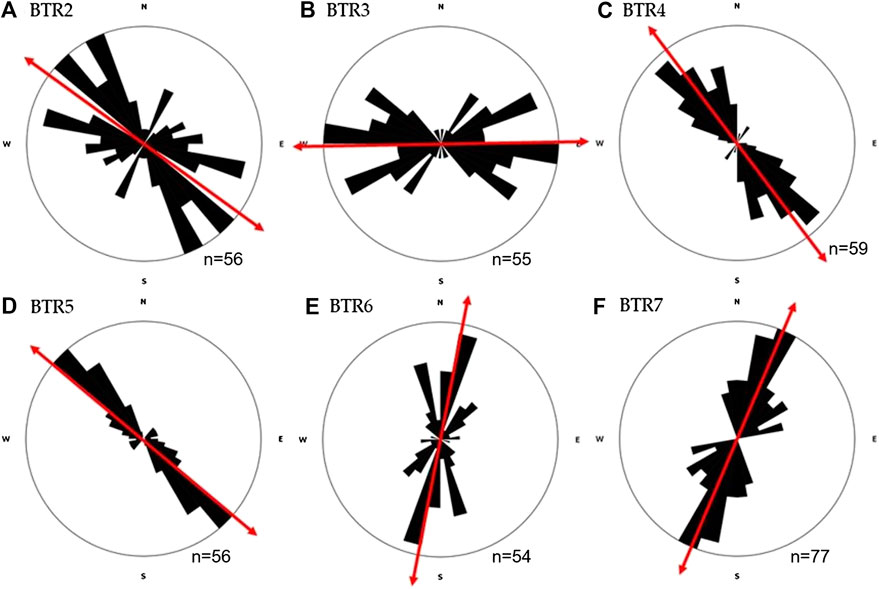
FIGURE 6. Rose diagrams of horizontal slices of (A) BTR2; (B) BTR3; (C) BTR4; (D) BTR5; (E) BTR6; and (F) BTR7 specimens that were used in μCT imaging. These diagrams show the distribution of the declination of pores orientation. Vertical axis represents North-South direction while horizontal axis represents East-West direction. Red arrows indicate the declination of the preferred pore orientations.
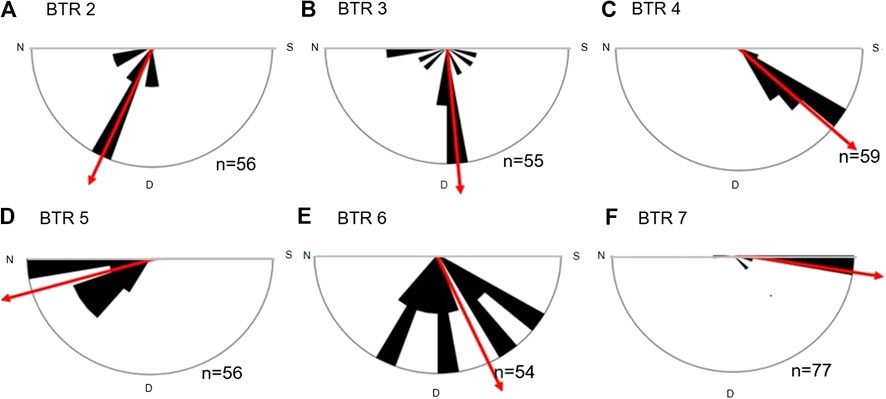
FIGURE 7. Rose diagrams of vertical slices of (A) BTR2; (B) BTR3; (C) BTR4; (D) BTR5; (E) BTR6; and (F) BTR7 specimens that were used in μCT imaging. These diagrams show the distribution of the inclination pores orientation. Vertical axis represents Up-Down direction while horizontal axis represents North-South direction. Red arrows indicate the inclination of the preferred pore orientations.
The correlation between AMS and preferred pore orientation was evaluated by calculating the angle between all susceptibility axes with the preferred pore orientation. The values were evaluated using Stereonet program developed by Richard Allmendinger (see Allmendinger et al., 2012; Cardozo and Allmendinger, 2013). Based on the results (see Table 3), BTR2, BTR4, and BTR5 have preferred pore orientations that are perpendicular to the flow direction (correlated with K2). On the other hand, the rest of the samples have preferred pore orientation aligned with the flow direction (correlated with K1).
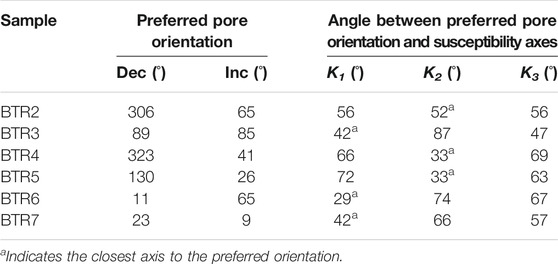
TABLE 3. Preferred pore orientation and the angle between preferred pore orientation and either K1, K2, or K3.
Comparison between Figures 2, 6, show that horizontally the preferred pore orientation in BTR2, BTR5, and BTR7 is in the same direction as the mineral orientation, while that in BTR4 is perpendicular to the mineral orientation. The horizontal preferred pore orientation in BTR3 and BTR6 are respectively about 45 and 60° respectively from the mineral orientation. More comprehensive comparison between preferred pore orientation and mineral orientation would require imaging vertical mineral orientation that unfortunately is not available at this time.
AMS results with respect to the flow direction is often inconsistent. The most common conclusion is that lava flow direction is parallel with the maximum susceptibility axes (K1), as reported in (Knight and Walker, 1988; Herrero-Bervera et al., 2002; Zhu et al., 2003; Panaiotu et al., 2011). MacDonald et al. (1992) added that this is only the case if the lava had a laminar flow while Cañón-Tapia et al. (1995) concluded that this happens if we take account for the local lava flow direction. This latter hypothesis has been further supported by the results of Kolofikova (1976) that found characteristic differences between the end and the toe of the lava flow. While Khan (1962) found that only the intermediate axes are parallel with lava flow direction, several other studies (Wing-Fatt and Stacey, 1966; Halvorsen, 1974; Symons, 1975; Kolofikova, 1976) concluded that AMS was not always reliable for such cases.
AMS data of all samples are well-defined, with the high level of confidence shows the reliability of the results. Wheller (1986) reported that the 1849 lava from Mount Batur has north-east flow direction. This confirms the results of the AMS data (Figure 4), in which the maximum susceptibility axes of all samples point to the relative north-east direction. Although Bascou et al. (2005) suggested that the lower part of the lava provides the best indicator for the flow direction of the lava flow direction, there seems no disturbance in AMS data correlating to the sampling sites, which were taken from the upper part of the lava, as Atarita et al. (2019) encountered. Also, no influence from magnetic ellipsoid shape to the results has been observed, as observed also by Atarita et al. (2019). No geological deformities have been observed on the field and no indication that of the lava flows have been altered by any means of geological activities.
Based on the images from μCT method (Figure 5), the relatively larger sized from 1 to 10 mm, denser vesicles were observed in all samples as suggested by Aubele et al. (1988), Caballero-Miranda et al. (2016) as well as by Sahagian et al. (2002). Samples from flow 1 (BTR2, BTR3, and BTR4) have spherical shaped vesicles, resulting in more evenly distributed pore orientations, as can be seen in Figures 6, 7. It can be assumed that this is the effect of the slow movement of the lava, which will form spherical shaped vesicles. Another reason this happened is that the topography around the lava does not have a rather dramatic slope, which could cause the lava to flow with slower speed.
Quantitative result shows that for all three samples, not one preferred pore orientation that points toward the north-east direction (Table 3). We investigated the correlation between AMS and preferred pore orientation by measuring the angle between the pore orientation with each susceptibility axis. The smaller the angle in K1 and K2 (Asterisk) means that they may have a positive correlation (Table 3). While the declination is rather to east-west direction, then Table 3 suggests that the preferred pore orientation of BTR3 lies closest to the maximum susceptibility axis. On the contrary, BTR2 and BTR4 have their preferred pore orientation lie closest to the intermediate axes (Figure 8).
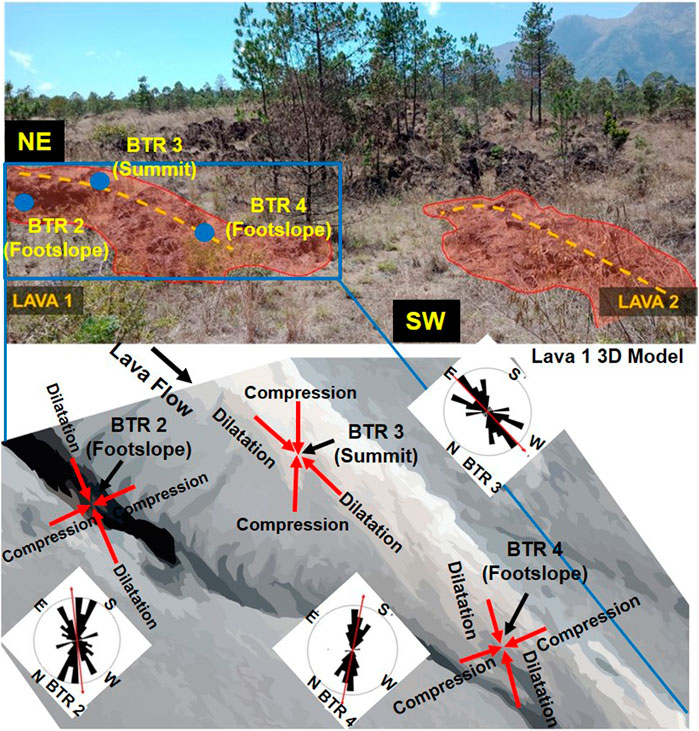
FIGURE 8. Sample location and 3D model lava in Batur Volcano area with pore orientation rose diagram for BTR2, BTR3, and BTR4 sample. Reddish area is lava flow which the samples were obtained. Yellow dashed lines indicate the summit of lava flows. Red arrows indicate the compression and dilatation axes at the sampling sites.
On the other hand, two out of the tree samples from flow two have north-east bound declinations. Ellipsoidal shaped vesicles made the quantitative analysis became more reliable than that of flow 1. Both BTR6 and BTR7 have preferred pore orientation to the north-east direction, closest to the maximum susceptibility axes, as confirmed in Table 3. Another anomaly occurs with BTR5, while having ellipsoidal shaped vesicles, the preferred pore orientation of BTR5 aligns closest to the intermediate axis. The difference of sample position in the outcrop of lava flow was observed as a possible factor that influenced the results for the preferred pore orientations. Samples which were taken from the summit of the lava flow have pores orientation parallel with lava flow direction. Because the orientation of the ellipsoid pore in the lava controlled by compression and dilatation stress cause by lava movement (Bernabeu et al., 2016). In the mechanical stress orientation, the ellipsoid pore orientation parallel with the dilatation axis. The top part of the lava low has a dilatation axis oriented to the lava flow direction at the hill slope, that is pulled down by the gravitation force. While samples which were taken from the foot slope of the lava flow, will have pore orientation perpendicular to lava flow direction. At the foot slope, the lava flow has a compression orientation in the lava flow direction due to the bottom flow friction and the movement becomes slowdown, and the dilatation axis should be perpendicular to flow direction.
Three out of six samples (BTR3, BTR6, and BTR7) show a positive correlation between AMS and preferred pore orientation. The preferred pore orientations for all three samples point to the northeast direction, nearly parallel with the maximum susceptibility axes (K1). The remaining sites have the same direction of their AMS with respect to other sites, although their preferred pore orientation aligns with the intermediate axes (K2). The most feasible explanation of why the results differ might be because of the different sample position in the outcrop of lava flow. Samples which taken from the summit of the lava flow have pores orientation parallel with lava flow direction. While samples which taken from the foot slope of the lava flow, will have pores orientation perpendicular with lava flow direction. Because the ellipsoid pores shape should be oriented to the dilatation axis direction. No geological deformities have been observed in the field and there is no indication that of the lava flows have been altered by any other of geological activities. This study show that the method shows some promise and should be further investigates in different types of lava flows. This could potentially be a solution in future studies about lava flow direction.
The raw data supporting the conclusions of this article will be made available by the authors, without undue reservation.
NN, PS, and SB, conceived and designed the experiments. NN and PS collected the samples in the field. NN performed magnetic and micro-CT measurements. NN, FA, PS, AP, AH, SB, SF, and DD analyzed the data. NN, FA, SB, and PS wrote the manuscript.
This research was financially funded by the Ministry of Research and Technology of the Republic of Indonesia through PD (Penelitian Dasar or Fundamental Research) grant to SB. Additional funding was also received from Institut Teknologi Bandung, Indonesia. AP is the recipient of the post-doctoral fellowship administered by the WCU (World-Class University) Program at Institut Teknologi Bandung.
The authors declare that the research was conducted in the absence of any commercial or financial relationships that could be construed as a potential conflict of interest.
The permission to conduct field research at Mount Batur was given by the BKSDA (Balai Konservasi Sumber Daya Alam or Natural Resource Conservation Center) of Bali, Indonesia. The authors greatly appreciate the work of Exneyder A. Montoya-Araque and Ludger O. Suarez-Burgoa in providing the Python script for Jelinek statistic. The authors thank two anonymous reviewers for their constructive comments which significantly improved the original version of this paper.
Allmendinger, R. W., Cardozo, N., and Fisher, D. (2012). Structural geology algorithms: vectors tensors. 1st edn. Cambridge, UK: Cambridge University Press.
Atarita, F. R., Bijaksana, S., Ndari, N. R. D. W., Pratama, A., Taqwantara, R. F., Fajar, S. J., et al. (2019). Anisotropy of magnetic susceptibility and preferred pore orientation in lava flow from the Ijen Volcanic Complex, East Java, Indonesia. Geosciences 9, 304. doi:10.3390/geosciences9070304
Aubele, J. C., Crumpler, L. S., and Elston, W. E. (1988). Vesicle zonation and vertical structure of basalt flows. J. Volcanol. Geotherm. Res. 35, 349–374. doi:10.1016/0377-0273(88)90028-5
Bascou, J., Camps, P., and Dautria, J. M. (2005). Magnetic versus crystallographic fabrics in a basaltic lava flow. J. Volcanol. Geotherm. Res. 145, 119–135. doi:10.1016/j.jvolgeores.2005.01.007
Bernabeu, N., Saramito, P., and Smutek, C. (2016). Modelling lava flow advance using a shallow - depth approximation for three - dimensional cooling of viscopalstic flows. Geol. Soc. London, Spec. Publ. 426 (1), 409–423. doi:10.1144/SP426.27
Borradaile, G. J., and Henry, B. (1997). Tectonic applications of magnetic susceptibility and its anisotropy. Earth Sci. Rev. 42, 49–93. doi:10.1016/S0012-8252(96)00044-X
Caballero-Miranda, C. I., Alva-Valdivia, L. M., González-Rangel, J. A., Gogitchaishvili, A., Urrutia-Fucugauchi, J., and Kontny, A. (2016). Vertical AMS variation within basalt flow profiles from the Xitle volcano (Mexico) as indicator of heterogeneous strain in lava flows. J. Volcanol. Geotherm. Res. 311, 9–28. doi:10.1016/j.jvolgeores.2016.01.003
Cañón-Tapia, E. (2004). Anisotropy of magnetic susceptibility of lava flows and dykes: a historical account. Geol. Soc. London, Spec. Publ. 238, 205–225. doi:10.1144/GSL.SP.2004.238.01.14
Cañón-Tapia, E., and Pinkerton, H. (2000). The anisotropy of magnetic susceptibility of lava flows: an experimental approach. J. Volcanol. Geotherm. Res. 98, 219–233. doi:10.1016/S0377-0273(99)00155-9
Cañón-Tapia, E., Walker, G. P. L., and Herrero-Bervera, E. (1995). Magnetic fabric and flow direction in basaltic Pahoehoe lava of Xitle volcano, Mexico. J. Volcanol. Geotherm. Res. 65, 249–263. doi:10.1016/0377-0273(94)00110-3
Cañón-Tapia, E., Walker, G. P. L., and Herrero-Bervera, E. (1997). The internal structure of lava flows—insights from AMS measurements II: Hawaiian pahoehoe, toothpaste lava and ’a’ā. J. Volcanol. Geotherm. Res. 76, 19–46. doi:10.1016/S0377-0273(96)00073-X
Cardozo, N., and Allmendinger, R. W. (2013). Spherical projections with OSXStereonet. Comput. Geosci. 51, 193–205. doi:10.1016/j.cageo.2012.07.021
Cnudde, V., Masschaele, B., Dierick, M., Vlassenbroeck, J., Van Hoorebeke, L., and Jacobs, P. (2006). Recent progress in X-ray CT as a geosciences tool. Appl. Geochem. 21, 826–832. doi:10.1016/j.apgeochem.2006.02.010
Geomagz, G. (2012a). Aktivitas Gunung Batur. [WWW Document]. Available at http://geomagz.geologi.esdm.go.id/aktivitas-gunung-batur/ (Accessed 29 July, 2019).
Geomagz, G. (2012b). Lava Gunung Batur. [WWW Document]. URL Available at: http://geomagz.geologi.esdm.go.id/lava-gunung-batur/ (Accessed 29 July, 2019).
Girdler, R. W. (1961a). Some preliminary measurements of anisotropy of magnetic susceptibility of rocks. Geophys. J. Int. 5, 197–206. doi:10.1111/j.1365-246X.1961.tb00427.x
Girdler, R. W. (1961b). The measurement and computation of anisotropy of magnetic susceptibility of rocks. Geophys. J. Int. 5, 34–44. doi:10.1111/j.1365-246X.1961.tb02927.x
Halvorsen, E. (1974). The magnetic fabric of some dolerite intrusions, northeast spitsbergen; implications for their mode of emplacement. Earth Planet Sci. Lett. 21, 127–133. doi:10.1016/0012-821X(74)90045-4
Herrero-Bervera, E., Cañon-Tapia, E., Walker, G. P., and Tanaka, H. (2002). Magnetic fabrics study and inferred flow directions of lavas of the Old Pali Road, O′ahu, Hawaii. J. Volcanol. Geotherm. Res. 118, 161–171. doi:10.1016/S0377-0273(02)00255-X
Higgins, M. D., and Chandrasekharam, D. (2007). Nature of sub-volcanic magma chambers, deccan province, India: evidence from quantitative textural analysis of plagioclase megacrysts in the Giant Plagioclase Basalts. J. Petrol. 48, 885–900. doi:10.1093/petrology/egm005
Higgins, M. D. (2000). Measurement of crystal size distributions. Am. Mineral. 85, 1105–1116. doi:10.2138/am-2000-8-901
Higgins, M. D. (2002). Closure in crystal size distributions (CSD), verification of CSD calculations, and the significance of CSD fans. Am. Mineral. 87, 1242–1243. doi:10.2138/am-2002-0118
Jelinek, V. (1981). Characterization of the magnetic fabric of rocks. Tectonophysics 79, T63–T67. doi:10.1016/0040-1951(81)90110-4
Jelínek, V., and Kropáček, V. (1978). Statistical processing of anisotropy of magnetic susceptibility measured on groups of specimens. Stud. Geophys. Geod. 22, 50–62. doi:10.1007/BF01613632
Kaestner, A., Lehmann, E., and Stampanoni, M. (2008). Imaging and image processing in porous media research. Adv. Water Resour. 31, 1174–1187. doi:10.1016/j.advwatres.2008.01.022
Ketcham, R. A., and Carlson, W. D. (2001). Acquisition, optimization and interpretation of X-ray computed tomographic imagery: applications to the geosciences. Comput. Geosci. 27, 381–400. doi:10.1016/S0098-3004(00)00116-3
Ketcham, R. A. (2005). Computational methods for quantitative analysis of three-dimensional features in geological specimens. Geosphere 1, 32–41. doi:10.1130/GES00001.1
Khan, M. A. (1962). The anisotropy of magnetic susceptibility of some igneous and metamorphic rocks. J. Geophys. Res. 67, 2873–2885. doi:10.1029/jz067i007p02873
Knight, M. D., and Walker, G. P. L. (1988). Magma flow directions in dikes of the koolau complex, oahu, determined from magnetic fabric studies. J. Geophys. Res. 93, 4301–4319. doi:10.1029/JB093iB05p04301
Kolofikova, O. (1976). Geological interpretation of measurements of magnetic properties of basalts on example of the chribsky las lava flow of the velky roudny volcano (nizky jesenik). Cas. Miner. Geol 21, 287–348. (in Czech)
Lockwood, J. P., and Hazlett, R. W. (2010). Volcanoes: global prospective. 1st edn. West Sussex, UK: Willey-Blackwell.
MacDonald, W. D., Palmer, H. C., and Hayatsu, A. (1992). Egan Range Volcanic Complex, Nevada: geochronology, paleomagnetism and magnetic fabrics. Phys. Earth Planet. Inter. 74, 109–126. doi:10.1016/0031-9201(92)90003-E
Maggart, T. T. (2016). Using anisotropy of magnetic susceptibility to determine the shearing history of channelized pahoehoe lava flow. Available at https://keckgeology.org/wp-content/uploads/Maggart.pdf (Accessed 1 June, 2020).
Mao, L., Shi, P., Tu, H., An, L., Ju, Y., and Hao, N. (2012). Porosity analysis based on CT images of coal under uniaxial loading. Adv. Comput. Tomogr. 01, 5–10. doi:10.4236/act.2012.12002
Martin, S. A., Kavanagh, J. L., Biggin, A. J., and Utley, J. E. P. (2018). The origin and evolution of magnetic fabrics in mafic sills. Front. Earth Sci. 7, 64. doi:10.3389/feart.2019.00064
Mees, F., Swennen, R., Van Geet, M., and Jacobs, P. (2003). Applications of computed tomography in the geosciences. Geol. Soc. London, Spec. Publ. 215, 1–6. doi:10.1144/GSL.SP.2003.215.01.01
Panaiotu, C., Necula, C., Merezeanu, T., Panaiotu, A., and Corban, C. (2011). Anisotropy of magnetic susceptibility of quaternary lava flows from the east carpathians. Rom. Rep. Phys. 63, 526–534
Peterson, G. L., and Hawkins, J. W. (1971). Inclined pipe vesicles as indicators of flow direction in basalts: a critical appraisal. Bull. Volcanol. 35, 369–382. doi:10.1007/BF02596962
Sahagian, D. L., Proussevitch, A. A., and Carlson, W. D. (2002). Analysis of vesicular basalts and lava emplacement processes for application as a paleobarometer/paleoaltimeter. J. Geol. 110, 671–685. doi:10.1086/342627
Schneider, C. A., Rasband, W. S., and Eliceiri, K. W. (2012). NIH Image to ImageJ: 25 years of image analysis. Nat. Methods 9, 671–675. doi:10.1038/nmeth.2089
Sudarningsih, S., Bijaksana, S., Ramdani, R., Hafidz, A., Pratama, A., Widodo, W., et al. (2017a). Variations in the concentration of magnetic minerals and heavy metals in suspended sediments from citarum river and its tributaries, west java, Indonesia. Geosciences 7, 66. doi:10.3390/geosciences7030066
Sudarningsih, S., Maulana, L., Bijaksana, S., Hafidz, A., Pratama, A., Widodo, W., et al. (2017b). Magnetic characterization of sand and boulder samples from citarum river and their origin. J. Math. Fundam. Sci. 49, 116. doi:10.5614/j.math.fund.sci.2017.49.2.2
Sutawidjaja, I. S., Chaniago, R., Kamal, S., and Modjo, W. S. (1992). Geological map of Batur caldera, Bali, Indonesia. Volcanological Survey of Indonesia, Bandung.
Symons, D. T. A. (1975). Age and flow direction from magnetic measurements on the historic Aiyansh flow. British Columbia. J. Geophys. Res. 80, 2622–2626. doi:10.1029/jb080i017p02622
Tarling, H. H., and Hrouda, F. (1993). The magnetic anisotropy of rocks. 1st edn. London, UK: Chapman & Hall. doi:10.1016/0040-1951(94)90154-6
Voorn, M., Exner, U., Barnhoorn, A., Baud, P., and Reuschlé, T. (2015). Porosity, permeability and 3D fracture network characterisation of dolomite reservoir rock samples. J. Pet. Sci. Eng. 127, 270–285. doi:10.1016/j.petrol.2014.12.019
Waters, A. C. (1960). Determining direction of flow in basalts. Am. J. Sci. 258-A, 350–366. doi:10.1007/978-3-662-01020-4_1
Wheller, G. E. (1986). Petrogenesis of Batur caldera, Bali, and the geochemistry of Sunda-Banda arc basalts, PhD dissertation. Australia: University of Tasmania.
Wing-Fatt, L., and Stacey, F. D. (1966). Magnetic anisotropy of laboratory materials in which magma flow is simulated. Pure Appl. Geophys. 64, 78–80. doi:10.1007/BF00875533
Zananiri, I., and Kondopoulou, D. (2004). Anisotropy of magnetic susceptibility (AMS) in volcanic formations: theory and preliminary results from recent volcanics of broader Aegean. Bull. Geol. Soc. Greece 36, 1308. doi:10.12681/bgsg.16474
Keywords: preferred pore orientation, micro-computed tomography, Batur volcano, Bali, Indonesia, anisotropy of magnetic susceptibility
Citation: Desi Wulan Ndari NR, Suryanata PB, Bijaksana S, Dahrin D, Atarita FR, Pratama A, Hafidz A and Fajar SJ (2020) Preferred Pore Orientation as a Complement to Anisotropy of Magnetic Susceptibility: A Case Study of Lava Flows From Batur Volcano, Bali, Indonesia. Front. Earth Sci. 8:578294. doi: 10.3389/feart.2020.578294
Received: 30 June 2020; Accepted: 19 November 2020;
Published: 15 December 2020.
Edited by:
Edgardo Cañón-Tapia, Center for Scientific Research and Higher Education in Ensenada (CICESE), MexicoCopyright © 2020 Desi Wulan Ndari, Suryanata, Bijaksana, Dahrin, Atarita, Pratama, Hafidz and Fajar. This is an open-access article distributed under the terms of the Creative Commons Attribution License (CC BY). The use, distribution or reproduction in other forums is permitted, provided the original author(s) and the copyright owner(s) are credited and that the original publication in this journal is cited, in accordance with accepted academic practice. No use, distribution or reproduction is permitted which does not comply with these terms.
*Correspondence: Satria Bijaksana, c2F0cmlhQGZpLml0Yi5hYy5pZA==
Disclaimer: All claims expressed in this article are solely those of the authors and do not necessarily represent those of their affiliated organizations, or those of the publisher, the editors and the reviewers. Any product that may be evaluated in this article or claim that may be made by its manufacturer is not guaranteed or endorsed by the publisher.
Research integrity at Frontiers
Learn more about the work of our research integrity team to safeguard the quality of each article we publish.