 Sukonmeth Jitmahantakul
 Jirapat Phetheet
 Pitsanupong Kanjanapayont1
95% of researchers rate our articles as excellent or good
Learn more about the work of our research integrity team to safeguard the quality of each article we publish.
Find out more
ORIGINAL RESEARCH article
Front. Earth Sci. , 07 December 2020
Sec. Structural Geology and Tectonics
Volume 8 - 2020 | https://doi.org/10.3389/feart.2020.578218
This article is part of the Research Topic Frontiers in Southeast Asian Geosciences View all 17 articles
The Wichianburi Sub-basin is currently the only productive area in the southern part of the Phetchabun Basin, central Thailand. It is structurally dominated by NNW-SSE to NNE-SSW trending normal faults as a result of multistage rifting since the Late Oligocene. Half-graben and full-graben basin geometries can be observed from 2D regional seismic sections. In this study, structural restoration techniques were applied to validate the structural interpretation of the original hardcopy of the 2D seismic sections. Stratigraphic information is compiled from published papers and well reports. Our results revealed that most of the deformation was concentrated during the Late Oligocene. Main depocenters for the syn-rift sediments focused in the basin center along the west-dipping normal faults. These faults cut the prerift section and their orientations were possibly controlled by the Permo-Triassic fabrics that underlie the Phetchabun Basin. By measuring the length of the profiles before and after faulting, the restorations show that the extensions of the Wichianburi Subbasin decrease from 12.30% during the main rift phase (Late Oligocene to Early Miocene) to 2.53% during the second phase of rifting. Rifting only focused in the basin center with the development of NNW-SSE to N-S trending intrarift faults. Since the Middle Miocene, the Wichianburi Subbasin has developed under the tectonic phase of post-rift subsidence with interruption by intrusive activities.
The Phetchabun Basin is a major onshore Cenozoic basin that lies in central Thailand with approximately 120 km long and around 30 km wide (Figure 1). The basin occurs along a closed Permo-Triassic intracratonic rift within the Indochina continental block. According to regional 2D seismic interpretation, five narrow subbasins with half- and full-graben geometries form the Phetchabun Basin (Remus et al., 1993).
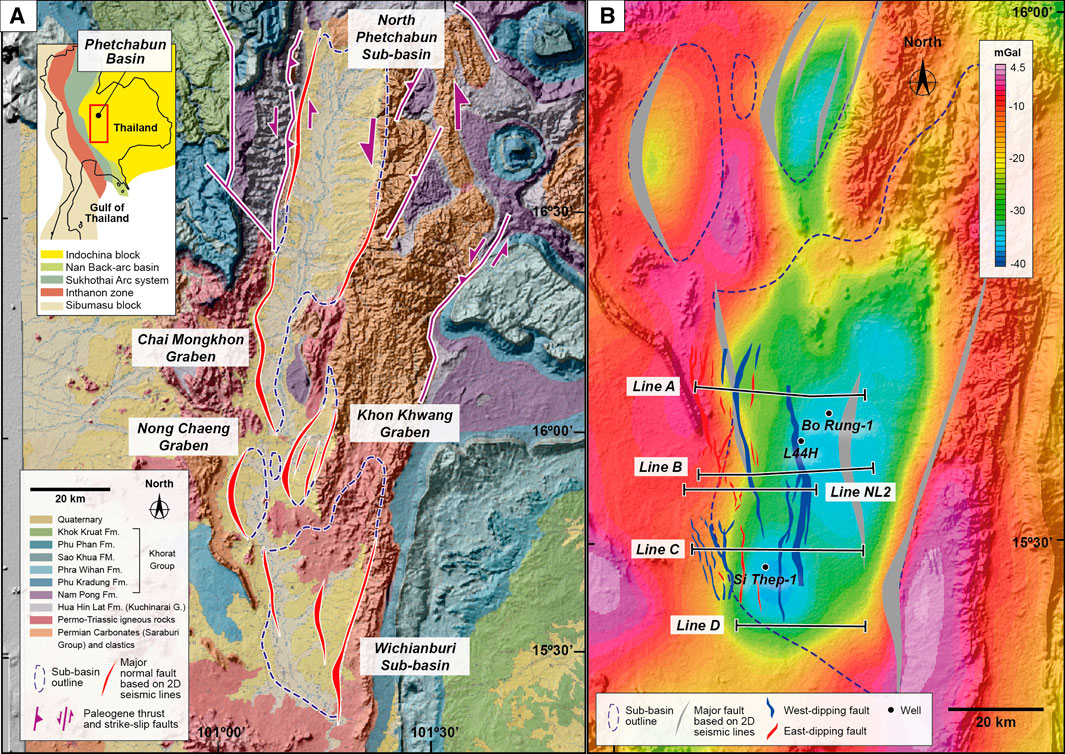
FIGURE 1. (A) Geologic map showing the location of the Phetchabun Basin and the outline of its grabens and sub-basins. Major normal faults of the Phetchabun Basin interpreted by Remus et al. (1993) based on regional 2D seismic data are shown. These faults lie within the N-S trending Paleogene transpressional belt that caused uplift and erosion of the pre-Cenozoic rocks along the western margin of Indochina block (see inset). Thrust and strike-slip faults are from Morley (2012). (B) Gravity anomaly map of the Wichianburi Sub-basin illustrating the basin geometry. Basement fault map from 3D seismic interpretation by Pongwapee et al. (2019a) is overlaid with the locations of the Bo Rang-1, L44H, and Si Thep-1 wells. 2D seismic sections (Line A–Line D) are interpreted in this study.
The Wichianburi Sub-basin is in the southern part of the Phetchabun Basin. It is the only hydrocarbon-bearing sub-basin that produces oil from both fractured volcanic rocks and sandstone reservoirs within tilted fault blocks (Barr and Cooper, 2013). This sub-basin is structurally dominated by the N-S to NNE-SSW trending normal faults as a result of multistage rifting since the Late Oligocene (Pongwapee et al., 2019a).
There is currently no information regarding the amount of crustal extension during rift development in the Wichianburi Subbasin. Kinematic restoration of the rift structures helps to quantify extension and extension rates accommodated in the sub-basin. This study applies structural restoration techniques to validate the structural interpretation of the original hardcopy of the 2D seismic sections (Figure 2), which are available to access and to calculate the extension of each rifting phase. Stratigraphic information is compiled from published papers (e.g., Remus et al., 1993; Barr and Cooper, 2013; Pongwapee et al., 2019a) and well reports from the Department of Mineral Fuels. Understanding the tectonic history of the Wichianburi Sub-basin is important for the development of hydrocarbons in the other part of the Phetchabun Basin.
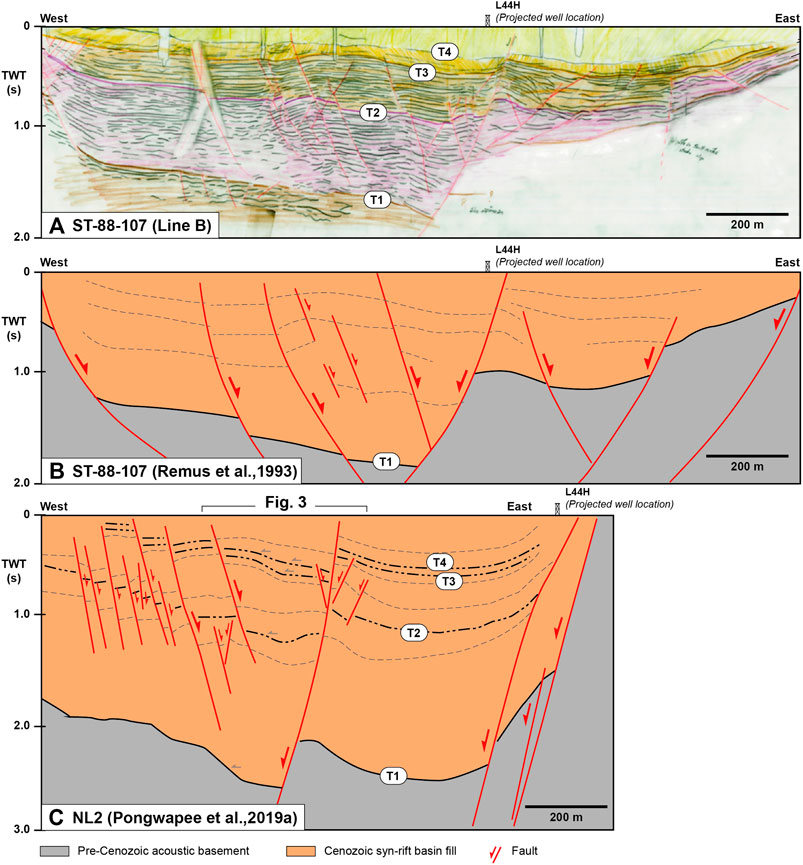
FIGURE 2. (A) Example of seismic interpretation on tracing paper with colored pencils. (B) Seismic interpretation of the same 2D seismic line published by Remus et al. (1993). (C) Seismic interpretation based on 3D seismic data by Pongwapee et al. (2019a). See Figure 1 for line location.
The Phetchabun Basin is located at the western margin of the Indochina block (Figure 1). The Sukhothai Arc System lies further west. The pre-Cenozoic basement rocks and structures under the basin are related to the development of Indosinian Orogeny after the subduction of the Paleo-Tethys Ocean during the Devonian-Triassic (Sone and Metcalfe, 2008). During the Early to Middle Permian, an elongated N-S-trending extensional basin, called Nam Duk Basin, was formed between two shallow carbonate platforms (Khao Khwang in the west and Pha Nok Khao in the east) at the western margin of the Indochina block (Wielchowsky and Young, 1985; Ueno and Charoentitirat, 2011). In the Early Triassic, the Sukhothai island arc closed with and was thrust over the margin (see review in Morley, 2018). The pre-existing Permian slope-to-basin rocks were extensively folded, thrust, inverted, uplifted, and eroded forming the N-S trending Phetchabun Fold Belt (Sone and Metcalfe, 2008). These highly deformed Permian rocks were subsequently covered by lacustrine to fluvial sediments during the Late Triassic to Late Cretaceous including the Kuchinarai and Khorat Groups (Racey, 2009). Subsequently, crustal thickening and transpression accompanied by the subduction of Tethyian oceanic crust beneath Burma and Western Thailand during the Late Cretaceous to Early Paleogene caused folding, thrusting, strike-slip faulting, uplifting, and erosion along the western margin of the Indochina block (Searle and Morley, 2011). The Phetchabun Basin has been formed by reactivation of the N-S trending zone of a Paleogene transpressional belt (probably sinistral motion; see Figure 1A), which caused uplift and erosion of the Khorat Group along the margin (Morley, 2012).
In northern and central Thailand, two dominant Cenozoic structural styles are associated with strike-slip faulting and rifting under an ∼E-W extension around the Late Oligocene-Pliocene (Morley and Racey, 2011). The nature of the interactions between strike-slip faulting and rifting in Thailand is controversial. Some researchers have sought to explain all of the rift basins in a strike-slip context (e.g., Tapponnier et al., 1986; Polachan et al., 1991). However, Morley (2007) and Morley (2015) proposed that the evolution of the basins is more complex. Most of the Cenozoic basins opened under an extensional stress regime with the strike-slip faults activating at different times from extension, and/or there is a spatial transition from areas of strike-slip to extension. The onset of the rift basin ranges from Late Eocene (e.g., Krabi Basin in the Gulf of Thailand) to Late Miocene (e.g., the neighboring Phitsanulok Basin). Folds, thrusts, and inversion structures are also presented in places (Morley et al., 2011).
The Phetchabun Basin comprises three grabens and two sub-basins (North Phetchabun Sub-basin, Chai Mongkhon Graben, Khon Khwang Graben, Nong Chaeng Graben, and Wichianburi Sub-basin) (Figure 1). According to regional 2D seismic interpretation, the Wichianburi Sub-basin is bounded by the NNE-striking listric faults (Remus et al., 1993). A recent study by Pongwapee et al. (2019a) interpreted 3D seismic data within the sub-basin and provided detailed structural maps showing normal faults predominantly trend NNW-SSE to NNE-SSW developed in response to the ∼E-W extension during the Late Oligocene-Early Miocene. The extension direction rotated to a more NW-SE orientation during the Middle Miocene-Pliocene. The old fault orientations were reactivated, and new faults also developed with predominantly NNE-SSW to NE-SW orientations. Their results suggest a multiphase oblique extension with an influence of pre-Cenozoic structure.
The stratigraphy of the Wichianburi Sub-basin can be divided into four seismic packages based on four significant unconformities (see T1–T4 in Figure 3). These unconformities are comparable between 2D seismic interpretation by this study and 3D seismic interpretation by Pongwapee et al. (2019a). The first package (Basal Tertiary and Wichianburi Group; Remus et al., 1993) comprises a distinctive yellow-red to dark-grey sandstone interbedded with shale deposited during the Late Oligocene-Early Miocene (Morley and Racey, 2011). The sandstone is very fine to fine grained and shows moderate sorting and subangular to subrounded grains. These sediments were deposited in environments ranging from alluvial/fluvial to lacustrine. This syn-rift package overlies acoustic basement comprising Late Jurassic-Late Cretaceous clastics (Khorat Group), Triassic volcanics, granites, and sandstones, and Permian sedimentary rocks (predominantly shales and limestones). Outcrops representing the basement rocks can be found in quarries along the eastern margin of the Wichianburi Sub-basin. These outcrops have a major structural trend in NE-SW direction following the basin geometry as outlined by the gravity map (Figure 1B).
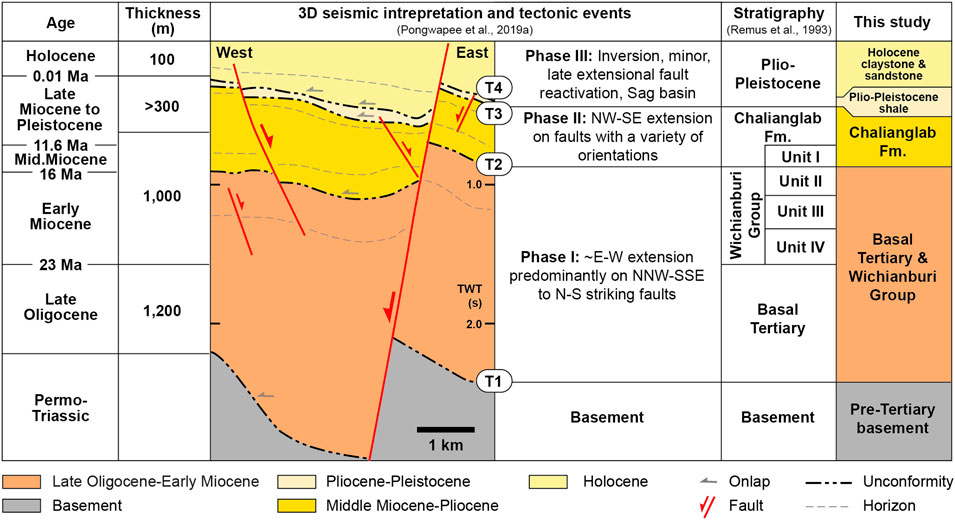
FIGURE 3. Comparison of seismic stratigraphy and tectonic events with key unconformities (T1–T4). Location of 3D seismic interpretation is located in Figure 1B.
The second package (Chaliang Lab Formation; Remus et al., 1993) comprises predominantly dark shale with traces of carbonaceous material, mica, and dolomite. Minor dark siltstones and sandstones are interbedded with the shales. The sandstones are fine to medium grained, poorly to moderately sorted, and subangular to subrounded. This interval is heavily affected by igneous intrusions together with some extrusive lava flows. The depositional environment is predominantly lacustrine, with some fluvio-deltaic deposits during the Early-Late Miocene.
The third package is predominantly composed of varicolored yellow to red claystone with occasional interbedded sandstones, siltstones, basalts, and thin coals. These deposits are interpreted as forming in paralic to fluvio-deltaic environments, marginal to a lake. Dark-grey, fine-grained sediments are observed close to the basin center and are interpreted as lacustrine during the Pliocene-Pleistocene.
The fourth package comprises mainly yellow to red claystone and sandstone, deposited in fluvial and alluvial environments during the Holocene. Shallow sills and basalt flow are also associated with this package (Pongwapee et al., 2019b).
Seismic data used in this study were original hardcopy printouts of regional 2D seismic data acquired in 1988 by CGG across the Phetchabun Basin including the Wichianburi Sub-basin. The seismic images are poor to fair quality with maximum depth of 5 s two-way travel time (TWT). The interpretation of all E-W oriented seismic sections was first published by Remus et al. (1993) showing only major faults and some seismic trace within the Cenozoic basin fill. At the time of this study, many original seismic lines had gone missing from the archive in the Department of Mineral Fuels’ data room. Only four complete sections (Line A–Line D) were interpreted on tracing papers with colored pencils (Figure 4). Photocopy of these sections was not allowed.
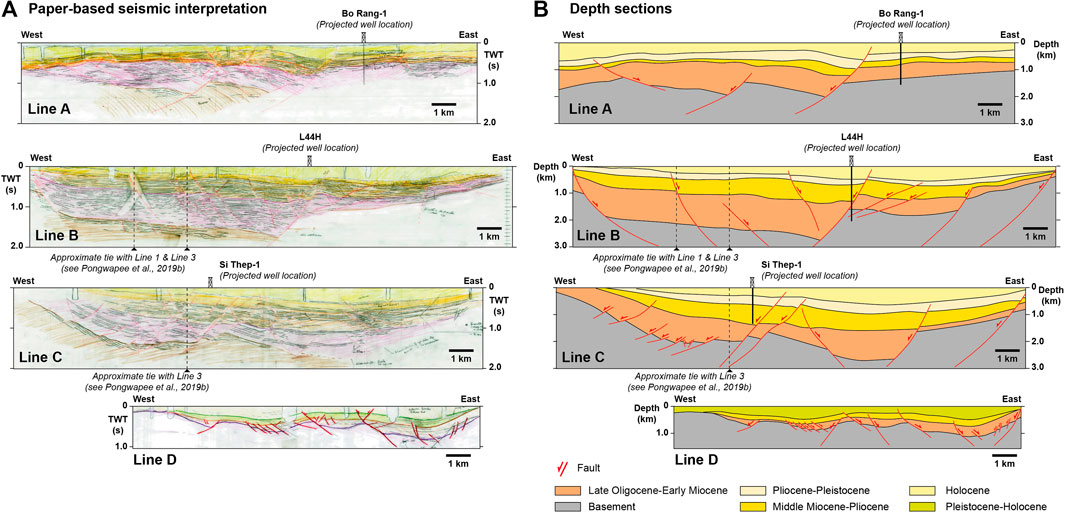
FIGURE 4. (A) Scanned interpretation images of four representative seismic sections used in this study. (B) Depth section of (A). See Figure 1 for location. Line 1 and Line 3 are presented in Pongwapee et al. (2019b).
Seismic interpretation was conducted by laying head down on a work table to gain perspective and increase the amount of reliable geologic information to be derived from the seismic images. The geologic evolution of each interpreted section was discussed among the interpreters to produce a better reasonable interpretation as suggested by Macrae et al. (2016). Each seismic package was defined by its seismic characters (e.g., continuity, frequency, and amplitude), stratigraphy (e.g., onlap), and unconformities. Seismic reflectors were traced on tracing papers as much as possible to present seismic characteristics within seismic packages. Although there was no well information provided during interpretation, key unconformities (T1–T4) can be identified and are comparable in all sections. In places, due to poor seismic image at depth, the top basement (T1 unconformity or base syn-rift) horizon and some faults particularly near the basin margin were integrated with regional interpretation by Remus et al. (1993). The T1–T4 unconformities and their ages were constrained by recent publications by Pongwapee et al. (2019a) and Pongwapee et al. (2019b), which provide examples of seismic interpretation based on 3D seismic and well data in the Wichianburi Sub-basin. One of their E-W sections is about 2 km south of Line B (Figure 2).
Unlike other basins where depth conversion can be made by utilizing a combination of well tops, sonic logs, stacking velocities, vertical seismic profiles, and check-shot surveys, these data are not available for this study and thus depth conversion may involve an appropriate level of uncertainty. However, this study strives to obtain lithology and formation thickness from wells (e.g., Wichianburi-1 well) and interpolates horizons from our time sections to published well-tied depth sections within the sub-basin (Remus et al., 1993; Barr and Cooper, 2013). A simple depth conversion was carefully performed using Petroleum Experts’ Move software (2019) based on average rock density and interval velocities of each seismic package (Table 1). The depth-converted seismic sections present geologically acceptable fault geometries (Figure 4).
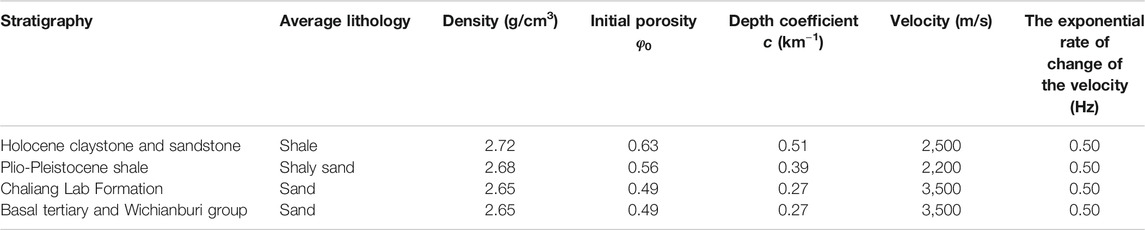
TABLE 1. Parameters applied to decompaction and depth conversion.
2D structural restoration involves sequentially removing the deformational effects of geologic processes such as sediment compaction, faulting, and folding. It is a meaningful technique for improving the accuracy of the seismic interpretation (Bond et al., 2012). Sediment decompaction was performed based on the compaction curves of Sclater and Christie (1980). In the Sclater-Christie equation, porosity (φ) at a given depth (z) is defined by φ(z) = φ0e−cz, where φ0 is the depositional porosity of lithology and c is the depth coefficient. The decompaction of the underlying layers is related to the removal of the uppermost sedimentary layer. The average lithology parameters used in this process are listed in Table 1.
The Wichianburi Sub-basin is dominated by nonplanar normal faults. The simple shear transformation was applied to restore the hanging wall along the faults. In some situations (i.e., folding and rollover anticline), the flexural unfolding transformation was applied to preserve the length on the shortening direction. All four E-W-trending depth sections were time-step reconstructed and analyzed using Petroleum Experts’ Move software. These sections are oriented perpendicular to the main extensional structure. Horizon lengths were measured at undeformed stage (see Table 2). The extension (ε) was then calculated for each of the different periods: Late Oligocene to Early Miocene, Middle Miocene to Pliocene, Pliocene to Pleistocene, and Holocene.
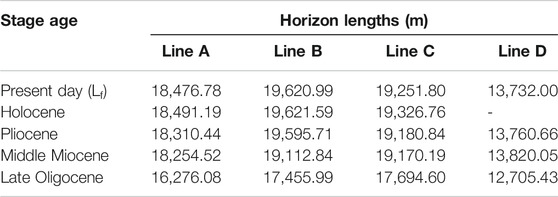
TABLE 2. Horizon lengths at undeformed stage.
In order to compare the results between the different stages from the same section, we calculated cumulative stretching factor (ß) and extension on the restored section length in each case in relation to the present-day length (Lf). These calculations eliminate the differences, which arise from the different final length. Then the extension during each stage can be calculated by subtracting later extension values (Table 3). A negative extension value indicates a shortening interruption during the evolution of the basin.
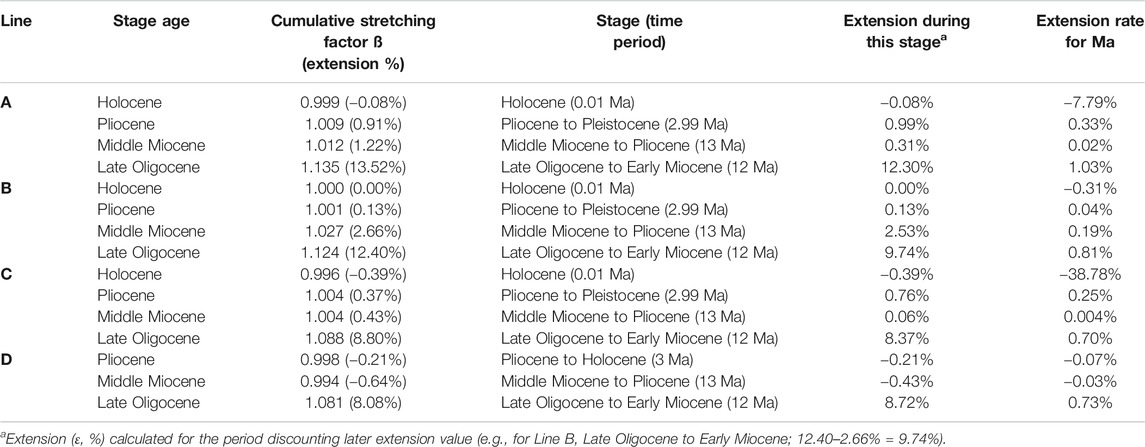
TABLE 3. Calculation of extension for the evolutionary stages.
The results of the sequential restoration of the Line B seismic interpretation are shown in Figure 5. Each time-step represents the cumulative result of all previous deformations. Fault status is highlighted in each panel to emphasize the temporal and spatial changes in active faulting. The length and amount of extension at that time are annotated. The numbers can be used to quantify the E-W extension of the Wichianburi Sub-basin (Figure 6).
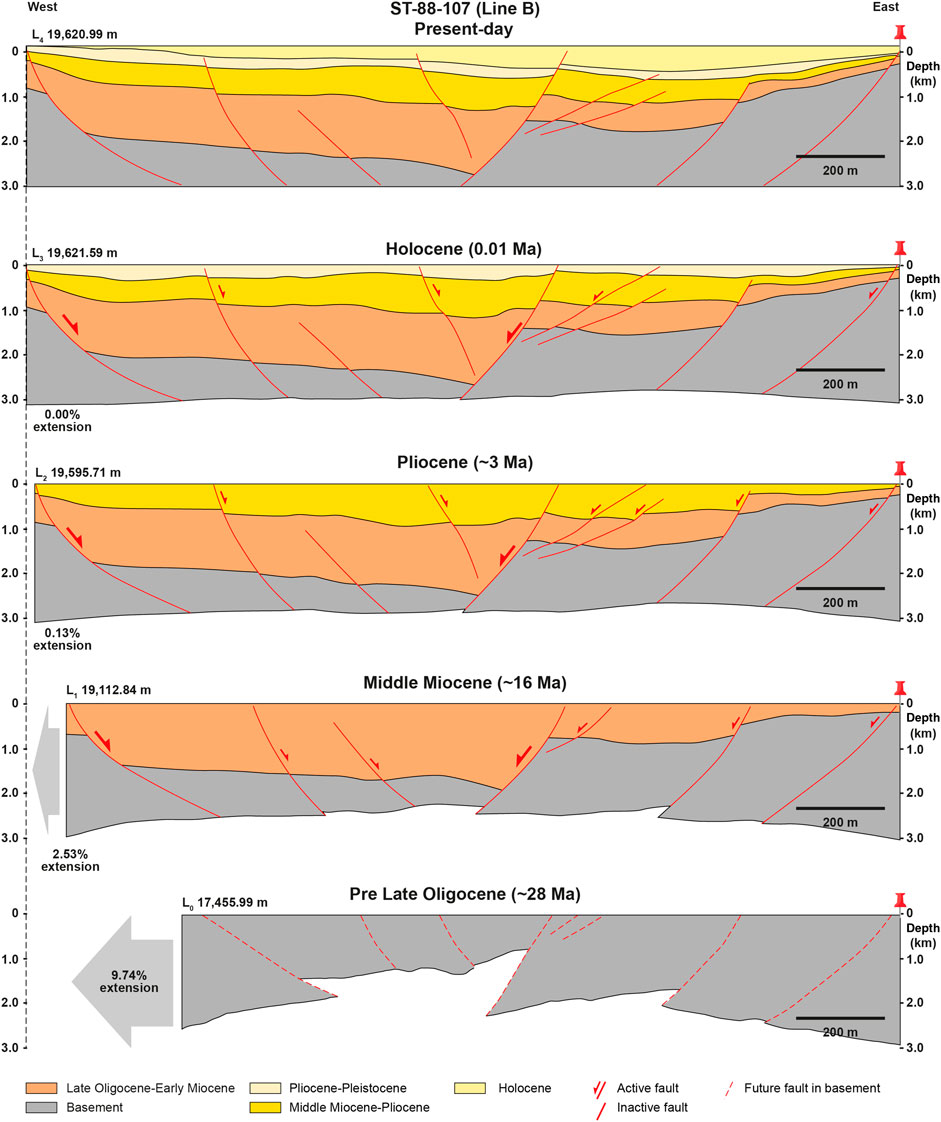
FIGURE 5. The structural evolution of the Line B interpretation from the Late Oligocene to present. The extensional phases are captured in four phases. Ages, section lengths, and amount of extension are annotated for each time-step. The eastern end of each section is pinned for section length comparison.
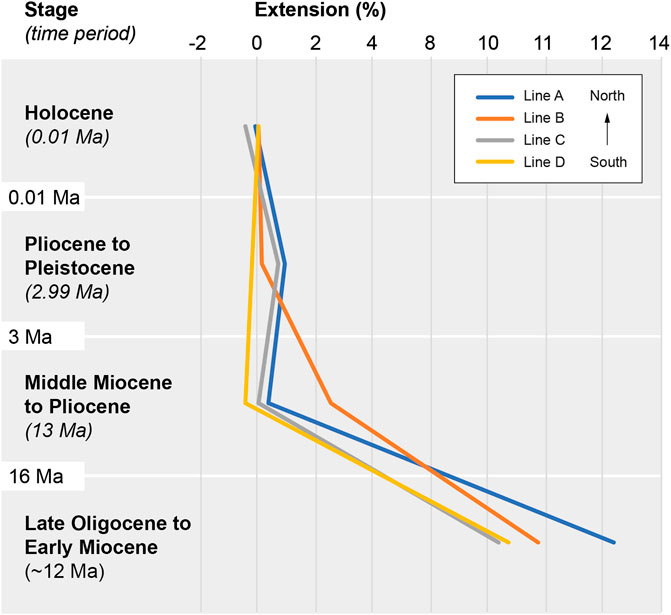
FIGURE 6. Summary graph showing the amount of extension of Line A to Line D.
All sections suggest the major rifting phase of the Wichianburi Sub-basin during the Late Oligocene-Early Miocene. Two main depocenters for the syn-rift sediments are located in the basin center along the west-dipping normal faults as suggested by the gravity anomaly (Figure 1B). Depth-converted Line B that cuts across the main depocenter suggests maximum thickness of syn-rift sediments up to 1,400 m. Active normal faults cut the pre-rift section and their NNW-SSE orientations were possibly controlled by the Permo-Triassic fabrics that underlie the western margin of the sub-basin (Pongwapee et al., 2019a). The results from restorations show that the extension in the E-W direction of the Wichianburi Sub-basin increases toward the north ranging from 8.37% to 12.30%.
The second phase of rifting occurred during the Middle Miocene with the extension values ranging from −0.43% to 2.53%. These low stretching values in the E-W direction may be because of changing in extension direction to a more NW-SE orientation (Pongwapee et al., 2019a) or the transition from the syn-rift to the post-rift stage. However, the maximum extension value provided by Line B indicates that the main faults within the basin center remain active at this time. They offset the T2 unconformity with the thickening of the Chaliang Lab Formation on the hanging wall. Therefore, it can be assumed that extension is the dominant mechanism focusing only in the basin center with the development of smaller, new faults during this phase of basin evolution.
During this period, subsidence became dominant. The extension ranges from −0.21% to 0.99%. There are no new significant normal faults. Some faults were reactivated small fault throws (Figure 4). Generally, the Plio-Pleistocene lacustrine shales thicken toward basin center and thin toward basin margins. Their seismic reflectors onlap onto the T3 unconformity.
This is the period of continued subsidence and the deposition of fluvial and alluvial sediments. The Wichianburi Sub-basin became dominantly subsidence with some interruptions of shortening by inversion or intrusion. A broad gentle symmetrical anticline observed in Line A (Figure 4) is referred to forced folds by intrusions (Pongwapee et al., 2019b). This positive structure is discussed in the next section.
According to 2D sequential restorations, extension was commonly concentrated initially onto the intra-rift faults that were located in the center of the basin and remained focused in the rift center until the end of extension. These faults are hard-linked with the basement structure and thus strongly controlled by the pre-Cenozoic structure. Structural map of the top basement based on 3D seismic interpretation (Pongwapee et al., 2019a) illustrates a long, up to 40 km NNW-SSE-trending, west-dipping fault, which in this study infers as the main rift fault. Its orientation is parallel to the western basin-bounding fault interpreted by Remus et al. (1993) and the sub-vertical Permian limestone ridge approximately 10 km west of Line A (Figure 1). Another major west-dipping fault to the east of the restored sections is likely to be part of the eastern basin-bounding faults. Both faults were not active after the Pliocene extension. Their changing in strike from NNE-SSW to NNW-SSE may indicate fault linkage between the intra-rift and basin-bounding faults during rifting. Results from oblique rift models have shown that the orientation of the intra-rift faults can be used to infer extension direction (e.g., McClay and White, 1995; Corti, 2012). Maximum strains occurred along the intr-rift faults that were aligned perpendicularly to the extension direction. Continued extension on the intra-rift faults controlled the geometries of elongate depocenters in the center of the models. Therefore, the ∼E-W extension is preferred for the Late Oligocene-Early Miocene rifting in the Wichianburi Sub-basin where both sides of the basin margins are oblique to the extension direction and the maximum depocenter occurred along the west-dipping intra-rift faults.
The Wichianburi Sub-basin has undergone extension since the Late Oligocene. After the rift climax phase in the Middle Miocene, the basin subsided with shortening interruptions as indicated by negative extension values. Pongwapee et al., (2019b) have documented the distribution and timing of intrusions and forced folds in the sub-basin based on 3D seismic data. They suggested that the greatest amount of intrusive activity occurred between 16 and 11 Ma (Middle Miocene). Younger intrusions are dated less than 5 Ma (Barr and Cooper, 2013). Forced folds within the post-rift strata can develop in response to sill and laccolith intrusions (e.g., Hansen and Cartwright, 2006; Magee et al., 2017). Unfortunately, intrusive features were not clearly seen on seismic data we used in this study. We assume that forced folds reduce extension values. Therefore, negative extension values indicate that the amount of shortening exceeds the amount of extension. The broad anticlinal structure found in the northern section (Line A) is likely to form during the deposition of the Chaliang Lab Formation and the younger sediments due to multiple intrusion events. Structural styles related to strike-slip systems, major fold, and thrust are not presented in the studied sections within the basin center.
Four original hardcopy printouts of regional 2D seismic data across the Wichianburi Sub-basin were interpreted and structurally analyzed in order to calculate extension of each rifting phase. The Wichianburi Sub-basin is dominated by the NNW-SSE to NNE-SSW trending normal faults as a result of multistage rifting since the Late Oligocene. Half-graben and full-graben basin geometries can be observed from 2D regional seismic sections. The extensions of the Wichianburi Sub-basin decrease from 12.30% during the main rift phase (Late Oligocene to Early Miocene) to 2.53% during the second phase of rifting. Rifting only focused in the basin center with the development of NNW-SSE to N-S trending intra-rift faults, which indicate an E-W extension direction. Since the Middle Miocene, the Wichianburi Sub-basin has developed under tectonic phase of post-rift subsidence with interruption by intrusive activities.
The raw data supporting the conclusions of this article are available from the corresponding author SJ on request.
SJ, investigation (lead), seismic interpretation, structural analysis (equal), writing original draft. JP, structural analysis (equal). PK, project supervision.
This research receives Grants for Development of New Faculty Staff, Ratchadapisek Somphot Endowment Fund, Chulalongkorn University (GDNS 59-003-23-003).
The authors declare that the research was conducted in the absence of any commercial or financial relationships that could be construed as a potential conflict of interest.
We would like to thank the Department of Mineral Fuels for allowing us to access seismic data room. Petroleum Experts is thanked for donating the Move software license. We also thank the M.Sc. Petroleum Geoscience Program, Department of Geology, Chulalongkorn University, for providing computer workstation.
Barr, S. M.,, and Cooper, M. A. (2013). Late cenozoic basalt and gabbro in the subsurface in the Phetchabun Basin, Thailand: implications for the Southeast Asian Volcanic Province. J. Asian Earth Sci. 76, 169–184. doi:10.1016/j.jseaes.2013.01.013
Bond, C. E., Lunn, R. J., Shipton, Z. K., and Lunn, A. D. (2012). What makes an expert effective at interpreting seismic images? Geology 40, 75–78. doi:10.1130/G32375.1
Corti, G. (2012). Evolution and characteristics of continental rifting: analogue modelling inspired view and comparison with examples from the east African Rift System. Tectonophysics 522–523, 1–33. doi:10.1016/j.tecto.2011.06.010
Hansen, D. M.,, and Cartwright, J. (2006). The three-dimensional geometry and growth of forced folds above saucer-shaped igneous sills. J. Struct. Geol. 28, 1520–1535. https://doi.org/10.1016/j.jsg.2006.04.004
Macrae, E. J., Bond, C. E., Shipton, Z. K., and Lunn, R. J. (2016). Increasing the quality of seismic interpretation. Interpretation 4 (3), T395–T402. doi:10.1190/int-2015-0218.1
Magee, C., Jackson, C. A.-L., Hardman, J. P., and Reeve, M. T. (2017). Decoding sill emplacement and forced fold growth in the Exmouth sub-basin, offshore northwest Australia: implications for hydrocarbon exploration. Interpretation 5, SK11–SK22. https://doi.org/10.1190/INT-2016-0133.1
McClay, K. R.,, and White, M. J. (1995). Analogue modelling of orthogonal and oblique rifting. Mar. Petrol. Geol. 12, 137–151. doi:10.1016/0264-8172(95)92835-K
Morley, C. K. (2007). Variations in Late Cenozoic-Recent strike-slip and oblique-extensional geometries within Indochina: the influence of pre-existing fabrics. J. Struct. Geol. 29, 36–58. doi:10.1016/j.jsg.2006.07.003
Morley, C. K. (2012). Late cretaceous-Early Palaeogene tectonic development of SE Asia. Earth Sci. Rev., 115, 37–75. doi:10.1016/j.earscirev.2012.08.002
Morley, C. K. (2015). “Five anomalous structural aspects of rift basins in Thailand and their impact on petroleum systems,” in Industrial structural Geology: principles, techniques and integration, 421. Editors. F. L., Richards, N. J., Richardson, S. J., Rippington, R. W., Wilson, and C. E., Bond (Geological Society, London, Special Publications), 143–168.
Morley, C. K. (2018). Understanding Sibumasu in the context of ribbon continents. Gondwana Res. 64, 184–215. doi:10.1016/j.gr.2018.07.006
Morley, C. K.,, and Racey, A. (2011). “Tertiary stratigraphy,” in The Geology of Thailand. Editors. M. F., Ridd, A. J., Barber, and M. J., Crow (London: Geological Society), 223–271.
Morley, C. K., Charusiri, , P., and Watkinson, I. M. (2011). “Structural geology of Thailand during the Cenozoic Modern tectonic setting of Thailand”,. in Geology of Thailand. Editors. M. F. Ridd, A. J. Barber, and M. A. Crow (London, UK: Geological Society, Special Publications), Chap. 11, 273–334.
Polachan, S., Pradidtan, S., Tongtaow, C., Janmaha, S., Intarawi-jitr, K., and Sangsuwan, C. (1991). Development of cenozoic basins in Thailand. Mar. Petrol. Geol. 8, 84–97. doi:10.1016/0264-8172(91)90047-5
Pongwapee, S., Morley, C. K., and Won-in, K. (2019a). Impact of pre-existing fabrics and multi-phase oblique extension on Cenozoic fault patterns, Wichianburi sub-basin of the Phetchabun rift, Thailand. J. Struct. Geol. 118, 340–361. https://doi.org/10.1016/j.jsg.2018.11.012
Pongwapee, S., Won-in, K., and Morley, C. K. (2019b). Syn-rift magmatism in a Cenozoic rift basin, from 3D seismic data, Wichianburi Sub-basin, Phetchabun Basin, Thailand: Part 1 distribution and timing of intrusions and forced folds. J. Geol. Soc. London 177, 189–210. https://doi.org/10.1144/jgs2019-046
Racey, A. (2009). Mesozoic red bed sequences from SE Asia and the significance of the Khorat Group of NE Thailand. Geol. Soc. London Special Publ. 315 (1), 41–67. doi:10.1144/sp315.5
Remus, D., Webster, M., and Keawkan, K. (1993). Rift architecture and sedimentology of the Phetchabun Intermontane Basin, central Thailand. J. Southeast Asian Earth Sci. 8, 421–432. https://doi.org/10.1016/0743-9547(93)90043-O
Sclater, J. G.,, and Christie, P. A. (1980). Continental stretching: an explanation of the post-mid-cretaceous subsidence of the central North Sea Basin. J. Geophys. Res. Solid Earth 85 (B7), 3711–3739. doi:10.1029/jb085ib07p03711
Searle, M. P.,, and Morley, C. K. (2011). “Tectonic and thermal evolution of Thailand in the regional context of SE Asia,” in Geology of Thailand. Editors. M. F., Ridd, A. J., Barber, and M. A., Crow (Geological Society, London, Special Publications), Chap. 20, 539–571.
Sone, M.,, and Metcalfe, I. (2008). Parallel Tethyan sutures in mainland Southeast Asia: New insights for Palaeo-Tethys closure and implications for the indosinian orogeny. Compte Rendus Geosci. 340, 166–179. doi:10.1016/j.crte.2007.09.008
Tapponnier, P., Peltzer, G., and Armijo, R. (1986). On the mechanism of collision between India and Asia,” in Collision tectonics Editors. M. P., Coward, and A. C., Ries (Geological Society, London, Special Publications), Vol. 19, 115–157.
Ueno, K.,, and Charoentitirat, T. (2011). “Carboniferous and Permian,” in Geology of Thailand. Editors. M. F., Ridd, A. J., Barber, and M. A., Crow (Geological Society, London, Special Publications), Chap. 5, 71–136.
Wielchowsky, C. C.,, and Young, J. D. (1985). “Regional facies variations in Permian rocks of the Phetchabun fold and thrust belt, Thailand,” in Proceedings of the Geology and Mineral Resource Development of Northeastern Thailand, Khon Kaen University, Thailand. Editors P., Thanvarachorn, S., Hokjaroen, and W., Youngme, 41–55.
Keywords: Wichianburi Sub-basin, structural restoration, Thailand, Cenozoic basin, Phetchabun Basin
Citation: Jitmahantakul S, Phetheet J and Kanjanapayont P (2020) 2D Sequential Restoration and Basin Evolution of the Wichianburi Sub-basin, Phetchabun Basin, Central Thailand. Front. Earth Sci. 8:578218. doi: 10.3389/feart.2020.578218
Received: 30 June 2020; Accepted: 03 November 2020;
Published: 07 December 2020.
Edited by:
Basilios Tsikouras, Universiti Brunei Darussalam, BruneiReviewed by:
Zhen Sun, South China Sea Institute of Oceanology (CAS), ChinaCopyright © 2020 Jitmahantakul, Phetheet and Kanjanapayont. This is an open-access article distributed under the terms of the Creative Commons Attribution License (CC BY). The use, distribution or reproduction in other forums is permitted, provided the original author(s) and the copyright owner(s) are credited and that the original publication in this journal is cited, in accordance with accepted academic practice. No use, distribution or reproduction is permitted which does not comply with these terms.
*Correspondence: Sukonmeth Jitmahantakul, c3Vrb25tZXRoLmpAY2h1bGEuYWMudGg=
Disclaimer: All claims expressed in this article are solely those of the authors and do not necessarily represent those of their affiliated organizations, or those of the publisher, the editors and the reviewers. Any product that may be evaluated in this article or claim that may be made by its manufacturer is not guaranteed or endorsed by the publisher.
Research integrity at Frontiers
Learn more about the work of our research integrity team to safeguard the quality of each article we publish.