 Yu Wang
 Huixin Li
 Bo Sun
 Huopo Chen3
- 1Collaborative Innovation Center on Forecast and Evaluation of Meteorological Disasters/Key Laboratory of Meteorological Disasters, Ministry of Education/Joint International Research Laboratory of Climate and Environment Change, Nanjing University of Information Science and Technology, Nanjing, China
- 2College of Atmospheric Science, Nanjing University of Information Science and Technology, Nanjing, China
- 3Nansen Zhu International Research Centre, Institute of Atmospheric Physics, Chinese Academy of Sciences, Beijing, China
- 4School of Applied Meteorology, Nanjing University of Information Science and Technology, Nanjing, China
This study aims to reveal the historical and future relationship between droughts in the Yangtze River basin and hydropower capacity in Zhejiang Province. Generally, the interannual variation of hydropower capacity is positively correlated with the 12-month timescale of the Standardized Precipitation Evapotranspiration Index (SPEI) over the Yangtze River basin during 1999–2018, so a more severe drought event in the Yangtze River basin leads to lower hydropower capacity in Zhejiang Province. Therefore, a linear regression model is constructed based on their year-to-year incremental relationship, which is significant at the 99% confidence level. Using five global climate models that are good simulations of the interannual variability of precipitation/surface air temperature over the Yangtze River basin, the results suggest that the severity and the frequency of drought would increase relative to 1999–2018, with a drought event (SPEI < −0.5) happening once every 2.7 and 2.2 years under 1.5 and 2.0°C warming scenarios, respectively. Based on the interannual incremental relationship between hydropower capacity and SPEI, the hydropower capacity in Zhejiang Province will decrease by 0.34 (1.23) billion kWh under the 1.5°C (2.0°C) warming target when only the meteorological conditions are considered. When further development of hydropower stations in the future is also considered, the hydropower capacity would increase by −0.28 (1.11) billion kWh under 1.5°C (2.0°C) warming using the logistic growth model. Consequently, the drought events and the development of the hydroelectric system would jointly influence the hydropower capacity in the Yangtze River basin, and the meteorological conditions of a drying trend would contribute to lower hydropower capacity in Zhejiang Province in the future.
Introduction
Drought is a major natural hazard that has important impacts on the ecosystem (Soloman et al., 2007), agriculture (Wang et al., 2018), water resources (Zhang et al., 2018), tourism (Wang et al., 2016), energy (Bartos and Chester, 2015), and so on. Generally, drought often features a deficiency in precipitation and conditions of increased evaporation (Nicholls, 2004; Sheffield et al., 2012). Under global warming, drought has become more frequent and severe across the world in recent decades (Dai, 2013).
Recently, nationwide droughts have occurred almost every year in China (Zhai et al., 2010). For the Yangtze River basin, drought coverage has shown an upward trend in recent decades, especially in its southeastern part (Tao et al., 2018). Besides, the occurrences of droughts in spring and autumn are becoming more frequent in the middle reaches of the Yangtze River basin (Gemmer et al., 2008), whereas both their frequency and severity have intensified in the lower reaches (Cao et al., 2018). In the future, the variation in drought events will become more complicated at regional scales (Knutti and Sedláček, 2012; Li et al., 2018), and Liu et al. (2019) found that droughts would occur more frequently and affect more regions in the Yangtze River basin in 2020–2050. In terms of the corresponding physical mechanisms, previous studies indicated that numerous influential factors such as ENSO phases (Wang et al., 2000; Wu et al., 2003; Zhang et al., 2014), the concentration of sea ice over the Arctic Ocean and Greenland (Wu et al., 2009), Pacific decadal oscillation (Yang et al., 2016; Yao et al., 2018; Zhu et al., 2019; Gao et al., 2020), and tropical surface sea temperature (Sun and Wang, 2014) may regulate the conditions of surface air temperature (SAT) and precipitation over the Yangtze River basin, which will further influence the occurrence of drought events.
In general, hydropower capacity is vulnerable to climate change (especially drought events) across the world (Cherry et al., 2017). For example, hydropower potential will reduce by 25% due to climate change in European countries (Lehner et al., 2005), and it will drop by 10–49% in southern Spain by the end of the century as a result of global warming (Solaun and Cerdá, 2017). In Brazil, severe droughts caused hydropower production to be 15% below average during the period 2012–2015 (Renato et al., 2016). By the middle of the 21st century, a 10-year drought event would reduce the hydropower potential by 7.2–8.8% in the Western United States because of climate change (Bartos and Chester, 2015). As an emission-free and sustainable source of energy (Edenhofer et al., 2012; Savelsberg et al., 2018), hydropower dominates sources of renewable energy in the electricity sector (Edenhofer et al., 2012; International Energy Agency, 2017). A previous study indicated that the generation of hydropower has been growing steadily since 1980 across the world (Hamududu and Killingtveit, 2012), with the global mean growth rates estimated to be 2.4–3.6% per year between the 1990s and the 2030s (U. S. Energy Information Administration, 2011). In China, hydropower capacity accounts for more than 90% of the total generation of national renewable energy (China National Bureau of Statistics, 2019). However, limited by the temporal coverage of datasets, only a few studies have focused on the impact of drought events on hydropower capacity in China.
Generally, the Yangtze River basin is densely populated and economically developed, so it is of great importance to investigate the potential relationship between droughts and hydropower capacity in the Yangtze River basin. However, the influence of historical and future climate changes in the Yangtze River basin on hydropower capacity remains unknown. In 2015, the Paris Climate Agreement proposed the goal of limiting global mean surface warming below 2.0°C and pursuing a 1.5°C target in comparison with the preindustrial level (UNFCCC, 2015). Thus, the impacts of 1.5°C/2.0°C warming on hydropower generation capacity also deserve attention. Consequently, the focuses of this study can be listed as follows: What is the historical relationship between drought events and hydropower capacity in the Yangtze River basin? How will the drought events and the corresponding hydropower capacity change in the future under different warming scenarios? What will the hydropower capacity be when economic development is also considered?
The outline of this study is as follows. The section entitled Data and Methods briefly describes the datasets and methods used in this research. The section Results first illustrates the variations in the Standardized Precipitation Evapotranspiration Index (SPEI) over the Yangtze River basin from 1961 to 2018 at different timescales and then analyzes the year-to-year incremental relationship between hydropower and the SPEI. After that, the performance of different global climate models (GCMs) from Coupled Model Intercomparison Project Phase 5 in simulating the interannual variability of precipitation/SAT over the Yangtze River basin is analyzed, denoted by the corresponding interannual standard deviation, which better reflects the interannual variations of the meteorological elements than the average mean. Then, the projections of hydropower capacity under the 1.5°C/2°C warming scenarios are discussed when only the meteorological conditions are considered and when the development of the hydroelectric system is also considered. A discussion and a summary are given in the section entitled Discussion and Conclusion.
Data and Methods
Data
In this study, the observed gridded monthly accumulated precipitation and monthly mean SAT datasets (referred to as CN05.1) are employed (Wu and Gao, 2013). CN05.1 was constructed based on the “anomaly approach” method by interpolating 2,416 observation stations across China during the period from 1961 to 2018 (Xu et al., 2009). The horizontal resolution of CN05.1 is 1° × 1°.
The monthly accumulated precipitation and mean SAT datasets of 14 GCMs (Li et al., 2020) under the RCP4.5 and RCP8.5 scenarios from Coupled Model Intercomparison Project Phase 5 are used to evaluate the correlations with the observed meteorological data and drought index, and the models with good simulations are selected from the 14 GCMs (Li et al., 2017). The multi-model ensemble (MME) consists of the mean of selected models with equal weight. The hydropower capacity in the Yangtze River basin was obtained from the China National Bureau of Statistics (2019). To simplify the study, we opt Zhejiang Province as an example in our study, where the hydropower capacity is highly correlated with that in the Yangtze River basin (0.86, 99% confidence level). Given that only the data from 1999 to 2018 are available, the period of 1999–2018 is regarded as the historical level over which to select models with good simulations. To quantify the impacts of climate change on droughts, the SPEI is calculated using the outputs from GCMs in the period 1961–2100. Detailed information on these models is listed in Table 1.
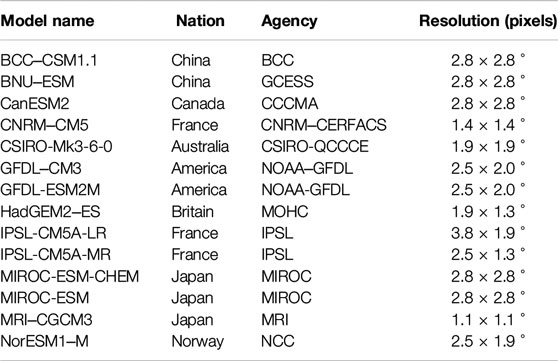
TABLE 1. Basic information for the 14 Coupled Model Intercomparison Project Phase 5 global climate models.
Calculation of the SPEI
In this study, the SPEI is applied to quantify drought events (Vicente-Serrano et al., 2010). The greatest advantage of the SPEI is its multiple timescales, which can reflect different types of droughts (Chen and Sun, 2015). Besides, the effect of potential evapotranspiration (PET) can be considered (Touma et al., 2015). When calculating different timescales of SPEI, the weights for each month are calculated based on the probability-weighted moments.
First, the PET is calculated using
In this study, the reference period is defined as the historical climatological period of 1961–1990. Also, the annual mean SPEI is applied, which is the average for each month (Chen et al., 2013).
Taylor Diagram
The Taylor diagram is widely used to evaluate model performance in a single diagram, and it shows the correlation, root-mean-square difference, and the ratio of the variance between the models and observation (Taylor, 2001).
In this study, the Taylor diagram is employed to choose the models with good simulations among the 14 GCMs.
Future Projections of Hydropower Capacity
The interannual increment approach is applied in this study to project hydropower capacity (Fan et al., 2012). Considering that the hydroelectric system in China is still under development, two cases are discussed in our study, as follows:
Case 1: Only the meteorological conditions are considered.
In this case, the SPEI is applied to stand for the drought conditions as the regression factor. To simplify the calculation of projection, the linear regression is used:
where HPC is the hydropower capacity, βs is the regression coefficient, and βs0 is the intercept.
Case 2: The joint effects of meteorological conditions and the development of the hydroelectric system are both considered.
In this case, the logistic growth model is applied to project the development of the hydroelectric system, which has been used to forecast growth in numerous applications (Clark et al., 2013). The model is given as follows:
where K is the maximum hydropower potential, N0 is the initial amount of hydropower capacity, r is the growth rate, and t denotes the year.
Thus, the equation for hydropower capacity can be altered to
where i denotes the year, βs is the regression coefficient, βs0 and β0 are the intercepts, and βy is the coefficient of the logistic growth model.
The Year of 1.5°C (2.0°C) Warming
In this study, the 1.5°C (2.0°C) warming is defined as the 11-year filtered series of SAT increases by 1.5°C (2.0°C) in comparison with the preindustrial mean of 1861–1900.
Results
Interannual Variation in Drought and its Relationship With Hydropower Capacity
The Yangtze River basin is defined within the region of 107.75–120.75°E, 26.75–32.75°N in this research. As the two key elements relevant to drought events, the interannual variation of the annual mean precipitation and SAT over the Yangtze River basin from 1961 to 2018 is shown in Figure 1. Both the trends of precipitation and SAT increased significantly at the 95% confidence level.
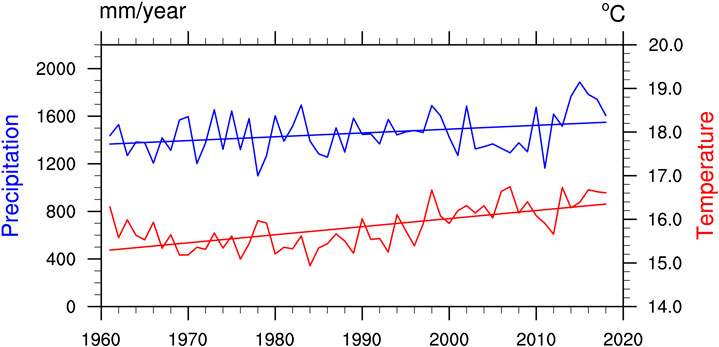
FIGURE 1. Temporal series of the observed interannual variation of accumulated precipitation (blue) and mean surface air temperature (red) over the Yangtze River basin from 1961 to 2018 based on CN05.1. Straight lines indicate the trends in precipitation (blue) and surface air temperature (red). Both trends are significant at the 95% confidence level based on Student’s t-test.
Figures 2A–C show the variation in the SPEI at the 3-, 6-, and 12-month timescales over the Yangtze River basin from 1961 to 2018, respectively, because they are the most commonly used timescales in many articles focusing on climate change (Gao et al., 2017), drying trend (Li et al., 2015), drought characteristics of hydrology (Liu et al., 2016), and so on. There has been a dry period since 2004 according to the 6- and 12-month timescale SPEI. Extreme drought events (SPEI < −1.5) happened at a 3-month timescale in 2012, and there was a persistent drought at the 12-month timescale in 2007 and 2012, when the SPEI reached low points. Generally, the hydropower capacity in Zhejiang Province is highly correlated with that in the Yangtze River basin (with the correlation coefficient (CC) of 0.86, which is significant at the 99% confidence level). Besides, the CCs between hydropower of different provinces and the annual mean SPEI in the Yangtze River basin are calculated, and the hydropower capacity in Zhejiang Province has the highest CCs with the annual mean SPEI in the Yangtze River basin (0.65) when compared to that of other provinces (0.06, 0.23, 0.33, −0.13, and 0.20 for Jiangsu, Anhui, Hunan, Hubei, and Jiangxi, respectively). Therefore, Zhejiang Province is chosen for further investigation. Figure 2D shows the annual mean SPEI at different timescales in the Yangtze River basin and the standardized hydropower output in Zhejiang Province during 1999–2018, and different timescales of the SPEI and hydropower capacity are generally positively correlated. Table 2 gives their CCs based on the interannual increment. The results show that the annual mean 12-month SPEI has the highest CC with hydropower capacity (0.65, significant at the 95% confidence level), suggesting that the 12-month SPEI is highly correlated with hydropower capacity in the Yangtze River basin. Consequently, the annual mean 12-month SPEI is used in the following analyses.
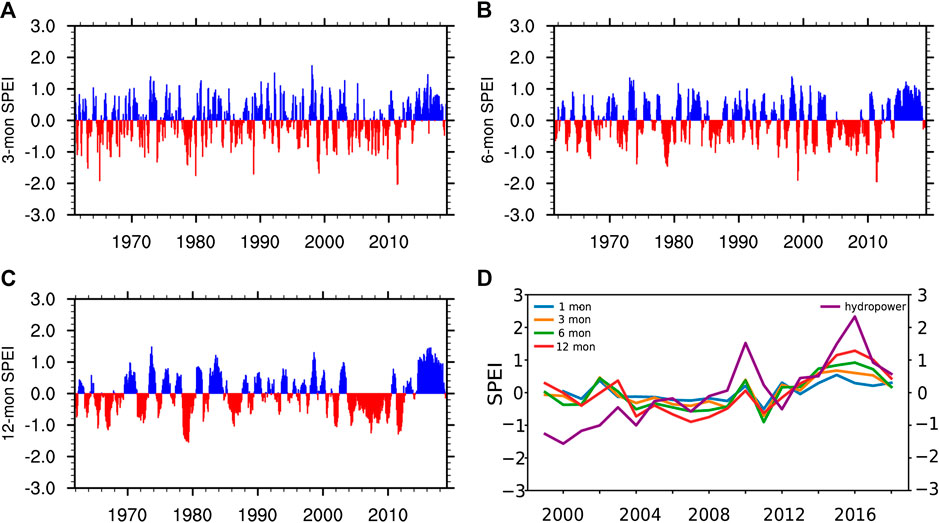
FIGURE 2. Standardized Precipitation Evapotranspiration Index SPEI) at (A) 3-month, (B) 6-month, (C) 12-month timescales over the Yangtze River basin from 1961 to 2018 based on CN05.1. (D) Annual mean SPEI (left) at different timescales over the Yangtze River basin from 1999 to 2018 and the standardized hydropower output (right) in Zhejiang Province from 1999 to 2018.
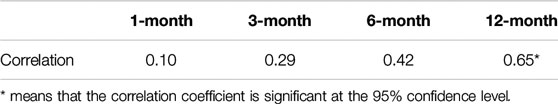
TABLE 2. Correlation coefficients between year-to-year increments in hydropower and the year-to-year increments in the annual mean Standardized Precipitation Evapotranspiration Index at different timescales.
Figure 3A shows the linear relationship between hydropower capacity and the annual mean 12-month SPEI based on the interannual increment approach when only the meteorological conditions are considered. The scattered points are evenly distributed on both sides of the fitting line that is significant at the 95% confidence level. The hydropower capacity and SPEI are synchronized; that is, the hydropower has tended to decrease when drought events have become severe. Figure 3B shows the fitting results based on the above regression model. Compared with the observed hydropower capacity, the result suggests that the model is robust for simulation of hydropower capacity. In addition to the influence of meteorological conditions, the development of the hydroelectric system is also considered in Case 2. Figure 3C illustrates the historical fitting of hydropower development using a logistic growth model. According to the facts that hydropower began in the 1920s in China and is nowadays half-developed (Chang et al., 2010), the growth rate (r) is determined to be 15.9 using the least-squares method, passing the 90% confidence level. Consequently, two factors can jointly influence hydropower capacity: hydropower capacity is negatively correlated with drought severity, whereas the hydropower development favors an increase in hydropower capacity.
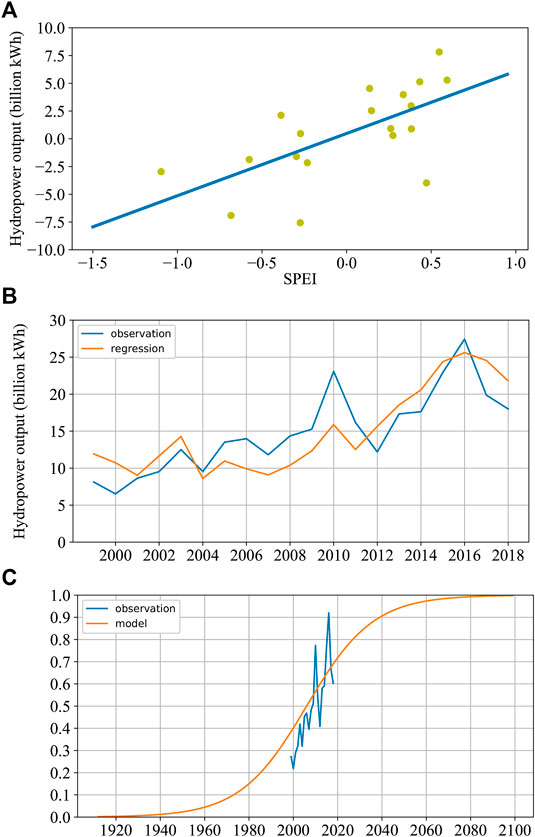
FIGURE 3. (A) Linear regression of the hydropower capacity vs. the annual mean 12-month SPEI based on interannual increment. The regressions are significant at a 95% confidence level based on Student’s t-test. (B) Time series of the original hydropower capacity (blue) and the regression model–based hydropower capacity (orange) during 1999–2018. (C) Historical development of hydropower capacity (blue) and the applied logistic growth model (orange).
Performance Evaluation of Simulation
Figure 4 shows the observed interannual variability of SAT and precipitation from 1999 to 2018 over the Yangtze River basin based on CN05.1. In general, the interannual variability of SAT reflects a slight variation over the Yangtze River basin. Meanwhile, the interannual variability of precipitation displays an uneven spatial pattern. The individual historical simulations of the interannual variability of SAT and precipitation during 1999–2018 are shown in Figure 5. In general, most of the models have good performances for SAT (Figure 5A), except for BNU-ESM and GFDL-CM3. For precipitation, only a few models exhibit similar patterns to the observed results (Figure 5B). Here, the Taylor diagram is introduced to select the models that simulate well the interannual variability in the SPEI (Figure 6). Based on the following criteria (with spatial correlations significant at the 90% confidence level, root-mean-square differences less than 1.0, and the ratio of variance within 0.5–1.5), five GCMs (BBC-CSM1-1, BNU-ESM, MIROC-ESM, MIROC-ESM-CHEM, and NorESM1-M) were eventually chosen for further analyses.
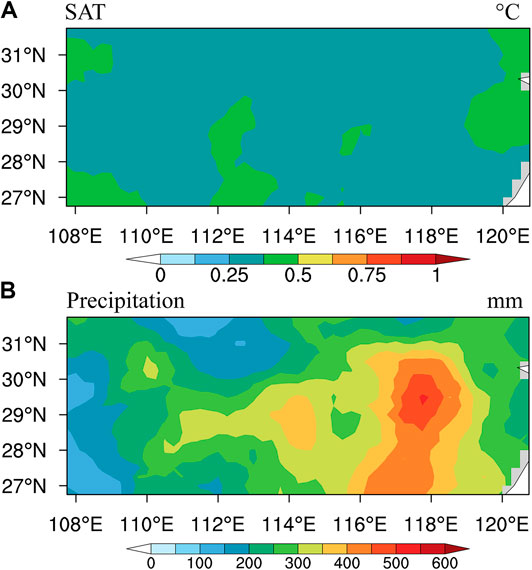
FIGURE 4. Observed interannual variability of annual (A) mean surface air temperature and (B) accumulated precipitation over the Yangtze River basin during the period 1999–2018 based on CN05.1.

FIGURE 5. Plots of the interannual variability of the annual (A) mean surface air temperature and (B) accumulated precipitation over the Yangtze River basin from 1999 to 2018. The 14 global climate models are all shown.
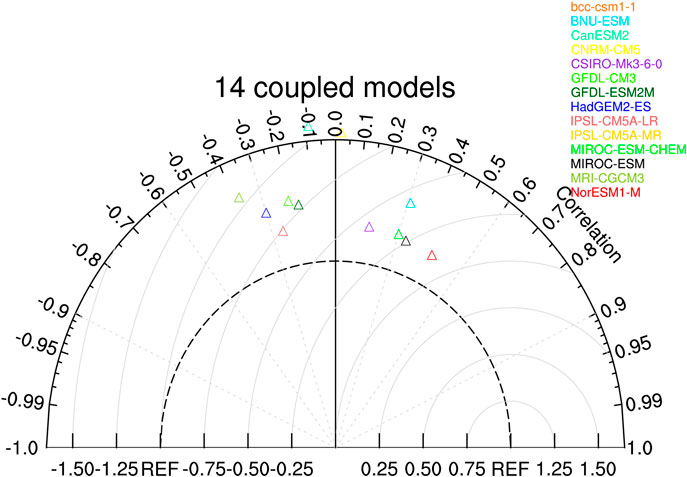
FIGURE 6. Taylor diagram of the interannual variability of the annual mean 12-month Standardized Precipitation Evapotranspiration Index. All of the GCMs are shown, except for two global climate models (CanESM2 and CNRM-CM5) with large standard deviations.
Figure 7 shows the interannual variability of the observed and simulated SPEI based on the five chosen models and their MME on annual mean 12-month SPEI in the historical period (1999–2018), and the spatial CCs of the five chosen models are all >0.2, which is significant at the 95% confidence level. Moreover, the spatial CC of MME is 0.38. Hereafter, results based on the five chosen models and their MME are used to investigate the changes in drought over the Yangtze River basin and to project future changes in hydropower capacity.
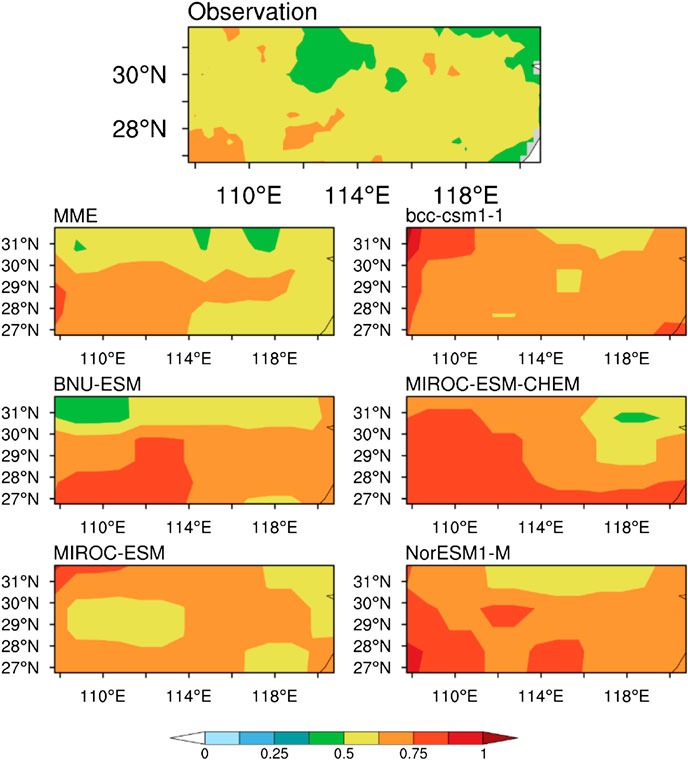
FIGURE 7. Plots of interannual variability of the annual mean 12-month SPEI based on observation, multi-model ensemble (MME) median, and five chosen models (BBC-CSM1-1, BNU-ESM, MIROC-ESM, MIROC-ESM-CHEM, and NorESM1-M) over the Yangtze River basin during 1999–2018.
Future Changes in SPEI and Projections of Hydropower
Based on the five chosen GCMs, Figure 8 shows the temporal series of annual mean SAT, accumulated precipitation, and annual mean 12-month SPEI over the Yangtze River basin during the period 1961–2100 under RCP4.5. For SAT (Figure 8A), the MME simulates well the interannual and long-term trends of the observed SAT in the historical period. In addition, all of the individual models present the same increasing trend in SAT in the historical period that continues to increase into the future. However, the simulation performances of MME and the five individual models are relatively poor for precipitation (Figure 8B) when compared to SAT. Besides, there is no obvious increase in precipitation over the Yangtze River basin in the future. As for the annual mean 12-month SPEI (Figure 8C), the MME also simulates well the historical temporal variations. However, influenced by a large deviation in simulated precipitation in 2018, the SPEI exhibited an obvious deviation compared to the observed results. For the future, the annual mean 12-month SPEI generally presents a slightly drying trend. For the MME, SAT will increase by 1.5°C (2.0°C) from approximately 2013 to 2023 (2045–2055) via the RCP4.5. Under the 1.5°C (2.0°C) warming target, a drought event (SPEI < −0.5) will happen once every two to three years, with historical (1999–2018) drought events occurring once every 4 years. As SAT continues to increase, more drought events will occur in the future. A moderate drought event (SPEI < −1.0) will occur once every 1.6 years in 2080–2099, and extreme droughts will occur (SPEI < −1.5) once every 6.7 years, neither of which occurred during the period 1999–2018.
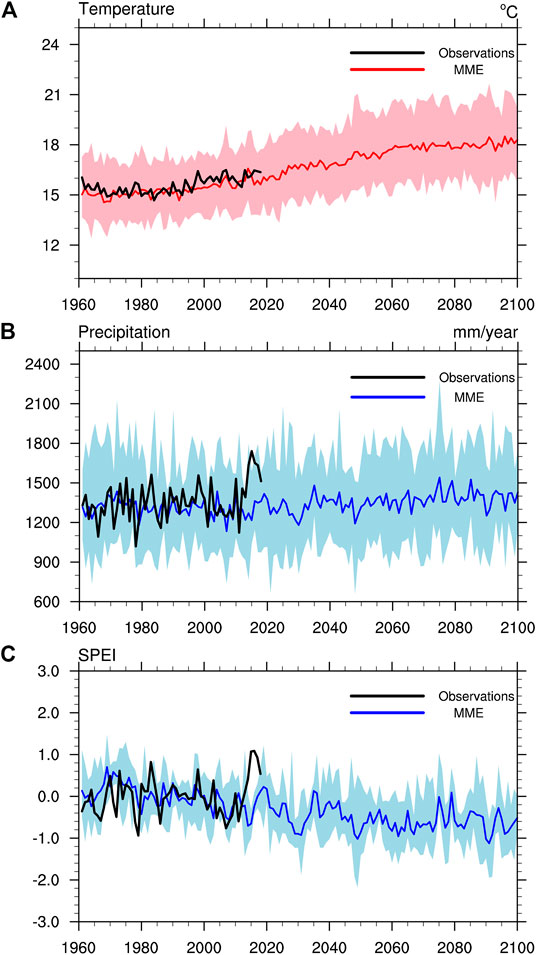
FIGURE 8. Time series of the annual (A) mean surface air temperature, (B) accumulated precipitation, (C) mean 12-month Standardized Precipitation Evapotranspiration Index over the Yangtze River basin during 1960–2100 under RCP4.5. Black lines indicate the observed results, and colored lines indicate the simulated multi-model ensemble mean. The shadings indicate the model spreads.
Figure 9 shows the spatial distribution of annual mean SAT, accumulated precipitation, and annual mean 12-month SPEI under different warming targets in comparison with the historical mean (1999–2018), and their differences (Figure 9). Under RCP4.5, for SAT, the Yangtze River basin generally displays a slightly (obvious) warming pattern under the 1.5°C (2.0°C) warming target. The additional 0.5°C warming will lead to an increase in spatially averaged SAT over the Yangtze River basin (Figure 9A). For precipitation, the Yangtze River basin will experience more precipitation than the period of 1999–2018 under both warming targets, and it will continue to increase due to the additional 0.5°C warming (Figure 9B). However, the spatial pattern of the SPEI will be unevenly distributed, with large discrepancies among the different models under the 1.5°C warming target (Figure 9C), whereas the drought events in the eastern Yangtze River basin will be intensified under the 2.0°C warming target. Further analyses indicate that the additional 0.5°C warming will result in drought conditions over the Yangtze River basin.
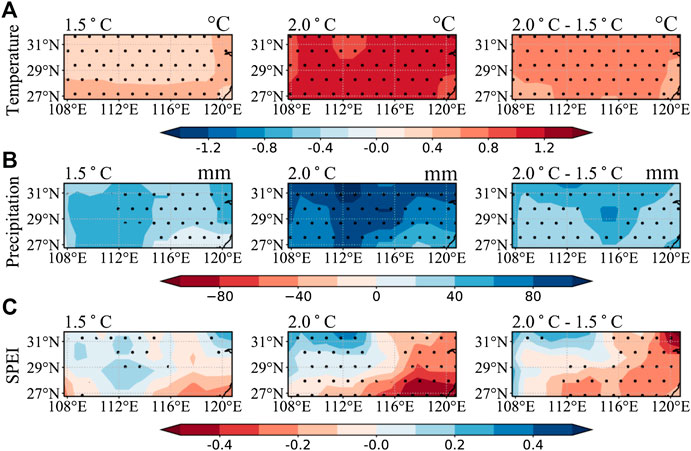
FIGURE 9. (A) Surface air temperature, (B) precipitation, (C) annual mean 12-month (SPEI) changes over the Yangtze River basin based on multi-model ensemble mean under RCP4.5 for the 1.5°C warming target (the left column) and 2.0°C warming target (the middle column), in comparison with the historical mean (1999–2018), and the differences between the 2.0 and 1.5°C warming (the right column). The dotted regions represent that more than three models are showing the same sign.
Based on the linear regression model and the logistic growth model between the annual mean 12-month SPEI and hydropower capacity, future hydropower capacity in Zhejiang Province is projected using the five chosen GCMs. Figure 10A shows the projection of hydropower capacity during the period 2020–2100 under RCP4.5 when only the meteorological conditions are considered. The hydropower capacity will reduce significantly compared to the historical period of 1999–2018 under drying conditions in the future. However, there are large discrepancies when considering the joint effect of the meteorological conditions and the development of hydropower stations (Figure 10B). Compared to Figure 10A, few differences can be observed before the 2040s in Figure 10B, except for the larger interannual variability, suggesting that the hydropower capacity relies primarily on the meteorological conditions. After the 2040s, the development of the hydroelectric system mainly modulates the hydropower capacity. In detail, the Yangtze River basin would be in a drying condition in the 2060s, while the hydropower output would reach roughly the average level during 1999–2018. When it comes to the end of the 21st century, the hydropower capacity is evidently above the average level and it is approximately twice that when only meteorological conditions are considered.
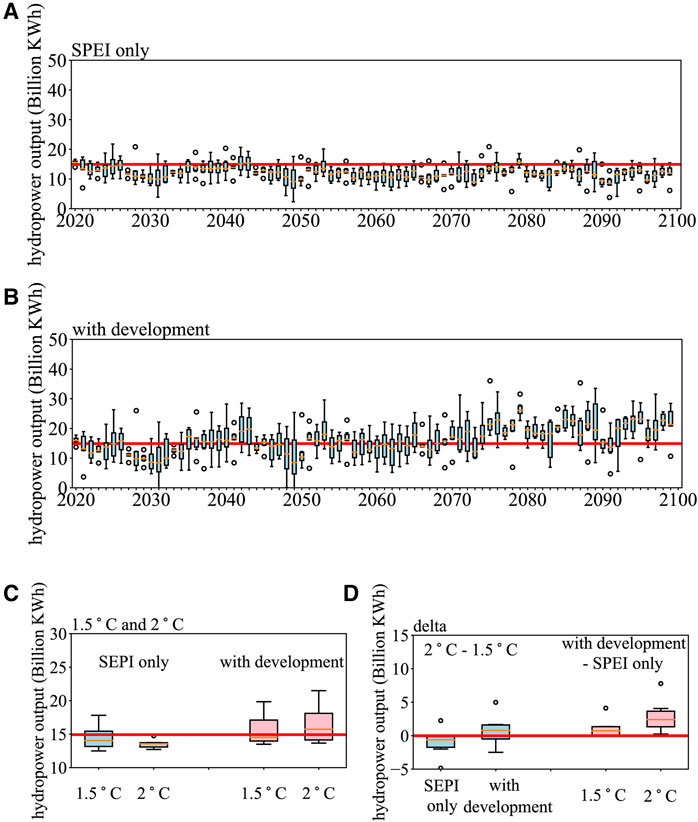
FIGURE 10. Projections of hydropower capacity in Zhejiang Province during 2020–2100 under RCP4.5 when (A) considering only the meteorological condition and (B) considering the joint effects of the meteorological condition and the development of the hydropower station. (C) Projections of hydropower capacity in Zhejiang Province under the 1.5 and 2°C warming target when only the meteorological conditions are considered (blue) and considering the joint effects of the meteorological condition and the development of the hydropower station (pink). (D) Differences between the 2 and 1.5°C warming target (blue) and the effects of considering the development of hydropower stations (pink). The red lines indicate the historical mean (1999–2018) of hydropower capacity in Zhejiang Province in (A–C) and indicate the zero lines in (D). Open circles indicate abnormal data, color rectangles denote the spread of the 25th and the 75th quartiles, and the short orange line represents the median condition.
Figure 10C shows the projection of hydropower capacity under the 1.5°C/2°C warming targets in two cases. When only the meteorological conditions are considered, the hydropower capacity will decrease by 0.34 (1.23) billion kWh under the 1.5°C (2°C) warming targets compared to the average level of 1999–2018. However, the hydropower capacity will increase by −0.28 and 1.11 billion kWh when the joint effects of meteorological conditions and the development of the hydropower stations are considered. Furthermore, Figure 10D shows the differences between the 1.5 and 2°C warming targets (blue) and when the effects of the development of the hydropower station are considered (pink). Concerning the additional 0.5°C warming, the hydropower capacity will reduce by 0.90 billion kWh when only the meteorological conditions are considered, but it will increase by 1.40 billion kWh when the development of the hydropower stations is also considered. Additionally, the development of hydropower stations will lead to an increase in hydropower capacity to 0.06 (2.34) billion kWh under the 1.5°C (2.0°C ) warming target compared to meteorological conditions alone. Consequently, both the meteorological conditions and the development of hydropower stations are essential in influencing the future hydropower capacity, but they may cause opposite effects in the future.
Discussion and Conclusion
Owing to the differences between multiple timescale droughts (Van Loon, 2015), it is important to choose a drought index with a suitable timescale that matches the scope of the investigation. For example, Tornros and Menzel (2014) found that the 6-month SPEI is the most appropriate to address vegetation growth in the semiarid region. However, the 12-month SPEI is highly correlated with water total storage in eastern China (Zhang et al., 2018) since the hydrological droughts develop slowly to store water (Dai, 2011), which supports our findings. For the hydropower capacity in the future, it will reduce over the United States (Bartos and Chester, 2015), Brazil (de Queiroz et al., 2019), and the Upper Danube basin (Koch et al., 2011), which is similar to the Yangtze River basin. By contrast, increasing hydropower capacities may occur over the Far North (Cherry et al., 2017) and the Lule River basin in Sweden (Graham et al., 2007) under climate change.
In addition to future projections under the 1.5°C/2.0°C warming targets, the hydropower capacities in the near future (2030–2049) and late in the 21st century (2080–2099) are discussed further (Supplementary Figure S1). The results suggest that hydropower capacity in Zhejiang Province will reduce by 2.29 (3.23) billion kWh during 2030–2049 (2080–2099) compared to the period 1999–2018 when only the meteorological conditions are considered (Supplementary Figures S2A,S2B). However, the hydropower capacity will increase by −0.73 (4.92) billion kWh during the period 2030–2049 (2080–2099) when the development of hydropower stations is also considered (Supplementary Figures S2C,S2D). These findings are generally consistent with the above results under different warming scenarios.
In addition, the spatial distribution of the annual SAT, precipitation, and 12-month SPEI under the RCP8.5 scenario are also investigated (Supplementary Figure S3) in comparison with the historical mean (1999–2018). The SAT under the 1.5°C/2.0°C warming targets for the RCP8.5 scenario resembles that of the RCP4.5 scenario, but that is not the case for precipitation. Precipitation under the RCP8.5 scenario presents an opposite pattern with RCP4.5 under the 1.5°C/2.0°C warming. Despite it, the additional 0.5°C warming yields more precipitation over the Yangtze River basin under both RCPs. Influenced by precipitation and SAT, the annual 12-month SPEI under the RCP8.5 scenario presents an overall drier pattern than the historical period under the 1.5°C/2.0°C warming scenarios, which are opposite to the RCP4.5 scenario under the 1.5°C warming. However, the additional 0.5°C warming would result in drier conditions over most regions of the Yangtze River basin under both RCPs. Based on the projected SPEI series, the projection of hydropower capacity under RCP8.5 in two cases is further investigated (Supplementary Figure S4). When only the meteorological conditions are considered, the hydropower capacity will decrease by 2.83 (5.16) billion kWh under the 1.5°C (2°C) warming targets compared to the average level during 1999–2018, which is much severe than that under the RCP4.5 scenario. Besides, the hydropower capacity will decrease by 1.78 and 3.33 billion kWh when the joint effects of meteorological conditions and the development of the hydropower stations are considered, respectively. Further analyses indicate that the additional 0.5°C warming will result in the hydropower capacity reducing by 2.33 billion kWh when only the meteorological conditions are considered, but it will decrease by 1.55 billion kWh when the development of the hydropower stations is also considered. The development of hydropower stations will lead to an increase in hydropower capacity to 0.05 (1.45) billion kWh under the 1.5°C (2.0°C) warming target compared to meteorological conditions alone. Based on the five chosen models, the 1.5°C (2.0°C) warming targets will occur in 2020 (2033) under the RCP8.5 scenario, which is much earlier than 2022 (2050) under the RCP4.5 scenario. Therefore, the development of the hydropower system for the RCP8.5 scenario is weaker under the 1.5°C (2.0°C) warming targets than that under the RCP4.5 scenario. Overall, the above results suggest that the meteorological conditions of the increased drought events might lead to less hydropower capacity in the future, while the development of the hydropower stations can alleviate the influence of warming, and it is determined by the year, reaching 1.5°C (2.0°C) warming target under different scenarios.
However, this study has several potential uncertainties and limitations. The major uncertainties are model deviations owing to the resolution of GCMs and the precipitation simulations. Also, different weights for different models can be applied in future studies. Besides, the growth rate of the hydroelectric system is vague because the hydropower capacity accounts for only 50% of the total usable power in Zhejiang Province, and the costs of electricity generation and electric energy will also limit the speed of hydroelectric development (Chang et al., 2010). These limitations deserve more attention and improvement in future studies.
In conclusion, this study investigated drought variation and its relationship with hydropower capacity over the Yangtze River basin and further projected their future changes based on different regression models under 1.5°C/2°C warming targets. Based on their interannual increment relationship, a linear regression model was constructed when only meteorological conditions were considered, and the development of the hydroelectric system was also considered by using a logistic growth model. The results indicate that drought events are negatively correlated with hydropower capacity, whereas the development of hydropower stations plays the opposite role. In the future, under RCP4.5, drought events are projected to occur every 2.7 (2.2) years in the Yangtze River basin under 1.5°C (2.0°C) warming scenarios, and they will be much more severe under the 2.0°C warming target. Influenced by the drying trend over the Yangtze River basin, the hydropower capacity would decrease by 0.34 (1.23) billion kWh under 1.5°C (2.0°C) warming targets. However, when using the logistic growth model, the hydropower capacity would increase by −0.28 (1.11) billion kWh under 1.5°C (2.0°C) warming targets. Consequently, the drought events in the Yangtze River basin would contribute to lower hydropower capacity in Zhejiang Province, and it is important to reduce additional warming to avoid severe drought events in the future.
Data Availability Statement
The raw data supporting the conclusions of this article will be made available by the authors, without undue reservation.
Author Contributions
HL contributed to the conception of the study. HL, YW, and BS contributed significantly to analysis and manuscript preparation; YW and YL performed the data analyses and wrote the manuscript; HC helped edit the manuscript. HL helped perform the analysis with constructive discussions.
Funding
This research was supported by the National Key R&D Program of China (2017YFA0603804 and 2016YFA0600703), the Major Program of the National Natural Science Foundation of China (41991283), and the Startup Foundation for Introducing Talent of NUIST and Innovation and Entrepreneurship Training Program of NUIST.
Conflict of Interest
The authors declare that the research was conducted in the absence of any commercial or financial relationships that could be construed as a potential conflict of interest.
Supplementary Material
The Supplementary Material for this article can be found online at: https://www.frontiersin.org/articles/10.3389/feart.2020.578132/full#supplementary-material.
References
Bartos, M. D., and Chester, M. V. (2015). Impacts of climate change on electric power supply in the Western United States. Nat. Clim. Change 5 (8), 748–752. doi:10.1038/nclimate2648
Cao, B., Zhang, B., Ma, B., Tang, M., Wang, G., Wu, Q., et al. (2018). Spatial and temporal characteristics analysis of drought based on SPEI in the middle and lower Yangtze basin. Acta Ecol. Sin. 38 (17), 6258–6267. doi:10.5846/stxb201707011185
Chang, X., Liu, X., and Zhou, W. (2010). Hydropower in China at present and its further development. Energy 35 (11), 4400–4406. doi:10.1016/j.energy.2009.06.051
Chen, H. P., and Sun, J. Q. (2015). Changes in drought characteristics over China using the standardized precipitation evapotranspiration index. J. Clim. 28 (13), 5430–5447. doi:10.1175/jcli-d-14-00707.1
Chen, T., Werf, G. R., Jeu, R. A. M., Wang, G., and Dolman, A. J. (2013). A global analysis of the impact of drought on net primary productivity. Hydrol. Earth Syst. Sci. 17 (10), 3885–3894. doi:10.5194/hess-17-3885-2013
Cherry, J. E., Knapp, C., Trainor, S., Ray, A. J., Tedesche, M., and Walker, S. (2017). Planning for climate change impacts on hydropower in the Far North. Hydrol. Earth Syst. Sci. 21 (1), 133–151. doi:10.5194/hess-21-133-2017
China National Bureau of Statistics (2019). Statistical yearbook of China. Beijing, China: China Statistics Press [in Chinese].
Clark, A. J., Lake, L. W., and Patzek, T. W. (2013). “Production forecasting with logistic growth models,” in SPE annual technical conference and exhibition Denver, Colorado, USA, 30 October–2 November 2011.
Dai, A. G. (2011). Drought under global warming: a review. WIREs Clim. Change 2 (1), 45–65. doi:10.1002/wcc.81
Dai, A. G. (2013). Increasing drought under global warming in observations and models. Nat. Clim. Change 3 (1), 52–58. doi:10.1038/nclimate1633
de Queiroz, A. R., Faria, V. A. D., Lima, L. M. M., and Lima, J. W. M. (2019). Hydropower revenues under the threat of climate change in Brazil. Renew. Energy 133, 873–882. doi:10.1016/j.renene.2018.10.050
Edenhofer, O., Madruga, R. P., Sokona, Y., III, Seyboth, K., Kadner, S., Zwickel, T., et al. (2012). Renewable energy sources and climate change mitigation. Cambridge: IPCC.
Fan, K., Liu, Y., and Chen, H. (2012). Improving the prediction of the east Asian summer monsoon: new approaches. Weather Forecast 27 (4), 1017–1030. doi:10.1175/waf-d-11-00092.1
Gao, T., Cao, F., Dan, L., Li, M., Gong, X., and Zhan, J. (2020). The precipitation variability of wet and dry season at the interannual and interdecadal scales over eastern China (1901–2016): the impacts of the Pacific Ocean. Hydrol. Earth Syst. Sci. (in review). doi:10.5194/hess-2020-102
Gao, X., Zhao, Q., Zhao, X., Wu, P., Pan, W., Gao, X., et al. (2017). Temporal and spatial evolution of the standardized precipitation evapotranspiration index (SPEI) in the Loess Plateau under climate change from 2001 to 2050. Sci. Total Environ. 595, 191–200. doi:10.1016/j.scitotenv.2017.03.226
Graham, L. P., Andréasson, J., and Carlsson, B. (2007). Assessing climate change impacts on hydrology from an ensemble of regional climate models, model scales and linking methods—a case study on the Lule River basin. Clim. Change 81 (S1), 293–307. doi:10.1007/s10584-006-9215-2
Hamududu, B., and Killingtveit, A. (2012). Assessing climate change impacts on global hydropower. Energies 5 (2), 305–322. doi:10.3390/en5020305
International Energy Agency. IEA (2012). Key world energy statistics 2017. Paris, France: International Energy Agency. doi:10.1787/key_energ_stat-2017-en
Knutti, R., and Sedláček, J. (2012). Robustness and uncertainties in the new CMIP5 climate model projections. Nat. Clim. Change 3 (4), 369–373. doi:10.1038/nclimate1716
Koch, F., Prasch, M., Bach, H., Mauser, W., Appel, F., and Weber, M. (2011). How will hydroelectric power generation develop under climate change scenarios? A case study in the lpper Danube basin. Energies 4 (10), 1508–1541. doi:10.3390/en4101508
Lehner, B., Czisch, G., and Vassolo, S. (2005). The impact of global change on the hydropower potential of Europe: a model-based analysis. Energy Policy 33 (7), 839–855. doi:10.1016/j.enpol.2003.10.018
Li, H., Chen, H., Sun, B., Wang, H., and Sun, J. (2020). A detectable anthropogenic shift toward intensified summer hot drought events over Northeastern China. Earth Space Sci. 7 (1), e2019EA000836. doi:10.1029/2019ea000836
Li, H., Chen, H., and Wang, H. (2017). Effects of anthropogenic activity emerging as intensified extreme precipitation over China. J. Geophys. Res. Atmos. 122 (13), 6899–6914. doi:10.1002/2016jd026251
Li, H., Chen, H., Wang, H., and Yu, E. (2018). Future precipitation changes over China under 1.5 °C and 2.0 °C global warming targets by using CORDEX regional climate models. Sci. Total Environ. 640–641, 543–554. doi:10.1016/j.scitotenv.2018.05.324
Li, X., He, B. B., Quan, X. W., Liao, Z. M., and Bai, X. J. (2015). Use of the standardized precipitation evapotranspiration index (SPEI) to characterize the drying trend in Southwest China from 1982-2012. Remote Sens. 7 (8), 10917–10937. doi:10.3390/rs70810917
Liu, J., Yuan, Z., Xu, J., Tian, C., and Miao, H. (2019). Meteorological drought evolution characteristics and future trends in the Yangtze river basin. J. Yangtze River Sci. Res. Inst. 172, 196–205 [in Chinese]. doi:10.11988/ckyyb.20190830
Liu, Z. P., Wang, Y. Q., Shao, M. G., Jia, X. X., and Li, X. L. (2016). Spatiotemporal analysis of multiscalar drought characteristics across the Loess Plateau of China. J. Hydrol. 534, 281–299. doi:10.1016/j.jhydrol.2016.01.003
Nicholls, N. (2004). The changing nature of Australian droughts. Clim. Change 63 (3), 323–336. doi:10.1023/b:clim.0000018515.46344.6d
Renato, C. Z., Mario, T. L. B., and William, W.-G. Y. (2016). “Impacts of the 2012–2015 drought on the Brazilian hydropower system,” in World environmental and water resources congress. (Reston, VA: ASCE)
Savelsberg, J., Schillinger, M., Schlecht, I., and Weigt, H. (2018). The impact of climate change on Swiss hydropower. Sustainability 10 (7), 2541. doi:10.3390/su10072541
Sheffield, J., Wood, E. F., and Roderick, M. L. (2012). Little change in global drought over the past 60 years. Nature 491 (7424), 435. doi:10.1038/nature11575
Solaun, K., and Cerdá, E. (2017). The impact of climate change on the generation of hydroelectric power-A case study in Southern Spain. Energies 10 (9), 1343. doi:10.3390/en10091343
Soloman, S., Qin, D. H., Manning, M., Alley, R. B., and Berntsen, T. (2007). “Working group I contribution to the IPCC fourth assessment report,” in Climate change 2007: the physical science basis. Cambridge, United Kingdom: Cambridge University Press, 61.
Sun, M., Jiang, T., Su, B., and Kundzewicz, Z. W. (2008). Seasonal precipitation changes in the wet season and their influence on flood/drought hazards in the Yangtze River Basin, China. Quat. Int. 186 (1), 12–21. doi:10.1016/j.quaint.2007.10.001
Sun, B., and Wang, H. (2014). Inter-decadal transition of the leading mode of inter-annual variability of summer rainfall in East China and its associated atmospheric water vapor transport. Clim. Dyn. 44 (9-10), 2703–2722. doi:10.1007/s00382-014-2251-0
Tao, H., Ligang, X., Hongxiang, F., and Keyuan, M. (2018). Temporal and spatial variation characteristics and the evolution trends of droughts in the Yangtze river basin. Res. Environ. Sci. 31 (10), 1677–1684. doi:10.13198/j.issn.1001-6929.2018.05.22
Taylor, K. E. (2001). Summarizing multiple aspects of model performance in a single diagram. J. Geophys. Res. 106 (D7), 7183–7192. doi:10.1029/2000jd900719
Thornthwaite, C. W. (1948). An approach toward a rational classification of climate. Geograph. Rev. 38 (1), 55–94. doi:10.2307/210739
Törnros, T., and Menzel, L. (2014). Addressing drought conditions under current and future climates in the Jordan River region. Hydrol. Earth Syst. Sci. 18 (1), 305–318. doi:10.5194/hess-18-305-2014
Touma, D., Ashfaq, M., Nayak, M. A., Kao, S.-C., and Diffenbaugh, N. S. (2015). A multi-model and multi-index evaluation of drought characteristics in the 21st century. J. Hydrol. 526, 196–207. doi:10.1016/j.jhydrol.2014.12.011
UNFCCC (2015). Adoption of the Paris agreement. I: proposal by the President (draft decision). Geneva, Switzerland: United Nations Office, s32.
U.S. Energy Information Administration (2011). International energy outlook. Washington, DC: U.S.D.O. Energy, 20585.
Van Loon, A. F. (2015). Hydrological drought explained. WIREs Water 2 (4), 359–392. doi:10.1002/wat2.1085
Vicente-Serrano, S. M., Beguería, S., and López-Moreno, J. I. (2010). A multiscalar drought index sensitive to global warming: the standardized precipitation evapotranspiration index. J. Clim. 23 (7), 1696–1718. doi:10.1175/2009jcli2909.1
Wang, B., Wu, R., and Fu, X. (2000). Pacific-East Asian teleconnection: how does ENSO affect East Asian climate? J. Clim. 13, 1517–1536. doi:10.1175/1520-0442(2000)013<1517:PEATHD>2.0.CO;2
Wang, G.-C., Zhang, Q., and Xu, J.-J. (2018). Introducing a drought index to a crop model can help to reduce the gap between the simulated and statistical yield. Atmos. Ocean Sci. Lett. 11 (4), 307–313. doi:10.1080/16742834.2018.1483695
Wang, W., Zhou, W., Ng, E. Y. Y., and Xu, Y. (2016). Urban heat islands in Hong Kong: statistical modeling and trend detection. Nat. Hazards 83 (2), 885–907. doi:10.1007/s11069-016-2353-6
Wu, B., Zhang, R., Wang, B., and D'Arrigo, R. (2009). On the association between spring Arctic sea ice concentration and Chinese summer rainfall. Geophys. Res. Lett. 36 (9). doi:10.1029/2009gl037299
Wu, J., and Gao, X. J. (2013). A gridded daily observation dataset over China region and comparison with the other datasets. Chinese J. Geophys. 56 (4), 1102–1111 [in Chinese]. doi:10.6038/cjg20130406
Wu, R., Hu, Z.-Z., and Kirtman, B. P. (2003). Evolution of ENSO-related rainfall anomalies in East Asia. J. Clim. 16 (22), 3742–3758. doi:10.1175/1520-0442(2003)016<3742:Eoerai>2.0.Co;2
Xu, Y., Gao, X., Shen, Y., Xu, C., Shi, Y., and Giorgi, F. (2009). A daily temperature dataset over China and its application in validating a RCM simulation. Adv. Atmos. Sci. 26 (4), 763–772. doi:10.1007/s00376-009-9029-z
Yang, Q., Ma, Z., and Xu, B. (2016). Modulation of monthly precipitation patterns over East China by the Pacific decadal oscillation. Clim. Change 144 (3), 405–417. doi:10.1007/s10584-016-1662-9
Yao, J., Xiao, L., Gou, M., Li, C., Lian, E., and Yang, S. (2018). Pacific decadal oscillation impact on East China precipitation and its imprint in new geological documents. Sci. China Earth Sci. 61 (4), 473–482. doi:10.1007/s11430-016-9146-2
Zhai, J., Su, B., Krysanova, V., Vetter, T., Gao, C., and Jiang, T. (2010). Spatial variation and trends in PDSI and SPI indices and their relation to streamflow in 10 large regions of China. J. Clim. 23 (3), 649–663. doi:10.1175/2009jcli2968.1
Zhang, R., Li, T., Wen, M., and Liu, L. (2014). Role of intraseasonal oscillation in asymmetric impacts of El Niño and La Niña on the rainfall over southern China in boreal winter. Clim. Dyn. 45 (3–4), 559–567. doi:10.1007/s00382-014-2207-4
Zhang, Y., Yu, Z., and Niu, H. (2018). Standardized precipitation evapotranspiration index is highly correlated with total water storage over China under future climate scenarios. Atmos. Environ. 194, 123–133. doi:10.1016/j.atmosenv.2018.09.028
Keywords: drought, hydropower capacity, Yangtze River basin, 1.5°C/2°C warming scenarios, interannual increment
Citation: Wang Y, Li H, Sun B, Chen H, Li H and Luo Y (2020) Drought Impacts on Hydropower Capacity Over the Yangtze River Basin and Their Future Projections under 1.5/2°C Warming Scenarios. Front. Earth Sci. 8:578132. doi: 10.3389/feart.2020.578132
Received: 30 June 2020; Accepted: 25 August 2020;
Published: 16 September 2020.
Edited by:
Lei Zhang, University of Colorado Boulder, United StatesReviewed by:
Maoqiu Jian, Sun Yat-sen University, ChinaAna Cristina Russo, University of Lisbon, Portugal
Copyright © 2020 Wang, Li, Sun, Chen, Li and Luo. This is an open-access article distributed under the terms of the Creative Commons Attribution License (CC BY). The use, distribution or reproduction in other forums is permitted, provided the original author(s) and the copyright owner(s) are credited and that the original publication in this journal is cited, in accordance with accepted academic practice. No use, distribution or reproduction is permitted which does not comply with these terms.
*Correspondence: Huixin Li, bGlodWl4aW5AbnVpc3QuZWR1LmNu, Bo Sun, c3VuYkBudWlzdC5lZHUuY24=