- 1Research Center for Geotechnology, Indonesian Institute of Sciences (LIPI), Bandung, Indonesia
- 2National Oceanography Centre, Southampton, Southampton, United Kingdom
- 3British Geological Survey, Kingsley Dunham Centre, Nottingham, United Kingdom
- 4Department of Earth Sciences, University College, London, United Kingdom
- 5Marine Geological Institute (P3GL), Indonesian Ministry of Energy and Mineral Resources, Bandung, Indonesia
- 6Department of Earth Sciences, University of Oxford, Oxford, United Kingdom
The flank failure and collapse of Anak Krakatau on December 22nd, 2018 triggered a destructive tsunami. Whether the prior activity of the volcano led to this collapse, or it was triggered by another means, remains a challenge to understand. This study seeks to investigate the recent volcano submarine mass-landslide deposit and emplacement processes, including the seafloor morphology of the flank collapse and the landslide deposit extent. Bathymetry and sparker seismic data were used during this study. Bathymetry data collected in August, 2019 shows the run-out area and the seafloor landslide deposit morphology. Bathymetry data acquired in May, 2017, is used as the base limit of the collapse to estimate the volume of the flank collapse. Comparisons between seismic data acquired in 2017 and 2019 provide an insight into the landslide emplacement processes, the deposit sequence, and structure below the seafloor. From these results we highlight two areas of the submarine-mass landslide deposit, one proximal to Anak Krakatau island (∼1.6 km) and one distal (∼1.4 km). The resulting analysis suggests that the submarine-mass landslide deposit might be produced by a frontally compressional, faulted, landslide, triggered by the critical stability slope, and due to the recent volcanic activity. Blocky seabed features clearly lie to the southwest of Anak Krakatau, and may represent the collapse blocks of the landslide. The seismic analysis of the data acquired in August, 2019 reveals that the blocky facies extends to ∼1.62 km in the width around Anak Krakatau, and the block thicknesses vary up to 70.4 m. The marine data provides a new insight into the landslide run out and extent, together with the landslide deposit morphology and structure that are not available from satellite imagery or subaerial surveys. We conclude that the landslide run out area southwest of the recent collapse, is ∼7.02 ± 0.21 km2.
Introduction
The SW flank of the volcanic island Anak Krakatau, Indonesia collapsed on December 22nd, 2018, after six months of volcanic activity. The collapse occurred at 20:55 WIB (UTC+7) and generated a tsunami that began impacting the coastline of the surrounding Sunda Strait from 21:27 local time (Grilli et al., 2019; Walter et al., 2019). According to the Indonesian National Disaster Management Authority, the tsunami caused 437 fatalities, 14,509 injuries, and significant destruction (BNPB, 2019). Seismometer records from the Indonesian Agency for Meteorology, Climatology and Geophysics (BMKG) show 1–2 min of a signal frequency thought to be attributed to the flank failure, followed by 5 min of high-frequency energy attributed to the flank failure (Walter et al., 2019).
Flank collapse volcanic landslides is considered to be among the largest-volume mass movements in the world (Moore et al., 1989; Masson et al., 2002; Le Friant et al., 2003). The collapses, if adjacent to water bodies, can generate destructive hazards including tsunamis, such as those of Montagne Pelee, Martinique, Lesser Antilles and Nisyros volcano, Greece (Keating, 2000; Tibaldi et al., 2008; Le Friant et al., 2003). For Anak Krakatau, this scenario was previously investigated by Giachetti et al. (2012), who modeled a tsunami resulting from the partial destabilization of the southwest volcanic flank.
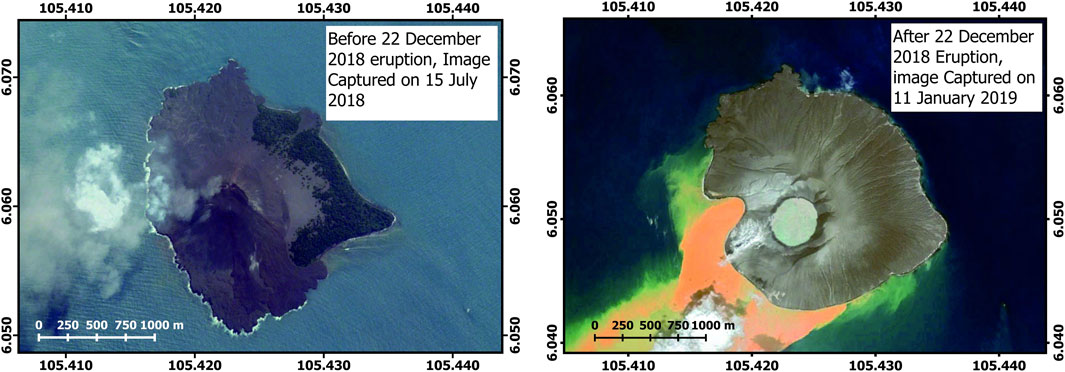
During the 2018 Anak Krakatau activity, a tsunami with run ups up to 13 m struck the coastal areas of Banten and Lampung (Figure 1) (Muhari et al., 2019; Putra et al., 2020). Tsunami modeling suggests a landslide from the SW volcanic flank can generate a far field tsunami with focused directions of run up (Grilli et al., 2019; Zengaffinen et al., 2020). This focusing results from the influence of the Krakatau islands. There is evidence of tsunami interaction with these islands, which are the 40 m run ups on southern Sertung, and 50 m on Rakata (Muhari et al., 2019; Heidarzadeh et al., 2020). Muhari et al., (2019) concluded that the short-period tsunami waves were caused by the landslide. Ye et al. (2020), confirmed a seismic magnitude of Mw 5.1 from seismic data. Walter et al. (2019), suggest from Synthetic Aperture Radar (SAR) satellite images, that the collapse from the SW volcanic flank is due to magma-tectonic processes. The SAR data shows that the present-day cone, and a significant part of the island, failed into the sea (Grilli et al., 2019; Walter et al., 2019; Williams et al., 2019; Perttu et al., 2020) (Figure 2).
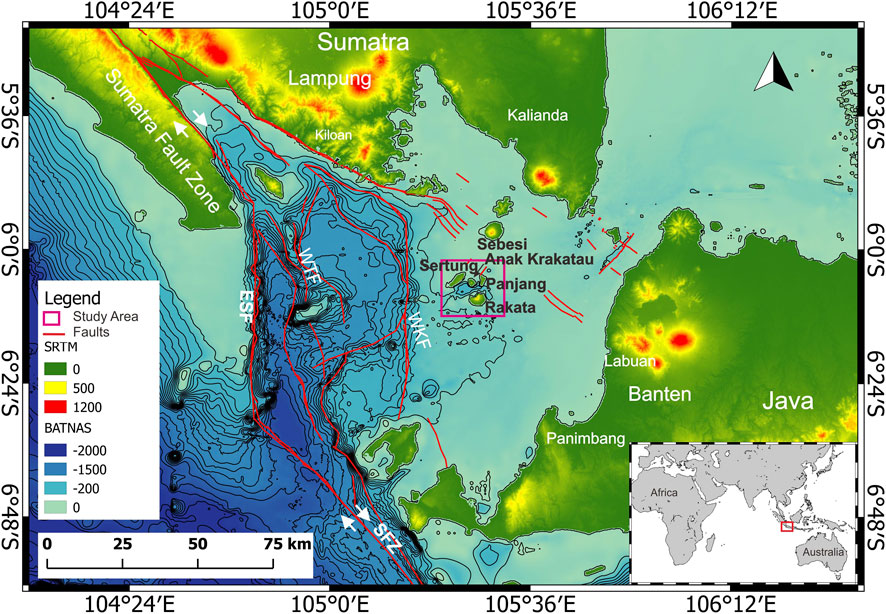
FIGURE 1. Bathymetric and DEM map of study area setting. Fault name abbreviations: ESF=East Tabuan Fault, WTF=West Tabuan Fault, WKF=West Krakatau Fault, SFZ=Sumatran Fault Zone (From BATNAS and DEMNAS, http://tides.big.go.id/DEMNAS/).
Previous studies of submarine mass-movements on volcanic islands discovered phenomena such as erosion, volcanic debris avalanche, overrunning volcanic debris flow, and down-slope propagating seafloor failures (Watt et al., 2012a; Watt et al. 2012b; Watt et al. 2014). Significant volcanic activity is known to precondition slope instability, or even to directly trigger precursory collapses (Moore et al., 1989; Watt et al., 2012a; Hunt and Jarvis 2017; Clare et al., 2018; Hunt et al., 2018). The role of these precursor and failure mechanisms in triggering the flank collapse of Anak Krakatau on December 22nd has been discussed in several studies (Grilli et al., 2019; Walter et al., 2019; Williams et al., 2019). The recent flank collapse and volcanic edifice deposit in the offshore of the December 22nd, 2018 AK flank collapse, however, has not yet been studied. Here, we investigate this collapse from pre and post-event deposits of December 22nd Anak Krakatau, based on pre and post-event submarine data. In order to study the collapse, we use bathymetry acquired in August, 2019 and May, 2017. Then, we compare seismic data acquired in 2019 with data from 2017. The main objectives of this study are addressed from the following questions. First, what is the nature of the landslide deposit, is it a blocky landslide, a debris flow, or somewhere in between? Secondly, if collapse blocks are present, what is their orientation? Thirdly, what does the interior structure of the blocks reveal about their transportation and deformation history? We explore the acoustic heterogeneity and reflection pattern from seismic profiles to trace the structure within the landslide deposit and seafloor morphology onto which it was emplaced. Moreover, we look into how the landslide (and the blocks in particular) interacted with the seafloor during transport. Finally, we outline the nature of the landslide deposit, the run out onto the seafloor, quantify an approximate landslide volume and the landslide emplacement processes. The study has implications for global volcanic island hazard assessments in the future, and also for the validation of tsunami modeling that can be applied to other scenarios to develop or test mitigation strategies.
Geological Background
Anak Krakatau lies in the Sunda Straits, between Java and Sumatra, Indonesia. It is in the transitional zone between frontal subduction of Indo-Australian plate beneath Java and oblique subduction beneath Sumatra (Hamilton, 1979; Huchon and Pichon, 1984; Malod et al., 1995; Susilohadi et al., 2009). It is located in a volcanic complex at N20°E, which extends from Mt. Rajabasa to Panaitan Island, and includes the Krakatau Islands (Harjono et al., 1991; Deplus et al., 1995). The magmatic activity at Anak Krakatau is hypothesized to be controlled by the activation of a NW–SE trending fault system (Susilohadi et al., 2009). History tells us that it is one the most active volcanoes in the world, with numerous eruptions and landslides over the last century (Zen, 1970; Deplus et al., 1995; Jaxybulatov et al., 2011; Giachetti et al., 2012). The most notable eruption was the 1883 explosive, caldera-forming, event, which led to a destructive tsunami killing 36,000 people (Auker et al., 2013). During its evolution, Anak Krakatau experienced periods of strong activity with notable eruptions in 1883, 1929, 2007, 2008 and 2018 (Self and Rampino, 1981; Agustan et al., 2012; Grilli et al., 2019).
Deplus et al. (1995) proposed two models for past caldera collapse at Krakatau (e.g. 1883). Firstly, by the propagation of pyroclastic flows from gravitational collapse of the eruption column, followed by unroofing of the magma chamber, which triggered a tsunami when the pyroclastic flows entered the sea. Secondly, from debris flows oriented toward the intersection of prehistoric caldera, located in northwest Rakata, with a, giant, landslide generating the major tsunami. On the other hand, based on tomography imaging, the shallow and deep magma melt lenses below Anak Krakatau are suggested as residing at several levels within the crust (Jaxybulatov et al., 2011).
Materials and Methods
In August 2019, a collaboration between the Indonesian Institute of Sciences, the Marine Geological Research and Development Centre, the National Oceanography Centre, Southampton, and the British Geological Survey completed a marine survey of Anak Krakatau. The survey utilized single-channel seismic and multibeam bathymetry in order to image the marine subsurface conditions of Anak Krakatau after the catastrophe. We use seismic and single beam bathymetry data acquired in May 2017 to interpret the pre-2018 event seafloor condition and investigate the dynamic change in between years. A further consideration is the changes during the six month time interval between the 2018 collapse and the acquisition of the seismic data in 2019, which we cannot take into account with our data set.
The bathymetry data from the 2019 survey had a 5 m grid over a total area of around 39.5 km2. Teledyne Reson T20-P multibeam echosounder (10–160° swaths) and R2Sonic 2026 bottom detection range finder (6 mm resolution) were used to image the seafloor of the basins to the SW and NE of Anak Krakatau volcano. The survey utilized single-channel seismic to image the subseabed characteristics of the landslide deposits. To minimize the effects of heave, a Teledyne TSS-DMS 05 was installed on the multibeam echosounder transducers. Navigation was recorded from a Trimble SPS 462 GPS and data logger in a Hydropro data format. Trackline artefacts were removed or smoothed in CARIS software and tidally corrected. The bathymetry data acquired in 2017 is single beam with frequency 50/77/200 kHz CHIRP resulted in a 25 m grid. These bathymetry data were tidally corrected using the Matlab script tide which is reduce the tidal effect up to ±5 m. Then the bathymetry data analyzed using Oasis montaj, ArcGIS and Qgis software. To calculate the total approximate volume of the post collapsed blocks, we estimated the difference between the two bathymetry data.
We utilized sparker seismic reflection profiles from 2017, and sparker seismic data acquired in 2019, 6°months after the catastrophe. The 2019 seismic acquisition used a sparker fired at a 500°millisecond rate with 250°millisecond sweep rate and 1200°KVA power generator as the source. The receiver sensor was a 24 m length hydrophone with a frequency range 300–10,000 Hz, connected to Khron Hite bandpass filter (30–3,000 Hz). The record length was 500°millisecond, 375°m, converted to depth using a seawater velocity of 1500 m/s. Data from 2017 has a 360°millisecond record length, around 260°m in depth, with the other parameters the same as those of August, 2019. The vertical resolution of the seismic profiles is about 4–6°m, and the lateral resolution is about 2°m, with the speed of the boat maintained at 4°knots. The seismic profiles were processed and plotted using Seismic Unix.
The raw seismic data includes artefacts such as noise and short-long multiples. To increase the signal-to-noise ratio, and avoid misinterpretation, advanced processing was necessary. First observations of the raw seismic data indicate seawater and swell noise (Figure 3A). We applied a bandpass filter to reduce this noise by the design and application of a boxcar filter (180, 200, 1800 and 2000 Hz). We analyzed the amplitude spectrum distribution in order to design the bandpass filter (Figure 3B). A spherical divergence correction was applied to reduce the spherical Earth effect. Another process, predictive deconvolution, was applied to decrease reverberation (Figure 3C). To calculate the depth conversion, we refer to the study of P-wave velocity measurement in materials deposit in the Nankai trough, which gives a range of the natural compressional wave velocity about 1,600–2000°m/s (Schumann et al., 2014). If we use this range of the natural P-wave velocity, this would affect the resultant thickness by nearly 10% (Deplus et al., 2001). Here, our study assumed P-wave velocity of 1760 km/s, based on the average deposit velocity of unconsolidated sand deposits from the Ritter volcanic Island (Karstens et al., 2019). A further consideration is that the landslide blocks from Anak Krakatau are coherent masses of interbedded basalts, which have higher P-wave velocities.
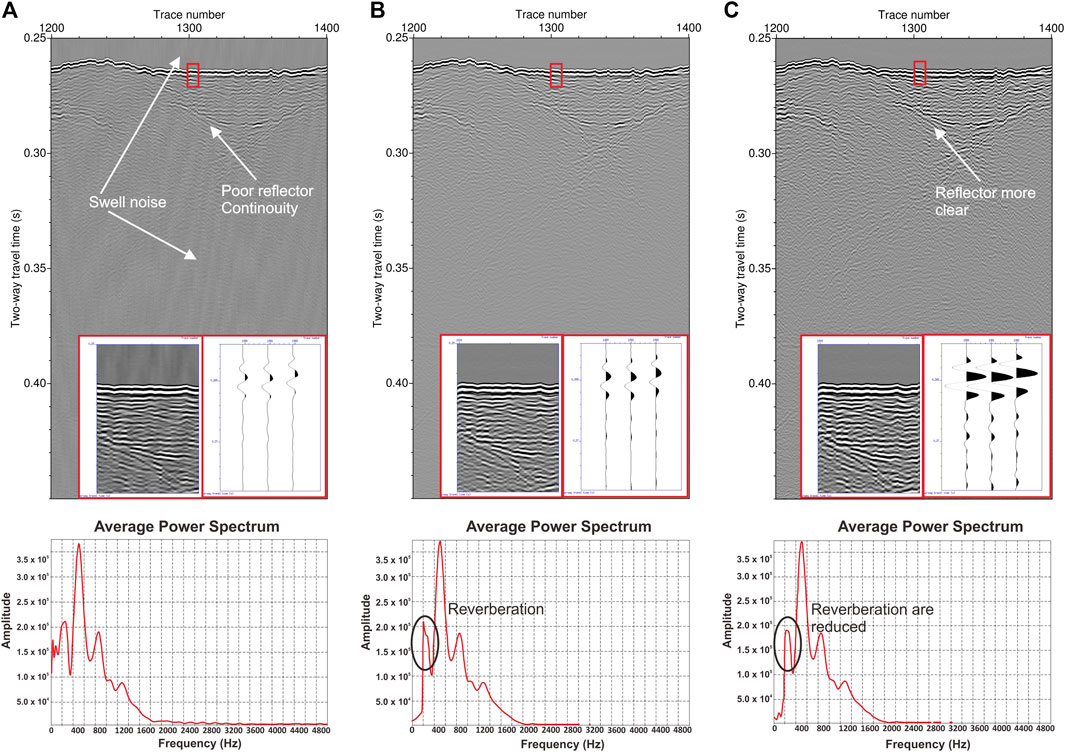
FIGURE 3. Seismic Processing section from Profile SKC-05A 2019. (A) Raw data with spectrum amplitude. (B) Data applied bandpass filter with window 180, 200, 1800, and 2000 Hz. (C) Deconvolution and spherical divergence applied.
Results
Bathymetry
The bathymetry acquired in 2017 is much lower resolution (25°m) than that from 2019 (5°m), but it does show the broad seafloor morphology before the collapse. There is a deep caldera southwest of Anak Krakatau (Figure 4A), and a steep seafloor slope close to the island where it changes from zero at the coast, to 250 m depths within a 750 m lateral distance. The high resolution bathymetry from 2019, shows a much more detailed morphology of the flank collapse deposits to the southwest of Anak Krakatau (Figure 4B). The rough surfaces that make up the submarine volcanic debris-avalanche deposits are clearly different from the surrounding smoother-surfaced seafloor, as seen in the southern Lesser Antilles and western Canary Islands (Deplus et al., 2001; Masson et al., 2002; Watt et al., 2014). The extent of the submarine-mass landslide deposit, from the margin of the rough seafloor bathymetry (white dotted line on Figures 4C,D), is approximately 1.5 km southwest of Anak Krakatau. The area of the submarine-mass landslide deposit, or blocky facies in the southwest region, is approximately 7.02 ± 0.21 km2 (shown by a red dotted line in Figure 4C). We quantify the volume and distribution of flank collapse by calculating the difference between the two bathymetry data sets, which resulted in an approximate total volume of the flank collapse of about 0.298 ± 0.04 km3 and has been distributed arbitrarily on the southwest of Anak Krakatau, indicated by the black to white color scale (Figure 4E). This estimate, however, does not include sedimentation between 2017 and the collapse of December 2019, the erosion of material via the flank collapse, and sedimentation during the subsequent post-collapse period of enhanced volcanism; all factors that would reduce this estimate.
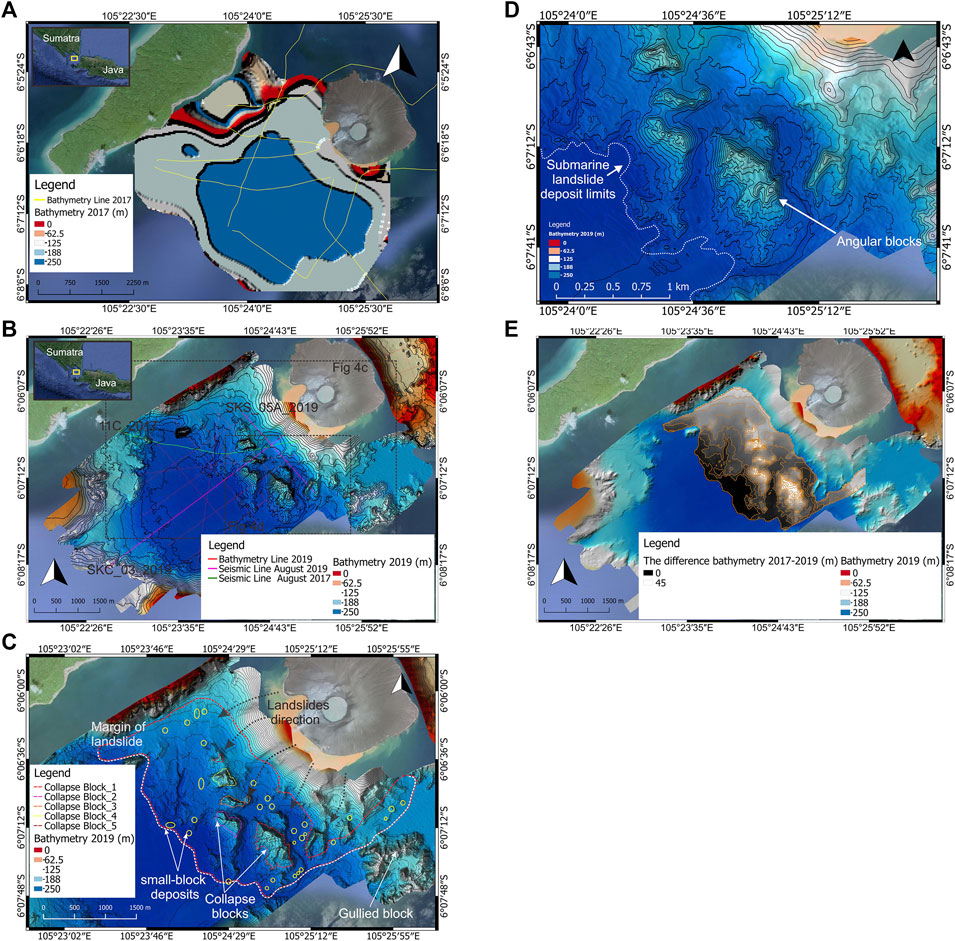
FIGURE 4. Bathymetry map shows the collapse block result from 22nd December 2018 AK eruption. (A) Single-beam bathymetry maps acquired in 2017. (B) Multi-beam bathymetry maps acquired in 2019. (C) Bathymetry maps 2019 with interpretation of seafloor morphology post-event of the flank collapse (The white-striped line interpreted margin of the collapse, the red-striped line is the estimation of the coverage area of the landslide, the yellow-rounded considered as small-blocks deposit). (D) Bathymetry maps 2019 with blow up the limit of the landslide. (E) The volume area resulted from the subtraction between bathymetry acquired in 2019 and acquired in 2017.
On the 2019 data, there is a difference in thickness between the large blocky region close to Anak Krakatau, and the more distal, smooth-surface region. The large blocky features are interpreted as collapse blocks from the volcano. There are at least five large blocks which are hundreds of meters in size and dimensions (Table 1). The low-resolution of 2017 bathymetry data allowed us to only estimate each block's geometry in terms of height, weight, and length but not the volume. In addition, there are not only the large blocks, but also with other materials, such as boulder-sized and disaggregated small fragments (Figure 4C). Submarine channels define the outer margins of the landslide deposit where density currents bypass the landslide deposits and flow into the deeper basin floor. The gully features in the bathymetry are difficult to trace due to the subsequent volcanism and mass wasting from the volcanic edifice.

TABLE 1. The large collapse blocks’ dimension as a result of December, 22nd 2020 Anak Krakatau event.
Sparker Seismic Reflection 2017 and 2019 Profiles
On seismic profiles from 2017 there is a featureless seafloor with a depositional sequence highlighted by the contrast of the high amplitude reflections between the different layers (Figure 5B). At least three parallel layers are discerned, based on the contrast amplitudes of the reflectors (Figure 5A). The uppermost sediment layer has thickness of about 15°milliseconds (two-way travel time), which approximates to 13.2 m. The underlying second and third layers, have thicknesses of up to 20 and 17°milliseconds or 17.6 and 14.9 m. The basal reflector is clearly defined, and is approximately 50°milliseconds, or 44°m, below the seafloor surface. The profile also shows an undulation reflector near Sertung Island, away from the coast of Anak Krakatau (Figure 5A). This undulation is hard to interpret but could be an intrusion or a collapsed block.
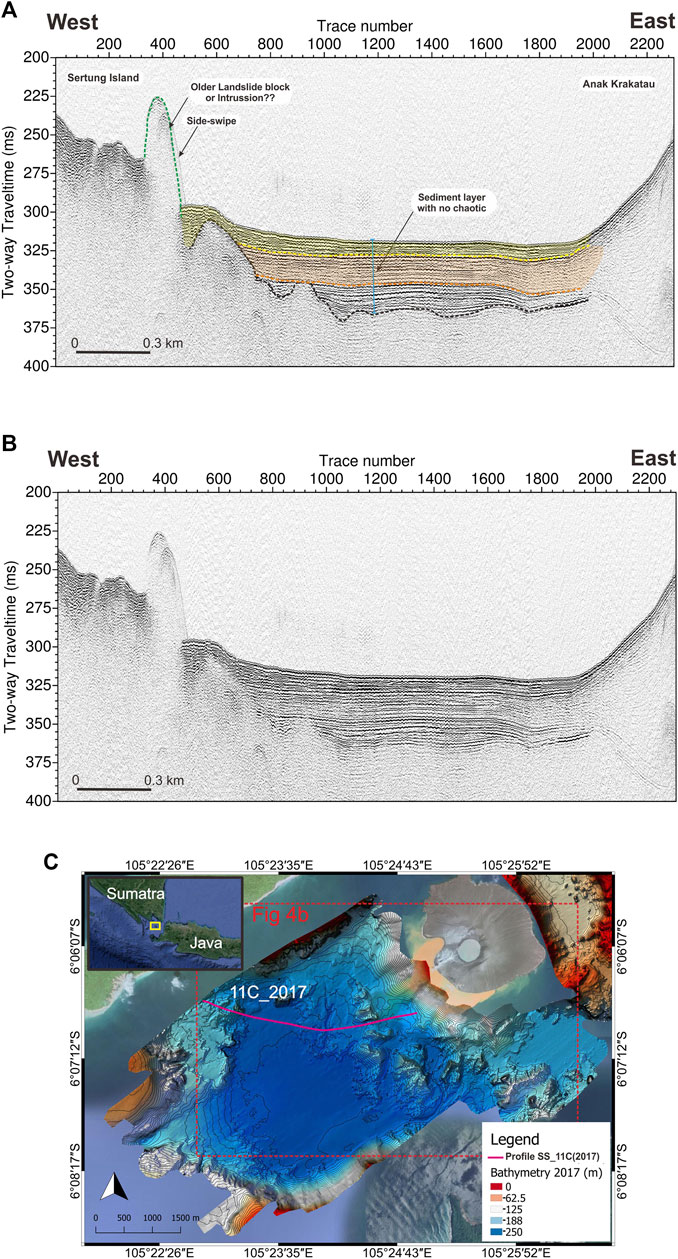
FIGURE 5. Seismic Profile SS_11C (2017 Data) with 3:1 exaggeration (The black striped line is basement, yellow striped line is consider as young deposit, meanwhile pink and sky light-brown striped line are older deposit). (A) Interpreted of the Seismic Profile SS_11C. (B) Un interpreted of Seismic Profile SS_11C. (C) The Seismic Profile SS_11C location.
The 2019 seismic data contrast markedly with the seismic from 2017 (Figure 6). There is the blocky facies seen on the bathymetry, a variation in layer thickness in the subsurface, backfill sediment, compressional faults, and base of the older stratigraphy. Because of the 6°months time interval between the collapse and the acquisition of the seismic data, there are changes that we cannot account for with our data set. From seismic line SKC_03, we identify a sequence of deposits resulting from the flank collapse of December 22nd, 2018 (Figure 6). As a consequence of the emplacement process, the submarine-mass landslide deposit comprises two areas; a proximal one located close to Anak Krakatau and a more distal one (Figure 6A). The proximal versus distal areas were defined from the internal reflection characteristics of chaotic, disturbed, undisturbed, or well-layered seismic reflections (Brunet et al., 2016). The proximal area is correlated to the collapse of the volcanic blocks and hummocky surface morphology that incise the seafloor (Watt et al., 2012b). This area is characterized by chaotic reflections that are disrupted, discontinuous and low amplitude. The distal area is associated with the deposition far away from the center which appears in single landslide deposit in seismic profile (Watt et al., 2012a). This area display well-layered reflections of high-amplitude, which are continuous and parallel.
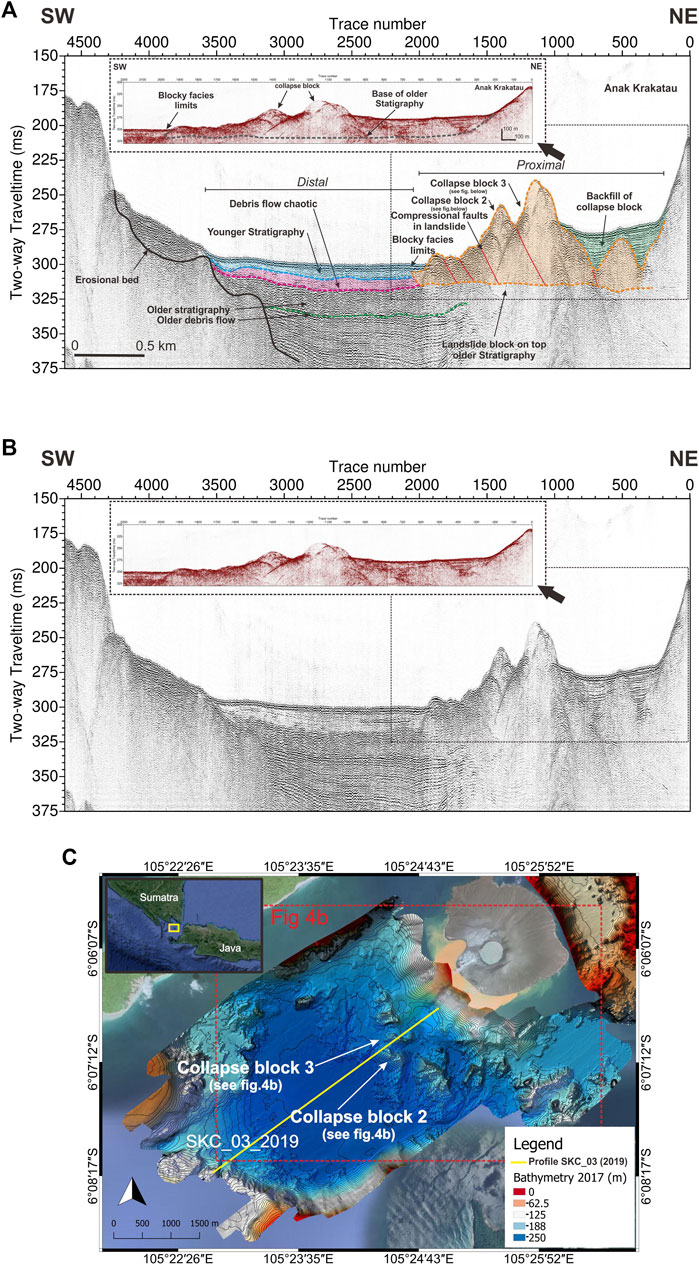
FIGURE 6. Seismic Profile SKC-03 (2019 Data) with 5:1 exaggeration (The light-brown striped line is consider as basal collapse block). (A) Interpreted of the Seismic Profile SKC-03. (B) Un interpreted of Seismic Profile SKC-03. (C) The Seismic Profile SKC-03 location.
The Proximal Area
The proximal area is characterized by the collapse blocks, infilled with backfilled deposits (Figures 6A, 7A). The lateral extent of the proximal units is ∼1.6 km. In general, the internal seismic reflections of the proximal units show a chaotic and disturbed seismic amplitude. In the profile SKC_03, the proximal units closest to the coast, comprise a backfilled deposit, which overlies a blocky seabed, that we interpret as landslide blocks and debris avalanche deposits above the base of older stratigraphy (Figure 6A). The backfilled deposits are up to 32°milliseconds (two-way travel times) or ∼28.1 m in thickness. The base of the collapse blocks on the seismic profile is difficult to identify as the base of older stratigraphy, due to the low resolution of the seismic at this depth. The bottom limit of collapse blocks is recognized from the semi-flat seismic reflectors, from which we estimate a thickness of about 80 millisecond, or around 70.4 m (Figure 6A). Additionally, the collapse blocks on the seismic profile are similar to the collapse blocks 2 and 3 identified on the bathymetry (Figure 4C). The blocky facies extent almost 1.62 km along seismic profile SKC_03 (Figure 6A). The seismic reflections also show several diffractions from point-source reflectors with sharp edges, which identify the hanging wall and footwall of the collapse blocks. The hanging wall position is lower relative to the footwall, and indicates the faults to be compressional.
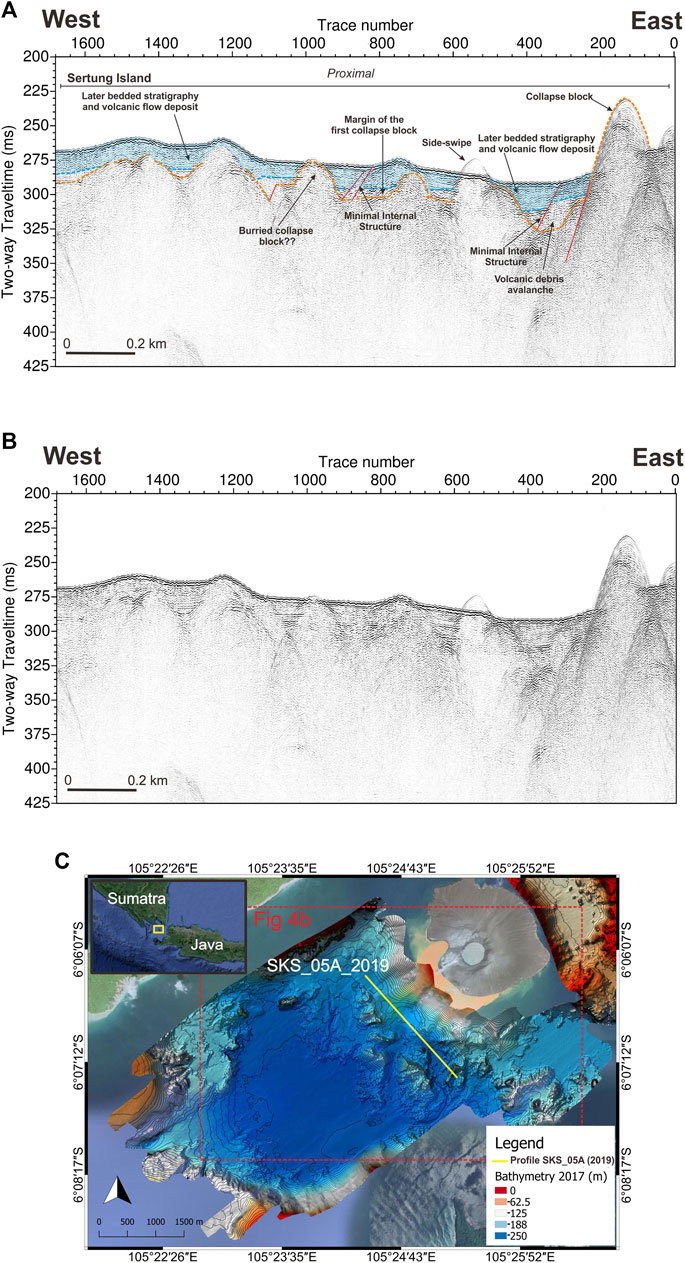
FIGURE 7. Seismic Profile SKS-05A (2019 Data) with 2:1 exaggeration (The light-brown striped line is consider as basal collapse block). (A) Interpreted of the Seismic Profile SKC-03. (B) Uninterpreted of Seismic Profile SKC-03. (C) The Seismic Profile SKC-03 location.
Seismic SKS-05A profile crosses the proximal unit and is characterized by an irregular top reflection and minimal internal structure (Figure 7A). The irregular top shows a very rough seafloor comprising numerous small blocks, which are interpreted as the remnants of Anak Krakatau’s volcanic edifice. The blocky features on the seafloor are partly buried by the overlying deposits (Figure 7A). The lateral spread of the proximal area varies from east to west, and has an average thickness of 18°millisecond, or about 15.8 m. The large block 1 is centered in the eastern part of the profile, while the western part is filled by well-bedded and smaller-blocky features. There is a side-swipe (ghost echo), which is due to the rough seafloor (Figure 7A).
The Distal Area
The distal units extend from the southwest limit of the landslide block area to the very rough edge of the preexisting caldera basin in the south west. The lateral extent of the distal units is nearly 1.4 km. On seismic profile SKC_03 (Figure 6A) reflections in the distal unit are continuous and well-layered reflections. The flank collapse deposit does not fully reach to the limit of the distal unit, except on some lines the underlying sediment is a deformed package rather than debris flow, which may have failed in situ as seen in Montserrat, Lesser Antilles (Watt et al., 2012b; Watt et al., 2014). The thickness of the lower, well-layered debris flow is up to 16°millisecond (two-way travel times) or 14.1°m, while the overlying, younger deposit thickness is up to 15°millisecond or around 13.2 m. The younger deposit displays sub-parallel bedding, with high amplitude reflectors, with the absence of volcanic blocks or specific structures, indicating that it was deposited as a turbidity current. The underlying units (green dotted lines on Figure 6A), are deeper, buried, debris flows, which are probably from older collapses. A sketch of the distal and proximal units is summarized in Figure 8.
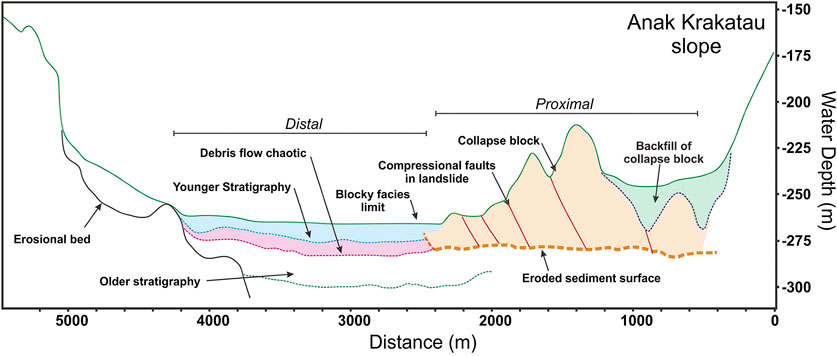
FIGURE 8. Interpretations model of seismic Profile SKC-03 distance vs. depth (m) shows the collapse blocks and eroded sediment layers during 22nd December 2018 Anak Krakatau Event (The depth conversion using constant velocity of 1760 km/s).
Discussion
From Grilli et al. (2019) and Walter et al. (2019), the flank collapse of December 22nd resulted from 6 months of slope destabilization before eventual failure. In this paper, we show the products of the flank collapse from hydroacoustic data. The interpretation of seismic profile SKC_03 is a blocky facies seabed above an older stratigraphy, showing that the volcanic edifice was partly disaggregated when it entered the sea (Figure 8). From the bathymetry data acquired in August, 2019 we see large blocks and boulders in the southwest of Anak Krakatau, not present in the 2017 bathymetry, while on the subaerial imagery there is also a significant change in the morphology of Anak Krakatau (Grilli et al., 2019; Walter et al., 2019; Williams et al., 2019; Perttu et al., 2020).
Previous investigations suggest two possible failure mechanisms to account for the collapse of Anak Krakatau (Grilli et al., 2019; Walter et al., 2019; Williams et al., 2019). Firstly, a multi-stage collapse of the volcanic flank, with the products distributed on the southwest of Anak Krakatau. This scenario was suggested by Williams et al. (2019) who concluded that the cone of Anak Krakatau was not removed during the flank collapse, but during subsequent volcanic activity. Their study proposed a submarine failure at around 9°pm local time (UTC+7) with a collapse volume of ∼0.1 km3 that generated the tsunami, with later smaller edifice collapse following, with volume of 0.004 km3. The problem with this interpretation is that, from the numerical modeling of Grilli et al. (2019), even if combined, these volumes are too small to explain the recorded Tsunami.
The second failure mechanism proposed is that the flank collapse was one event, with a larger volume than proposed by Williams et al. (2019) (Grilli et al., 2019; Zengaffinen et al., 2020). The failure mechanism in this instance may have resulted from the steep gradient of the southwest Anak Krakatau slope, and the growth of significant lava flows in this region. Giachetti et al. (2012) simulated a failure mechanism of Anak Krakatau in 2012 with a volume of 0.28°km3, which is similar to our approximate estimation of the 2018 event. Grilli et al. (2019) used numerical modeling to show that a single main failure was sufficiently rapid to generate the tsunami. Paris et al. (2020), presents a preliminary model of the volcanic collapse based on coupled granular rheology and coulomb friction. In addition, Zengaffinen et al. (2020), modeled the Anak Krakatau flank collapse using a depth-averaged visco-plastic with BingClaw landslide model. From this, the authors were able to reproduce the tsunami elevation amplitudes recorded in the field surveys. Both Paris et al. (2020), and Zengaffinen et al. (2020) conclude that the uncertainty in their models results from the effects of sea currents and the (unknown) seafloor surface in their models, that is required before a final failure mechanism can be identified.
Our approximate volume results, from submarine data, shows a larger than expected volume involved in the flank collapse (0.298 ± 0.04 km3), compared to William et al., (2019), who proposed ∼0.1 km3 which is less than half that of Grilli et al. (2019). Whether the emplacement of the flank collapse deposit occurred as single or multi-stage process remains a question, considering the aspect related to resolution and sedimentation between 2017 and 2019, the erosion due to 2018 collapse and the deposition of volcanic tephra as a result of the intense volcanism that followed the collapse. Due to a low resolution in bathymetry data acquired in 2017, the aspect cannot be addressed any further to estimate the flank collapse's total minimum volume. However, it allows us to calculate the approximate maximum volume of the flank collapse. In this study, we show that the emplacement of the flank collapse, produced disaggregated blocks that display internal dipping faults caused by compressional forces resulting from failure (Figure 8). As a result of failure, and as shown in the bathymetry and seismic (Figures 4, 6), the flank collapse is distributed into several blocks and boulders with various dimensions. The distribution of the blocky facies covers an area of about 7.02 ± 0.21 km2. Finally, the backfill sediment deposited on top of the collapse blocks has a variable thickness.
Conclusion
We present bathymetry and seismic data acquired 6°months after the 2018 Anak Krakatau eruption. The evidence of the flank collapse is found within two areas of the submarine-mass landslide deposits, which we separate into proximal and distal regions. Our submarine-mass landslide deposit analysis suggests that it is typical of a frontally compressional faulted landslide, triggered by critical instability due to the ongoing volcanic activity. The margins of the landslide are recognized by a smooth-seabed surfaced area interpreted as a debris flow resulting from the emplacement of a volcanic debris avalanche. From analysis of the seismic profiles, we conclude that the blocky facies extent is nearly 1.6 km and the thickness of the blocks are up 70 m. The blocky features southwest of Anak Krakatau are recognized as collapse blocks from the 2018 flank failure. The flank collapse itself is fan-shaped and its distribution is southwest of Anak Krakatau, with a surface coverage of about 7.02 ± 0.21 km2. From a comparison of before and after bathymetry, this study finds the volume of the collapsed mass to be 0.298 ± 0.04 km3. However, this volume should be considered a maximum, as it does not allow for sedimentation in the landslide area between 2017 and data acquisition in 2019, the erosion of material from the flank collapse, and sediments deposited during the post 2018 collapse period of enhanced volcanism before the 2019 data were acquired; all factors that would reduce it. Our discussion has developed two scenarios for the mechanism of this the tsunami, with the most likely that the main phase of failure caused critical instability of the slope, which culminated in a frontally compressional fault landslide. This scenario agrees with the study of Grilli et al. (2019) in that our flank collapse volume is sufficient to generate the recorded Tsunami.
Data Availability Statement
The original contributions presented in the study are included in the article/Supplementary Material, further inquiries can be directed to the corresponding author.
Author Contributions
All the authors contributed to Anak Krakatau–Tsunami research project. WP mainly drafted the manuscript and did the 2019 seismic data processing also plotted the bathymetry. JH and DT led the 2019 field study at Anak Krakatau and helped with the substance of the manuscript. SS and HP provided the 2017 data with the interpretation and help in the substance of the manuscript regarding the 2017 data. MC helped to edit the structure and substance of the manuscript, relating to the precursor volcanic processes. MH contributed to the substance and drafting. EY helped to provide permission for the project and provided some reference in substance. DT publishes with the permission of the CEO of the British Geological Survey United Kingdom Research and Innovation.
Funding
This study was outcome of the collaboration between Indonesian Institute of Sciences, Marine Geological Institute, and British Geological Survey in 2018 which was supported by National Environmental Research Council funded Urgency Grant to study the failure and emplacement dynamics of the December 22nd, 2018 Anak Krakatau landslide-tsunami (NE/T002034/1). This NERC grant was funded and supported by the National Oceanography Centre, Southampton, and the British Geological Survey through a NERC-NSFGEO Grant (NE/S003509/1).
Conflict of Interest
The authors declare that the research was conducted in the absence of any commercial or financial relationships that could be construed as a potential conflict of interest.
Acknowledgments
We would like to thank to all members of Anak Krakatau–Tsunami project team. The authors would like to acknowledge the funding to British Geological Survey in 2018 which supported by National Environmental Research Council. The authors would say sincerely gratitude to James Hunt as the leading of Anak Krakatau Project 2019 and made the data available for this study. The authors would say sincerely gratitude to Prof. Dave Tappin who guiding through Anak Krakatau Project and supported this study. The authors would also like to thank: Professor Wahyoe Hantoro who led the 2017 seismic survey. We want to thank to the OC Enviro Crew which help us during the data acquisition. The publication of this research is supported by the funding scheme under the Deputy of Earth Sciences of Indonesian Institute of Science (LIPI) and the Coral Reef Rehabilitation and Management Program (COREMAP-CTI).
Supplementary Material
The Supplementary Material for this article can be found online at: https://www.frontiersin.org/articles/10.3389/feart.2020.577448/full#supplementary-material
References
Agustan, K. F., Pamitro, Y. E., and Abidin, H. Z. (2012). Understanding the 2007–2008 eruption of Anak Krakatau Volcano by combining remote sensing technique and seismic data. Int. J. Appl. Earth Obs. Geoinf. 14, 73–82. doi:10.1016/j.jag.2011.08.011
Auker, M. R., Sparks, R. S. J., Siebert, L., Crosweller, H. S., and Ewert, J. (2013). A statistical analysis of the global historical volcanic fatalities record. J. Appl. Volcanol. 2, 2. doi:10.1186/2191-5040-2-2
BNPB (2019). Tsunami Selat Sunda. BNPB - National Disaster Management Agency https://bnpb.go.id/berita/tsunami-selat-sunda. Accessed October 24, 2020).
Brunet, M., Le Friant, A., Boudon, G., Lafuerza, S., Talling, P., Hornbach, M., et al. (2016). Composition, geometry, and emplacement dynamics of a large volcanic island landslide offshore Martinique: from volcano flank-collapse to seafloor sediment failure?. Geochem. Geophys. Geosyst. 17, 699–724. doi:10.1002/2015GC006034
Clare, M. A., Le Bas, T., Price, D. M., Hunt, J. E., Sear, D., Cartigny, M. J. B., et al. (2018). Complex and cascading triggering of submarine landslides and turbidity currents at volcanic islands revealed from integration of high-resolution onshore and offshore surveys. Front. Earth Sci. 6, 223. doi:10.3389/feart.2018.00223
Deplus, C., Bonvalot, S., Dahrin, D., Diament, M., Harjono, H., and Dubois, J. (1995). Inner structure of the Krakatau volcanic complex (Indonesia) from gravity and bathymetry data. J. Volcanol. Geotherm. Res. 64, 23–52. doi:10.1016/0377-0273(94)00038-I
Deplus, C., Le Friant, A., Boudon, G., Komorowski, J.-C., Villemant, B., Harford, C., et al. (2001). Submarine evidence for large-scale debris avalanches in the Lesser Antilles Arc. Earth Planet Sci. Lett. 192, 145–157. doi:10.1016/S0012-821X(01)00444-7
Giachetti, T., Paris, R., Kelfoun, K., and Ontowirjo, B. (2012). Tsunami hazard related to a flank collapse of Anak Krakatau volcano, Sunda Strait, Indonesia. Geol. Soc. London, Spec. Publ. 361, 79–90. doi:10.1144/SP361.7
Grilli, S. T., Tappin, D. R., Carey, S., Watt, S. F. L., Ward, S. N., Grilli, A. R., et al. (2019). Modelling of the tsunami from the December 22, 2018 lateral collapse of Anak Krakatau volcano in the Sunda Straits, Indonesia. Sci. Rep. 9, 11946. doi:10.1038/s41598-019-48327-6
Hamilton, W. (1979). Tectonics of the Indonesian region, 1078. Washington, DC: United States Government Printing Office.
Harjono, H., Diament, M., Dubois, J., Larue, M., and Zen, M. T. (1991). Seismicity of the Sunda Strait: evidence for crustal extension and volcanological implications. Tectonics 10, 17–30. doi:10.1029/90TC00285
Heidarzadeh, M., Ishibe, T., Sandanbata, O., Muhari, A., and Wijanarto, A. B. (2020). Numerical modeling of the subaerial landslide source of the 22 December 2018 Anak Krakatoa volcanic tsunami, Indonesia. Ocean Eng. 195, 106733. doi:10.1016/j.oceaneng.2019.106733
Huchon, P., and Le Pichon, X. (1984). Sunda Strait and central Sumatra fault. Geology 12, 668. doi:10.1130/0091-7613(1984)12<668:SSACSF>2.0.CO;2
Hunt, J. E., Cassidy, M., and Talling, P. J. (2018). Multi-stage volcanic island flank collapses with coeval explosive caldera-forming eruptions. Sci. Rep. 8, 1146. doi:10.1038/s41598-018-19285-2
Hunt, J. E., and Jarvis, I. (2017). Prodigious submarine landslides during the inception and early growth of volcanic islands. Nat. Commun. 8, 2061. doi:10.1038/s41467-017-02100-3
Jaxybulatov, K., Koulakov, I., Seht, M. I., Klinge, K., Reichert, C., Dahren, B., et al. (2011). Evidence for high fluid/melt content beneath Krakatau volcano (Indonesia) from local earthquake tomography. J. Volcanol. Geotherm. Res. 206, 96–105. doi:10.1016/j.jvolgeores.2011.06.009
Karstens, J., Berndt, C., Urlaub, M., Watt, S. F. L., Micallef, A., Ray, M., et al. (2019). From gradual spreading to catastrophic collapse—reconstruction of the 1888 Ritter Island volcanic sector collapse from high-resolution 3D seismic data. Earth Planet Sci. Lett. 517, 1–13. doi:10.1016/j.epsl.2019.04.009
Keating, B. H. (2000). Island edifice failures and associated tsunami hazards. Pure Appl. Geophys. 157, 899–955. doi:10.1007/s000240050011
Le Friant, A., Boudon, G., Deplus, C., and Villemant, B. (2003). Large-scale flank collapse events during the activity of Montagne Pelée, Martinique, Lesser Antilles. J. Geophys. Res. 108, 2055. doi:10.1029/2001JB001624
Malod, J. A., Karta, K., Beslier, M. O., and Zen, M. T. (1995). From normal to oblique subduction: tectonic relationships between Java and Sumatra. J. Southeast Asian Earth Sci. 12, 85–93. doi:10.1016/0743-9547(95)00023-2
Masson, D., Watts, A., Gee, M. J., Urgeles, R., Mitchell, N., Le Bas, T., et al. (2002). Slope failures on the flanks of the western Canary Islands. Earth Sci. Rev. 57, 1–35. doi:10.1016/S0012-8252(01)00069-1
Moore, J. G., Clague, D. A., Holcomb, R. T., Lipman, P. W., Normark, W. R., and Torresan, M. E. (1989). Prodigious submarine landslides on the Hawaiian Ridge. J. Geophys. Res. 94, 17465. doi:10.1029/JB094iB12p17465
Muhari, A., Heidarzadeh, M., Susmoro, H., Nugroho, H. D., Kriswati, E., Supartoyo, , et al. (2019). The December 2018 Anak Krakatau volcano tsunami as inferred from post-tsunami field surveys and spectral analysis. Pure Appl. Geophys. 176, 5219–5233. doi:10.1007/s00024-019-02358-2
Paris, A., Heinrich, P., Paris, R., and Abadie, S. (2020). The December 22, 2018 Anak Krakatau, Indonesia, landslide and tsunami: preliminary modeling results. Pure Appl. Geophys. 177, 571–590. doi:10.1007/s00024-019-02394-y
Perttu, A., Caudron, C., Assink, J. D., Metz, D., Tailpied, D., Perttu, B., et al. (2020). Reconstruction of the 2018 tsunamigenic flank collapse and eruptive activity at Anak Krakatau based on eyewitness reports, seismo-acoustic and satellite observations. Earth Planet Sci. Lett. 541, 116268. doi:10.1016/j.epsl.2020.116268
Putra, P. S., Aswan, A., Maryunani, K. A., Yulianto, E., Nugroho, S. H., and Setiawan, V. (2020). Post-event field survey of the 22 December 2018 Anak Krakatau tsunami. Pure Appl. Geophys. 177, 2477–2492. doi:10.1007/s00024-020-02446-8
Schumann, K., Stipp, M., Behrmann, J. H., Klaeschen, D., and Schulte-Kortnack, D. (2014). P and S wave velocity measurements of water-rich sediments from the Nankai Trough, Japan. J. Geophys. Res. Solid Earth 119, 787–805. doi:10.1002/2013JB010290
Self, S., and Rampino, M. R. (1981). The 1883 eruption of Krakatau. Nature 294, 699–704. doi:10.1038/294699a0
Susilohadi, S., Gaedicke, C., and Djajadihardja, Y. (2009). Structures and sedimentary deposition in the Sunda Strait, Indonesia. Tectonophysics 467, 55–71. doi:10.1016/j.tecto.2008.12.015
Tibaldi, A., Pasquarè, F. A., Papanikolaou, D., and Nomikou, P. (2008). Discovery of a huge sector collapse at the Nisyros volcano, Greece, by on-land and offshore geological-structural data. J. Volcanol. Geotherm. Res. 177, 485–499. doi:10.1016/j.jvolgeores.2008.06.014
Walter, T. R., Haghshenas Haghighi, M., Schneider, F. M., Coppola, D., Motagh, M., Saul, J., et al. (2019). Complex hazard cascade culminating in the Anak Krakatau sector collapse. Nat. Commun. 10, 4339. doi:10.1038/s41467-019-12284-5
Watt, S. F. L., Talling, P. J., Vardy, M. E., Heller, V., Hühnerbach, V., Urlaub, M., et al. (2012a). Combinations of volcanic-flank and seafloor-sediment failure offshore Montserrat, and their implications for tsunami generation. Earth Planet Sci. Lett. 319–320, 228–240. doi:10.1016/j.epsl.2011.11.032
Watt, S. F. L., Talling, P. J., Vardy, M. E., Masson, D. G., Henstock, T. J., Hühnerbach, V., et al. (2012b). Widespread and progressive seafloor-sediment failure following volcanic debris avalanche emplacement: landslide dynamics and timing offshore Montserrat, Lesser Antilles. Mar. Geol. 323–325, 69–94. doi:10.1016/j.margeo.2012.08.002
Watt, S., Talling, P., and Hunt, J. (2014). New insights into the emplacement dynamics of volcanic island landslides. Oceanography 27, 46–57. doi:10.5670/oceanog.2014.39
Williams, R., Rowley, P., and Garthwaite, M. C. (2019). Reconstructing the Anak Krakatau flank collapse that caused the December 2018 Indonesian tsunami. Geology 47, 973–976. doi:10.1130/G46517.1
Ye, L., Kanamori, H., Rivera, L., Lay, T., Zhou, Y., Sianipar, D., et al. (2020). The 22 December 2018 tsunami from flank collapse of Anak Krakatau volcano during eruption. Sci. Adv. 6, eaaz1377. doi:10.1126/sciadv.aaz1377
Zen, M. (1970). Growth and state of Anak Krakatau in September 1968. Bull. Volcanol. 34, 205–215. doi:10.1007/bf02597786
Keywords: bathymetry, tsunami, flank collapse, shallow seismic, single-channel seismic, Krakatau
Citation: Priyanto WS, Hunt JE, Hanif M, Tappin DR, Permana H, Susilohadi , Cassidy M and Yulianto E (2021) Bathymetry and Shallow Seismic Imaging of the 2018 Flank Collapse of Anak Krakatau. Front. Earth Sci. 8:577448. doi: 10.3389/feart.2020.577448
Received: 29 June 2020; Accepted: 23 November 2020;
Published: 08 January 2021.
Edited by:
Basilios Tsikouras, Universiti Brunei Darussalam, BruneiReviewed by:
Morelia Urlaub, GEOMAR Helmholtz Center for Ocean Research Kiel, GermanyFederico Pasquaré Mariotto, University of Insubria, Italy
Copyright © 2021 Priyanto, Hunt, Hanif, Tappin, Permana, Susilohadi, Cassidy and Yulianto. This is an open-access article distributed under the terms of the Creative Commons Attribution License (CC BY). The use, distribution or reproduction in other forums is permitted, provided the original author(s) and the copyright owner(s) are credited and that the original publication in this journal is cited, in accordance with accepted academic practice. No use, distribution or reproduction is permitted which does not comply with these terms.
*Correspondence: Wisnu S. Priyanto, d2lzbjAwM0BsaXBpLmdvLmlk
 Wisnu S. Priyanto
 James E. Hunt2
 Muhammad Hanif
 David R. Tappin
 Haryadi Permana
 Michael Cassidy